surface roughness effects on microparticle adhesion
TRANSCRIPT
SURFACE ROUGHNESS EFFECTS ONMICROPARTICLE ADHESION
W. ChengP. F. DunnR. M. BrachParticle Dynamics Laboratory, Department of Aerospaceand Mechanical Engineering, University of Notre Dame,Notre Dame, Indiana, USA
A new self-consistent model is developed to treat the static contact of a micro-particle with a flat barrier in the presence of molecular adhesion and surfaceroughness. Separation between their mean datum planes is modeled consideringthe elastic deformation of the microparticle and surface. The contact pressure iscomputed from the Lennard-Jones law following the Derjaguin approximation.The elastic deflection of the mean datum plane is calculated from the effectivepressure by the half-space elastic theory. Roughness is modeled by introducing aGaussian distribution to the gap between the surfaces. An effective pressure isdefined as the statistical average of the contact pressure over the roughnessheights. A solution satisfying all of the above conditions gives a self-consistentmethod of modeling adhesion between the microparticle and the flat barrier. Usingcollocation methods the equations are discretized as a large system of nonlinearalgebraic equations. A continuation method is used to find the multiple numericalsolutions for the mean separation and the effective contact pressure. Finally,adhesive contacts of both smooth and rough surfaces are simulated in a com-parative manner to elucidate the features of surface roughness in the presence ofmolecular adhesion. The standard deviation of the Gaussian distribution is usedas a parameter to assess the effects of roughness on the pull-off force. It is shownthat increasing surface roughness significantly reduces the pull-off force anddecreases the tendency for the microsphere to snap-on and snap-off.
Keywords: Microparticles; Adhesion; Contact forces; Surface roughness; Contactdeformation; Snap-off
Received 8 November 2001; in final form 9 May 2002.This research was supported in its early stage by the Center for Indoor Air Research
(Contract No. 96-06) and the Electric Power Research Institute (Contract No. RP 8034-03).Address correspondence to R. M. Brach, Department of Aerospace Engineering,
Room 105 Hessert Center, University of Notre Dame, Notre Dame, IN 46556-5637, USA.E-mail: [email protected]
The Journal of Adhesion, 78: 929–965, 2002
Copyright # 2002 Taylor & Francis
0021-8464/02 $12.00 +.00
DOI: 10.1080/00218460290010584
929
INTRODUCTION
The modeling of microparticle adhesion has direct relevence to manyengineering applications. Examples include those involving dry fric-tion, fine particle agglomeration and separation, and microforcemeasurements such as those using the surface force apparatus, atomicforce microscope, etc. [1]. More recent applications now can be found inMicro-Electro-Mechanical Systems (MEMS) and nanotechnology.
Adhesion between dry surfaces in contact with one another usuallyis modeled in continuum mechanics through the surface energy or thework of adhesion in separating adhering surfaces. Various adhesionmodels and hypotheses have been developed. These are summarized inthe following in order to place the present study in proper context.
Modeling of Adhesion for Smooth Surfaces
As early as 1932, Bradley [2] found that the force of adhesion betweentwo rigid spheres with radii R1 and R2 is 2pRg, where R is theequivalent radius R1R2
R1þR2and g is the combined surface energy,
g ¼ g1 þ g2 � g1g2. Derjaguin [3] found the same result from the Der-jaguin approximation, assuming that the unit interaction energybetween infinitesimal areas of solids is the same as the energy per unitarea between half-infinite solids. For elastic spheres, two majormodels were developed, namely the JKR model [4] and the DMT model[5]. The JKR model modifies the Hertzian theory by considering theadhesion between surfaces within the contact region. The model wasderived from the conservation of elastic energy, mechanical potentialenergy, and later using Griffith surface energy following a fracturemechanics approach. The DMT model assumed that adhesion actedoutside the Hertzian contact region. The two models were seeminglycontradictory until Tabor [6] suggested that they describe two oppositeextremes of Tabor’s parameter, m. This parameter is the ratio of theelastic displacement of the surface at the point of separation (pull-off)to the effective range of surface forces characterized by the ‘‘equili-brium spacing,’’ E, at which intermolecular forces vanish:
m ¼ Rg2
E2E3
� �1=3
: ð1Þ
E is the combined elastic modulus of the microparticles, where
1
E¼ 1 � n1
2
E1þ 1 � n2
2
E2: ð2Þ
930 W. Cheng et al.
E1 and E2 are Young’s modulus and n1 and n2 are the Poisson’s ratiosfor the two contacting surfaces.
After Tabor’s suggestion, Muller et al. [7] conducted a pioneeringnumerical simulation using a self-consistent model. Their model istermed ‘‘self-consistent’’ because the surface stress is coupled mathe-matically with the elastic deformation of the contacting surfaces. Thesurface tensile stress computed from the Lennard-Jones potential isused to calculate the elastic deformation of the surfaces. The surfacedeformation changes the molecular separation between surfaces, andthe change of separation in turn changes the surface tensile stressaccording to the Lennard-Jones law. The solution considering all thesefactors satisfies both the Lennard-Jones law and the elastic deforma-tion. The results of Muller et al. showed the continuous transitionfrom the DMT model to the JKR model with increasing Tabor para-meter values. This work was followed by a series of computational andanalytical studies. Maugis [8] offered insight into the DMT-JKRtransition through an analytical study using a Dugdale model. TheMaugis-Dugdale theory gives an analytical description of the DMT-JKR transition. However, the Dugdale model is approximate in that itassumes that the surface force is a constant up to a maximumseparation beyond which it decreases to zero. Multiple solutions arepossible as long as they produce the same surface energy.
The Lennard-Jones model captures some unique features. Attardand Parker [9] performed a numerical study using the Lennard-Jonesmodel. Unfortunately, because of a singularity in an integral, anonmonotonic trend of pull-off force was found as Tabor’s parameterwas increased. The first detailed computation based on the Lennard-Jones model was done by Greenwood [10]. He repeated the computa-tions done by Muller et al. [7] with more numerical accuracy and ingreater detail. He found that the load-approach curves exhibited ‘‘S-shaped’’ inflections for values of Tabor’s parameter larger than one,leading to snap-on and snap-off during contact. Recently, Feng [11]demonstrated a more reliable numerical method in finding multiplenumerical solutions for the external load and displacement relation-ship. The snap-on and snap-off procedure during adhesive contact wasdescribed accurately. The studies of Muller et al. [7], Maugis [8], andGreenwood [10] collectively have led to a rigorous theory based on theself-consistent model using the Lennard-Jones force law and the half-space elastic deformation. Guided by these results, Johnson andGreenwood [12] constructed an adhesion map for the contact of elasticspheres showing valid regions for various adhesion models. It now iscommonly accepted that the existing adhesion models for perfectlysmooth elastic spheres can be set in the framework of two parameters
Roughness Effects on Microparticle Adhesion 931
and one limit: the external load ratio, P, Tabor’s parameter, m, and thelimit to remain in the elastic range. The magnitude of the pull-offforce, Pc, varies from the DMT value, 2pgR, for m < 0:1 to the JKRvalue, 3
2pgR, for m > 5. The seemingly contradictory models have beenshown to have a common basis using the Lennard-Jones law.
The Role of Surface Roughness
Even though adhesion is well described mathematically by a self-consistent model that couples the intermolecular forces with elasticdeformation, the model is limited to smooth surfaces. It has long beenrealized that surface roughness significantly reduces adhesion in realcontact (see Krupp [13], Sharpe [14], Tabor [6], and Johnson [15]).Effects on large spheres were observed and measured (see Fuller andTabor [16]). Effects of roughness on adhesion have been observed inatomic force microscopy measurement (see Schaefer et al. [17], Mizes[18], Briscoe et al. [19], and Rabinovich et al. [20]) and in flow-inducedparticle detachment experiments (see Reeks et al. [21] and Soltani andAhmadi [22]). Modeling of the effects of surface roughness is crucial inmany problems. For example, in microparticle resuspension it hasbeen realized that a rolling resistance model that does not considersurface roughness underestimates the microparticle detachment ratesignificantly. In order to match the experimental data, roughnesseffects must be included in the adhesion model (see Ingham and Yan[23] and Ziskind et al. [24]).
Existing adhesion models can be extended to consider rough surfacecontact. Rough surfaces are modeled by superposition of sphericalasperities. Adhesive contact of a single asperity with a flat surface (ora large sphere) is modeled by the JKR or DMT theory. The adhesion ofsingle asperities can be integrated to get the total adhesion force thatresults from multiple asperities (see Johnson [15], Ziskind et al. [24],Greenwood and Tripp [25] and Majumdar and Bhushan [26]). How-ever, because of the nonlinearity of the problem, simple superpositionmay not be appropriate. Real adhesive contact with rough surfacesalso involves overlapping contact areas due to neighboring asperitiesand possibly multiple snap-on and snap-off events for individualasperities. At present, it is impossible to include the effects of multiplesnap-on and snap-off for each individual asperity summit. So, modelsbased on single asperity contact are restricted to rough surfaces withsparse asperities such that single asperities are separated by longdistances and do not interfere each other.
Computations in this paper are inspired by the pioneering work ofGreenwood and Tripp [25] on pure elastic contacts of rough surfaces.
932 W. Cheng et al.
Greenwood and Tripp describe a rough surface as a series of hemi-spherical asperities with the same radii. The heights are assumed tofollow a Gaussian distribution. Even though asperities on real sur-faces can have any shape and any height distribution, there are rea-sons to justify their assumptions. According to the description ofGreenwood and Williamson [27], there is a tendency for the heights tofollow a Gaussian distribution about the mean surface. Studies alsoindicate that the essential behavior of elastic contact is determinedprimarily by the asperity height and secondarily by the shape of theasperities (see Greenwood [28]). By describing surface topologythrough probability distribution functions, the effects of roughness onelastic contacts can be analyzed statistically in a systematic manner.
This article presents a new method that introduces randomness tothe pressure distribution of the self-consistent model of a single con-tact presented by Greenwood and Tripp [25] and later enhanced byGreenwood [10]. In the new model, instead of assuming multiplespherical asperities, the gap between a single contact of two spheres isperturbed with a statistical distribution that is a function of the con-tact radius. A Gaussian distribution is used in this paper, but othersare possible. According to the Greenwood-Tripp model, separationbetween the mean datum planes of the contacting rough surfaces iscomputed by considering the elastic deformation caused by the contactpressure. With the statistical perturbation, an effective pressure iscalculated as the statistical average of the Lennard-Jones forces overthe random surface heights. Using collocation methods, the discretegoverning equation becomes a large system of nonlinear algebraicequations. Then matrix-inverse-free path-following and pseudo arc-length methods are used to find multiple numerical solutions. Finally,both adhesive contacts of smooth and rough surfaces are simulated ina comparative manner to elucidate the salient features of surfaceroughness in the presence of molecular adhesion. The method gen-erates detailed results on rough surface deformation and surfacepressure during the contact. Results show that surface roughness cancause significant changes in the average properties of pull-off and inthe status of snap-on and snap-off.
DESCRIPTION OF SURFACE ROUGHNESS
The first step in the modeling of rough surface adhesion is to define thesurface roughness. It has been realized that surface complexity has awide range of scales in height and spatial distributions. A rough sur-face can have a surface variation larger in size than the local contactspots, microscopic surface irregularities the same size as the contact
Roughness Effects on Microparticle Adhesion 933
spots, and submicrometer and nanometer roughness, which has ascale much smaller than the contact spot or local asperity curvature.Therefore, real contact is a multiscale problem. Even if the tre-mendous computational difficulties can be handled, at present it still isimpossible to include all scales to get meaningful conclusions.
This work considers a surface having submicrometer and nano-meter-scale roughness. Effectively, the roughness scale is muchsmaller than the typical radii of micrometer-size particles. Theroughness can be assumed to be spatially homogenous. Therefore, therelative shape of the rough microparticle and the rough flat barrier isdescribed as a smooth sphere superposed with random perturbations(Johnson [29]). The smooth sphere denotes the mean datum plane andthe random perturbations are refered to as roughness heights. Evi-dence shows that surface roughness heights follow a Gaussian dis-tribution about the mean surface (see Greenwood and Williamson[27]). If the roughness height about the mean surface is s, then theprobability distribution of s is
fðsÞ ¼ 1
ss
ffiffiffiffiffiffi2p
p e� s2
2s2s ; ð3Þ
where s2s is the variance of roughness heights. Even though a Gaus-
sian distribution is assumed, a real distribution can be used easily inthe methods introduced in this paper. Using the above assumptions,an expression for the separation between two contacting sphericalmicroparticles, or a microparticle and a flat barrier and its relation-ship with the statistical average contact pressure, can be derived.
THE MATHEMATICAL THEORY
According to the half-space theory, for a given axisymmetric normalsurface traction, pðrÞ, the normal surface deflection, wðrÞ, can beestimated by the following equation (see Johnson [29]):
wðrÞ ¼ 4
pE
Z 1
0
t
t þ rpðtÞKðkÞdt; ð4Þ
where r is the radial coordinate. Equation (4) is derived by assumingthat surfaces are frictionless or made of similar material (the sameassumption also is used for Hertzian theory). The combined elasticmodulus, E, is defined in Equation (2). KðkÞ ¼ Fð1
2pjk2Þ is the completeelliptic integral of the first kind, and k2 ¼ 4tr
ðtþrÞ2. In the present model,
the contacting surfaces never really touch. The Lennard-Jones force
934 W. Cheng et al.
law is used to model the tensile stress, s, between two bodies sepa-rated by a distance function, h (see Greenwood [10]):
sðhÞ ¼ 8g3E
Eh
� �3� E
h
� �9� �
; ð5Þ
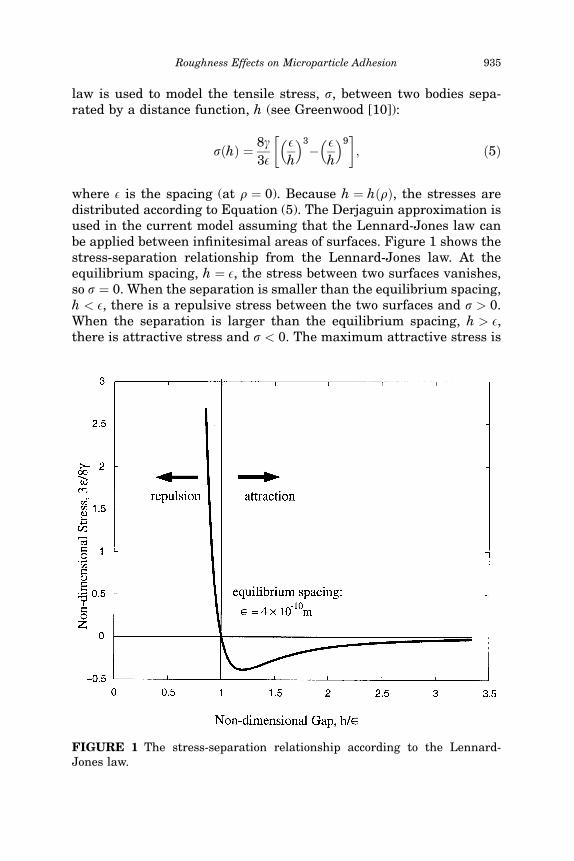
where E is the spacing (at r ¼ 0). Because h ¼ hðrÞ, the stresses aredistributed according to Equation (5). The Derjaguin approximation isused in the current model assuming that the Lennard-Jones law canbe applied between infinitesimal areas of surfaces. Figure 1 shows thestress-separation relationship from the Lennard-Jones law. At theequilibrium spacing, h ¼ E, the stress between two surfaces vanishes,so s ¼ 0. When the separation is smaller than the equilibrium spacing,h < E, there is a repulsive stress between the two surfaces and s > 0.When the separation is larger than the equilibrium spacing, h > E,there is attractive stress and s < 0. The maximum attractive stress is
FIGURE 1 The stress-separation relationship according to the Lennard-Jones law.
Roughness Effects on Microparticle Adhesion 935
16g9ffiffi3
pE
when the separation is h ¼ 316E. The separation between two infi-
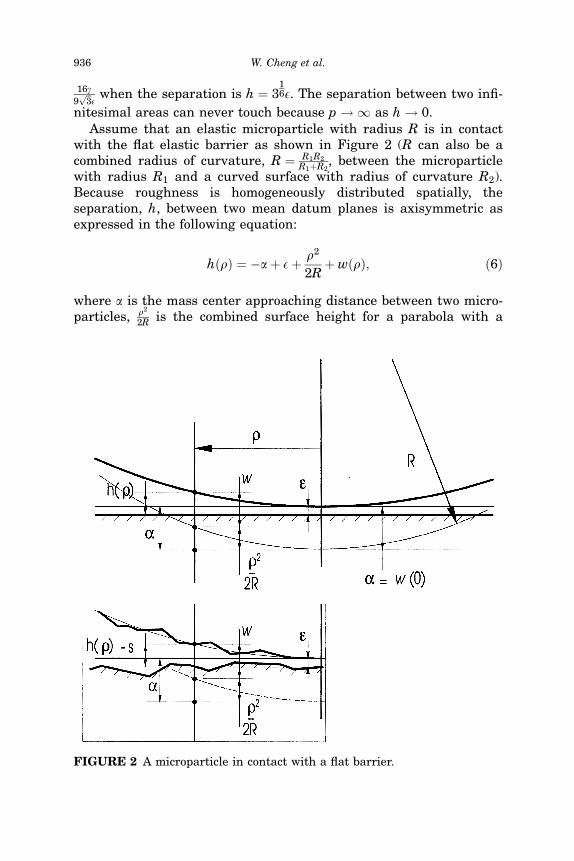
nitesimal areas can never touch because p ! 1 as h ! 0.Assume that an elastic microparticle with radius R is in contact
with the flat elastic barrier as shown in Figure 2 (R can also be acombined radius of curvature, R ¼ R1R2
R1þR2, between the microparticle
with radius R1 and a curved surface with radius of curvature R2).Because roughness is homogeneously distributed spatially, theseparation, h, between two mean datum planes is axisymmetric asexpressed in the following equation:
hðrÞ ¼ �aþ Eþ r2
2Rþ wðrÞ; ð6Þ
where a is the mass center approaching distance between two micro-particles, r2
2R is the combined surface height for a parabola with a
FIGURE 2 A microparticle in contact with a flat barrier.
936 W. Cheng et al.
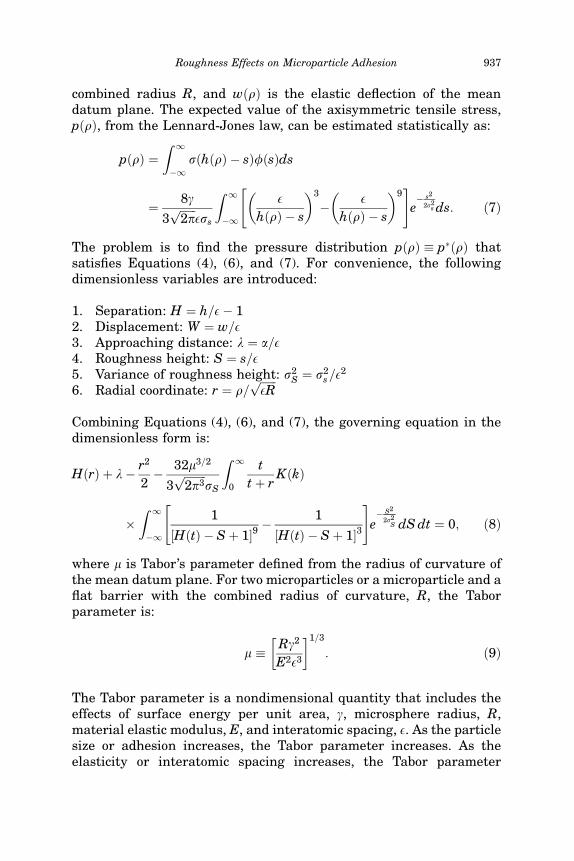
combined radius R, and wðrÞ is the elastic deflection of the meandatum plane. The expected value of the axisymmetric tensile stress,pðrÞ, from the Lennard-Jones law, can be estimated statistically as:
pðrÞ ¼Z 1
�1sðhðrÞ � sÞfðsÞds
¼ 8g
3ffiffiffiffiffiffi2p
pEss
Z 1
�1
EhðrÞ � s
� �3
� EhðrÞ � s
� �9" #
e� s2
2s2s ds: ð7Þ
The problem is to find the pressure distribution pðrÞ p�ðrÞ thatsatisfies Equations (4), (6), and (7). For convenience, the followingdimensionless variables are introduced:
1. Separation: H ¼ h=E� 12. Displacement: W ¼ w=E3. Approaching distance: l ¼ a=E4. Roughness height: S ¼ s=E5. Variance of roughness height: s2
S ¼ s2s=E
2
6. Radial coordinate: r ¼ r=ffiffiffiffiffiffiER
p
Combining Equations (4), (6), and (7), the governing equation in thedimensionless form is:
HðrÞ þ l� r2
2� 32m3=2
3ffiffiffiffiffiffiffiffi2p3
psS
Z 1
0
t
t þ rKðkÞ
�Z 1
�1
1
½HðtÞ � S þ 1�9
"� 1
½HðtÞ � S þ 1�3
#e� S2
2s2S dS dt ¼ 0; ð8Þ
where m is Tabor’s parameter defined from the radius of curvature ofthe mean datum plane. For two microparticles or a microparticle and aflat barrier with the combined radius of curvature, R, the Taborparameter is:
m Rg2
E2E3
� �1=3
: ð9Þ
The Tabor parameter is a nondimensional quantity that includes theeffects of surface energy per unit area, g, microsphere radius, R,material elastic modulus, E, and interatomic spacing, E. As the particlesize or adhesion increases, the Tabor parameter increases. As theelasticity or interatomic spacing increases, the Tabor parameter
Roughness Effects on Microparticle Adhesion 937
decreases. So, for example, a large flexible (soft) particle will have alarge value of the Tabor parameter and a small, hard particle will havea small value of the Tabor parameter.
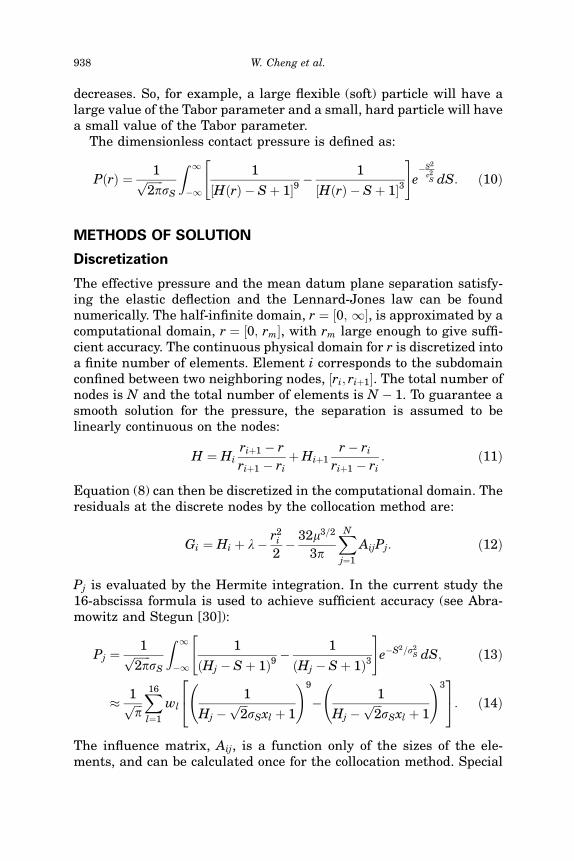
The dimensionless contact pressure is defined as:
PðrÞ ¼ 1ffiffiffiffiffiffi2p
psS
Z 1
�1
1
½HðrÞ � S þ 1�9� 1
½HðrÞ � S þ 1�3
" #e�S2
s2S dS: ð10Þ
METHODS OF SOLUTION
Discretization
The effective pressure and the mean datum plane separation satisfy-ing the elastic deflection and the Lennard-Jones law can be foundnumerically. The half-infinite domain, r ¼ ½0; 1�, is approximated by acomputational domain, r ¼ ½0; rm�, with rm large enough to give suffi-cient accuracy. The continuous physical domain for r is discretized intoa finite number of elements. Element i corresponds to the subdomainconfined between two neighboring nodes, ½ri; riþ1�. The total number ofnodes is N and the total number of elements is N � 1. To guarantee asmooth solution for the pressure, the separation is assumed to belinearly continuous on the nodes:
H ¼ Hiriþ1 � r
riþ1 � riþ Hiþ1
r � ri
riþ1 � ri: ð11Þ
Equation (8) can then be discretized in the computational domain. Theresiduals at the discrete nodes by the collocation method are:
Gi ¼ Hi þ l� r2i
2� 32m3=2
3p
XNj¼1
AijPj: ð12Þ
Pj is evaluated by the Hermite integration. In the current study the16-abscissa formula is used to achieve sufficient accuracy (see Abra-mowitz and Stegun [30]):
Pj ¼1ffiffiffiffiffiffi
2pp
sS
Z 1
�1
1
ðHj � S þ 1Þ9� 1
ðHj � S þ 1Þ3
" #e�S2=s2
S dS; ð13Þ
� 1ffiffiffip
pX16
l¼1
wl1
Hj �ffiffiffi2
psSxl þ 1
!9
� 1
Hj �ffiffiffi2
psSxl þ 1
!324
35: ð14Þ
The influence matrix, Aij, is a function only of the sizes of the ele-ments, and can be calculated once for the collocation method. Special
938 W. Cheng et al.
treatment for singular elements and the numerical method for theelliptic integral of the first kind can be found in Feng [11]. Thequantities xl and wl (l ¼ 1;2; . . . ; 16) are the abscissas and weightfactors for Hermite integration. The physical meaning of Hi is theseparation between the mean datum planes of the two contactingsurfaces at the ith grid node. By the collocation method, the residualsat grid nodes defined in Equation (12) are equal to zero. Theunknowns, Hi, then are determined by solving the system of Nequations, Gi ¼ 0; i ¼ 1;2; . . . ;N.
Numerical Procedure
Solutions for Equation (12) are determined by two parameters: Tabor’sparameter, m, and the variance of the surface roughness heights, sS.For a given set of m and sS, the separation vector, H, is a function of theapproach distance, l. Therefore, the nonlinear equation can berewritten as a nonlinear eigenvalue problem:
GðH; lÞ ¼ 0; G : R � RN ! RN ; ð15Þ
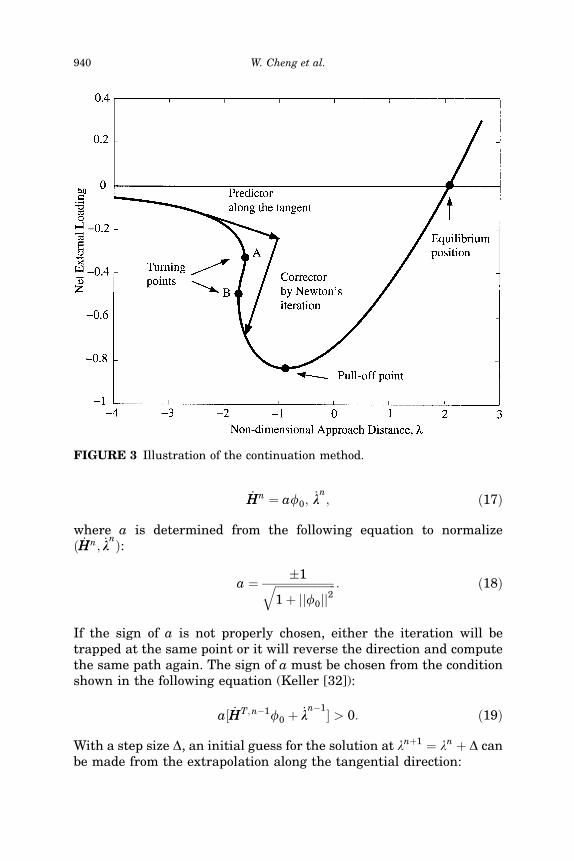
where H ¼ ðH1;H2; . . . ;HNÞT is the vector of unknowns andG ¼ ðG1;G2; . . . ;GNÞT is the vector of residuals. The solution path ofEquation (15) can be found by the natural continuation method using las a natural continuation parameter. The initial point ðH0; l0Þ must befound at the beginning of the procedure. Usually, the extreme solutionat a very large separation between the microparticle and the flatbarrier (l � 0) can be found easily and adopted as the initial point.The natural continuation method repeats two steps as illustrated inFigure 3:
� predictor step predicts a solution along the tangent of the solutionpath by linear extrapolation (or Taylor expansion); and
� corrector step finds a point approximately on the solution curveand close to the predicted point, in the current simulation, byNewton-Raphson steps (Press et al. [31]).
Suppose that the solution at the nth step ðHn; lnÞ has been found.The above two steps are used to find the solution ðHnþ1; lnþ1Þ at lnþ1.In the predictor step, the tangent of the solution path at point ðHn; lnÞis found first from the following equation:
GnHf0 ¼ �Gn
l ð16Þ
and
Roughness Effects on Microparticle Adhesion 939
_HHn ¼ af0;_lln; ð17Þ
where a is determined from the following equation to normalizeð _HHn; _ll
nÞ:
a ¼ �1ffiffiffiffiffiffiffiffiffiffiffiffiffiffiffiffiffiffiffiffiffiffi1 þ jjf0jj
2q : ð18Þ
If the sign of a is not properly chosen, either the iteration will betrapped at the same point or it will reverse the direction and computethe same path again. The sign of a must be chosen from the conditionshown in the following equation (Keller [32]):
a½ _HHT;n�1f0 þ _lln�1� > 0: ð19Þ
With a step size D, an initial guess for the solution at lnþ1 ¼ ln þ D canbe made from the extrapolation along the tangential direction:
FIGURE 3 Illustration of the continuation method.
940 W. Cheng et al.
Hnþ1 ¼ Hn þ D _HHn: ð20Þ
In the corrector step, the Newton-Raphson method is used to find theaccurate neighboring solution:
Hnþ1 ¼ Hnþ1 þ dH; ð21Þ
where dH is the solution of the linearized equation
Gnþ1H dH ¼ �Gnþ1; ð22Þ
where GH is the Jacobian of the residual, G, to the separation, H:
GH ¼ @G
@H: ð23Þ
The Jacobian, GH, is evaluated using the value of H derived in theprevious iteration. The method has a quadratic convergence. Theiteration stops when the relative error, dHTdH þ ðdlÞ2, is less than atolerance (10�15).
In Equations (16) and (22) the inverse of the Jacobian, GH, is neededwhen finding the tangent of the solution path and the correction termsfor the Newton-Raphson iteration. Therefore, natural continuationworks only for regular points at which the inverse of the Jacobianexists. However, l involves an additional bifurcation parameter;multiple solutions may exist at certain values of l. The points A and Bshown in Figure 3 represent two turning points. They are simplesingular points at which the Jacobian, GH, is singular. Between pointsA and B, with the same value of l, multiple solutions exist for H. Thesolution branch between A and B is unstable. The unstable solutioncan be used to explain the snap-on and snap-off behavior in adhesivecontact. In order to find the whole solution path, including theunstable branch, a special technique to find solutions with a singularJacobian is required. For a multiple solution problem such as this one,an addition parameter must be introduced to unfold the solution pathabout the turning points so that continuation methods can still beused. One possible parameter is the arc length. For the convenience ofcomputation, a pseudo arc length is used instead when the value of thearc length is small. The main idea of pseudo arc length continuation isto drop the natural parameter, l, and use the pseudo arc length as anew parameter to unfold the solution path. A calculated regular pointon the solution path is ðHn; lnÞ. The tangent of the solution path at thispoint is ð _HHn; _llnÞ. The following equation describes a plane perpendi-cular to the tangent ð _HHn; _llnÞ at a distance D from ðHn; lnÞ:
Roughness Effects on Microparticle Adhesion 941
QðHnþ1; lnþ1;DÞ ¼ _HHT;nðHnþ1 � HnÞ þ _llnðlnþ1 � lnÞ � D: ð24Þ
The plane described by Equation (24) intersects the solution path, G, ifD and the curvature of G are not large. The intersection point is thesolution for the next step. Using Newton’s method, this leads to a newlinear system:
GnH Gn
l
_HHT;n _ll
n
!dH
dl
� �¼ � Gn
Qn
� �; ð25Þ
and the iterations are Hnþ1 ¼ Hn þ dH and lnþ1 ¼ ln þ dl. It is easy to
prove that at the turning points GH is singular but�
GnH
Gnl
_HHT;n _lln
�is not
singular (see Keller [32]). Therefore, by introducing the equation forthe pseudo arc length, turning points can be passed and the wholesolution path can be found.
The natural continuation or pseudo arc length continuation stepsare chosen depending on the value of _ll. Since _ll ¼ 0 at the turningpoint, it is reasonable to switch to pseudo arc-length continuationwhen _ll < 0:5. Once the turning point is passed, _ll increases again andthe natural continuation is switched back.
To achieve an adequate accuracy, a large number of nodes is needed.Therefore, Equations (22) and (23) are large systems of linear equa-tions. It is computationally unbearable in time to find their solutionsby Gaussian elimination methods. A more efficient standard Gen-eralized Minimum Residual (GMRES) iteration method is adoptedinstead. Because the inverse of the matrix is not needed in theGMRES method, the procedure is called a matrix inverse-free con-tinuation method. The approach used in this paper is very efficient.The computation time for the whole solution path is in a PC time scale.
RESULTS AND COMPARISONS
Feng [11] showed that the upper limit of the computational domain,r1, can be set at 10 for smooth spherical contact. Results in the cur-rent study show that this value is also adequate for rough surfacecontact. To improve computational accuracy and efficiency, the nodesare unevenly distributed over the computational domain. The totalnumber of evenly-distributed nodes are Ne ¼ 501. Extra nodes areadded near the regions where H and P change significantly. The totalnumber of nodes for most cases is N ¼ 531. Both smooth and roughcontacts are simulated in a comparative manner to elucidate the
942 W. Cheng et al.
salient features of surface roughness in the presence of molecularadhesion.
Results for Smooth Surfaces
The dimensionless net external load, F, is defined by the equation
F ¼ 8
3
Z r1
0
PðrÞr dr: ð26Þ
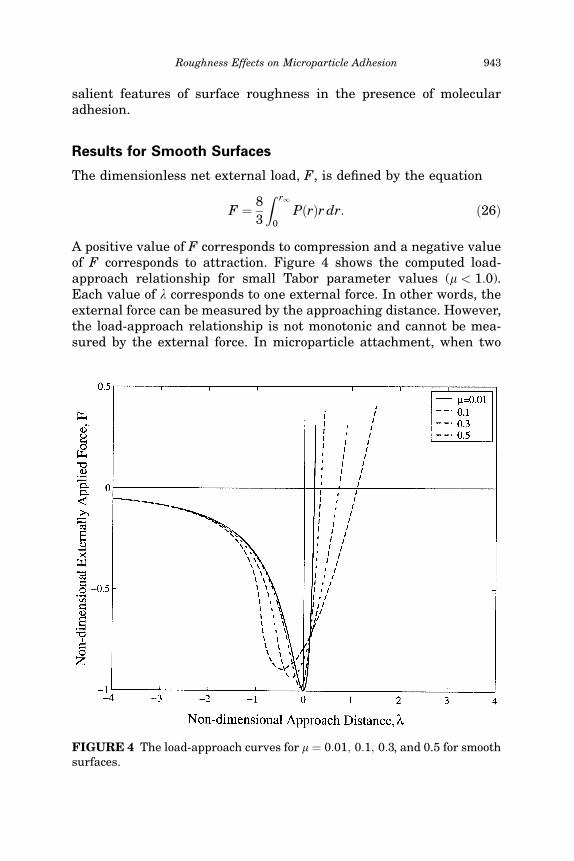
A positive value of F corresponds to compression and a negative valueof F corresponds to attraction. Figure 4 shows the computed load-approach relationship for small Tabor parameter values (m < 1:0).Each value of l corresponds to one external force. In other words, theexternal force can be measured by the approaching distance. However,the load-approach relationship is not monotonic and cannot be mea-sured by the external force. In microparticle attachment, when two
FIGURE 4 The load-approach curves for m ¼ 0:01; 0:1; 0:3, and 0.5 for smoothsurfaces.
Roughness Effects on Microparticle Adhesion 943
surfaces are separated by a relatively large distance (l � 0) the netexternal load is attraction. The attraction and the approach increasewhen the surfaces become closer. The attraction force reaches its peakat a certain distance, lp. The force, Fp, at l ¼ lp is defined as the pull-off force. For very small Tabor parameter values (m < 0:1), lp is nearzero. The value of lp decreases when m increases. The pull-off force forsmall Tabor parameter values is approximately equal to 1 scaled by2pgR, which is the value from the DMT theory. An extreme case iswhen m ¼ 0, for which the pull-off force and the correspondingseparation can be found directly according to Equation (8)
HðrÞ ¼ �lþ r2
2¼ 0: ð27Þ
Substituting Equation (27) into Equations (26) and (10) gives the fol-lowing expression for the external force as m ¼ 0 (see Feng [11]):
F ¼ 1 � 4ð1 � lÞ6
3ð1 � lÞ8: ð28Þ
Thus, for m ¼ 0 the pull-off force is �1 at lp ¼ 0. Figure 4 shows thatwhen m is very small the solution on Fp and lp agrees with theasymptotical solution for m ¼ 0. When the approach increases further,the external force begins to increase again. At the equilibrium posi-tion, which corresponds to the approach, le, the net external forcevanishes. The equilibrium approach distance for m ¼ 0 is le ¼ 1 � 2�1=3
from Equation (28). The equilibrium approach for m ¼ 0:01 isapproximately 0:206, which is very close to the value for m ¼ 0. Whenthe contacting surfaces approach each other further (l > le), the netexternal force changes to compression (F > 0) and increases rapidlybecause of elastic deformation and the Lennard-Jones model. Theeffect of intermolecular adhesion becomes more significant whenm � 1:0.
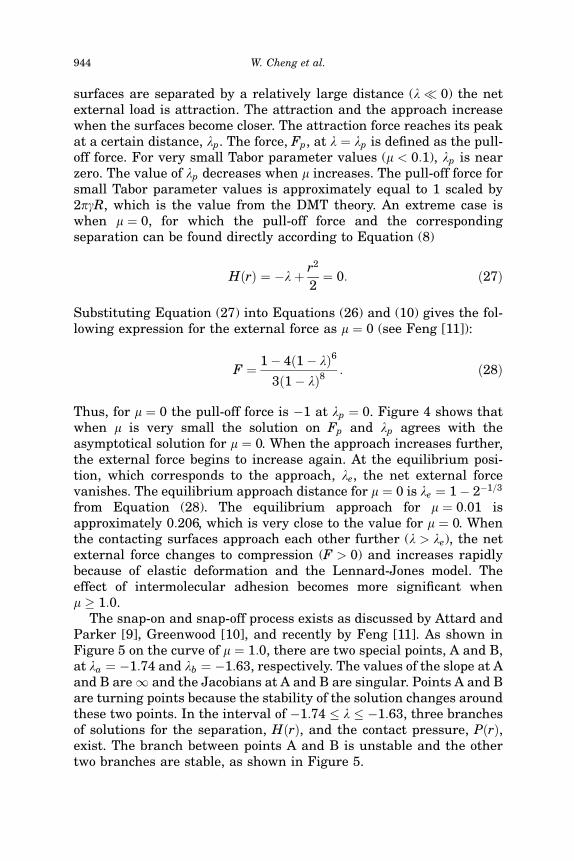
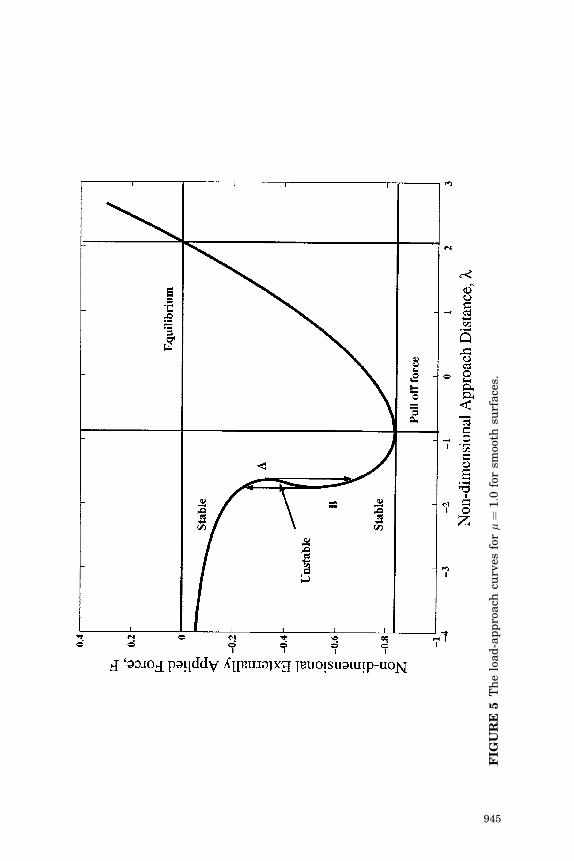
The snap-on and snap-off process exists as discussed by Attard andParker [9], Greenwood [10], and recently by Feng [11]. As shown inFigure 5 on the curve of m ¼ 1:0, there are two special points, A and B,at la ¼ �1:74 and lb ¼ �1:63, respectively. The values of the slope at Aand B are 1 and the Jacobians at A and B are singular. Points A and Bare turning points because the stability of the solution changes aroundthese two points. In the interval of �1:74 � l � �1:63, three branchesof solutions for the separation, HðrÞ, and the contact pressure, PðrÞ,exist. The branch between points A and B is unstable and the othertwo branches are stable, as shown in Figure 5.
944 W. Cheng et al.
FIG
UR
E5
Th
elo
ad
-ap
pro
ach
curv
esfo
rm¼
1:0
for
smoo
thsu
rface
s.
945
In microparticle attachment, F decreases continuously duringapproach as l increases (the two surfaces become closer). At l ¼ la
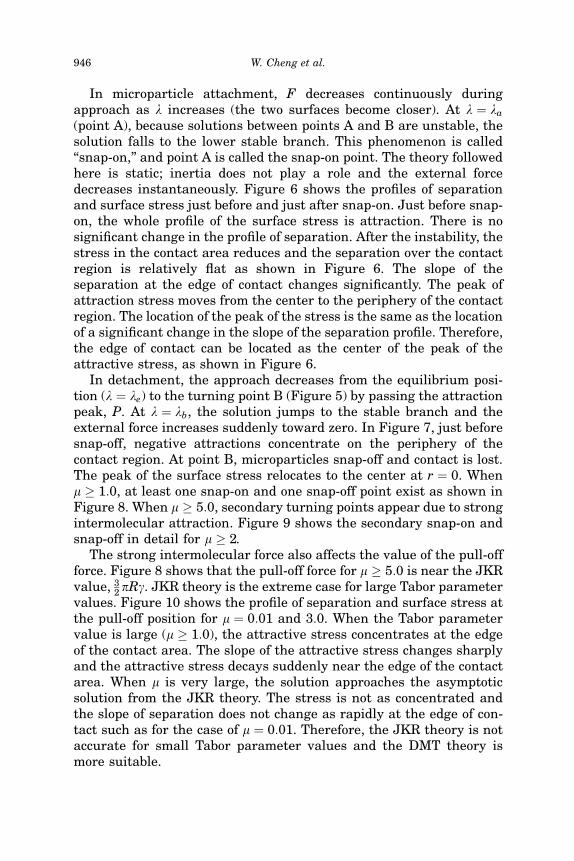
(point A), because solutions between points A and B are unstable, thesolution falls to the lower stable branch. This phenomenon is called‘‘snap-on,’’ and point A is called the snap-on point. The theory followedhere is static; inertia does not play a role and the external forcedecreases instantaneously. Figure 6 shows the profiles of separationand surface stress just before and just after snap-on. Just before snap-on, the whole profile of the surface stress is attraction. There is nosignificant change in the profile of separation. After the instability, thestress in the contact area reduces and the separation over the contactregion is relatively flat as shown in Figure 6. The slope of theseparation at the edge of contact changes significantly. The peak ofattraction stress moves from the center to the periphery of the contactregion. The location of the peak of the stress is the same as the locationof a significant change in the slope of the separation profile. Therefore,the edge of contact can be located as the center of the peak of theattractive stress, as shown in Figure 6.
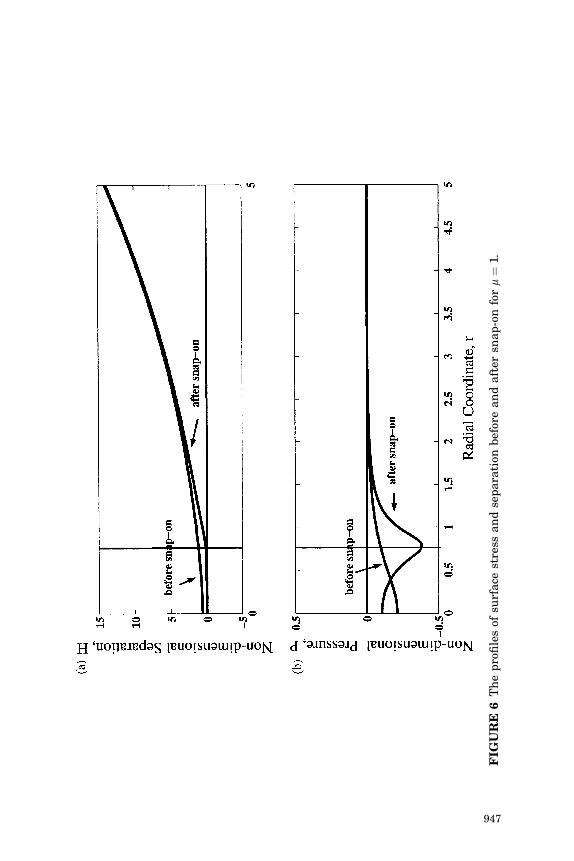
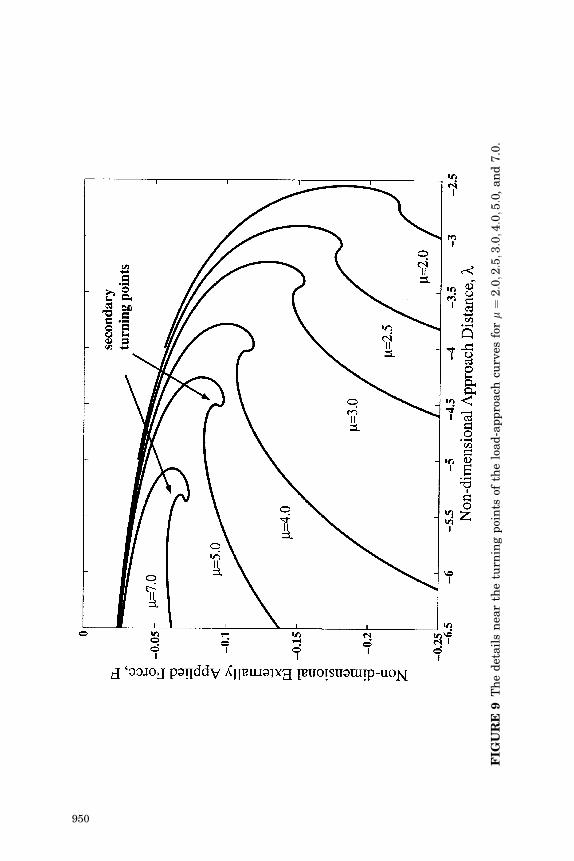
In detachment, the approach decreases from the equilibrium posi-tion (l ¼ le) to the turning point B (Figure 5) by passing the attractionpeak, P. At l ¼ lb, the solution jumps to the stable branch and theexternal force increases suddenly toward zero. In Figure 7, just beforesnap-off, negative attractions concentrate on the periphery of thecontact region. At point B, microparticles snap-off and contact is lost.The peak of the surface stress relocates to the center at r ¼ 0. Whenm � 1:0, at least one snap-on and one snap-off point exist as shown inFigure 8. When m � 5:0, secondary turning points appear due to strongintermolecular attraction. Figure 9 shows the secondary snap-on andsnap-off in detail for m � 2.
The strong intermolecular force also affects the value of the pull-offforce. Figure 8 shows that the pull-off force for m � 5:0 is near the JKRvalue, 3
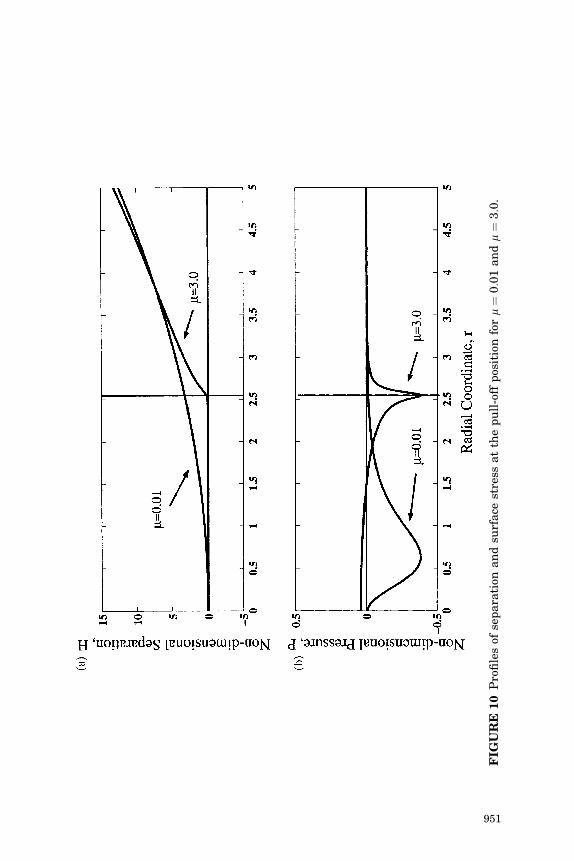
2pRg. JKR theory is the extreme case for large Tabor parametervalues. Figure 10 shows the profile of separation and surface stress atthe pull-off position for m ¼ 0:01 and 3:0. When the Tabor parametervalue is large (m � 1:0), the attractive stress concentrates at the edgeof the contact area. The slope of the attractive stress changes sharplyand the attractive stress decays suddenly near the edge of the contactarea. When m is very large, the solution approaches the asymptoticsolution from the JKR theory. The stress is not as concentrated andthe slope of separation does not change as rapidly at the edge of con-tact such as for the case of m ¼ 0:01. Therefore, the JKR theory is notaccurate for small Tabor parameter values and the DMT theory ismore suitable.
946 W. Cheng et al.
FIG
UR
E6
Th
ep
rofi
les
ofsu
rface
stre
ssan
dse
para
tion
bef
ore
an
daft
ersn
ap
-on
form¼
1.
947

FIG
UR
E7
Th
ep
rofi
les
ofsu
rface
stre
ssan
dse
para
tion
bef
ore
an
daft
ersn
ap
-off
form¼
1.
948
FIG
UR
E8
Th
elo
ad
-ap
pro
ach
curv
esfo
rm¼
1:0;2:0;2:5;3:0;4:0;5:0
,an
d7.0
an
dd
etail
sn
ear
the
turn
ing
poi
nts
.
949
FIG
UR
E9
Th
ed
etail
sn
ear
the
turn
ing
poi
nts
ofth
elo
ad
-ap
pro
ach
curv
esfo
rm¼
2:0;2:5;3:0;4:0;5:0
,an
d7.0
.
950
FIG
UR
E10
Pro
file
sof
sep
ara
tion
an
dsu
rface
stre
ssat
the
pu
ll-o
ffp
osit
ion
form¼
0:0
1an
dm¼
3:0
.
951
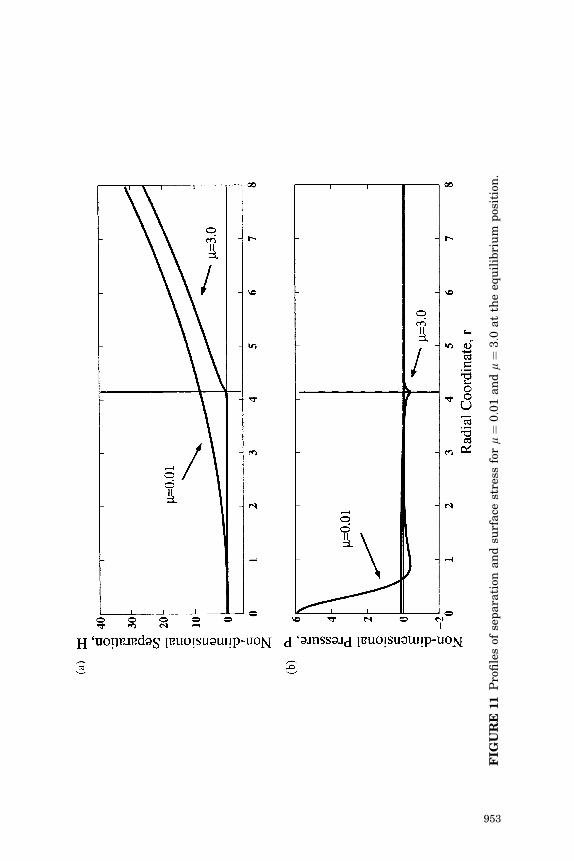
Another important feature affected by the Tabor parameter is theequilibrium position at which the external force vanishes (F ¼ 0).According to the computation results shown in Figure 8, the equili-brium positions are le ¼ 2:07 and 13:44 for m ¼ 1:0 and m ¼ 7:0,respectively. With an increase in the value of the Tabor parameter theapproach distance at the static equilibrium, le, increases significantly.This indicates that when the Tabor parameter is large (correspondingto a large, soft microparticle with a flat barrier), the microparticle ishighly deformed at the static equilibrium state. Figure 11 shows theprofile of separation and surface stress for m ¼ 0:01 and m ¼ 3:0 at theequilibrium position. It clearly reveals that at the equilibrium positionthe microparticle is deformed more significantly with a larger contactradius when m ¼ 3:0. Even though in both cases the net external loadsare zero, because of a higher elasticity a small deformation corre-sponds to a higher contact pressure. Therefore, the case of m ¼ 0:01 hasa stronger repulsive stress. The deformation of the microparticle ismore significant for larger Tabor parameter values.
The effect of the value of the Tabor parameter can be observed alsofrom the separation and surface stress profile at l ¼ 0. Figure 12shows the profile of separation and tensile stress for m ¼ 0:01 and 3:0at l ¼ 0. There is little deformation for m ¼ 0:01 but obvious defor-mation for m ¼ 3:0. It demonstrates clearly that the change of the slopeof the attractive stress and the separation at the edge of the contact issharper for higher Tabor parameter values.
Effects of Surface Roughness on Microparticle Adhesion
As shown by the governing equations, the microparticle adhesionconsidering surface roughness is determined not only by the value ofTabor’s parameter but also by the variance of the roughness heights.The effects of various Tabor’s parameter values have been demon-strated previously for smooth surfaces. This section focuses on theeffects of surface roughness on microparticle adhesion. To understandmore easily the effect of surface roughness, we define the reductionrate of the pull-off force, fr, as
fr ¼ 1 � Fp
Fp0; ð29Þ
where Fp is the pull-off force for a rough surface and Fp0 is the pull-offforce for a smooth surface.
Figure 13 shows the load-approach curves for m ¼ 0:01 for Gaus-sian surface roughness. The pull-off force for a smooth surface
952 W. Cheng et al.
FIG
UR
E11
Pro
file
sof
sep
ara
tion
an
dsu
rface
stre
ssfo
rm¼
0:0
1an
dm¼
3:0
at
the
equ
ilib
riu
mp
osit
ion
.
953
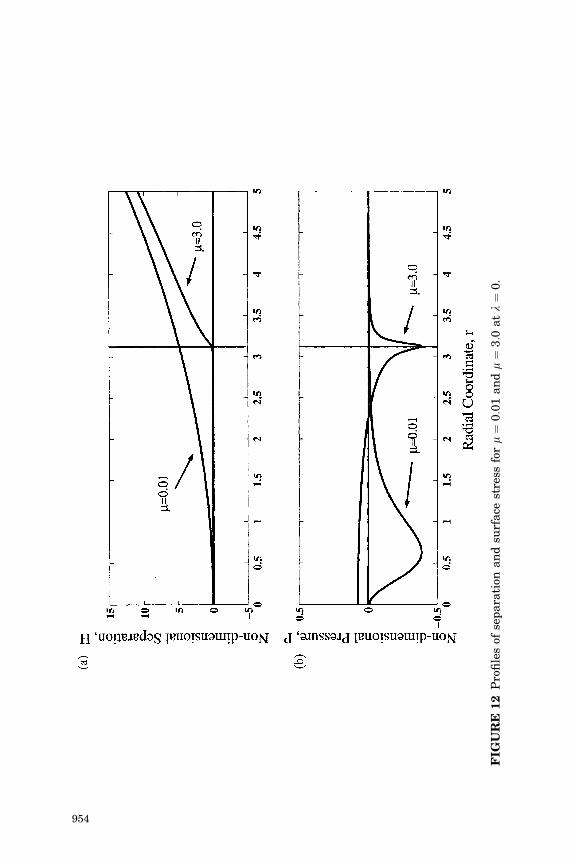
FIG
UR
E12
Pro
file
sof
sep
ara
tion
an
dsu
rface
stre
ssfo
rm¼
0:0
1an
dm¼
3:0
atl¼
0.
954
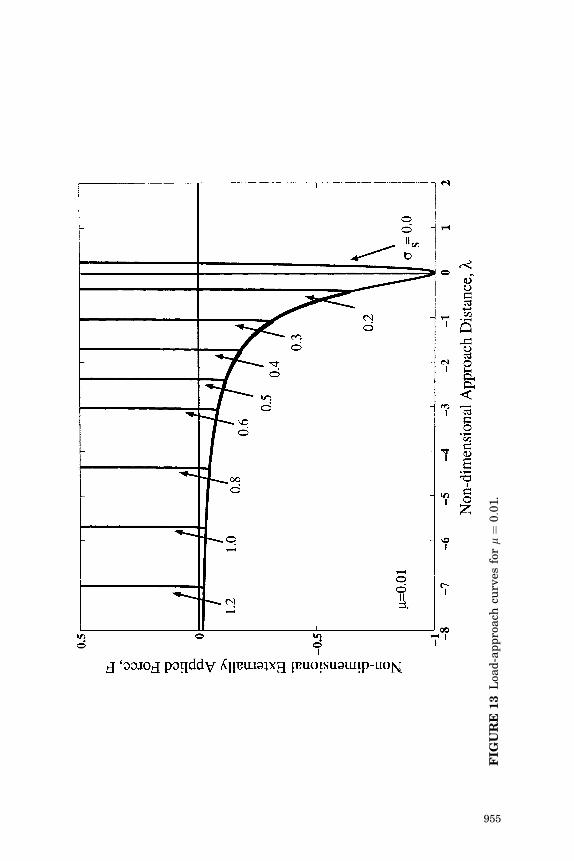
FIG
UR
E13
Loa
d-a
pp
roach
curv
esfo
rm¼
0:0
1.
955

(sS ¼ 0) is Fp ¼ �1 (the DMT value). Surface roughness reduces thepull-off force dramatically. For example, for sS ¼ 0:20, the pull-offforce is �0:64. Compared with the smooth value, the reduction rate,fr, of the pull-off force is 36%. When sS ¼ 0:4, the pull-off forcereduces to 0:18 and the reduction rate is fr ¼ 82%. When sS ¼ 1:0,the pull-off force is only 0:03 and the corresponding reduction rate isfr ¼ 97%. The variance of roughness heights, sS, is scaled by theintermolecular equilibrium spacing, E � 4 A. Therefore, sS ¼ 1:0corresponds to a very small distance of approximately 4 A. In reality,submicrometer or nanometer roughness can easily exceed this value.As a result, the pull-off force can easily be reduced by 97% whenTabor’s parameter value is small. Surface roughness also causes theshift of the approach of pull-off. For a smooth surface, the pull-offforce occurs at lp ¼ 0. When small roughness is considered, e.g.,sS ¼ 0:2, the pull-off force appears at lp ¼ �0:42. The approach dis-tance of the pull-off force decreases with increasing roughness. Foran even higher surface roughness, e.g., sS ¼ 1:0, the net externalload reaches the pull-off value at lp ¼ �5:78. In a dimensionalmeasure, the approach for the pull-off force decreases about5:78E � 23:1 A when sS ¼ 1:0. The approach for the equilibriumposition also decreases significantly due to surface roughness. For asmooth surface, the approach at the static equilibrium position isle ¼ 0:21. However, when the surface roughness scale is sS ¼ 1:0, theapproach at equilibrium is le ¼ �5:71. This result indicates that themicroparticle deforms more severely if the surface is smooth becauseof a stronger surface stress and a closer separation between themicroparticle and the barrier. Microparticles with rough surfacesdeform less compared with those with smooth surfaces. The resultsalso show that the difference between approach distances of pull-offand equilibrium is very small both for the smooth and rough sur-faces. In the case of sS ¼ 1:0, lp � le � 0:07, which is about 0:28 A.
Figure 14 shows the case for a larger Tabor parameter value ofm ¼ 2:0. It clearly reveals that surface roughness also has significanteffects on contact for larger Tabor parameter values. The effects ofsurface roughness on the pull-off force and the approach for pull-offforce are similar to the cases of small Tabor parameter values. Thepull-off force is significantly reduced, and the approach at which thepull-off force occurs decreases. For a smooth surface the pull-off forceis Fp ¼ �0:79 at lp ¼ �1:66. When the surface is rough, i.e., sS ¼ 0:2,the pull-off force reduces to Fp ¼ �0:52 with a reduction rate of 34% atlp ¼ �1:71. When sS ¼ 0:4, the pull-off force is Fp ¼ �0:167 atlp ¼ �2:31 and the reduction rate is 79%. For sS ¼ 1:0, the pull-offforce is �0:03 at lp ¼ �5:91 and the reduction rate is 96%.
956 W. Cheng et al.
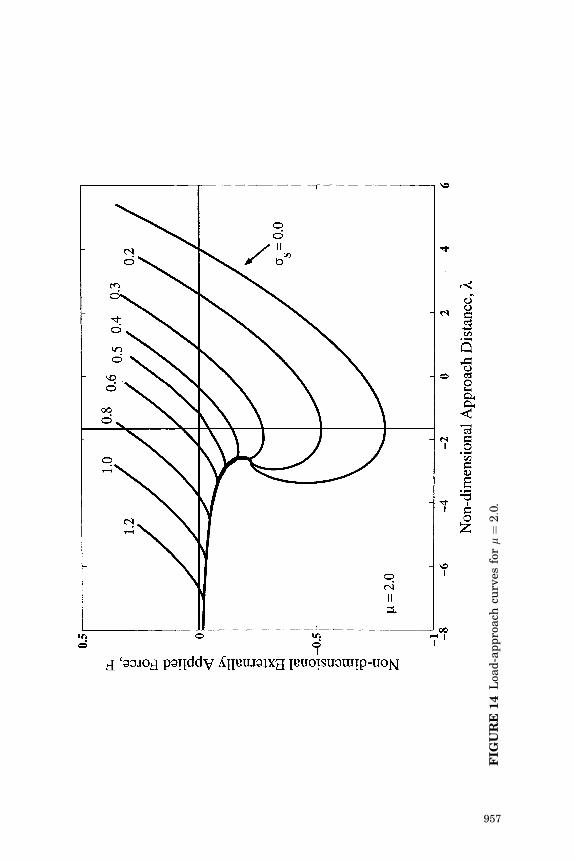
FIG
UR
E14
Loa
d-a
pp
roach
curv
esfo
rm¼
2:0
.
957
Figure 14 also shows some features related particularly to largeTabor parameter values. The snap-on and snap-off are the results ofstrong intermolecular attractions. Surface roughness severely reducesintermolecular adhesion because of the large gaps formed by theroughness heights. The scale and existence of the snap-on and snap-offare changed by surface roughness. Figure 14 shows that the snap-onand snap-off exist only for relatively smooth surfaces in which0 � sS < 0:4. The range of the unstable branch, however, is shortenedby surface roughness. Snap-on and snap-off disappear when sS � 0:4.This can be illustrated by some of the computational results. WhensS ¼ 0:0 (a smooth surface), the snap-on happens at la ¼ �2:55. Thecorresponding external load is Fa ¼ �1:82. The snap-off happens atlb ¼ �3:38 and the corresponding external load is Fb ¼ �4:54. Therange of the unstable branch is �3:38 � l � �2:55. When sS ¼ 0:2,the snap-on point is la ¼ �2:58 and the snap-off point is lb ¼ �2:95.The external loads are �1:80 and �3:17 for the snap-on and snap-off,respectively. The range of the unstable branch decreases to theinterval of �2:95 � l � �2:58. In other words, the snap-on and thesnap-off points are closer. It is also observed that surface roughnessdecreases the approach for snap-on and snap-off. The change of thestatus of snap-on and snap-off is confirmed by the case of a higherroughness level. For sS ¼ 0:3, la ¼ �2:61 and lb ¼ 2:63. The externalforce at snap-on and snap-off is �1:79 and �2:01, respectively. Thesnap-on and snap-off points are even closer because the interval forthe unstable branch is �2:63 � l � �2:61. A critical state is reachedwhen the snap-on and snap-off points are the same. The variance ofroughness height that leads to this critical state can be found throughrefined simulations by changing the value of sS in very fine steps.When sS ¼ 0:4, no snap-on and snap-off points are found. The load-approach curves in Figure 14 also demonstrate the shift of the equi-librium approach due to surface roughness when the value of Tabor’sparameter is large. The equilibrium approach values are le ¼ 4:00;2:59; �0:364; and � 5:28 for sS ¼ 0; 0:2; 0:4, and 1:0, respectively. It isclear that the equilibrium approach decreases significantly as thevariance of roughness heights increases.
The effects of roughness can be understood further by analyzing themean separation and effective stress profiles of the microparticleassociated with the pull-off, the snap-on, and snap-off, and the staticequilibrium states. Figure 15 shows the separation and surface stressprofiles at pull-off for m ¼ 2:0 with different variances of roughnessheights. For relatively smooth surfaces (sS � 0:4), the microparticledeforms mainly over the local region near r ¼ 0. The outer regionis affected less. Because of the strong surface stress and elastic
958 W. Cheng et al.
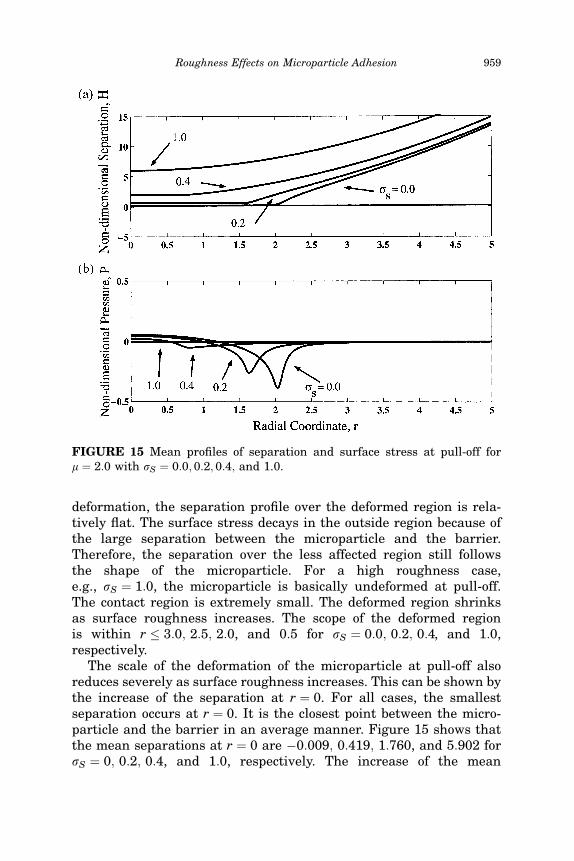
deformation, the separation profile over the deformed region is rela-tively flat. The surface stress decays in the outside region because ofthe large separation between the microparticle and the barrier.Therefore, the separation over the less affected region still followsthe shape of the microparticle. For a high roughness case,e.g., sS ¼ 1:0, the microparticle is basically undeformed at pull-off.The contact region is extremely small. The deformed region shrinksas surface roughness increases. The scope of the deformed regionis within r � 3:0; 2:5; 2:0, and 0:5 for sS ¼ 0:0; 0:2; 0:4, and 1:0,respectively.
The scale of the deformation of the microparticle at pull-off alsoreduces severely as surface roughness increases. This can be shown bythe increase of the separation at r ¼ 0. For all cases, the smallestseparation occurs at r ¼ 0. It is the closest point between the micro-particle and the barrier in an average manner. Figure 15 shows thatthe mean separations at r ¼ 0 are �0:009; 0:419; 1:760, and 5:902 forsS ¼ 0; 0:2; 0:4, and 1:0, respectively. The increase of the mean
FIGURE 15 Mean profiles of separation and surface stress at pull-off form ¼ 2:0 with sS ¼ 0:0; 0:2; 0:4; and 1.0.
Roughness Effects on Microparticle Adhesion 959
separation at r ¼ 0 is evident as the surface roughness increases. Thegap at the pull-off position between the mean datum plane of themicroparticle and the barrier is larger if the surface is rough.
As separation changes, surface stress at pull-off changes accord-ingly. Figure 15 also shows that the approximate compression regionsare within r � 1:19; 0:99; 0:52, and 0:0 for sS ¼ 0:0; 0:2; 0:4, and 1:0,respectively. The compression region is reduced as surface roughnessincreases. When the variance of roughness is relatively large, e.g.,sS ¼ 1:0, there is no compression region. A very small attractive stressdistributes over the whole surface and the microparticle is barelydeformed. As the compression region shrinks, the peak of the repulsivepressure also decreases. When sS ¼ 1:0, there is no repulsive stressand the peak of the repulsive stress is 0:0554; 0:0466, and 0:0250 forsS ¼ 0:0; 0:2, and 0:4, respectively. For a smooth surface, a positiveseparation corresponds to an attractive surface stress according to theLennard-Jones law. However, for a rough surface, a positive separa-tion of the mean datum plane still corresponds to a repulsive stressbecause of averaging over roughness heights. For sS ¼ 0:2 and 0:4, themean separation at r ¼ 0 is positive but the corresponding effectivesurface stress is repulsive. Because of surface roughness, the dis-tribution of the attractive stress is no longer concentrated on the edgeof the contact area. The peak and the slope of the attractive stressdecrease dramatically. The peaks of the attractive stress are �0:3837,�0:2582; �0:0493; and �0:0035, located at r ¼ 2:0233; 1:6337;0:8120; and 0:3860 for sS ¼ 0:0; 0:2; 0:4; and 1:0, respectively. Thedistribution of the attractive stress is smoothed and the attractiveregion is enlarged, while the magnitude of the attractive stress is verysmall. For sS ¼ 1:0, the attractive stress does not exceed �0:0035 overthe entire contact region.
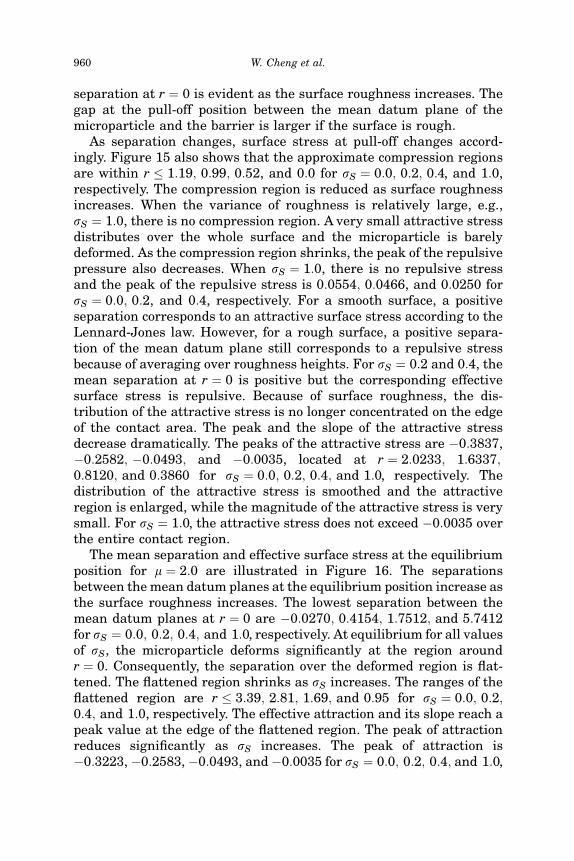
The mean separation and effective surface stress at the equilibriumposition for m ¼ 2:0 are illustrated in Figure 16. The separationsbetween the mean datum planes at the equilibrium position increase asthe surface roughness increases. The lowest separation between themean datum planes at r ¼ 0 are �0:0270; 0:4154; 1:7512; and 5:7412for sS ¼ 0:0; 0:2; 0:4; and 1:0, respectively. At equilibrium for all valuesof sS, the microparticle deforms significantly at the region aroundr ¼ 0. Consequently, the separation over the deformed region is flat-tened. The flattened region shrinks as sS increases. The ranges of theflattened region are r � 3:39; 2:81; 1:69; and 0:95 for sS ¼ 0:0; 0:2;0:4; and 1:0, respectively. The effective attraction and its slope reach apeak value at the edge of the flattened region. The peak of attractionreduces significantly as sS increases. The peak of attraction is�0:3223, �0:2583, �0:0493, and �0:0035 for sS ¼ 0:0; 0:2; 0:4; and 1:0,
960 W. Cheng et al.
respectively. At the equilibrium position, the repulsion and attractionare balanced so that the net external force vanishes. When sS is large,the intensity of the attraction is extremely small. To balance therepulsion the attraction region has to be significantly large. WhensS � 1:0 the magnitude of the attractive stress is negligible. This stressdistribution does not agree with either the DMT or the JKR theory; aHertzian distribution may be more appropriate.
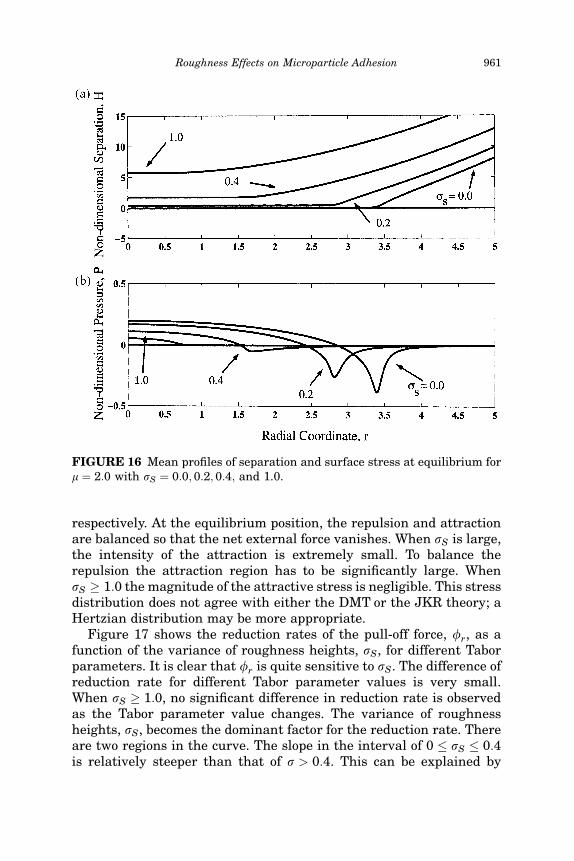
Figure 17 shows the reduction rates of the pull-off force, fr, as afunction of the variance of roughness heights, sS, for different Taborparameters. It is clear that fr is quite sensitive to sS. The difference ofreduction rate for different Tabor parameter values is very small.When sS � 1:0, no significant difference in reduction rate is observedas the Tabor parameter value changes. The variance of roughnessheights, sS, becomes the dominant factor for the reduction rate. Thereare two regions in the curve. The slope in the interval of 0 � sS � 0:4is relatively steeper than that of s > 0:4. This can be explained by
FIGURE 16 Mean profiles of separation and surface stress at equilibrium form ¼ 2:0 with sS ¼ 0:0; 0:2; 0:4; and 1.0.
Roughness Effects on Microparticle Adhesion 961
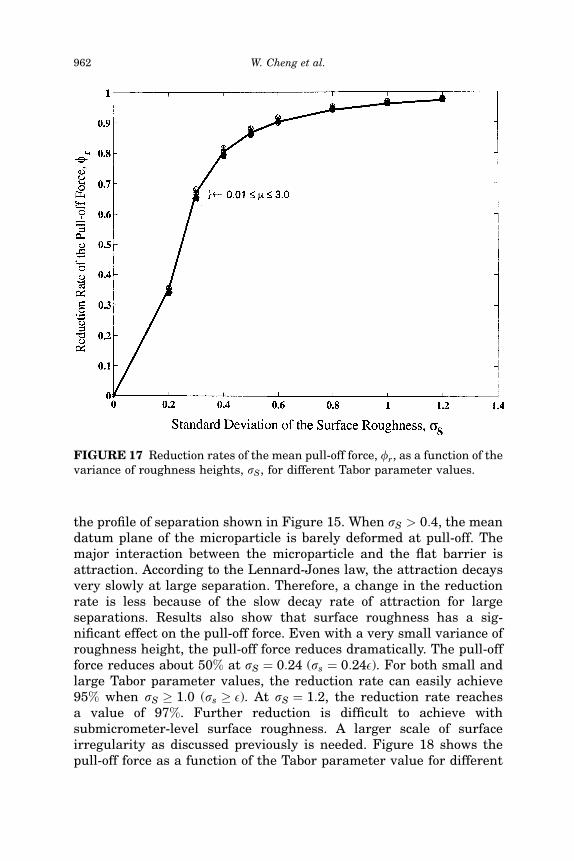
the profile of separation shown in Figure 15. When sS > 0:4, the meandatum plane of the microparticle is barely deformed at pull-off. Themajor interaction between the microparticle and the flat barrier isattraction. According to the Lennard-Jones law, the attraction decaysvery slowly at large separation. Therefore, a change in the reductionrate is less because of the slow decay rate of attraction for largeseparations. Results also show that surface roughness has a sig-nificant effect on the pull-off force. Even with a very small variance ofroughness height, the pull-off force reduces dramatically. The pull-offforce reduces about 50% at sS ¼ 0:24 (ss ¼ 0:24E). For both small andlarge Tabor parameter values, the reduction rate can easily achieve95% when sS � 1:0 (ss � E). At sS ¼ 1:2, the reduction rate reachesa value of 97%. Further reduction is difficult to achieve withsubmicrometer-level surface roughness. A larger scale of surfaceirregularity as discussed previously is needed. Figure 18 shows thepull-off force as a function of the Tabor parameter value for different
FIGURE 17 Reduction rates of the mean pull-off force, fr, as a function of thevariance of roughness heights, sS, for different Tabor parameter values.
962 W. Cheng et al.
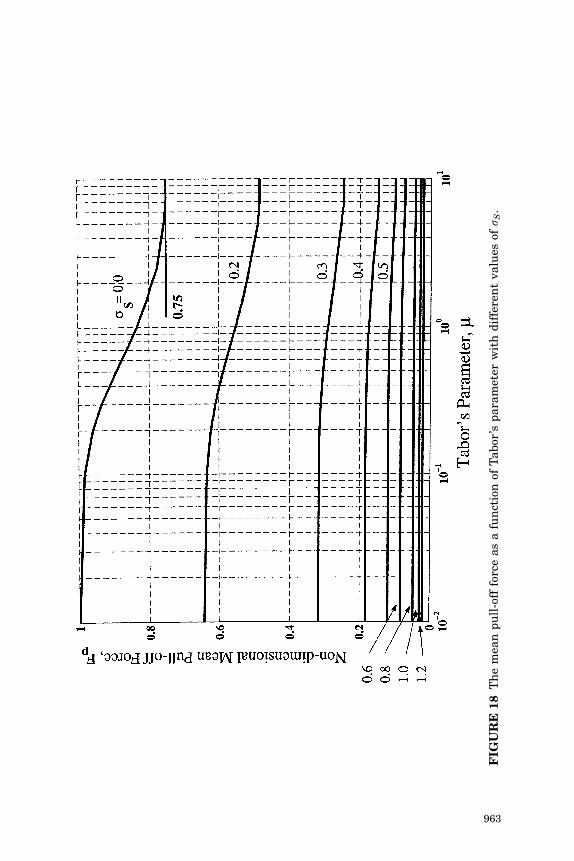
FIG
UR
E18
Th
em
ean
pu
ll-o
fffo
rce
as
afu
nct
ion
ofT
abor
’sp
ara
met
erw
ith
dif
fere
nt
valu
esof
s S.
963
values of sS. For sS ¼ 0:0, because the same numerical method andtheory are used, the results are the same as those of Greenwood [10]and Feng [11]. It reveals a smooth transition from the DMT theory(Fp ¼ 2pRg) to the JKR theory (Fp ¼ 3
2 pRg). The pull-off force decrea-ses at almost the same rate as shown in Figure 17 when sS increases.Figure 18 can be used as a map to find the reduced pull-off force fordifferent Tabor parameter values and different surface roughnesses.
Finally, it must be mentioned that the results presented in this paperare based upon statistical averaging over the Gaussian distributionof the roughness height shown in Equation (10). The solution for aspecific rough surface is more complicated. Individual asperities causemultiple contacts and, therefore, multiple snap-off, snap-on, and pull-off. The smooth load-approach curve and profiles for separation andsurface stress become irregular. The statistical averaging method usedin this paper can give more systematic results, which demonstrate theeffects that surface roughness has on mean adhesive contact behavior.
CONCLUSIONS
This paper presents a method for investigation of effects of roughnesson adhesion for a microparticle in contact with a nominally flat surfaceover a circular area. The statistical mean load-approach curves, theprofiles of the mean separation, and the effective surface stress arecomputed for a Gaussian gap perturbation. It is found that surfaceroughness dramatically changes the status of snap-on and snap-off.When the variance of roughness heights is relatively large, snap-onand snap-off can disappear. The separation and stress distributions forvery rough surfaces are similar to those predicted by Hertzian theory.Results also reveal that surface roughness significantly reduces thepull-off force. When the surface roughness is large, the variance ofroughness heights is the dominant factor in the reduction of the pull-off force. With even a very small variance of roughness height the pull-off force reduces dramatically. Further reduction is difficult to achievewith submicrometer-level surface roughness, implying that a largerscale of surface irregularity may be needed to achieve this. The sta-tistical distribution used in this work was Gaussian (normal); a log-normal distribution may be more realistic. In addition, the statisticalvariations added to the contact gap were introduced as a small per-turbation, and it is not known if the results for large values of thestandard deviation are realistic. Although the trends between adhe-sion force and roughness found in this paper agree with existingmeasurements, comparisons with experimental measurements forsurfaces with controlled random roughness should be carried out.
964 W. Cheng et al.
REFERENCES
[1] Burnham, N. A., Behrand, O. P., Oulevy, F., Gremand, G., Gallo, P.-J., Kulik, A. J.,Pollock, H. M., and Briggs, G. A., Nanotechnology 8, 67�75 (1997).
[2] Bradley, R. S., Phil. Mag. 13, 853�862 (1932).[3] Derjaguin, B. V., Kolloid Z. 69, 155�164 (1934).[4] Johnson, K. L., Kendall, K., and Roberts, A. D., Proc. Roy. Soc. London A 324,
301�313 (1971).[5] Derjaguin, B. V., Muller, V. M., and Toporov, Yu. P., J. Colloid Interface Sci. 53,
314�326 (1975).[6] Tabor, D., J. Colloid Interface Sci. 58, 2�13 (1977).[7] Muller, V. M., Yushchenko, V. S. and Derjaguin, B. V., J. Colloid Interface Sci. 77,
91�101 (1980).[8] Maugis, D., J. Colloid Interface Sci. 150, 243�269 (1992).[9] Attard, P., and Parker, J. L., Phys. Rev. A 46, 7959�7971 (1992).
[10] Greenwood, J. A., Proc. Roy. Soc. London A 453, 1277�1297 (1997).[11] Feng, J. Q., Colloids and Surfaces A: Physicochemical and Engineering Aspects 172,
175�198 (2000).[12] Johnson, K. L., and Greenwood, J. A., J. Colloid Interface Sci. 192, 326�333 (1997).[13] Krupp, H., Adv. Colloid Interface Sci. 1, 111 (1967).[14] Sharpe, L. H., J. Adhesion 6, 13�21 (1974).[15] Johnson, K. L., Tribology International 31, 413�418 (1998).[16] Fuller, K. N. G., and Tabor, D., Proc. Roy. Soc. London A 345, 327�342 (1975).[17] Schaefer, D. M., Carpenter, M., Reifenberger, R., Demejo, L. P., and Rimai, D. S.,
J. Adhesion Sci. and Technol. 8, 197�210 (1994).[18] Mizes, H. A., J. Adhesion Sci. Technol. 8, 937�951 (1994).[19] Briscoe, B. J., Liu, K. K., and Williams, D. R., J. Colloid Interface Sci. 200, 256�264
(1998).[20] Rabinovich, Y. I., Adler, J. J., Ata, A., Singh, R. K., and Moudgil, B. M., J. Colloid
and Interface Sci. 232, 17�24 (2000).[21] Reeks, M. W., Reed, J., and Hall, D., J. Phys., D: Appl. Phys. 21, 574�589 (1988).[22] Soltani, M., and Ahmadi, G., J. Adhesion 51, 105�123 (1995).[23] Ingham, D. B., and Yan, B., J. Aerosol Sci. 25, 327�340 (1994).[24] Ziskind, G., Fichman, M., and Gutfinger, C., Aerosol Sci. Technol. 28, 623�634
(1997).[25] Greenwood, J. A., and Tripp, J. H., Trans. ASME J. Applied Mechanics 341,
153�159 (1967).[26] Majumdar, A., and Bhushan, B., J. Tribology 112, 205�216 (1990).[27] Greenwood, J. A., and Williamson, J. B. P., Proc. Roy. Soc. London A 295, 300�319
(1966).[28] Greenwood, J. A., Trans. ASME J. Lub. Tech. 89, 81�91 (1966).[29] Johnson, K. L., Contact Mechanics (Cambridge University Press, Cambridge, UK,
1985), pp. 76�77.[30] Abramowitz, M., and Stegun, I. A., Handbook of Mathematical Functions With
Formulas, Graphs, and Mathematical Tables (National Bureau of Standards, Ap-plied Mathematics Series, Washington DC, USA, 1967) 55, Sixth Printing, p. 924,Table 25.10.
[31] Press, W. H., Teukolsky, S. A., Vetterling, W. T., and Flannery, B. P., NumericalRecipes (Cambridge University Press, Cambridge, 1992), 2nd. ed.
[32] Keller, H. B., Lectures on Numerical Methods in Bifurcation Problems (Springer-Verlag, New York, 1987).
Roughness Effects on Microparticle Adhesion 965