surface energy measurements of coated titanium dioxide … · surface energy measurements of coated...
TRANSCRIPT
Loughborough UniversityInstitutional Repository
Surface energymeasurements of coatedtitanium dioxide pigment
This item was submitted to Loughborough University's Institutional Repositoryby the/an author.
Citation: LIM, B.C., THOMAS, N.L. and SUTHERLAND, I., 2007. Surfaceenergy measurements of coated titanium dioxide pigment. Progress in organiccoatings, 62 (2), pp. 123-128
Additional Information:
• This article was published in the journal, Progress in organiccoatings [ c© Elsevier]. The definitive version is available at:http://www.sciencedirect.com/science/journal/03009440
Metadata Record: https://dspace.lboro.ac.uk/2134/3263
Publisher: c© Elsevier
Please cite the published version.
1
Surface Energy Measurements of Coated Titanium Dioxide Pigment
B. C. Lim, N. L. Thomas and I. Sutherland
Institute of Polymer Technology & Materials Engineering,
Loughborough University, Loughborough, Leicestershire, LE11 3TU, UK.
Abstract
In this study surface energy measurements have been carried out on titanium
dioxide pigments coated with different types of organic compound. The organic
coatings investigated were polymethylsiloxane and octyl triethoxy-silane. The level of
coating applied was increased from 0.2 up to 1.5 weight %. Contact angles were
measured using an advancing sessile drop method. To allow for the fact that
measurements were made on pressed discs of particles rather than on a perfectly flat
surface, a correction was applied to convert each measured contact angle to the true
Young’s contact angle. Surface energies were calculated from the corrected contact
angles using the Owens and Wendt equation. From the values of surface energy it was
possible to determine at what coating level the surface characteristics changed from
hydrophilic to hydrophobic and hence when complete coverage had taken place. For
both the siloxane and the silane coatings it was found that complete coating coverage
occurred at an addition level of around 0.8 weight %. The surface energies of all the
coated pigments were found to correlate well with their dispersion behaviour in liquid
paraffin.
Keywords: Titanium dioxide; surface energy; contact angle; organic coating
2
1. Introduction
Titanium dioxide, TiO2 is the most important inorganic pigment used in the
plastics and paint industries, comprising over 65% of the total consumption in different
applications. Most commercial TiO2 pigments are treated with some form of surface
coating. The most widely used coating is alumina and many general-purpose grades are
treated only with alumina, at levels between 0.5 and 3.5 weight % [1,2]. This treatment
promotes dispersion of the pigment and retards unwanted photodegradation reactions
between the pigment and the polymer matrix. Although TiO2 absorbs strongly in the
ultra-violet from 270 - 420 nm and therefore protects polymers from photochemical
degradation, it is also photoactive and can give rise to photocatalytic degradation of
polymers [3-5]. This erosion of the polymer surface is commonly called ‘chalking’.
Where enhanced resistance to weathering is required, silica coatings are used in
addition to alumina. This combination provides an effective barrier to reduce the
photodegradative effect of TiO2 on plastics and paints for exterior use [1,2,6].
Many modern TiO2 pigments are also treated with organic compounds. The
hydrophilic inorganic-coated pigments are treated with organic compounds thus
creating hydrophobic surfaces. These organic coatings serve to reduce agglomeration of
pigment particles and to prevent absorption of water during storage. They also improve
compatibility of the pigment with organic substrates and hence promote better
dispersion of the pigment in the polymer matrix. The types of organic compounds
commonly used as surface treatments on TiO2 are polyols, amines, siloxanes and
phosphated fatty acids [1].
In the current study, a series of titanium dioxide pigments have been coated with
different types and amounts of organic compound. These coated pigments have then

3
been analysed by determining their surface free energies from contact angle
measurements.
Figure 1 is a schematic diagram showing the contact angle (θ) made by a liquid
drop on a smooth, planar surface. The basic equation to describe the balance of energies
controlling the contact angle of the liquid drop on such a surface is known as Young’s
equation [7] and is one of the oldest in surface science. Young’s equation is given
below (equation 1) where γ is the surface free energy and subscripts ‘S’ and ‘L’ stand
for solid and liquid respectively.
θγγγ cosLSLS += ………………………(1)
Figure 1. Schematic diagram of a liquid drop on a surface
Dupré [8] proposed the idea of the thermodynamic work of adhesion (Wad),
which is the reversible work done in separation of unit area of a solid/liquid interface.
The Dupré equation states that: -
SLLSadW γγγ −+= …………………..(2)
Combining equations 1 and 2 gives the Young-Dupré equation: -
)cos1(W Lad θγ += …………………… (3)
Lγ
SγSLγ
Solid
Liquid
Vapour
θ
Lγ
SγSLγ
Solid
Liquid
Vapour
θ
4
Fowkes [9] suggested that the total surface free energy of a solid or a liquid is
the sum of three different intermolecular forces. They are dispersion (γd), polar (γp) and
hydrogen bonding (γh) surface energies. Often γp and γh are encompassed in a single
term known as γp. He also derived the interfacial free energy of a solid and a liquid that
interacted solely by dispersion forces: -
2/1dL
dSLSSL )(2 γγγγγ −+= ………………..(4)
For cases where both solid and liquid are polar, Owens and Wendt [10] and Kaelble
[11] combined the Fowkes and Young-Dupré equations: -
2/1pL
pS
2/1dL
dSL )(2)(2)cos1( γγγγθγ +=+ ………………..(5)
Contact angles measured using two liquids (one polar and one non-polar) can be
used to determine the polar and dispersive components of the surface free energy
following the method of Owens and Wendt [10]. This approach has been widely used to
measure wettability, surface energy and adhesion properties of polymers [12]. Examples
include studies of surface treated polyolefins for painting or printing [13] and oxidised
carbon fibres to enhance their reinforcing properties [14]. This approach has also been
used to investigate surface modified montmorillonite for tailored interfaces in
nanocomposites [15].
In this study contact angle measurements were made on pressed discs of coated
TiO2 particles. To allow for the fact that measurements were made on pressed particles
rather than on a perfectly flat surface, a relationship was derived between the measured
contact angle and the true Young’s contact angle (see section 2.2 below). Software
based on the Owens and Wendt equation was used to calculate surface energies of
coated titanium dioxide pigment from the corrected contact angle measurements.
5
2. Experimental
2.1 Organic Coating of TiO2 Pigment
A rutile TiO2 coated with an inorganic coating (silica and alumina) was selected.
This material was provided by Huntsman Pigments and had a surface area determined
by BET analysis of 11-12 m2/g. Two types of organic compound were used. Each
compound type was coated onto a sample of pigment at a series of different
concentrations. Spray coating was carried out using solutions of the appropriate
concentration of the organic compound dissolved in industrial methylated spirit (IMS).
The coated pigments were then micronised.
The following organic coated pigments were produced: -
Polymethylsiloxane: 0.3wt%, 0.5wt%, 0.8wt%, and 1.5wt%
Octyl triethoxy-silane: 0.2wt%, 0.5wt%, 0.8wt%, and 1.2wt%.
2.2 Contact Angle Measurements
Contact angle tests were carried out using Dataphysics OCA-20 contact angle
equipment. Water and diiodomethane (DIM) were used as the two testing liquids. Five
pressed discs were made from each sample of coated pigment and these were taken as
the substrates upon which contact angles of the liquid drops were measured. An
advancing sessile drop method was used for the contact angle measurements.
Conventional contact angle measurement methods rely on surfaces being
perfectly flat and smooth. However, in these studies contact angles were measured on
compacted particles rather than on a perfectly flat surface and so it was necessary to
employ a correction factor to allow for this. A relationship was derived between the
6
apparent contact angle, φ, which is the macroscopic value observed in the low power
microscope, and the true Young’s contact angle, (θ). This derivation is discussed below.
In this treatment the drop is assumed to be in thermodynamic equilibrium on a
heterogeneous surface. As the drop expands across the pressed powder disc additional
liquid surface is created as the liquid spans the gaps between the particles.
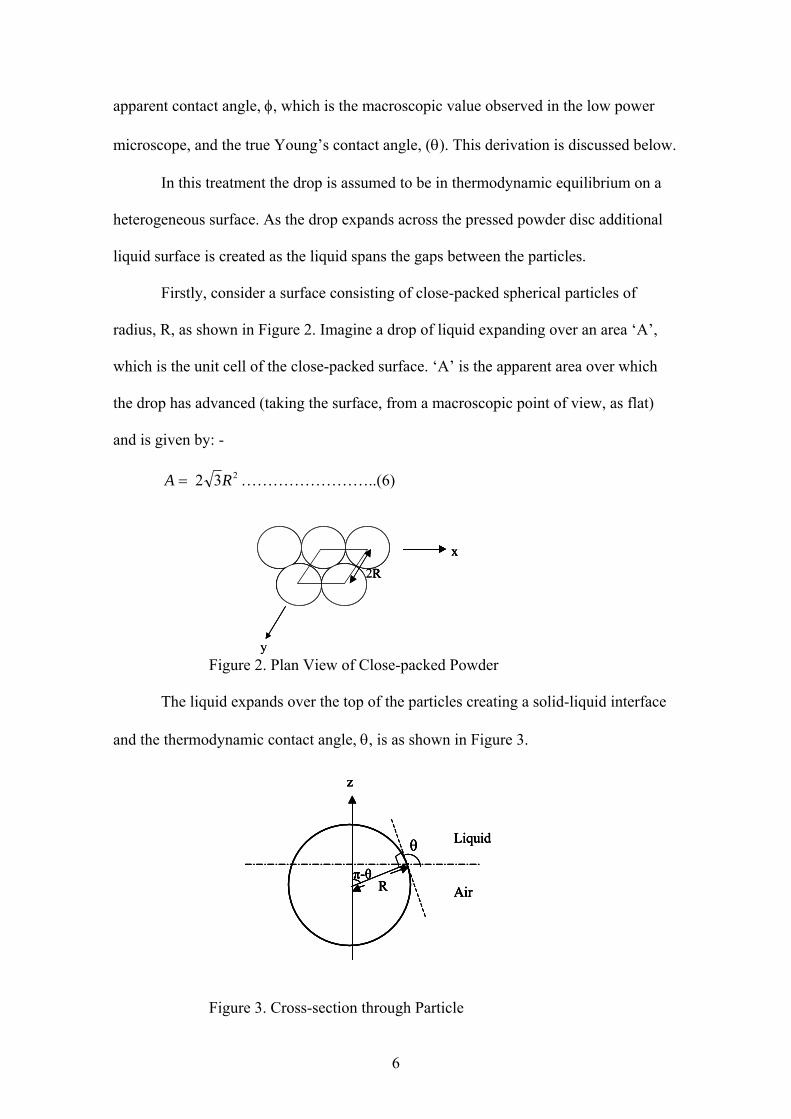
Firstly, consider a surface consisting of close-packed spherical particles of
radius, R, as shown in Figure 2. Imagine a drop of liquid expanding over an area ‘A’,
which is the unit cell of the close-packed surface. ‘A’ is the apparent area over which
the drop has advanced (taking the surface, from a macroscopic point of view, as flat)
and is given by: -
232 RA = ……………………..(6)
Figure 2. Plan View of Close-packed Powder
The liquid expands over the top of the particles creating a solid-liquid interface
and the thermodynamic contact angle, θ, is as shown in Figure 3.
Figure 3. Cross-section through Particle
Liquid
Air
θ
π-θR
z
Liquid
Air
θ
π-θR
z
Liquid
Air
θ
π-θR
z
Liquid
Air
θ
π-θR
z
x
R
x
y
2R
x
R
x
y
2R
7
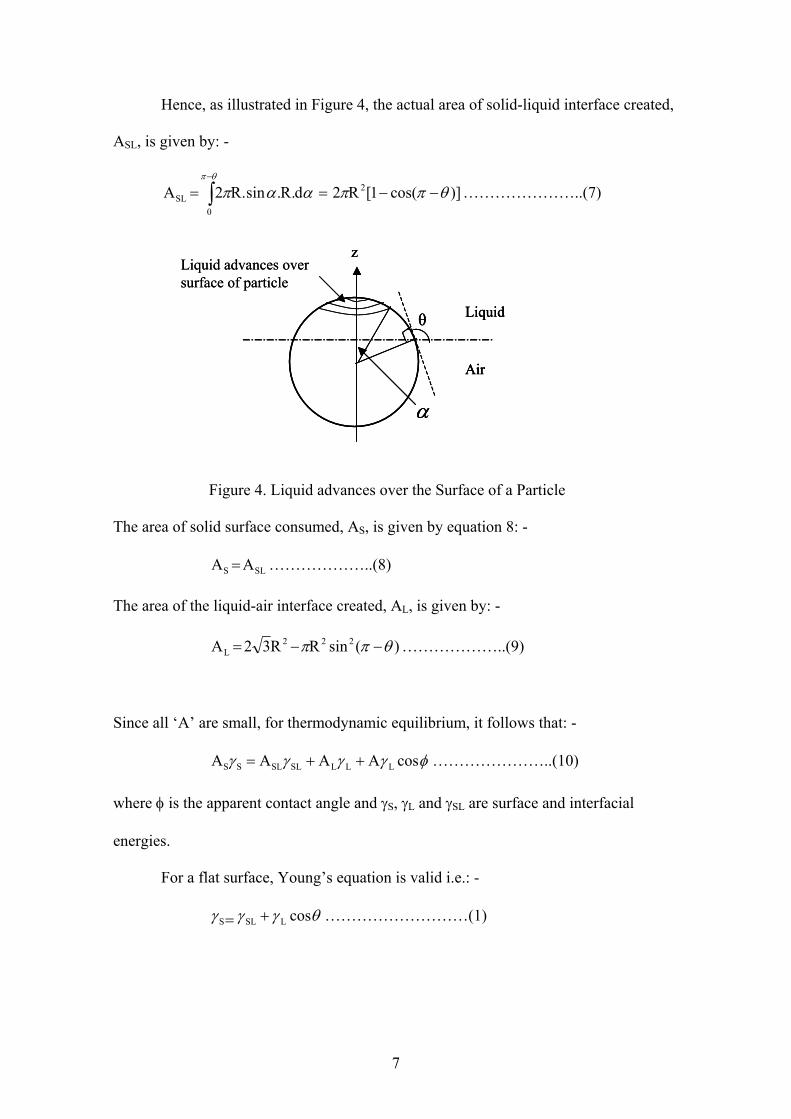
Hence, as illustrated in Figure 4, the actual area of solid-liquid interface created,
ASL, is given by: -
∫−
−−==θπ
θππααπ0
2SL )]cos(1[R2d.R.sin.R2A …………………..(7)
Figure 4. Liquid advances over the Surface of a Particle
The area of solid surface consumed, AS, is given by equation 8: -
SLS AA = ………………..(8)
The area of the liquid-air interface created, AL, is given by: -
)(sinRR32A 222L θππ −−= ………………..(9)
Since all ‘A’ are small, for thermodynamic equilibrium, it follows that: -
φγγγγ cosAAAA LLLSLSLSS ++= …………………..(10)
where φ is the apparent contact angle and γS, γL and γSL are surface and interfacial
energies.
For a flat surface, Young’s equation is valid i.e.: -
θγγγ cosLSLS += ………………………(1)
Liquid
Air
θ
z
α
Liquid advances over surface of particle
Liquid
Air
θ
z
α
Liquid
Air
θ
z
α
Liquid advances over surface of particle
8
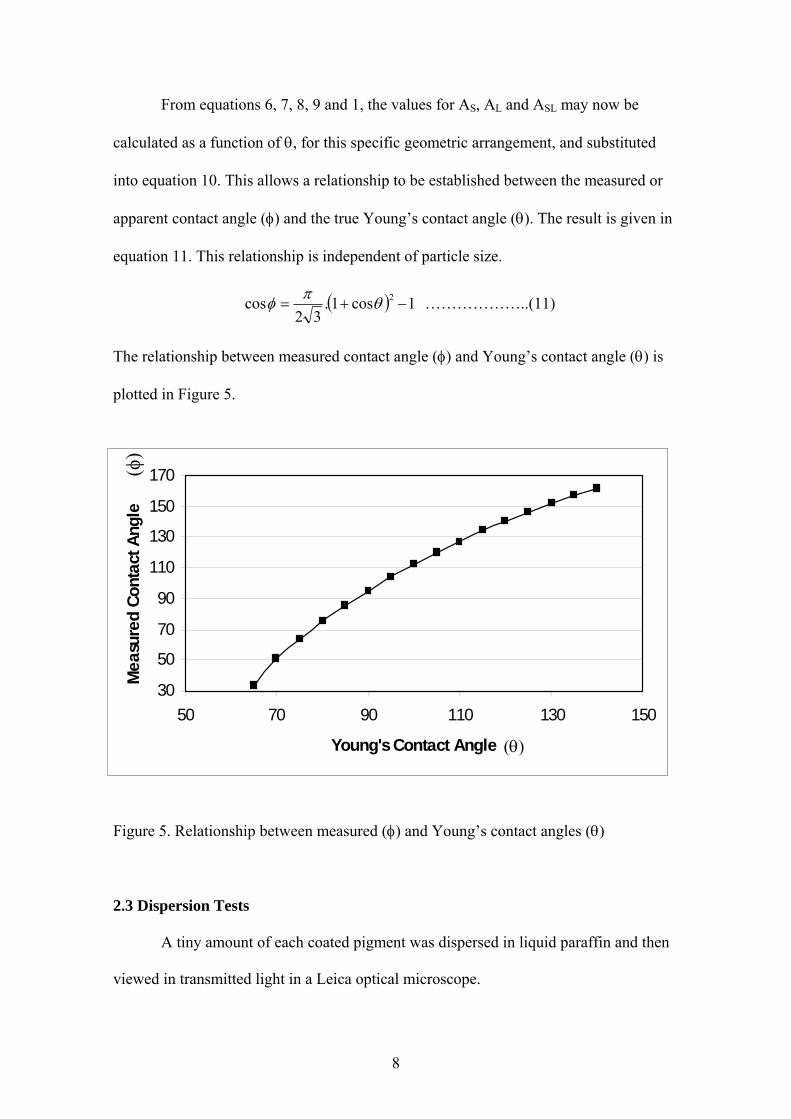
From equations 6, 7, 8, 9 and 1, the values for AS, AL and ASL may now be
calculated as a function of θ, for this specific geometric arrangement, and substituted
into equation 10. This allows a relationship to be established between the measured or
apparent contact angle (φ) and the true Young’s contact angle (θ). The result is given in
equation 11. This relationship is independent of particle size.
( ) 1cos1.32
cos 2 −+= θπφ ………………..(11)
The relationship between measured contact angle (φ) and Young’s contact angle (θ) is
plotted in Figure 5.
Figure 5. Relationship between measured (φ) and Young’s contact angles (θ)
2.3 Dispersion Tests
A tiny amount of each coated pigment was dispersed in liquid paraffin and then
viewed in transmitted light in a Leica optical microscope.
30
50
70
90
110
130
150
170
50 70 90 110 130 150
Young's Contact Angle
Mea
sure
d Co
ntac
t Ang
le
(φ)
(θ)
30
50
70
90
110
130
150
170
50 70 90 110 130 150
Young's Contact Angle
Mea
sure
d Co
ntac
t Ang
le
(φ)
(θ)
9
3. Results and Discussion
3.1 Contact Angle Measurements
The results of contact angle measurements for all the different coated pigments
are given in Table 1. These are corrected contact angles using the expression derived in
equation 11. It is seen that the contact angles measured using diiodomethane remain
reasonably constant, whereas the contact angles measured with water increase as the
coating level increases for each organic compound. When the contact angle of water on
a surface is greater than 90°, the surface is not wetted by the water i.e. the surface is
hydrophobic. The results for both coating types show that when the coating level
reaches 0.8 wt%, the contact angle with water has exceeded 90°, showing that the
particle surfaces have become hydrophobic.
Table 1 also shows values of surface energy. The total surface energy (γs) is the
sum of a dispersive component (γd) and a polar component (γp). It is seen that the polar
surface energies reduce with increasing coating level. The point at which the polar
surface energy tends towards zero indicates the point at which the surface is non-polar
and complete coating coverage has occurred. For both the siloxane-coated and silane-
coated pigments, non-polarity was achieved at a coating level of 0.8 wt%. Graphs of
polar surface energy as a function of coating level for both coating types are plotted in
Figures 6 (a) and (b) respectively.
Note that the value of γd of 23 mJm-2 for polymethylsiloxane found in this study
is in good agreement with the value of γd of 21.7 mJm-2 for polydimethylsiloxane
reported by Owen and Wendt [10].

10
3.2 Dispersion Tests
Results of dispersion tests with samples of the pigments in liquid paraffin
correlated well with the surface energy measurements. Examination of samples in
transmission in the optical microscope showed that as the organic coating level
increased there was reduction in agglomeration of the pigments – and hence improved
dispersion. Good dispersion, as judged by visual observation, was achieved for both
organic compound types at a coating level of 0.8 weight %, which was the level at
which surface energy measurements had shown the pigment surface to have changed
from hydrophilic to hydrophobic.
Figure 6 (a) Polar Surface Energy as a Function of Siloxane Coating Level
Figure 6 (b) Polar Surface Energy as a Function of Silane Coating Level
-1
4
9
14
19
24
0.3 0.5 0.7 0.9 1.1 1.3 1.5
wt% Siloxane
Pola
r Su
rfac
e E
nerg
y(m
J/m
2)
0
2
4
6
8
10
12
14
0.2 0.4 0.6 0.8 1 1.2
wt% Silane
Pola
r Su
rfac
e E
nerg
y(m
J/m
2)
11
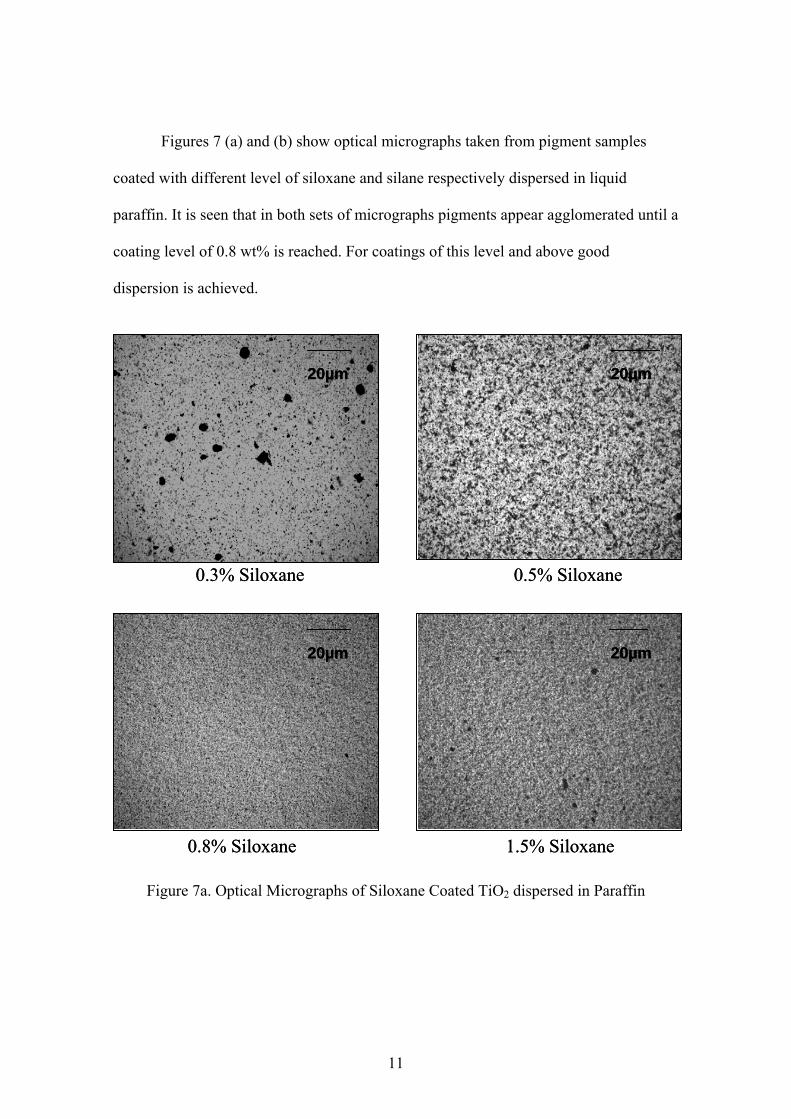
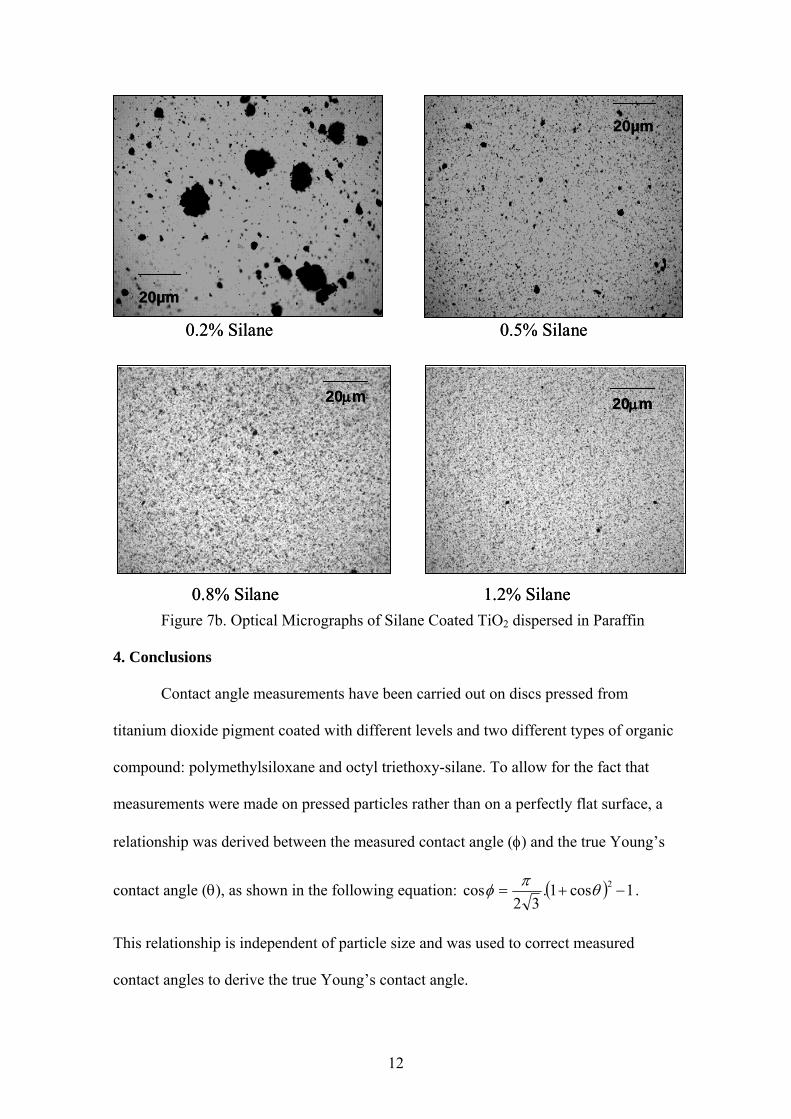
Figures 7 (a) and (b) show optical micrographs taken from pigment samples
coated with different level of siloxane and silane respectively dispersed in liquid
paraffin. It is seen that in both sets of micrographs pigments appear agglomerated until a
coating level of 0.8 wt% is reached. For coatings of this level and above good
dispersion is achieved.
Figure 7a. Optical Micrographs of Siloxane Coated TiO2 dispersed in Paraffin
20µm 20µm
20µm 20µm
0.3% Siloxane 0.5% Siloxane
0.8% Siloxane 1.5% Siloxane
20µm20µm 20µm20µm
20µm20µm 20µm20µm
0.3% Siloxane 0.5% Siloxane
0.8% Siloxane 1.5% Siloxane
12
Figure 7b. Optical Micrographs of Silane Coated TiO2 dispersed in Paraffin
4. Conclusions
Contact angle measurements have been carried out on discs pressed from
titanium dioxide pigment coated with different levels and two different types of organic
compound: polymethylsiloxane and octyl triethoxy-silane. To allow for the fact that
measurements were made on pressed particles rather than on a perfectly flat surface, a
relationship was derived between the measured contact angle (φ) and the true Young’s
contact angle (θ), as shown in the following equation: ( ) 1cos1.32
cos 2 −+= θπφ .
This relationship is independent of particle size and was used to correct measured
contact angles to derive the true Young’s contact angle.
0.2% Silane 0.5% Silane
0.8% Silane 1.2% Silane
20µm
20µm
20μm20μm
0.2% Silane 0.5% Silane
0.8% Silane 1.2% Silane
20µm20µm
20µm20µm
20μm20μm20μm20μm
13
Surface energy values were derived from the corrected contact angle
measurements. It was found that the polar surface energy decreased in value with
increasing level of organic coating. The point at which the polar surface energy reduced
almost to zero indicated the point at which complete coating coverage was achieved.
For both the siloxane and the silane coatings it was found that complete coating
coverage occurred at an addition level of around 0.8 weight %. These results were in
good agreement with dispersion tests on samples of pigment in liquid paraffin.
Acknowledgements
The authors would like to acknowledge funding for this work from Huntsman
Pigments and the EPSRC. Technical support from Dr. Brian Noble from Huntsman
Pigments is much appreciated.
References
1. S. Valente and R. Butler, Mod. Plast. Int., 24(10) (1994) 77.
2. H.H Murray, Chapter 2 in ‘Chemistry of Pigments and Fillers’, John Wiley &
sons, Canada (1983).
3. J.G. Balfour, JOCCA, 73(12) (1990) 478.
4. J.H. Braun, A. Baidins and R.E. Marganski, Prog. Org. Coat., 20 (1992) 105.
5. H.G Voelz, G.Koempf, H.G Fitzky, Farbe und Lack, 78, (1972) 1037.
6. R. E. Day, Poly. Deg. & Stab., 29 (1990) 73.
7. T. Young, Phil. Trans., 95 (1805) 65.
8. A. Dupré, Adv. Colloid Int. Sci., 5 (1950) 514.
9. F.M. Fowkes, Ind.& Eng. Chem., 56 (1964) 12.
10. D.K. Owens and R.C. Wendt, J. Appl. Poly. Sci., 13 (1969) 1741.
11. D.H. Kaelble and K.C. Uy, J. Adhes., 2 (1970) 50.
14
12. I. Sutherland and R.J. Heath, Prog. Rubber & Plast. Technol., 14(3) (1998)
151.
13. I. Sutherland, D.M. Brewis, R.J. Heath and E. Sheng, J. Surface & Interfacial
Anal., 17 (1991) 505.
14. R.H. Bradley, X. Ling and I. Sutherland, Carbon, 31 (1993) 1115.
15. L. Le Pluart, J. Duchet, H. Sautereau and J.F.Gerard, J Adhes., 78 (2002) 645.