surface deformation detected by the space-observed small ... · pdf file87 2. study area and...
TRANSCRIPT
Surface deformation detected by the space-observed small baseline SAR 1
interferometry over permafrost environment of Beiluhe section, Hoh Xil 2
natural reserve in Tibet Plateau, China 3
4
Fulong Chena,b, Hui Linb* 5
a Institute of Remote Sensing and Digital Earth, Chinese Academy of Sciences, No.9 Dengzhuang South Road, Haidian 6
District, Beijing 100094, China; 7
b Institute of Space and Earth Information Science, The Chinese University of Hong Kong, Shatin, N.T., Hong Kong, 8
China. 9
*Corresponding author. Tel.: +852 3943 6010; fax: +852 2603 7470. 10
E-mail addresses: [email protected] (H. Lin); [email protected] (F. Chen). 11
12
13
14
Abstract: The evolution of permafrost and the active layer is highly related to biological diversity 15
and climate change because of its feedback effects involving water and carbon storage. In this 16
study, we firstly examined the relationship of active layer variation, geomorphological process 17
and anthropogenic activities by means of small baseline synthetic aperture radar interferometry 18
in Beiluhe, Hoh Xil natural reserve in Tibet Plateau (TP), China, using 3.5-yr observation span of 19
L-band ALOS PALSAR data (June, 2007 to December, 2010). The estimated surface 20
displacements (primarily in the range of -30 mm yr-1 to 30 mm yr-1) and time-series implied 21

evolutions of the active layer and permafrost beneath. The motion trend along slopes was 22
complicated due to the geomorphological process, and thus interdisciplinary interpretations 23
were required. Anthropogenic influences on this frail permafrost environment were significant, 24
proved by the remarkable surface settlement along the embankment of Qinghai-Tibet Railway. 25
Consequently, it is crucial and necessary to monitor this permafrost plateau owing to the 26
combination of climate change, geo-hazards prediction, natural reserve conservation as well as 27
the regional sustainable development. 28
29
Keywords: Small BAseline Subsets; permafrost; Tibet Plateau; Qinghai-Tibet Railway; natural 30
reserve; 31
32
33
1. Introduction 34
The Tibet Plateau (TP), recognized as the third pole of Earth, has the largest permafrost 35
extent outside the polar region (Chen et al., 2012b). Permafrost is sensitive to global 36
warming, resulting in significant influences on regional water balance, biological 37
diversity, carbon cycle and engineering constructions. TP, known as the Asia water 38
tower, is the source region of many major rivers in Asia (Immerzeel et al., 2008). The 39
perennial flow of those rivers largely relies on the constant flux from glaciers melting. 40
Approximately 23-48% of the total global soil carbon pool is stored in permafrost 41
regions in the world (Guo and Macdonald, 2006; Tarnocai et al., 2008). Alpine 42

permafrost in TP bears a greater organic carbon pool than do grassland soils in other 43
regions of China (Wang et al., 2008). Thus carbon emission from permafrost has been 44
highly concerned when it thaws under global warming (Monastersky, 2011; Schuur et al., 45
2008). The active layer overlaid on permafrost tends to be instable determined by the 46
dynamics of frost heave and thaw settlement. As the plateau is being developed, the 47
anthropogenic activities, such as expansive natural resource exploitation and tourism, 48
have introduced external pressures to the local environment and biological diversity. All 49
issues described above are closely correlated with the dynamics of the active layer as 50
well as beneath permafrost, e.g. growth or degradation. 51
As the highest terrestrial unit, abundance of studies has been conducted in TP 52
because of its significance for global and regional sustainable development, including 53
climate change and carbon emission (Liu et al., 2009; Wu et al., 2010), tectonics and 54
earthquake (Ismail-Zadeh et al., 2007; Loveless and Meade, 2011; Qiao et al., 2011), 55
water balance (Niu et al., 2011; Wang et al., 2009a,b) and permafrost environment (Jin 56
et al., 2008; Wu and Zhang, 2008, 2010; Yang et al., 2004). However, the estimation of 57
surface movements over permafrost environment, particularly in TP, using spaceborne 58
Synthetic Aperture Radar Interferometry (InSAR) (Chen et al., 2012b) is still inadequate. 59
Differential InSAR (DInSAR) (Massonnet et al., 1993), one of the quantitative remote 60
sensing technologies, has proved to be effective for ground motion detection by 61
measuring the phase difference of two or multi-temporal SAR acquisitions (Chen and Lin, 62
2011; Hooper et al., 2012). The development of Multi-Temporal SAR Interferometry 63
(MT-InSAR), which mitigates the intrinsic limitations of the traditional DInSAR (spatial-64

temporal decorrelation as well as atmospheric disturbance); and thus is capable of 65
deriving surface motion rates with millimetric accuracy using large datasets over the 66
same area. In general, MT-InSAR can be divided into two main categories, including 67
Persistent Scatterer (PS) (Ferretti et al., 2000; Hooper et al., 2004) and Small BAseline 68
Subsets (SBAS) (Berardino et al., 2002; Chen et al., 2010, 2012a; Jiang et al., 2011; Lanari 69
et al., 2004; Lin et al., 2011). The former concentrates on the phase analysis of PS points 70
using single reference interferogram formation; in contrast, the alternative prefers to 71
extract information from distributed scatterer (DS) points with the aid of multi-72
references interferogram formation based on the small baseline constraint. 73
The past investigation demonstrated that, in the permafrost environment of TP, the 74
DS points are prevalent except for the artificial structures, e.g. the embankment of 75
Qinghai-Tibet Railway (QTR) (Chen et al., 2012b). Consequently, in order to extract 76
information as much as possible, the SBAS is introduced for the evolution analysis of the 77
active layer and permafrost. In total, 19 L-band ALOS PALSAR SLC images (acquired from 78
June 2007 to December 2010) are employed to cover the Beiluhe experimental site, Hoh 79
Xil natural reserve in TP of China. The subsequent sections will be organized as follows: 80
In Sect. 2, the study site and data are firstly described. Then, a re-call SBAS methodology 81
and its corresponding procedures are shown in Sect. 3 for easily understanding. After 82
that, the SBAS derived results are shown and then interpreted in Sect. 4. Taking natural 83
slopes and the QTR as instances, Sect. 5 shows the discussion of surface displacements 84
with respect to permafrost environments, geomorphological processes as well as 85
anthropogenic activities. Finally, some conclusions are drawn. 86

2. Study area and datasets 87
For the easy accessibility and available ground-based measurements, the Beiluhe, Hoh 88
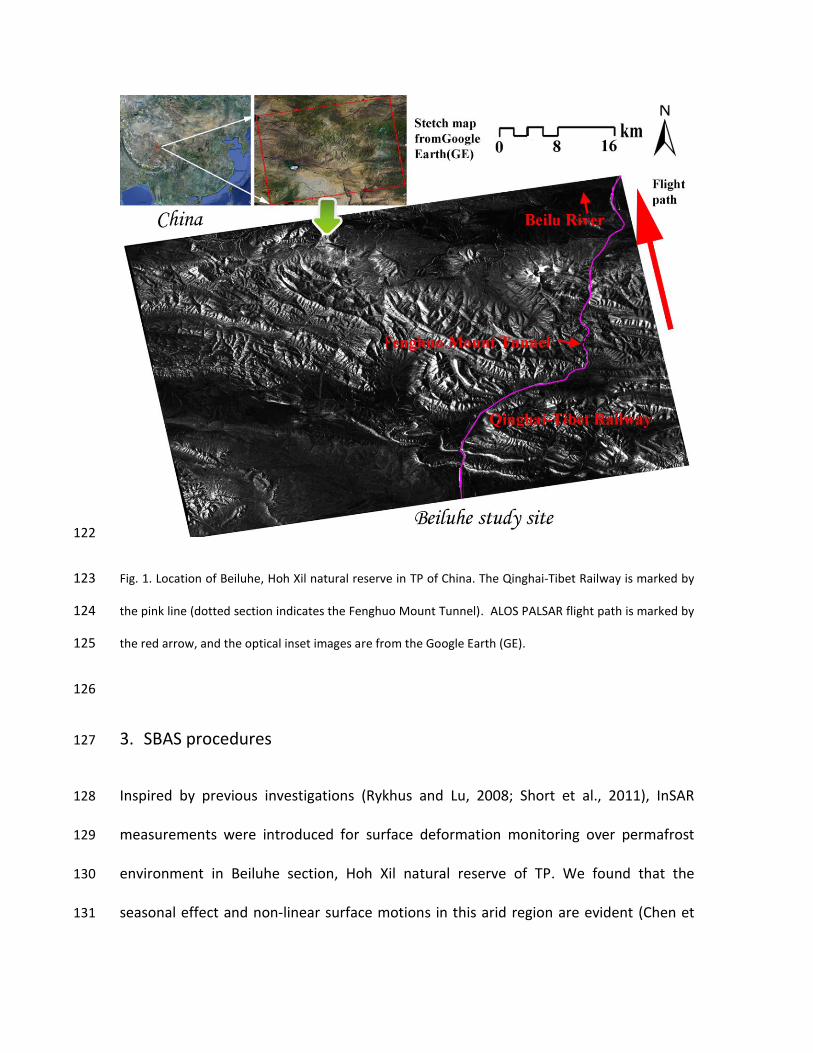
Xil natural reserve, TP of China is selected as the experimental site (see Fig.1), 89
approximately extending from 92°16′to 93°1′E and from 34°5′to 34°55′N. 90
The temporal averaged amplitude SAR image in Fig. 1 shows the study site coverage 91
with a spatial extent of 63×45 km2 approximately. The QTR can be easily indentified 92
due to its strong backscattering characteristic, as marked by the pink line (the dotted 93
section indicates the Fenghuo Mount Tunnel). The topography of this site is composed 94
by upland in the middle section in NW-SE direction represented by Fenghuo Mount, 95
Ri’achi Mount; and mild terrain in the northeast and southwest represented by Beiluhe 96
valley and Erdaogou valley. The arid continental climate is prevailing due to the high 97
elevation (from 4500 to 5200 m). Compared with the scarce precipitation 98
(approximately 300-400 mm yr-1), the evaporation is about 2-3 times higher, resulting in 99
arid condition owing to the negative water budget. However, warm and ice-rich 100
permafrost (WIRP) is well developed in several sub-regions, particularly surrounding the 101
above two valleys with mild terrain, high soil moisture as well as relatively warm ground 102
temperature (-1.8 to -0.5℃). Generally, compared with mountainous regions, the sub-103
surface temperature and ice-content of the active layer and permafrost beneath are 104
both higher in mild-terrain valley terraces; thawing islands could even exist through 105
WIRP regions in case of the occurrence of rivers and geothermal heat flows. 106
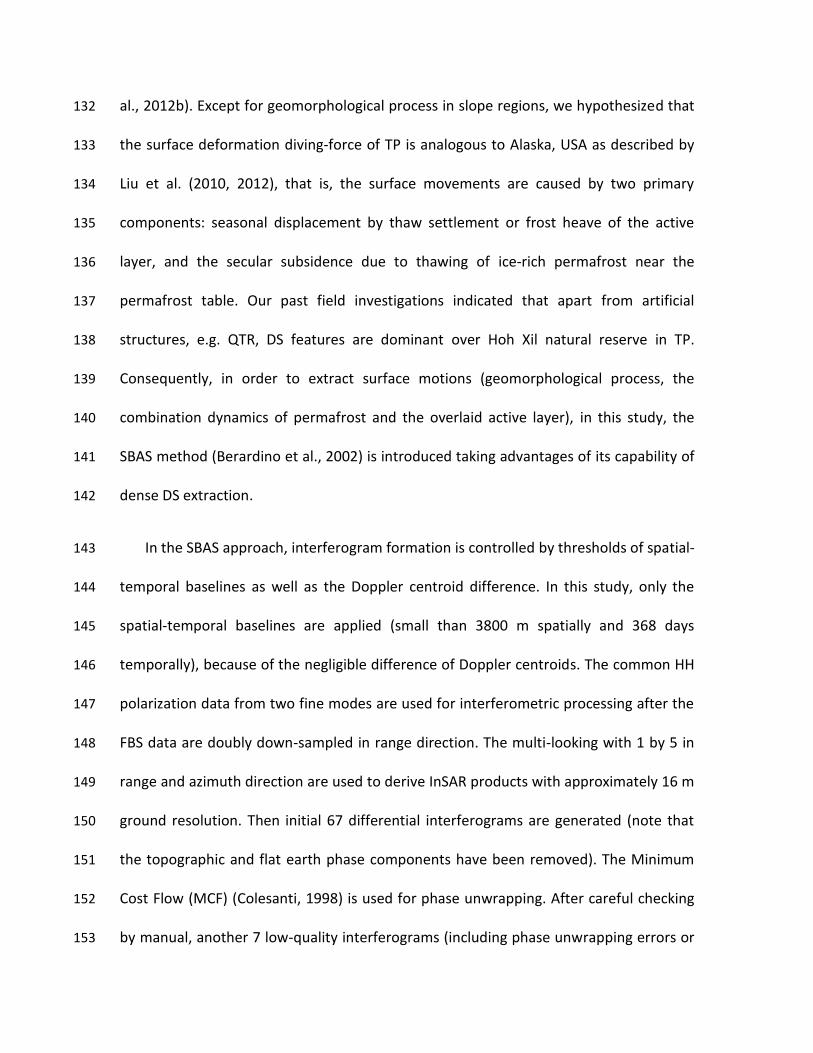
19 ALOS PALSAR images acquired with ascending orbit and 34.3-degree nominal 107
radar look angle, from June 2007 to December 2010, were used in this study, including 9 108
scenes of Fine Beam Single polarization (FBS, 28 MHz) and 10 scenes of Fine Beam Dual 109
polarization (FBD, 14 MHz). Interested readers can refer to Chen et al., (2012b) for more 110
details. The ALOS PALSAR data were obtained from the Japan Aerospace Exploration 111
Agency (JAXA). In general, ALOS PALSAR has two advantages for the TP region 112
monitoring: firstly, PALSAR works with a longer wavelength (L-band, 23.6 cm), enabling 113
to better penetrate vegetation and resulting in high quality interferograms; secondly, 114
the ground resolution of PALSAR (8 m of FBS and 16 m of FBD) is higher than other 115
median resolution data (e.g. 25-30 m of ERS-1/2 and Envisat ASAR), and thus preserves 116
more detailed information. For the topographical data, 3-arcsecond Shuttle Radar 117
Topography Mission (SRTM) DEM data from the United States Geological Survey (USGS) 118
were applied, firstly for the topographic phase removal in DInSAR procedures, and then 119
for InSAR products geocoding. 120
121
122
Fig. 1. Location of Beiluhe, Hoh Xil natural reserve in TP of China. The Qinghai-Tibet Railway is marked by 123
the pink line (dotted section indicates the Fenghuo Mount Tunnel). ALOS PALSAR flight path is marked by 124
the red arrow, and the optical inset images are from the Google Earth (GE). 125
126
3. SBAS procedures 127
Inspired by previous investigations (Rykhus and Lu, 2008; Short et al., 2011), InSAR 128
measurements were introduced for surface deformation monitoring over permafrost 129
environment in Beiluhe section, Hoh Xil natural reserve of TP. We found that the 130
seasonal effect and non-linear surface motions in this arid region are evident (Chen et 131
al., 2012b). Except for geomorphological process in slope regions, we hypothesized that 132
the surface deformation diving-force of TP is analogous to Alaska, USA as described by 133
Liu et al. (2010, 2012), that is, the surface movements are caused by two primary 134
components: seasonal displacement by thaw settlement or frost heave of the active 135
layer, and the secular subsidence due to thawing of ice-rich permafrost near the 136
permafrost table. Our past field investigations indicated that apart from artificial 137
structures, e.g. QTR, DS features are dominant over Hoh Xil natural reserve in TP. 138
Consequently, in order to extract surface motions (geomorphological process, the 139
combination dynamics of permafrost and the overlaid active layer), in this study, the 140
SBAS method (Berardino et al., 2002) is introduced taking advantages of its capability of 141
dense DS extraction. 142
In the SBAS approach, interferogram formation is controlled by thresholds of spatial-143
temporal baselines as well as the Doppler centroid difference. In this study, only the 144
spatial-temporal baselines are applied (small than 3800 m spatially and 368 days 145
temporally), because of the negligible difference of Doppler centroids. The common HH 146
polarization data from two fine modes are used for interferometric processing after the 147
FBS data are doubly down-sampled in range direction. The multi-looking with 1 by 5 in 148
range and azimuth direction are used to derive InSAR products with approximately 16 m 149
ground resolution. Then initial 67 differential interferograms are generated (note that 150
the topographic and flat earth phase components have been removed). The Minimum 151
Cost Flow (MCF) (Colesanti, 1998) is used for phase unwrapping. After careful checking 152
by manual, another 7 low-quality interferograms (including phase unwrapping errors or 153

significant ionospheric component of atmosphere) are discarded to derive 60 final 154
interferograms for further motion estimation and time series analysis, as illustrated in 155
Fig. 2. It is clear that the PALSAR perpendicular baseline is correlated with the time of 156
acquisition (Samsonov, 2010), implying the suitability of SBAS method for the TP 157
investigation in the case of isolated interferogram subsets in time. In addition, taking 158
advantages of SBAS, the small baseline formation further mitigates topographic errors 159
before parameters (e.g. residual height, displacements and atmospheric disturbance) 160
inversion. 161
In general, the implementation of SBAS is comprised of two main steps. The first step 162
is the estimation of low-pass displacement and residual height using a preferred cubic 163
displacement model. The Coherent Point (CP) candidates are characterized by a high 164
average spatial coherence. The CP with the maximum value is selected as the reference 165
point. In this step, the Least Squares (LS) algorithm is applied for parameters inversion. 166
The second step is concentrated on the displacement time series retrieval and 167
atmospheric artifacts isolation. That is, a) we derive residual phases by subtracting the 168
low-pass component signatures (derived in the first step) from the original differential 169
interferograms; b) we unwarp residual phases, and then calculate the improved 170
interferogram phases by adding back the previous low-pass components; c) we estimate 171
motion time series using the Singular Value Decomposition (SVD) algorithm; d) we 172
derive refined residual phases by subtracting the low-pass deformation component 173
from the motion time series; e) we estimate atmospheric artifact phases using 174
temporal-spatial filters ( firstly a temporal high-pass and then a spatial low-pass); f) we 175

derive the final deformation components after the atmospheric artifacts isolation. Note 176
that final CPs are further identified by the temporal coherence with respect to a defined 177
displacement model. 178
179
180
Fig. 2. Spatial-temporal distribution of interferogram formation based on the small baseline constraint. It 181
is clear that the perpendicular baselines are correlated with the acquisition time. The number 12 image 182
marked in yellow is the reference image acquired on 26 September 2009 for the dataset co-registration. 183
The image marked in red is discarded because of its evident atmospheric disturbance. 184
185
4. Results, validation and monitoring interpretation 186

Using the two thresholds (0.4 average spatial coherence and 0.6 temporal coherence), 187
the SBAS derived surface displacement rates in line-of-sight (LOS) over Beiluhe section, 188
Hoh Xil natural reserve of TP are illustrated in Fig. 3. The negative motion rates’ sign is 189
indicative of an increasing distance with time away from the satellite (subsidence); and 190
positive sign represents an uplift motion. The result indicates that the surface motion in 191
permafrost environment is evident, primarily in the range of -30 mm yr-1 to 30 mm yr-1 192
in the 3.5-yr observation span (from June, 2007 to December, 2010). The InSAR-derived 193
results have been validated by leveling data located nearby the Fenghuo Mount Tunnel 194
frontier (marked by the cross in Fig. 3). The two different types of data demonstrate 195
consistent motion trends with absolute discrepancies varying from 0.5 to 4 mm yr-1 196
(please refer to Chen et al., 2012b for more details). There are totally 8025313 CPs over 197
the study site with approximately 63×45 km2, that is, 2800 CPs km-2. The high spatial 198
density of CPs is determined by following two aspects. Firstly, PALSAR has a long 199
wavelength, resulting in high penetration and coherence preservation, particularly in 200
non-urban areas, e.g. TP. Second, the small baseline strategy is introduced in 201
interferometric formation, and thus high-quality interferograms can be guaranteed, 202
resulting in high spatial density of CP candidates and then the final CPs. 203
In order to interpret the motion trends (magnitude and direction), particularly for 204
slope regions, the relationship between SAR imaging geometry (ascending with 34.3 205
degree looking angle in this case) and the surface displacement is analyzed (see Fig. 4). 206
With a few exceptions, the direction of surface movements holds the following 207
assumption: the parallel movement, caused by the shallow-seated landslides, is 208

dominant in the middle section of slopes; vice versa, for other portions, landslides are 209
rare and the rotational motion is prevalent caused by the alluvial accumulation or the 210
combination dynamics of permafrost and the overlaid active layer, such as the secular 211
subsidence due to ice-rich permafrost thawing near the permafrost table. That is, in the 212
upper section of slopes, the rotational motions from both sides demonstrate consistent 213
movements: frost heave as uplifts in LOS and thaw settlement as subsidence in LOS, as 214
marked by ‘a’ , ‘aa’ and ‘b’, ‘bb’. For the slope facing the satellite, the downslope 215
movement of material on the steep section (angle of gradient > 34.3 degree) 216
demonstrates as mild subsidence (marked by ‘c1’) and on the moderate section (angle of 217
gradient < 34.3 degree) demonstrates as mild uplift (marked by ‘c2’); in contrast, those 218
two motion components both demonstrate as obvious subsidence on the backslope (see 219
‘cc’). Regarding to valley regions with flat terrain (the foot of slopes), the actual motion 220
trend from both sides can be measured as uplift (marked by ‘d’ and ‘dd’, respectively) 221
when the deposition or heave is dominant, and vice versa, measured as subsidence 222
(marked by ‘e’ and ‘ee’, respectively) when the thaw settlement is prevalent. 223
From Fig. 3, it is clear that the majority of active layers (60% to 65%) are relatively 224
stable in a relatively short 3.5-yr observation period, in the range of -10 mm yr-1 to 10 225
mm yr-1. Significant movements occur in two cases, including mountainous slopes and 226
flat WIRP areas. The correlation between InSAR results with topography is a convincing 227
clue for geomorphological processes, because errors from topography and atmospheric 228
disturbances have been isolated by the SBAS algorithm. In addition, CPs cannot be 229
existent in radar shadow or layover areas according to the extraction rule of target 230

points. Therefore, the detected distinct uplifts in Fig. 3 are highly related to slopes 231
processes (interpreted by the downward movements of ‘c2’ in Fig. 4) rather than 232
permafrost or the active layer growth under climate warming trends. Furthermore, a 233
few isolated uplifts (with values larger than 20 mm yr-1) located in high altitudinal 234
mountains are highly related to the frost heave because of the low temperature 235
throughout of years (interpreted by ‘a’ and ‘aa’ in Fig. 4). The remaining moderate-236
severe subsidence surface, with values in the range of -35 mm yr-1 to -10 mm yr-1, 237
corresponds to mountainous slopes or mild-terrain WRIP regions. The subsidence on 238
backslopes is caused by the transitional movement of unconsolidated material, again 239
due to geomorphological processes (interpreted by ‘cc’ in Fig. 4). Then, the district 240
settlement on WRIP areas is caused by the combination of thaw settlement of the active 241
layer as well as permafrost thawing near the permafrost table (interpreted by ‘e’ and 242
‘ee’ in Fig. 4). 243
Note that the tectonic motion in TP is not negligible, confirmed by the investigation 244
of Cavalie et al. (2008) and Loveless & Meade (2011). The nominally interseismic GPS 245
velocities (calibrated by a stable Eurasian reference frame) in recent years demonstrate 246
that the tectonic movement over Beiluhe section, Hoh Xil natural reserve of TP is around 247
15 mm yr-1 in SW-NE direction (approximately perpendicular to the fight path of ALOS 248
PALSAR). This will introduce a global subsidence contribution in LOS direction with 249
values in the range of -7 mm yr-1 to -8 mm yr-1 in the Beiluhe site. However, as we 250
known, the SBAS results only measure the relative displacements compared with a local 251

reference point, and thus this homogeneous bias is not taken into consideration when 252
the study site coverage is much smaller than 500×500 km2. 253
254
255
Fig. 3. SBAS-derived surface displacement linear rates over Beiluhe, Hoh Xil natural reserve of TP in LOS 256
direction. The red rectangle represents a slope in Fenghuo Mount. The Qinghai-Tibet Railway is marked 257
by the pink line. The cross marks the location of leveling data (nearby the Fenghuo Mount Tunnel frontier) 258
for SBAS results validation. The satellite was travelling in the direction of the red arrow and looking in the 259
direction of the blue arrow. 260
261

262
Fig. 4. The relationship between surface movements and InSAR detected displacements in LOS direction, 263
particularly for mountainous regions. 264
265
5. Discussions 266
Liu et al. (2010) found that the causes of surface deformation over permafrost regions 267
are complicated. At local scales, the deformation could be controlled by local surface 268
vegetation, soil deposits, water/ice content, active layer thickness, hydrological settings 269
and etc. On the other hand, the secular surface subsidence could be another driving-270
force due to thawing of ice-rich permafrost beneath the active layer under global 271
warming. In this paper, the quantitative deformation discrimination of permafrost and 272
overlaid active layer is out of scope (interested readers please refer to Liu et al., 2010, 273
2012); instead, from another aspect, the contributions to InSAR signals from 274
geomorphological process and anthropogenic activities will be further discussed. 275

276
5.1 Mountainous slopes 277
Past field investigations indicated that the land cover in the Beiluhe site is relatively 278
sparse, scattered by alpine meadows in flat valleys owing to the relatively higher soil 279
moisture. In the TP arid and cold environment, the mountains are exposed by rocks or 280
weathered deposits. Those covers are unconsolidated because of heavily decomposed 281
rocks as well as sparse vegetation. Consequently, when the shearing force (triggered by 282
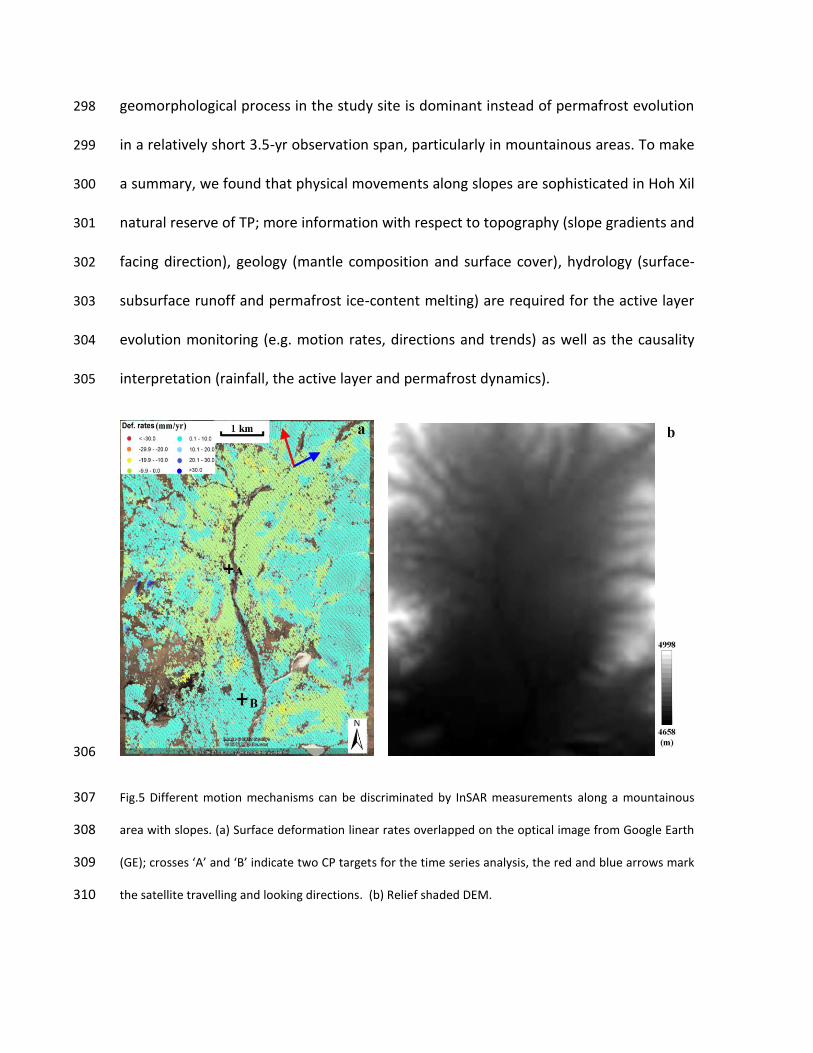
the surface overflow and shallow groundwater flow) exceeds a threshold, a shallow-283
seated landslide occurs. Fig. 5 (a) shows the surface deformation field over a mountain 284
region nearby Fenghuo Mount. Referring to relief-shaded DEM in Fig. 5(b), it is clear that 285
uplifts in LOS direction are dominated in the upper-middle section (slope gradient > 34.3 286
degree) of slopes primarily owing to slope processes (can be interpreted by ‘c2’ in Fig. 4). 287
The frost heave (interpreted by ‘a’ and ‘aa’ in Fig. 4) can be another cause although its 288
contribution is low due to the global warming trend. In the middle-lower section (slope 289
gradient < 34.3 degree), the downward transitional movement (parallels to the bedrock 290
beneath) is prevailing, indicating moderate-evident subsidence (interpreted by ‘c1’-‘cc’ 291
in Fig. 4). The deposit accumulation is dominated at the foot of slopes, and thus derived 292
InSAR measurements demonstrate as mild uplifts again (interpreted by ‘d’ and ‘dd’ in Fig. 293
4). In addition, the time series of two typical CPs (marked by ‘A’ and ‘B’ in Fig.5) is 294
further analyzed, as illustrated in Fig. 6. The seasonal variation is remarkable, revealing 295
the influence of southeastern Asian monsoons as well as the seasonal displacement of 296
the active layer due to the frost heave and thaw settlement. It implies that the 297
geomorphological process in the study site is dominant instead of permafrost evolution 298
in a relatively short 3.5-yr observation span, particularly in mountainous areas. To make 299
a summary, we found that physical movements along slopes are sophisticated in Hoh Xil 300
natural reserve of TP; more information with respect to topography (slope gradients and 301
facing direction), geology (mantle composition and surface cover), hydrology (surface-302
subsurface runoff and permafrost ice-content melting) are required for the active layer 303
evolution monitoring (e.g. motion rates, directions and trends) as well as the causality 304
interpretation (rainfall, the active layer and permafrost dynamics). 305
306
Fig.5 Different motion mechanisms can be discriminated by InSAR measurements along a mountainous 307
area with slopes. (a) Surface deformation linear rates overlapped on the optical image from Google Earth 308
(GE); crosses ‘A’ and ‘B’ indicate two CP targets for the time series analysis, the red and blue arrows mark 309
the satellite travelling and looking directions. (b) Relief shaded DEM. 310

311
312
Fig. 6. Displacement time series of two typical CP targets (marked by crosses in Fig.5); (a) the subsidence, 313
(b) the uplift. The seasonal variation is obvious. 314
315
5.2 Qinghai-Tibet Railway 316
The QTR project is a 100-yr grand plan; therefore its embankment instability needs to be 317
well monitored to avoid potential geo-hazards. The embankment deformation 318
surveillance has been covered by recent preliminary studies (Li et al., 2009; Zhang et al., 319
2010). In this investigation, the classical SBAS is applied considering the correlation 320

between perpendicular baselines and acquisition times of ALOS PALSAR (Samsonov 321
2010); in such a way, the velocity rates noise can be further reduced primarily owing to 322
the enhanced quality of inteferograms using the small baseline strategy, as illustrated in 323
Fig. 7(a). Except for few uplifts due to proactive “cooling down” measures (Yu et al., 324
2008), see Fig. 7(b), the surface subsidence along the embankment of QTR is dominant, 325
primarily in the range of -25 mm yr-1 to -10 mm yr-1. This is probably caused by the 326
combination of the increased compression settlement, destroyed active layer as well as 327
depressed soil heat release. In general, the QTR tends to run through mild-terrain 328
valleys considering the construction feasibility of the embankment, bringing challenges 329
of the surface vulnerability caused by the co-occurrence of WIRP regions. Human 330
activities, e.g. the embankment construction, easily break the original balance of the 331
active layer, resulting in remarkable settlements from following aspects: firstly, the 332
train-induce compression and the temperature increment of sub-surface jointly speed 333
up the thawing settlement of the active layer in a short period (approximately 5-10 334
years); second, in a long-term, the secular subsidence due to thawing of ice-rich 335
permafrost triggered by anthropogenic activities is another contribution, particularly 336
under global warming. The motion trend of the embankment along the QTR has been 337
exploited by the improved Interferometric Point Target Analysis (IPTA) approach in our 338
previous study (Chen et al., 2012b). Compared with the previous one, the signal-to-noise 339
ratio of deformation rates in this investigation have been significantly improved, 340
resulting in easy identification for potentially risky sections, which is indeed significant 341
for the management of the QTR embankment. 342
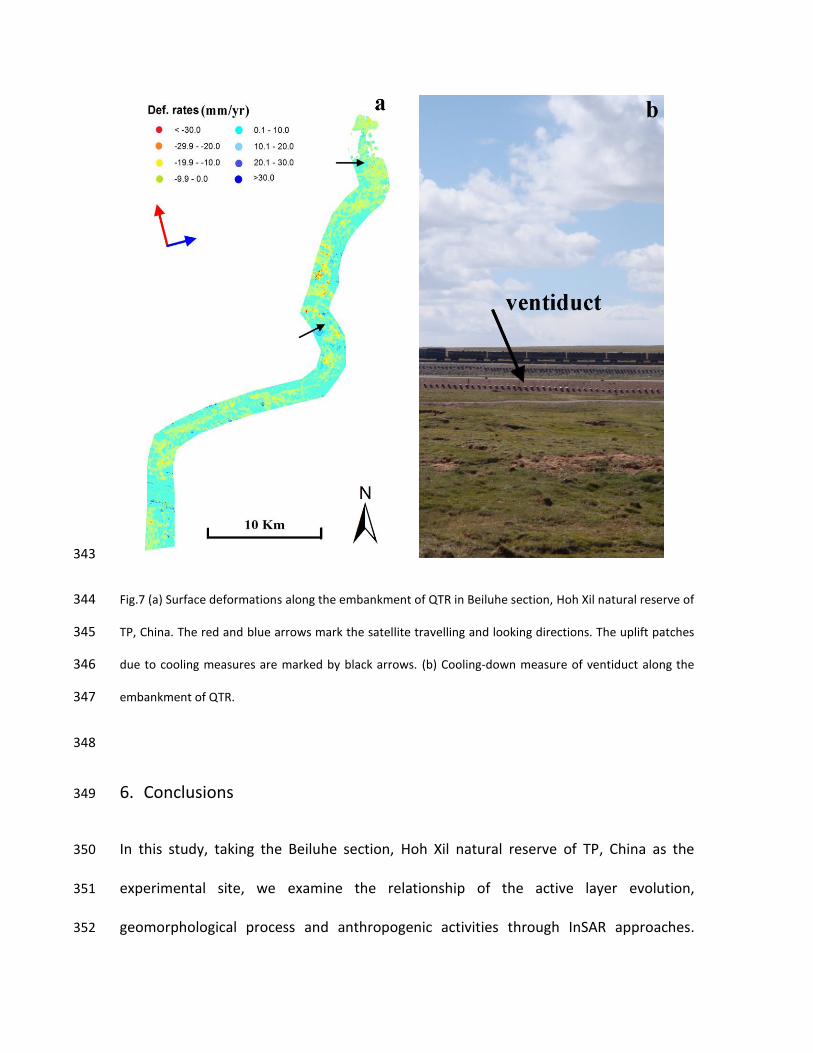
343
Fig.7 (a) Surface deformations along the embankment of QTR in Beiluhe section, Hoh Xil natural reserve of 344
TP, China. The red and blue arrows mark the satellite travelling and looking directions. The uplift patches 345
due to cooling measures are marked by black arrows. (b) Cooling-down measure of ventiduct along the 346
embankment of QTR. 347
348
6. Conclusions 349
In this study, taking the Beiluhe section, Hoh Xil natural reserve of TP, China as the 350
experimental site, we examine the relationship of the active layer evolution, 351
geomorphological process and anthropogenic activities through InSAR approaches. 352

Apart from the probable tectonic activity, the SBAS derived results indicate that the 353
movement of most active layers overlaid on the permafrost is relatively stable in a 3.5-yr 354
short observation period, primarily in the range of -10 mm yr-1 to -10 mm yr-1 in LOS 355
direction. In contrast, significant displacements occur in mountainous and WRIP regions. 356
The former is highly related to the geomorphological process on those unconsolidated, 357
weathered slope mantles triggered by seasonal monsoon heavy rainfalls. The latter is 358
caused by the dynamics of the active layer and the permafrost beneath; under global 359
warming, the surface over WIRP regions would be instable caused by the thawing 360
settlement of the active layer as well as the ice-rich permafrost beneath. The main 361
conclusions of this work can be summarized as follows. 362
1. Instead of PS points, the CP targets in the permafrost environment are prevalent; 363
this phenomenon determines the feasibility of SBAS. Totally 8025313 CPs over 364
the study site (63×45 km2) are extracted with the temporal coherence 365
threshold of 0.6, that is, 2800 CPs km-2. Referring to the Figs. 1 and 3, it is clear 366
that the majority of land covers are identified as DS targets, except for the water 367
body (e.g. Beilu River) and sandy-bare ground around the Beiluhe valley because 368
of the mirror scattering. The high density of DSs is jointly determined by the 369
small baseline interferometric formation and L-band long wavelength of ALOS 370
PALSAR data. In addition, the isolated interferogram clusters in the time domain 371
(due to the corrective satellite orbit manoeuvre of PALSAR) further implies the 372
suitability of the applied SBAS for this case study. 373

2. The movement of the overlaying active layer in slopes is more remarkable 374
compared with other natural scenarios. This phenomenon is primarily 375
determined by the erosion on unconsolidated surface triggered by heavy 376
rainfalls in summer due to the southeastern Asian monsoons. Furthermore, the 377
motion trend indicates a notable seasonal variation, implying seasonal thaw 378
settlements and frost heaves of the active layer. The slopes in this arid and cold 379
region are covered by heavily weathered mantles with bare or sparse vegetation. 380
The stability is vulnerable under the external driving-force from intense rainfalls, 381
resulting in landslide occurrences. The hypothesis model of surface movements 382
in slopes has been interpreted and validated; that is, the transitional motion is 383
dominant in the middle section, and then gradually transformed into rotational 384
displacement due to deposits accumulation at the foot of slopes. 385
3. The QTR and its neighborhood are suffering from much obvious surface 386
subsidence than surrounding features (in the range of -25 mm yr-1 to -10 mm yr-387
1). This phenomenon reveals the human activity response to the evolution of the 388
active layer as well as beneath permafrost, particularly in WIRP regions: firstly, 389
geological conditions as well as the land cover along the embankment have 390
been changed during the construction, resulting in aggravated active layer 391
erosion and then remarkable surface settlements due to the thawing impact 392
from the active layer and beneath permafrost. Second, the compression of the 393
underlying permafrost soil has been accelerated from the downward pressure 394
induced by the rocky foundation as well as running trains, particularly in a short-395
term (within 5 years) after the QTR’s operation. Last but not least, the moisture-396
heat balance between the active layer and air has been destroyed; resulting in 397
thaw subsidence due to the raised sub-surface temperature, particularly under 398
global warming. 399
As described in Sect. 3, in order to derive interferograms with high quality, multi-400
looking is applied at sacrifice of spatial resolution loss. More recently, several innovative 401
methods (Ferretti et al., 2011; Hooper, 2008) have been proposed by synergistically 402
using PS and DS to increase the spatial density of detected targets in natural scenarios 403
and meanwhile preserve the original spatial resolution. Thereby, in future, those novel 404
methods will be further investigated in the Hoh Xil natural reserve of TP, plus using high-405
resolution, newly-launched spaceborne SAR systems (e.g. TerraSAR-X, Cosmo-SkyMed 406
and Radarsat-2) to extract more accurate seasonal motions and corresponding time 407
series, taking advantages of shorter revisit cycles (Bovenga et al., 2012). 408
409
Acknowledgement. This study has been supported by funding from the Research Grants 410
Council of the HKSAR, China (450210), the Innovation and Technology Support 411
Programme of HKSAR, China (ITS/152/11FP), the National Natural Science Foundation of 412
China (41201455), and Hundred Talents Program of the Institute of Remote Sensing and 413
Digital Earth, Chinese Academy of Sciences. We thank the Associate Editor and 414
anonymous reviewers for their constructive and insightful comments. The digital 415
elevation model of the investigated zone was acquired through the SRTM archive. The 416

original ALOS PALSAR data were provided by the Japan Aerospace Exploration Agency 417
(JAXA). 418
419
420
References 421
Berardino, P., Fornaro, G., Lanari R., Sansosti E.: (2002). A new algorithm for surface 422
deforamtion monitoring based on small baseline differential SAR interferograms. IEEE 423
Transactions on Geoscience and Remote Sensing, 40(11), 2375-2383. 424
Bovenga, F., Wasowski, J., Nitti, D.O., Nutricato, R., Chiaradia, M.T.: (2012). Using 425
COSMO/SkyMed X-band and ENVISAT C-band SAR interferometry for landslides analysis. 426
Remote Sensing of Environment, 119, 272-285, 2012. 427
Cavalie, O., Lasserre, C., Doin M.-P., Peltzer, G., Sun, J., Xu, X. and Shen Z.-K.: (2008). 428
Measurement of intersismic strain across the Haiyuan fault (Gansu, China), by InSAR. Earth 429
and Planetary Science Letters, 275, 246-257. 430
Chen, F. and Lin, H.: (2011). Multi-baseline differential SAR interferometry analysis of Lantau 431
Highway, Hong Kong, using Envisat ASAR data. Remote Sensing Letters, 2(2), 167-173. 432
Chen, F., Lin, H., Yeung, K. and Cheng, S.: (2010). Detection of slope instability in Hong Kong 433
based on multi-baseline differential SAR interferometry using ALOS PALSAR data. GIScience 434
and Remote Sensing, 47, 208-220. 435

Chen, F., Lin, H., Zhang, Y. and Lu, Z.: (2012a). Ground subsidence geo-hazards induced by rapid 436
urbanization: implications from InSAR observation and geological analysis. Natural Hazards 437
Earth System Science, 12, 935-942. 438
Chen, F., Lin, H., Li, Z., Chen, Q. and Zhou, J.: (2012b). Interaction between permafrost and 439
infrastructure along the Qinghai-Tibet Railway detected via jointly analysis of C- and L-band 440
small baseline SAR interferometry. Remote Sensing of Environment,123,532-540. 441
Colesanti, M.: (1998). A novel phase unwrapping method based on network programming. IEEE 442
Transactions on Geoscience and Remote Sensing, 36,813-821. 443
Ferretti, A., Prati, C., & Rocca, F.: (2000). Nonlinear subsidence rate estimation using persistent 444
scatterers indifferential SAR interferometry. IEEE Transactions on Geoscience and Remote 445
Sensing, 38, 2202-2212. 446
Ferretti, A., Fumagalli, A., Novali, F., Prati, C., Rocca, F. & Rucci, A.: (2011). A New Algorithm for 447
Processing Interferometric Data-Stacks:SqueeSAR. IEEE Transactions on Geoscience and 448
Remote Sensing, 49, 3460-3470. 449
Guo, L. D. and Macdonald, R. W.: (2006). Source and transport of terrigenous organic matter in 450
the upper Yukon River: Evidence from isotope (delta C−13, Delta C−14, and delta N−15) 451
composition of dissolved, colloidal, and particulate phases. Global Biogeochemical Cycles, 452
20, GB2011, 12. 453
Hooper, A.: (2008). A multi-temporal InSAR method incorporating both persistent scatterer and 454
small baseline approaches. Geophysical Research Letters, 35, 1-5. 455
Hooper, A., Bekaert, D., Spaans, K., Arkan, M.: (2012). Recent advances in SAR interferometry 456
time series analysis for measuring crustal deformation. Tectonophysics, 514-517, 1-13. 457

Hooper, A., Zebker, H., Segall, P., Kampes, B.: (2004). A new method for measuring deformation 458
on volcanoes and other natural terrains using InSAR persistent scatterers. Geophysical 459
Research Letters, 31, L23611, doi:10.1029/2004GL021737. 460
Immerzeel, W., Stoorvogel, J. and Antle, J.: (2008). Can payments for ecosystem services secure 461
the water tower of Tibet? Agricultural System, 96, 52-63. 462
Ismail-Zadeh, A., Mouel, J.L.L., Soloviev, A., Tapponnier, P., Vorovieva, I.: (2007). Numerical 463
modeling of crustal block-and-fault dynamics, earthquakes and slip rates in the Tibet-464
Himalayan region. Earth and Planetary Science Letters, 258, 465-485. 465
Jiang, L., Lin, H., Ma J., Kong B., and Wang Y.: (2011). Potential of small-base SAR interferometry 466
for monitoring land subsidence related to underground coal fires: Wuda (Northern China) 467
case study. Remote Sensing of Environment, 115, 257-268. 468
Jin, H., Yu, Q., Wang, S. and Lu, L.: (2008). Changes in permafrost environments along the 469
Qinghai-Tibet engineering corridor induced by anthropogenic activities and climate warming. 470
Cold Regions Science and Technology, 53, 317-333. 471
Lanari, R., Mora, O., Manunta, M.: (2004). A small-baseline approach for investigating 472
deformations on full-resolution differential SAR interferograms. IEEE Transactions on 473
Geoscience and Remote Sensing, 42, 1377-1386. 474
Li, S., Lai, Y., Zhang, M. & Dong, Y.: (2009). Study on long-term stability of Qinghai-Tibet Railway 475
embankment. Cold Regions Science and Technology, 57, 139-147. 476
Lin, H., Chen, F., Zhao, Q.: (2011). Land deformation monitoring using coherent target-477
neighborhood networking method combined with polarimetric information: a case study of 478
Shanghai, China. International Journal of Remote Sensing, 32, 2395-2407. 479
Liu, J., Wang, S., Yu, S., Yang, D., Zhang, L.: (2009). Climate warming and growth of high-480
elevation inland lakes on the Tibetan Plateau. Global and Planetary Change, 67, 209-217. 481
Liu, L., Zhang, T., Wahr, J.: (2010). InSAR measurements of surface deformation over permafrost 482
on the North Slope of Alaska. Journal of Geophysical Research, Earth Surface, 115, F03023, 483
doi: 10.1029/2009JF001547. 484
Liu, L., Schaefer, K., Zhang, T., Wahr, J.: (2012). Estimating 1992-2000 average active layer 485
thickness on the Alaskan North Slope from remotely sensed surface subsidence. Journal of 486
Geophysical Research, Earth Surface, 117, F01005, doi:10.1029/2011JF002041. 487
Loveless, J.P. and Meade, B.J.: (2011). Partitioning of localized and diffuse deformation in the 488
Tibetan Plateau from joint inversions of geologic and geodetic observations. Earth and 489
Planetary Science Letters, 303, 11-24. 490
Massonnet, D., Rossi, M., Carmona, C., Adragna, F., Peltzer, G., Feigl, K., and Rabaute, T.: (1993). 491
The displacement field of the Landers earthquake mapped by radar interferometry. Nature, 492
364, 138−142. 493
Monastersky, R.: (2011). Permafrost science heats up in the United States. Nature, 494
doi:10.1038/nature.2011.9681. 495
Niu, F., Lin, Z., Liu, H., and Lu, J.: (2011). Characteristics of thermokarst lakes and their influence 496
on permafrost in Qinghai-Tibet Plateau. Geomorphology, 132, 222-233. 497
Qiao, X., Yang, S., Du, R., Ge, L., Wang, Q.: (2011). Coseismic slip from the 6 October 2008, 498
Mw6.3 Damxung Earthquake, Tibetan Plateau, constrained by InSAR observations. Pure and 499
Applied Geophysics, 168, 1749-1758. 500

Rykhus, R.P. and Lu, Z.: (2008). InSAR detects possible thaw settlement in the Alaskan Arctic 501
Coastal Plain. Canadian Journal of Remote Sensing, 34(2), 100-112. 502
Samsonov, S.: (2010). Topographic Correction for ALOS PALSAR interferometry. IEEE 503
Transactions on Geoscience and Remote Sensing, 48(7), 3020–3027. 504
Schuur, E.A.G., Bockheim, J., Canadell, J. G., Euskirchen, E., Field, C. B., Goryachkin, S.V., 505
Hagemann, S., Kuhry, P., Lafleur, P. M., Lee, H., Mazhitova, G., Nelson, F.E., Rinke, A., 506
Romanovsky, V. E., shiklomanov, N., Tarnocai, C., Venevsky, S., Vogel, J G., Zimov, S. A.: 507
(2008). Vulnerability of permafrost carbon to climate change: Implications for the global 508
carbon cycle. BioScience, 58, 701-714. 509
Short, N., Brisco, B., Couture, N., Pollard, W., Murnaghan, K. and Budkewitsch, P.: (2011). A 510
comparison of TerraSAR-X, RADARSAT-2 and ALOS-PALSAR interferometry for monitoring 511
permafrost environments, case study from Herschel Island, Canada. Remote Sensing of 512
Environment, 155(12), 3491-3506. 513
Tarnocai, C., Canadell, J.G., Schuur, E. A.G., Kuhry, P., Mazhitova, G., and Zimov, S.: (2009). Soil 514
organic carbon pools in the northern circumpolar permafrost region. Global Biogeochemical 515
Cycles, 23, GB2023, doi:10.1029/2008GB003327. 516
Wang, G., Hu, H., Li, T.: (2009a). The influence of freeze-thaw cycles of active soil layer on 517
surface runoff in a permafrost watershed. Journal of Hydrology, 375, 438-449. 518
Wang, G., Li, S., Hu, H., and Li, Y.: (2009b). Water regime shifts in the active soil layer of the 519
Qinghai-Tibet Plateau permafrost region, under different levels of vegetation. Geoderma, 520
149, 280-289. 521

Wang, G., Li, Y., Wang, Y. and Wu, Q.: (2008). Effects of permafrost thawing on vegetation and 522
soil carbon pool losses on the Qinghai-Tibet Plateau, China. Geoderma, 143, 143-152. 523
Wu, Q., Jiang, G. and Zhang, P.: (2010). Assessing the permafrost temperature and thickness 524
conditions favorable for the occurrence of gas hydrate in the Qinghai-Tibet Plateau. Energy 525
Conversion and Management, 51, 783-787. 526
Wu, Q. and Zhang, T.: (2008). Recent permafrost warming on the Qinghai-Tibetan Plateau. 527
Journal of Geophysical Research, 11, D13108, doi:10.1029/2007JD009539. 528
Wu, Q. and Zhang, T.: (2010). Changes in active layer thickness over the Qinghai-Tibetan Plateau 529
from 1995-2007. Journal of Geophysical Research,115,D09107, doi:10.1029/2009JD012974. 530
Yang, M., Wang, S., Yao, T., Gou, X., Lu, A. and Guo, X.: (2004). Desertification and its 531
relationship with permafrost degradation in Qinghai-Xizang (Tibet) plateau. Cold Regions 532
Science and Technology, 39, 47-53. 533
Yu, Q., Niu, F., Pan, X., Bai, Y. & Zhang, M.: (2008). Investigation of embankment with 534
temperature-controlled ventilation along the Qinghai-Tibet Railway. Cold Regions Science 535
and Technology, 53, 193-199. 536
Zhang, B., Zhang, J., and Qin, Y.: (2010). Investigation for the deformation of embankment 537
underlain by warm and ice-rich permafrost. Cold Regions Science and Technology, 60, 161-538
168. 539