surface circulation of the eastern mediterranean … circulation of the eastern mediterranean...
TRANSCRIPT

Surface circulation of the eastern Mediterranean Levantine basin:Insights from analyzing 14 years of satellite altimetry data
Yael Amitai,1 Yoav Lehahn,1 Ayah Lazar,1 and Eyal Heifetz1
Received 24 January 2010; revised 16 June 2010; accepted 8 July 2010; published 30 October 2010.
[1] The complex multiscale system circulation of the Levantine Eastern Mediterranean(EM) basin is analyzed by applying various spatiotemporal statistical methods on theAVISO 14 years (1993–2006) data set of satellite altimetry sea level anomalies. TheRossby deformation radius at the EM is at the order of 10 km, which is also thehorizontal satellite resolution. Therefore, the geostrophic currents, derived from thesatellite altimetry measurements, represent well the basin and the mesoscale circulations.The long‐term averaged mean dynamic topography (MDT) is found to capture thedifferent eddy activity regions in the EM; however, these regions are highly turbulent.The instantaneous currents in these regions can be different from the MDT‐derivedcurrents, by the same order of magnitude. Furthermore, the turbulence intensity appearsto be nonperiodic, despite of the seasonal and long‐term steric periodic variability.Because these eddies interact with the basin circulation flow, they modify it continuously.The major exception of this sporadic behavior is the Ierapetra eddy, southeast of Crete. Itappears to be forced by shear of the summer Etesian winds, created when the Cretemountain ridges block these winds and cause a funneling effect. It has a persistentseasonal signature that dominates the variance of the entire Levantine basin.
Citation: Amitai, Y., Y. Lehahn, A. Lazar, and E. Heifetz (2010), Surface circulation of the eastern Mediterranean Levantinebasin: Insights from analyzing 14 years of satellite altimetry data, J. Geophys. Res., 115, C10058, doi:10.1029/2010JC006147.
1. Introduction
[2] The surface circulation in the Levantine basin of theEastern Mediterranean (EM) is a complex multiscale system[Ozsoy et al., 1991; Pinardi and Masetti, 2000; Fusco et al.,2003], characterized by areas with strong eddy kineticenergy (EKE) [Robinson et al., 1987; Pujol and Larnicol,2005; Pascual et al., 2007]. Yet, despite its complexity,the eastern basin of the Mediterranean has not been exploredas extensively as the western basin.[3] A pioneering attempt to characterize the EM surface
circulation was made by Nielsen [1912], who constructed asimplified scheme of the basin scale surface pattern, based onfield campaigns. Subsequently, more in situ measurementswere performed to characterize the basin scale circulation[Ovchinnikov, 1966; Hecht et al., 1988; Ozsoy et al., 1989;Robinson et al., 1991]. Construction of more detailed cir-culation schemes, which also take into account the subbasinmesoscale patterns, became possible with the technologicaldevelopment of recent years such as: analysis of sequentialsatellite time series of sea surface temperature (SST)[Matteoda and Glenn, 1996; Hamad et al., 2006] and seasurface height (SSH) [Ayoub et al., 1998; Larnicol et al.,2002; Pascual et al., 2007; Rio et al., 2007]; numerical
model simulations [Tziperman and Malanotte‐Rizzoli, 1991;Lascaratos et al., 1993; Pinardi and Masetti, 2000;Alhammoud et al., 2005]; and recently, a thorough fieldcampaign was carried out, in the framework of the EGITTO/EGYPT program, [Gerin et al., 2009], which used satellite‐tracked drifters that were released in the Sicily channel aswell as in areas of specific interest in the Levantine basin.[4] Several aspects of the EM circulation are widely
agreed upon. For example, a well agreed pattern of the EMcirculation is the relatively fresh Atlantic water (AW)crossing the Sicilian channel to form the Ionian and theLevantine surface water. The AW flows eastward, becomingdenser via evaporation exceeding precipitation, and sinks inspecific northern zones to create deep and intermediate watermasses [Ovchinnikov, 1966; Hecht et al., 1988; Theochariset al., 1993].[5] Other aspects of the EM circulation are still under
debate. One of the major controversial issues is the mainpathway of the incoming AW and the governing basin scalesurface current: is it basin centered, or does it flow alongseashore slopes? The concept of a basin centered governingcurrent, is supported by the detailed, multi methodicalresearch of the EM surface circulation conducted by thePOEM (Physical Oceanography of the Eastern Mediterra-nean) group. Using multiple‐ship surveys, intercalibrateddata sets, cooperative analysis, syntheses, and modelingduring the years 1985–1992 [Ozsoy et al., 1989; Robinsonet al., 1991; Robinson and Golnaraghi, 1993; Malanotte‐Rizzoli et al., 1997], they suggested that the main feature
1Department of Geophysics and Planetary Sciences, Tel AvivUniversity, Tel Aviv, Israel.
Copyright 2010 by the American Geophysical Union.0148‐0227/10/2010JC006147
JOURNAL OF GEOPHYSICAL RESEARCH, VOL. 115, C10058, doi:10.1029/2010JC006147, 2010
C10058 1 of 11
in the Levantine basin is the Mid‐Mediterranean Jet (MMJ),from which mesoscale features, as Mersa‐Matruh andShikmona, are delineated (Figure 1b). The alternative surfacecirculation scheme, the along‐shore flow, suggested byHamad et al. [2005], and completed by Hamad et al. [2006],was constructed by tracking of SST anomalies. Their resultssupport the historical theoretic scheme suggested by Nielsen[1912] of an anticlockwise AW basin circulation, thatresults from the Coriolis force. This anticlockwise (cyclonic)circulation is assumed to be constrained along the coast byKelvin waves associated with the basin wind stress[Molcard et al., 2002], while anticyclonic eddies (e.g.,Mersa‐Matruhin Figure 1b) occupy the southern part of thebasin and export AW seaward. This scheme is further sup-ported by high‐resolution XBT in situ measurements [Fuscoet al., 2003; Zervakis et al., 2003] and by recent numericalsimulations [Alhammoud et al., 2005].[6] Another issue which is under debate is the nature of
the EM mesoscale circulation [Millot and Taupier‐Letage,
2005]. Overall one can distinguish between two mainapproaches. The first [e.g., Poem, 1992; Matteoda andGlenn, 1996; Rio et al., 2007] considers the Levantine cir-culation as composed of several distinct “building‐block”eddies which can be permanent, recurrent, or propagating.These “building‐block” eddies are the anticyclone Ierapetra,southeast of Crete; the anticyclone Mersa‐Matruh, in thesouthern part of the basin; the cyclonic Rhodes gyre, which isan area of dense water formation; and the Shikmona anti-cyclone, near the northern coast of Israel (Figure 1). Thecustomary terminology defines eddies as mesoscales that arenot constrained by the bathymetry (but can be guided by it),and thus can grow and propagate, as opposed to gyres, thatare larger circulation features, constrained by the bathymetryalong most of their periphery, thus stationary for the mostpart [Hamad et al., 2006]. The second approach [e.g.,Robinson et al., 1987; Pujol and Larnicol, 2005; Pascualet al., 2007] considers the mesoscale flow as turbulent.Therefore, rather than tracking specific eddies, it char-
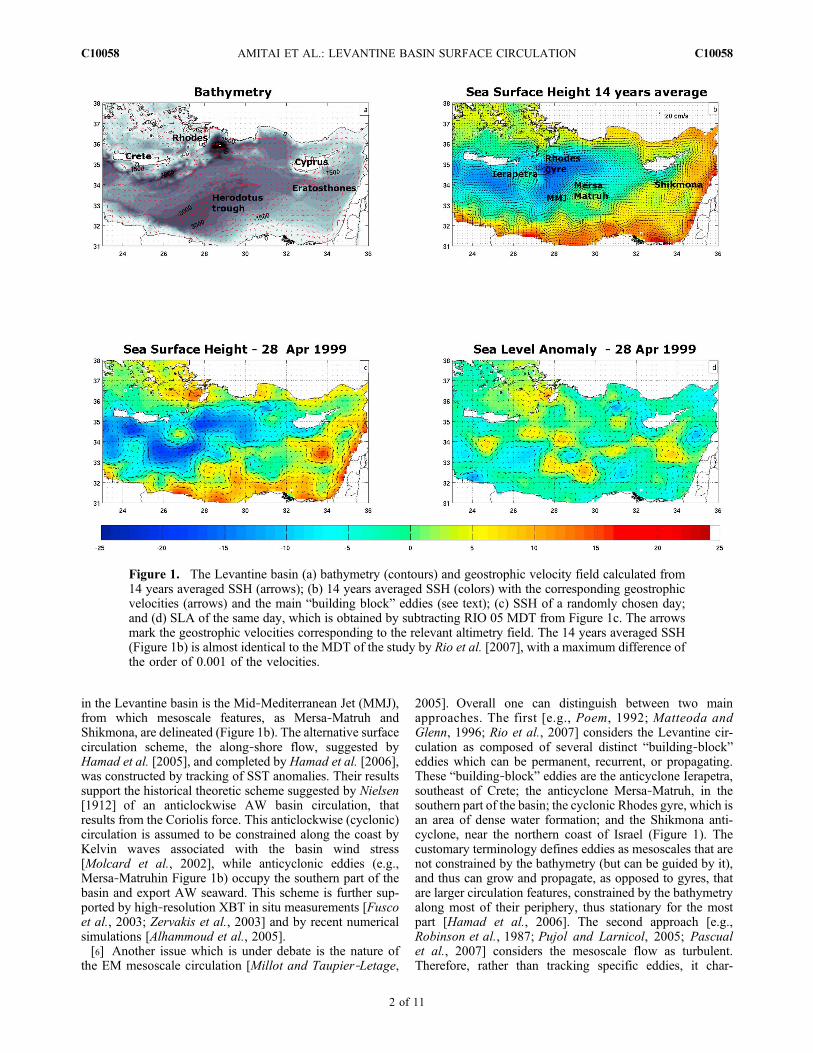
Figure 1. The Levantine basin (a) bathymetry (contours) and geostrophic velocity field calculated from14 years averaged SSH (arrows); (b) 14 years averaged SSH (colors) with the corresponding geostrophicvelocities (arrows) and the main “building block” eddies (see text); (c) SSH of a randomly chosen day;and (d) SLA of the same day, which is obtained by subtracting RIO 05 MDT from Figure 1c. The arrowsmark the geostrophic velocities corresponding to the relevant altimetry field. The 14 years averaged SSH(Figure 1b) is almost identical to the MDT of the study by Rio et al. [2007], with a maximum difference ofthe order of 0.001 of the velocities.
AMITAI ET AL.: LEVANTINE BASIN SURFACE CIRCULATION C10058C10058
2 of 11
acterizes regions in the basin according to the amount ofeddy activity accumulated there (defined by Hamad et al.[2005] as SLE). The annual and interannual eddy activityvariability is often quantified by the eddy kinetic energy(EKE). We note that both approaches indicate that there ismore mesoscale activity in the Levantine basin than otherparts of Mediterranean.[7] This work addresses some of the ambiguities
concerning our understanding of the Levantine basin surfacecirculation. This is done by analyzing the surface geostrophicvelocity field derived from 14 years (1993–2006) of satellitealtimetry data, using various spatiotemporal statisticalmethods. The satellite data, statistical methods and results aredescribed in the next section, followed by conclusions.
2. Analysis and Results
[8] The study is based on the AVISO satellite altimetrydata set of Sea surface height (SSH), for the years 1993–2006 (http://www‐aviso.cnes.fr). The distributed regionalproduct combines satellite altimetry data from the Topex/Poseidon, ERS, Jason‐1, and Envisat missions. The numberof missions merged into the final AVISO product rangesfrom 1 to 4 (Figure 2). The SSH weekly data are gridded ona (1/8° × 1/8°) regular grid. Sea level anomalies (SLA) areobtained by subtracting the Rio‐05 Mean DynamicTopography (MDT) [Rio et al., 2007] from the SSH. The
MDT is based on 7 years SSH averaging, combined withdrifting buoy data and corrected from model outputs. Thetotal and residual geostrophic currents are calculated,respectively, from the SSH and SLA, using a centered finitedifferences scheme. The derived geostrophic currents providea decent representation of both the basin and the mesoscalecirculations, since the horizontal sampling resolution is atthe order of the Rossby internal radius of deformation (12 kmin the EM).[9] One may argue that the “eddy building‐block”
approach represents the average state of the mesoscale cir-culation. Indeed, when constructing the 14 years (1993–2006) averaged geostrophic currents, obtained from theSSH, these building blocks are clearly seen (Figure 1b). Thislong‐term averaging is almost identical to the MDT pre-sented by Rio et al. [2007] to the order of 0.001 of the meanvelocities. Overall the MDT structure follows the varyingbasin bathymetry from the deep Herodotus trough in thewest to the shallow Eratosthenes sea‐mount in the east(Figure 1a). The extent to which this averaged picturerepresents the instantaneous mesoscale flow depends on theflow variability, or in other words, on its turbulent nature.Figure 1c represents a random weekly averaged snapshotwhich is quite different from Figure 1b. The Sea LevelAnomaly (SLA) in Figure 1d, which is the instantaneousSSH minus the MDT (in fact, Figure 1c minus Figure 1b), isof the same order of magnitude as the MDT. Consequently,
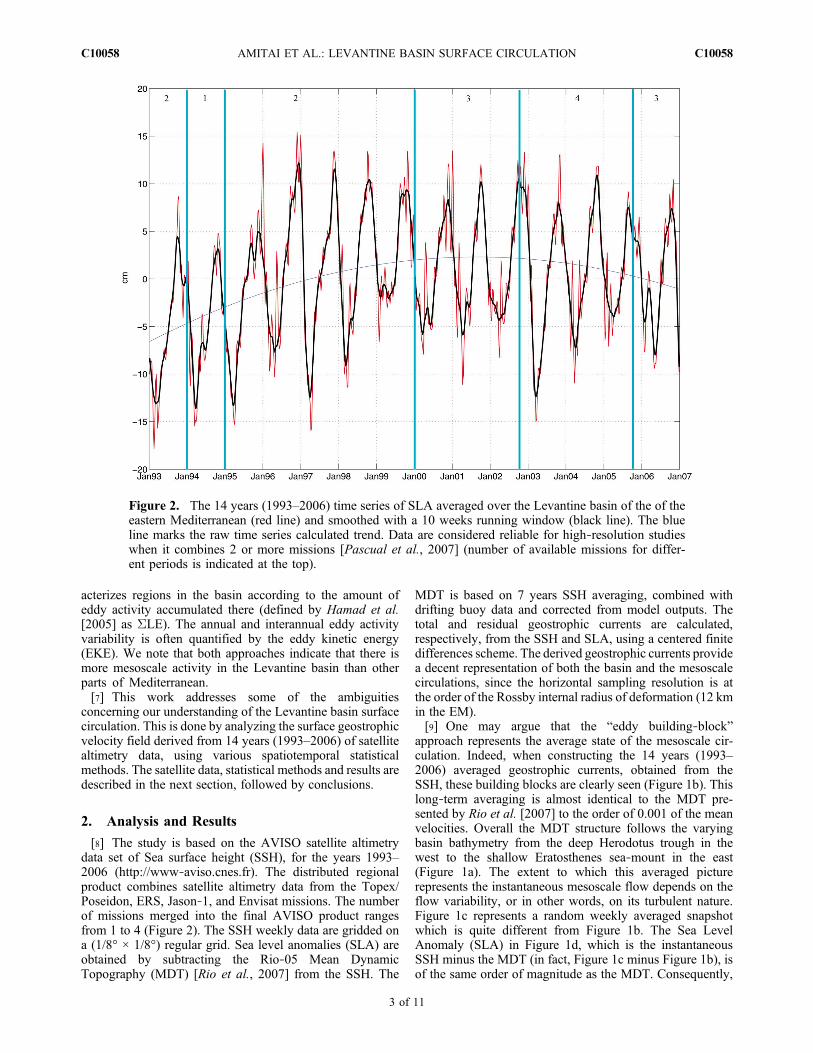
Figure 2. The 14 years (1993–2006) time series of SLA averaged over the Levantine basin of the of theeastern Mediterranean (red line) and smoothed with a 10 weeks running window (black line). The blueline marks the raw time series calculated trend. Data are considered reliable for high‐resolution studieswhen it combines 2 or more missions [Pascual et al., 2007] (number of available missions for differ-ent periods is indicated at the top).
AMITAI ET AL.: LEVANTINE BASIN SURFACE CIRCULATION C10058C10058
3 of 11

the geostrophic current derived from the SLA and the MDTare of the same order of magnitude as well. This comparisonsuggests that at least some regions in the mesoscale circu-lation are indeed variant and that the “eddy building‐block”description should be mainly applied when referring to thelong‐term averaged circulation.[10] The 14 years evolution of SLA, when spatially
averaged over the entire Levantine basin (23E‐36E/31N‐38N ‐ adopting the definition of the Levantine basin ofMillot and Taupier‐Letage [2005]), is shown in Figure 2.The SLA signal displays a distinct seasonal cycle, with lowvalues during spring and high values during fall. This sea-sonal cycle in SLA is also apparent from a Fast FourierTransform (FFT) power spectrum analysis, which is notshown here.This is commonly explained by water columndilation and contraction, associated with seasonal change inthe heat flux [Ayoub et al., 1998; Larnicol et al., 2002]. Theinterannual variation, apparent by the time series powerspectrum as well, and the observed negative trend duringthe four last years of the data set are in agreement withCazenave et al. [2002] and recently, with Criado‐Aldeanuevaa et al. [2008].[11] In order to examine the spatial nature of the Levantine
surface circulation variability, we apply an EmpiricalOrthogonal Function (EOF) analysis on the SLA field. Thefirst EOF, accounting for 73.6% of the total variance, ispresented in Figure 3 (the second and the third modes areaccount for only 2.74% and 2.49% of the total variance, thusthey are statistically insignificant). The most prominentfeature in the first EOF is the strong Ierapetra anticyclone,southeast of Crete, however a careful look reveals featuressuch as the Rhodes gyre and the anticyclone south ofIerapetra (which might be a different appearance of Ierapetrain several years [Larnicol et al., 2002]). Contrasting Figure 3with the MDT structure in Figure 1b, it is evident that only
the Ierapetra can be regarded as a recurrent “building‐blockeddy”.[12] EOF analysis indeed tends to intensify signature of
stationary eddies, but to smear signature of propagatingeddies. Therefor next, we look at the Eddy Kinetic Energy(EKE) time series and Hovmoller diagram to examine thespatiotemporal nature of these propagating eddies.[13] The geostrophic current anomalies are proportional to
the horizontal derivatives of the SLA [u′g = (g/f )bk × rh,where u′g is the geostrophic current anomalies, g is gravity,f is the Coriolis parameter, bk is the perpendicular unit vector,and h is the SLA]. The horizontal derivative of the basinsteric effect (which is the spatial average over h, hhi) that isindicated in Figure 2, is zero. Therefore the anomalies shouldnot be directly affected by the basin seasonal variations.[14] The basin’s EKE is characterized by a distinct annual
cycle (Figures 4a–4b), and a distinct, but weaker, half‐annual signal. A decadal variability is also evident in theLevantine basin’s time series. In order to examine thisvariability in detail we look at the time series, and its cor-responding power spectrum, of the five most energeticsubregions that contribute mostly to the total basin EKE, asdefined in Rio et al. [2007]. These are the 1 × 1 degreesubregions of Ierapetra (centered at 27E/34.3N), Rhodesgyre (28E/34.5N), Mersa‐Matruh (29.5E/33N), Shikmona(33.8E/33.5N) and the Mid Mediterranean jet (MMJ), whichis calculated upon inclined rectangle of the same area (28E/32.75N ‐ 28.25E/34N). The mean EKE values of these re-gions are 272, 98, 106, 88, 151 cm2/sec2, respectively(compared to the basin mean value of 126.5 cm2/sec2). Thepower spectrum of the most energetic region, Ierapetra(Figures 4c–4d), is dominated by an annual signal, althoughthere is also a signal at 1.5 1/yr. However, its decadal var-iability is absent or even opposite to the basin trend. Thepower spectrum of the EKE signal over the Rhodes gyre
Figure 3. First spatial EOF mode (73.6%) of SLA (colors) and the corresponding geostrophic velocities(arrows).
AMITAI ET AL.: LEVANTINE BASIN SURFACE CIRCULATION C10058C10058
4 of 11
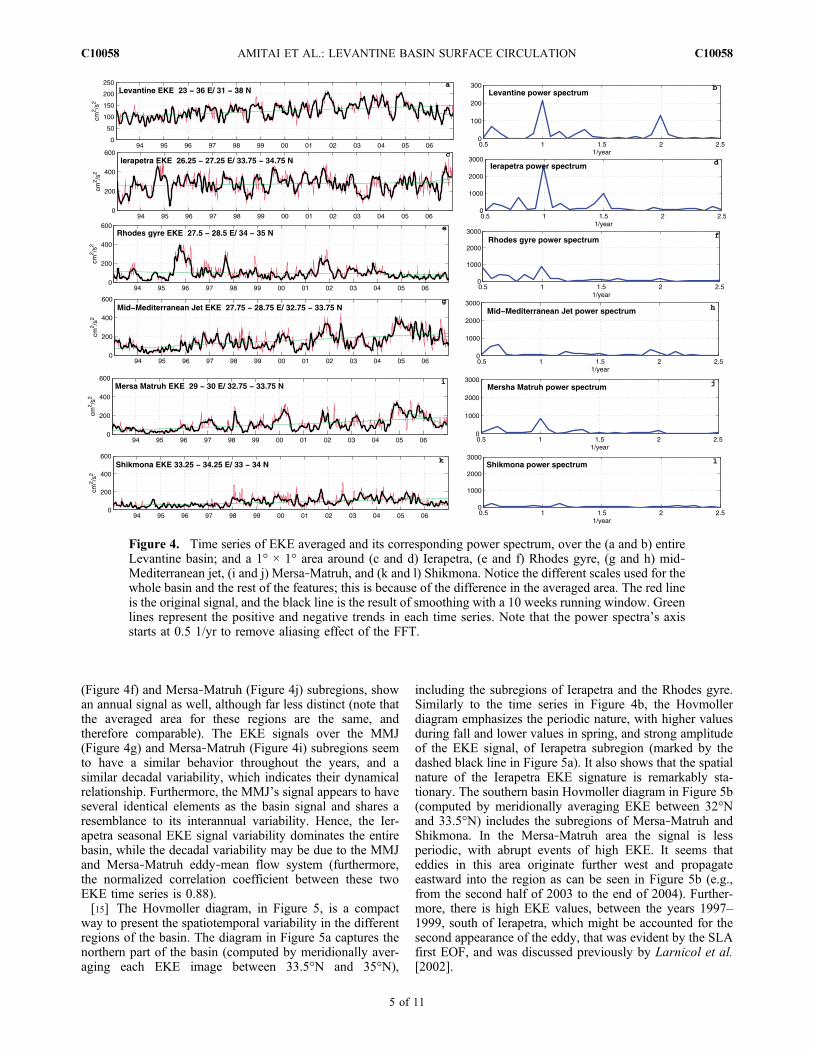
(Figure 4f) and Mersa‐Matruh (Figure 4j) subregions, showan annual signal as well, although far less distinct (note thatthe averaged area for these regions are the same, andtherefore comparable). The EKE signals over the MMJ(Figure 4g) and Mersa‐Matruh (Figure 4i) subregions seemto have a similar behavior throughout the years, and asimilar decadal variability, which indicates their dynamicalrelationship. Furthermore, the MMJ’s signal appears to haveseveral identical elements as the basin signal and shares aresemblance to its interannual variability. Hence, the Ier-apetra seasonal EKE signal variability dominates the entirebasin, while the decadal variability may be due to the MMJand Mersa‐Matruh eddy‐mean flow system (furthermore,the normalized correlation coefficient between these twoEKE time series is 0.88).[15] The Hovmoller diagram, in Figure 5, is a compact
way to present the spatiotemporal variability in the differentregions of the basin. The diagram in Figure 5a captures thenorthern part of the basin (computed by meridionally aver-aging each EKE image between 33.5°N and 35°N),
including the subregions of Ierapetra and the Rhodes gyre.Similarly to the time series in Figure 4b, the Hovmollerdiagram emphasizes the periodic nature, with higher valuesduring fall and lower values in spring, and strong amplitudeof the EKE signal, of Ierapetra subregion (marked by thedashed black line in Figure 5a). It also shows that the spatialnature of the Ierapetra EKE signature is remarkably sta-tionary. The southern basin Hovmoller diagram in Figure 5b(computed by meridionally averaging EKE between 32°Nand 33.5°N) includes the subregions of Mersa‐Matruh andShikmona. In the Mersa‐Matruh area the signal is lessperiodic, with abrupt events of high EKE. It seems thateddies in this area originate further west and propagateeastward into the region as can be seen in Figure 5b (e.g.,from the second half of 2003 to the end of 2004). Further-more, there is high EKE values, between the years 1997–1999, south of Ierapetra, which might be accounted for thesecond appearance of the eddy, that was evident by the SLAfirst EOF, and was discussed previously by Larnicol et al.[2002].
Figure 4. Time series of EKE averaged and its corresponding power spectrum, over the (a and b) entireLevantine basin; and a 1° × 1° area around (c and d) Ierapetra, (e and f) Rhodes gyre, (g and h) mid‐Mediterranean jet, (i and j) Mersa‐Matruh, and (k and l) Shikmona. Notice the different scales used for thewhole basin and the rest of the features; this is because of the difference in the averaged area. The red lineis the original signal, and the black line is the result of smoothing with a 10 weeks running window. Greenlines represent the positive and negative trends in each time series. Note that the power spectra’s axisstarts at 0.5 1/yr to remove aliasing effect of the FFT.
AMITAI ET AL.: LEVANTINE BASIN SURFACE CIRCULATION C10058C10058
5 of 11

[16] The debate regarding the governing basin scale cir-culation (along‐shore versus basin centered) cannot be fullyresolved by altimetry data, because the geostrophic assump-tion, used to derive the velocities, is insufficient close toshore. However, we are able to discuss the variability of theMMJ’s flux and direction. In the MDT field (Figure 1b), theMMJ has a confined distinct structure in the border betweenMersa‐Matruh and the Rhodes gyre [mainly from southwest (28E, 33N) to northeast (29E, 34N)]. Performing atime series analysis of the SSH velocity vector projection onthe MMJ’s defined direction, according to the MDT, showsthat the MMJ’s current is very variable in respect to themean velocity in that subregion (Figure 6). Furthermore, it
is nonperiodic in a seasonal time scale and dominated byabrupt changes, as the minimum in May 2002.[17] This variability of the MMJ can be understood when
considering the turbulent nature of the Mersa‐Matruh region.In periods when Mersa‐Matruh is active (high EKE values),as in the lower dashed line in Figure 5b, it is clear from theSLA derived currents of the same period (Figures 7a–7d)that the MMJ is intensified. This occurs due to the presenceof coherent mesoscale anticyclones that propagate north‐eastward with an averaged speed of approximately 5 km/day.In contrast, in the periods of a low EKE signaling Mersa‐Matruh (upper dashed line in Figure 5b), both cyclonic andanticyclonic eddies are less coherent and tend to weaken theMMJ significantly (see Figures 7e–7h). The correlation
Figure 5. EKE Hovmoller diagrams over the (a) northern and (b) southern parts of the Levantine basin.The diagrams are extracted by averaging EKE meridionally between 33.5°N and 35°N and between 32°Nand 33.5oN, respectively. Above are reference figures showing the averaged area. In Figure 5a, the dashedline marks the location of the Ierapetra eddy. In Figure 5b, the dashed lines mark the time in which snap-shots of the Mersa‐Matruh region are presented in Figure 7. The lower line corresponds to Figure 7a andthe lower to Figure 7e.
AMITAI ET AL.: LEVANTINE BASIN SURFACE CIRCULATION C10058C10058
6 of 11

between the MMJ strength and Mersa‐Matruh’s presence isalso apparent from Figures 4g and 4i, where large EKEvalues in the Mersa‐Matruh subregion indicate a high eddyactivity. SLA derived currents in the Shikmona subregion(Figure 8) showing periods characterized by one persistent,but rather weak, anticyclonic eddy(Figures 8a–8d) versusother periods characterized by a conglomeration of cyclonesand anticyclones (Figures 8e–8f). The snapshots in Figures 7and 8 are taken in following seasons when four satellitemissions are merged (Figure 2). As noted by Pascual et al.[2007], three altimeters are sufficient for tracking meso-scale features.[18] Hence, the only region in the Levantine basin showing
a persistent mesoscale signature on annual time scale is theIerapetra eddy. The Ierapetra formation and strength havebeen connected to the MMJ position [Theocharis et al.,1993], to the Aegean water outflow [La Violette et al.,1998] and to Rhodes gyre energy [Popov, 2004]. In 1994 ?suggested that it results mainly due to atmospheric forcing.In summer time the Crete island (which is characterized bythree high mountain ridges, crossing the island from west toeast, and reaching altitudes of more than two kilometer)tends to block the Etesian south‐eastward winds, thuscausing a funneling effect of the wind through the Kasosstrait. Therefore, although the large‐scale Etesian winds arecyclonic, the wind blockade at Crete yields a localizednegative sheared wind stress curl in the Ierapetra subregion
(Figure 9). The interannual variability of the Etasian windsexplains the interannual variability of Ierapetra. Horton’shypothesis has been supported by the inability of oceanicgeneral circulation models to reproduce Ierapetra withoutconsidering a fine resolution of atmospheric forcing[Marullo et al., 2003; Nittis et al., 2003; Alhammoud et al.,2005]. The seasonal variability of the Etasian winds andIerapetra is correlated with an average lag of three month,between maximum negative wind stress curl and maximumnegative sea current vorticity, in the Ierapetra subregion. Thismight be associated with the typical growth rate of the firstbaroclinic mode there.
3. Conclusions
[19] One of the major advantages of satellite altimetry isin providing continuous, synoptic, detailed data sets on thescale of a decade. Such long data sets compliment in situshort‐term field campaigns, data from released drifters andbuoys, and SST images which are frequently contaminatedby cloud coverage. The analyzed data set in this study isparticularly refined since the EM is covered by at least twosatellite altimeters in thirteen out of the fourteen years ofdata (in three years it is covered by three altimeters and inother three years, it is covered by four). Furthermore, sincethe SLA horizontal sampling resolution is of the order of theRossby internal radius of deformation the derived geo-strophic currents resolve the mesoscale eddies.
Figure 6. Time series of the geostrophic anomalies velocity vector projection on 45°, where the MMJappears on the MDT, with a reference figure above. The red line is the original signal, and the black line isthe result of smoothing with a 10 weeks running window. The blue dashed line is the mean value of thegeostrophic velocity calculated from the SSH in the MMJ subregion.
AMITAI ET AL.: LEVANTINE BASIN SURFACE CIRCULATION C10058C10058
7 of 11
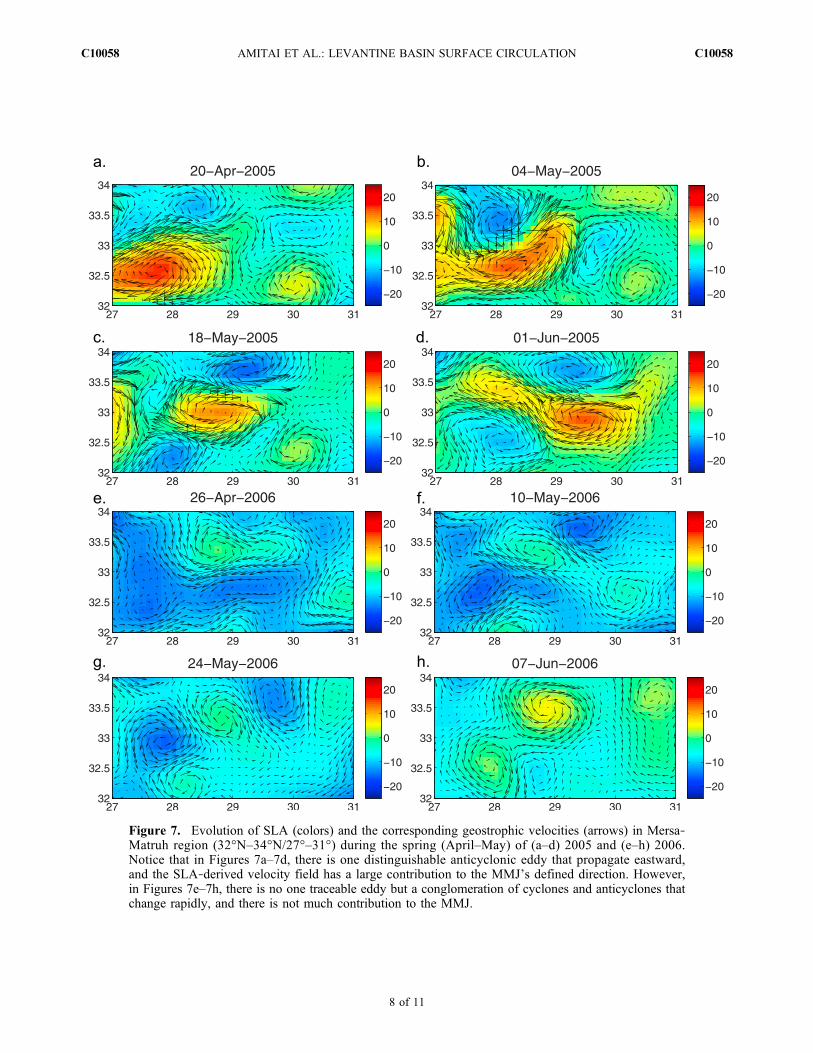
Figure 7. Evolution of SLA (colors) and the corresponding geostrophic velocities (arrows) in Mersa‐Matruh region (32°N–34°N/27°–31°) during the spring (April–May) of (a–d) 2005 and (e–h) 2006.Notice that in Figures 7a–7d, there is one distinguishable anticyclonic eddy that propagate eastward,and the SLA‐derived velocity field has a large contribution to the MMJ’s defined direction. However,in Figures 7e–7h, there is no one traceable eddy but a conglomeration of cyclones and anticyclones thatchange rapidly, and there is not much contribution to the MMJ.
AMITAI ET AL.: LEVANTINE BASIN SURFACE CIRCULATION C10058C10058
8 of 11
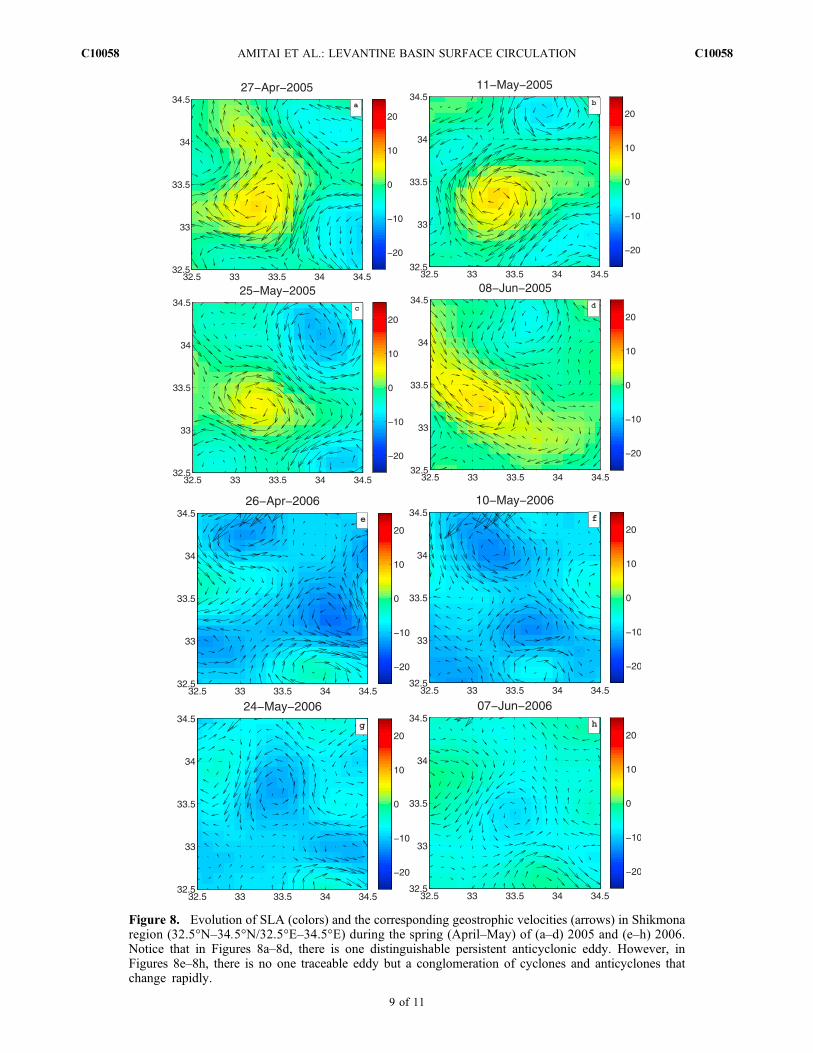
Figure 8. Evolution of SLA (colors) and the corresponding geostrophic velocities (arrows) in Shikmonaregion (32.5°N–34.5°N/32.5°E–34.5°E) during the spring (April–May) of (a–d) 2005 and (e–h) 2006.Notice that in Figures 8a–8d, there is one distinguishable persistent anticyclonic eddy. However, inFigures 8e–8h, there is no one traceable eddy but a conglomeration of cyclones and anticyclones thatchange rapidly.
AMITAI ET AL.: LEVANTINE BASIN SURFACE CIRCULATION C10058C10058
9 of 11

[20] The main finding from analyzing 14 years of data setis that the MDT picture represents correctly the differenteddy activity regions in the Levantine, however these re-gions are turbulent regions and characterized by sporadicevents. Furthermore, the instantaneous currents in theseregions can be different from the MDT derived currents bythe same order of magnitude. The turbulence intensity ishighly variable, despite of the seasonal and long‐term stericperiodicity. Since these eddies interact with the basin circu-lation flow they modify it continuously. This basically meansthat in a given day one can find cyclones in averagely anti-cyclonic regions such as Mersa Matruh and Shikmona.Although the debate regarding the main pathway of Atlanticwater in the Levantine basin, cannot be fully resolved byaltimetry (since the nongeostrophic along shore currentcannot be derived by altimetry), the existence of the MMJcan be ascertained (in line with Alhammoud et al. [2007]).Analysis reveals that the MMJ continuously transports AWinto the basin, with a rather strong flux (averaged speed of19 cm/sec). However, it meanders and its strength changesrapidly as a function of the variability of the eddy activityregions that surround it. This variability might explains thecontradiction in the literature, concerning the prominentrole of the MMJ.[21] The prominent exception of this sporadic picture is
the Ierapetra eddy with persistent seasonal appearance andlocation. This persistence seems to result from the persis-tence of the eddy deriving Etesian winds, which resultthemselves from the far field influence of the summer IndianMonsoon on the EM. The Ierapetra eddy dominates the
mesoscale annual variance of the Levantine basin, while theeddy‐mean flow system of Mersa‐Matruh and the MMJdominates its mesoscale decadal variance.
[22] Acknowledgments. The altimeter products were produced by theCLS (Collecte Localisation Satellites) Space Oceanography Division anddistributed by Aviso with support from Cnes (http://www.aviso.oceanobs.com). We are grateful to Francesco d’Ovidio for providing the softwareand for fruitful discussion. We also thank the Israeli Science Foundation(ISF 1084/06) and to the Israeli Ministry of Science and Technology (MOST3‐6490) for funding this research.
ReferencesAlhammoud, B., K. Branger, L. Mortier, M. Crpon, and I. Dekeyser (2005),Surface circulation of the Levantine Basin: Comparison of model resultswith observations, Prog. Oceanogr., 66, 299–320.
Alhammoud, B., K. Branger, L. Mortier, I. Dekeyser, and M. Crpon (2007),Does the mid‐Mediterranean jet exist?, Rapp. Comm. Int. Mer Mdit., 38,123.
Ayoub, N., P. Y. Le Traon, and P. De Mey (1998), A description of theMediterranean surface variable circulation from combined ERS‐1 andTOPEX/POSEIDON altimetric data, J. Mar. Syst., 18, 3–40.
Cazenave, A., P. Bonnefond, F. Mercier, K. Dominh, and V. Toumazou(2002), Sea level variations in the Mediterranean Sea and Black Sea fromsatellite altimetry and tide gauges, Global Planet. Change, 34(1–2),59–86.
Criado‐Aldeanuevaa, F., J. Del Ro Verab, and J. Garca‐Lafuente (2008),Steric and mass‐induced mediterranean sea level trends from 14 yearsof altimetry data, Global Planet. Change, 60(3–4), 563–575.
Fusco, G., et al. (2003), Variability of mesoscale features in the Mediterra-nean Sea from XBT data analysis, Ann. Geophys., 21(1), 21–32.
Gerin, R., P. Poulain, I. Taupier‐Letage, C. Millot, S. Ben Ismail, andC. Sammari (2009), Surface circulation in the Eastern Mediterraneanusing drifters (2005–2007), Ocean Sci. Discuss., 6, 525–555.
Figure 9. Summertime (July–August) wind stress (arrows) and wind stress curl (colors) over theLevantine basin. Note the wind stress curl minima over the Ierapetra region (southeast of Crete). Surfacewind speeds were obtained from the SeaWinds scatterometer on board NASA’s Quick Scatterometer(QuikSCAT) satellite. QuikSCAT data were obtained through the on line PO.DAAC Ocean ESIP Tool(POET) at the Physical Oceanography Distributed Active Archive Center (PO.DAAC), NASA Jet Propul-sion Laboratory, Pasadena, California (available at http://podaac.jpl.nasa.gov/poet).
AMITAI ET AL.: LEVANTINE BASIN SURFACE CIRCULATION C10058C10058
10 of 11
Hamad, N., C. Millot, and I. Taupier‐Letage (2005), A new hypothesisabout the surface circulation in the eastern basin of the MediterraneanSea, Prog. Oceanogr., 66(2–4), 287–298.
Hamad, N., C. Millot, and I. Taupier‐Letage (2006), The surface circulationin the eastern basin of the Mediterranean Sea as inferred from infraredimages, Sci. Mar., 70, 457–503.
Hecht, A., N. Pinardi, and A. Robinson (1988), Currents, water masses,eddies and jets in the Mediterranean Levantine basin, J. Phys. Oceanogr.,18, 1320–1353.
La Violette, P. E., J. A. Price, R. Mosher, and N. Kotsovinos (1998), Thesurface circulation around crete inferred from satellite imagery, drifterbuoy, AXBTS data and a physical model, Rapp. Comm. Int. Mer Medit.,35, 162–163.
Larnicol, G., P. Y. Ayoub, and N. Le Traon (2002), Major changes inMediterranean Sea level variability from 7 years of TOPEX/Poseidonand ERS‐1/2 data, J. Mar. Syst., 33–34, 63–89.
Lascaratos, A., R. G. Williams, and E. Tragou (1993), A mixed‐layer studyof the formation of Levantine Intermediate Water, J. Geophys. Res.,98(C8), 14,739–14,750, doi:10.1029/93JC00912.
Malanotte‐Rizzoli, P., et al. (1997), A synthesis of the Ionian Sea hydrog-raphy, circulation and water mass pathways during POEM‐Phase I, Prog.Oceanogr., 39, 153–204.
Marullo, S., E. Napolitano, R. Santoleri, B. Manca, and R. Evans (2003),Variability of rhodes and Ierapetra gyres during Levantine intermediatewater experiment: Observations and model results, J. Geophys. Res.,108(C9), 8119, doi:10.1029/2002JC001393.
Matteoda, A., and S. Glenn (1996), Observations of recurrent mesoscaleeddies in the eastern Mediterranean, J. Geophys. Res., 101(C9),20,687–20,709, doi:10.1029/96JC01111.
Millot, C., and I. Taupier‐Letage (2005), Circulation in the MediterraneanSea, in The Handbook of Environmental Chemistry, vol. 5, edited byA. Saliot, pp. 29–66, Springer, Heidelberg.
Molcard, A., N. Pinardi, M. Iskandarani, and D. B. Haidvogel (2002),Wind driven general circulation of the mediterranean sea simulated witha spectral element ocean model, Dyn. Atmos. Oceans, 35(2), 97–130.
Nielsen, J. (1912), Hydrography of the Mediterranean and adjacent waters,Tech. Rep. 1, Rep. Dan. Ocean. Exp. Medit.
Nittis, K., A. Lascaratos, andA. Theocharis (2003), Dense water formation inthe aegean sea: Numerical simulations during the eastern Mediterraneantransient, J. Geophys. Res., 108(C9), 8120, doi:10.1029/2002JC001352.
Ovchinnikov, I. (1966), Circulation in the surface and intermediate layersof the Mediterranean, Oceanology, 6, 48–59.
Ozsoy, E., A. Hecht, and U. Unluata (1989), Circulation and hydrographyof the Levantine basin. results of poem coordinated experiments 1985–1986, Prog. Oceanogr., 22, 125–170.
Ozsoy, E., A. Hecht, U. Unluata, S. Brenner, T. Oguz, J. Bishop, M. Latif,and Z. Rozentraub (1991), A review of the Levantine basin circulationand variability during 1985–1988, Dyn. Atmos. Oceans, 15, 421–456.
Pascual, A., M. Pujol, G. Larnicol, M. Le Traon, and P. Y. Rio (2007),Mesoscale mapping capabilities of multisatellite altimeter missions: Firstresults with real data in the Mediterranean Sea, J. Mar. Syst., 65(1–4),190–211.
Pinardi, N., and E. Masetti (2000), Variability of the large‐scale general cir-culation of the Mediterranean Sea from observations and modeling: Areview, Palaeogeogr. Palaeoclimatol. Palaeoecol., 158(21), 153–173.
Poem, G. (1992), General circulation of the Eastern Mediterranean, EarthSci. Rev., 32, 285–309.
Popov, Y. I. (2004), Genesis and structure of the anticyclonic Ierapetrazone in the Levantine basin, Prog. Oceanogr., 14(4), 234–242.
Pujol, M.‐I., and G. Larnicol (2005), Mediterranean sea eddy kinetic energyvariability from 11 years of altimetric data, J. Mar. Syst., 58(3–4),121–142.
Rio, M., P. Poulain, A. Pascual, E. Mauri, G. Larnicol, and R. Santoleri(2007), a mean dynamic topography of the Mediterranean Sea computedfrom altimetric data, in situ measurements and a general circulationmodel, J. Mar. Syst., 65(1–4), 484–508.
Robinson, A., and M. Golnaraghi (1993), Circulation and dynamics of theEastern Mediterranean Sea; Quasi‐synoptic data‐driven simulations.,Deep Sea Res., 40(6), 1207–1246.
Robinson, A., A. Hecht, N. Pinardi, J. Bishop, W. Leslie, Z. Rosentroub,A. Mariano, and S. Brenner (1987), Small synoptic/mesoscale eddiesand energetic variability of the eastern Levantine basin, Nature, 327,131–134.
Robinson, A., M. Golnaraghi, W. Leslie, A. Artegiani, A. Hecht, E. Lazzoni,A. Michelato, E. Sansone, A. Theocharis, and U. Onliiata (1991), Theeastern Mediterranean general circulation: Features, structure and vari-ability, Dyn. Atmos. Oceans, 15, 215–240.
Theocharis, A., D. Georgopoulos, A. Lascaratos, and K. Nittis (1993),Water masses and circulation in the central region of the EasternMediterranean: Eastern Ionian, South Aegean and Northwest Levantine,1986–1987, Deep Sea Res., 40, 1121–1142.
Tziperman, E., and P. Malanotte‐Rizzoli (1991), The climatological sea-sonal circulation of the Mediterranean Sea, J. Mar. Res., 49, 411–434.
Zervakis, V., G. Papadoniou, C. Tziavos, and A. Lascaratos (2003), Sea-sonal variability and geostrophic circulation in the eastern Mediterraneanas revealed through a repeated XBT transect, Ann. Geophys., 21, 33–47.
Y. Amitai, E. Heifetz, A. Lazar, and Y. Lehahn, Department ofGeophysics and Planetary Sciences, Tel Aviv University, Tel Aviv 69978,Israel. ([email protected])
AMITAI ET AL.: LEVANTINE BASIN SURFACE CIRCULATION C10058C10058
11 of 11