surface and subsurface temperature variations during 2009
TRANSCRIPT

Earth Science 2014; 3(2): 50-57 Published online April 20, 2014 (http://www.sciencepublishinggroup.com/j/earth) doi: 10.11648/j.earth.20140302.13
Surface and subsurface temperature variations durin g 2009 El Niño manifestation over central and tropica l Pacific Ocean M. V. Subrahmanyam
Marine Science Department, Zhejiang Ocean University, Zhoushan, Zhejiang, China
Email address: [email protected]
To cite this article: M. V. Subrahmanyam. Surface and Subsurface Temperature Variations during 2009 El Niño Manifestation over Central and Tropical Pacific Ocean. Earth Science. Vol. 3, No. 2, 2014, pp. 50-57. doi: 10.11648/j.earth.20140302.13
Abstract: Tropical Pacific Ocean is an important to study for identifying the influence on Global circulation. El Niño /La Nina even occurs over the tropical Pacific Ocean, with temperatures oscillations. With respect to increase in temperatures, the intensity of El Niño can be divided into strong, moderate and weak. As per the intensity, the year 2009 is a moderate El Niño, but is peculiar due to delay in formation. In this article, TAO/TRITON data is used for analysis between November 2008 and December 2009 to check the variations in the surface and sub-surface temperatures during the manifestation of El Niño. Actually El Niño manifest during December, but during 2009 El Niño it manifested in January. There is a clear evidence in surface and sub-surface temperatures as they are increasing from January 2009, which can explains the manifestation of El Niño.
Keywords: SST, Sub-Surface Temperature, El Nino
1. Introduction El Niño is a warming of the tropical Pacific that occurs
roughly every 2 to 7 years and lasts for 12–18 months, sometimes continuous. El Niño is dynamically linked to the Southern Oscillation, a see-saw in surface atmospheric pressure between the Australian–East Asian region and the eastern tropical Pacific. During El Niño, the trade winds weaken along the equator as atmospheric pressure rises in the western Pacific and falls in the eastern Pacific. Weakened trade winds allow warm surface water, normally confined to the western Pacific, to migrate eastward. Wind-driven upwelling, a process that brings cold water to the surface along the equator and along the west coasts of North and South America, is also greatly reduced, causing sea surface temperatures to rise. El Niño is considered to be the second biggest climate-related influence on human activities, after the natural flow of the seasons. Although the phenomenon is at least thousands of years old, its impacts on global climate have only recently been recognized.
The term El Niño has now become synonymous with these extensive ocean warming because of their impacts on global climate. El Niño is coupled to an atmospheric
phenomenon known as the Southern Oscillation, first defined by Sir Gilbert Walker in the early 20th century. As sea surface temperatures (SST) warm east of the date line, the pattern of deep convection and precipitation also shifts eastward [1]. This reinforces the reduction in trade wind intensity, because westerly winds flow into the convective center from the west. Pressure continues to fall in the east and rise in the west as the region of convection and rainfall migrates eastward. The system becomes locked in a positive feedback loop, with warming surface temperatures leading to weakened trade winds and vice versa. This positive feedback is eventually broken when the oceanic waves that elevated the thermocline in the western Pacific at the onset of the event bounce off the land masses bordering the western Pacific and reflect back toward the east. As the reflected waves propagate eastward along the equator, they elevate the thermocline and initiate surface cooling. Cooler surface waters in the eastern Pacific increase the east–west atmospheric pressure gradient and the strength of the trade winds, which in turn reinforces surface cooling through intensified upwelling. The ocean returns to near normal conditions, or it may overshoot into a cold La Nina state. While El Niño involves an intimate coupling of the atmosphere and the ocean, the two fluids respond to each other on very different time scales. El Niño

Earth Science 2014; 3(2): 50-57 51
effects are felt worldwide through atmospheric and oceanic teleconnections, with significant impacts on society and natural systems [2]. The atmosphere is a thousand times less dense than the ocean, and therefore responds almost immediately to forcing from the ocean surface. The ocean is massive by comparison, so its dynamical response to atmospheric forcing is relatively sluggish. The increasing recognition that there are two different flavours or types of El Niño events [e.g., 3, 4, 5, 6, 7, 8, 9,10] offers the research community a new way to consider interannual SST variability in the tropical Pacific and to rethink how the type of El Niño and its impacts may change as the climate changes. El Niño has its largest anomalous warming in the central equatorial Pacific in contrast to the more traditional type of El Niño, which has its largest warming in the eastern equatorial Pacific. scientists have noted a new type of El Niño that has been occurring with greater frequency. Known variously as "central-Pacific El Niño," "warm-pool El Niño," "dateline El Niño" or "El Niño Modoki", the maximum ocean warming from such El Niños is found in the central-equatorial, rather than eastern Pacific. Moreover, since the start of the 21st century, most of the El Niño events have been of the Central Pacific type, including the 2002/03, 2004/05, and 2009/10 events. The 2009–10 El Niño manifested during January and commenced in May 2009. The Pacific Ocean returned to neutral by late April 2010, but continued to cool rapidly during autumn. Satellite observations suggest that the intensity of El Niño events in the central equatorial Pacific has almost doubled in the past three decades, with the strongest warming occurring in 2009–10 [11]. To understanding the processes going on El Niño, in particular 2009 El Niño. November 2008- December 2009 data has been taken to check the variations in surface and sub-surface temperatures. Normally El Niño can be observed during December, but in 2009 is a mild El Niño but manifested in January- February. An attempt has been done to understand the variations over surface and sub-surface temperatures varies during 2009 El Niño .
2. Data and Methodology
Tropical Pacific Ocean is important for study due to its influence on Global circulation. For this study author used the TAO/TRITON buoy data. TRITON moorings included surface and subsurface temperature in the upper 500 m as part of its standard measurement suite. TAO/TRITON is well known that high-frequency zonal wind fluctuations can significantly affect the evolution of ENSO events. El Niño’s of the 21st century have been characterized by SST anomalies along the equator that are largest near the International Date Line. Nonetheless, TAO/TRITON data provide a key constraint on initial conditions for seasonal model forecasts at many centers around the world, such as the National Centers for El Niño. This class of El Niño has different climate impacts than those with largest anomalies in the eastern Pacific. Ocean-atmosphere
interactions that maintain well-developed trades in the eastern equatorial Pacific contribute to the concentration of largest SSTs in the central Pacific. TAO/TRITON data are routinely used in ocean state estimation, operational ocean analyses, operational atmospheric analyses and reanalysis, and ENSO forecasting. For further details please refer the TAO/TRITON website.
TAO/TRITON surface and sub-surface temperature data used to study how the surface and subsurface temperature varies during the period November 2008 to December 2009. The data used for this study is to identify how the surface and subsurface temperatures are having in relation with the delayed El Niño. Variations of SST and subsurface temperatures are plotted using different plotting and presented. The results are given below.
3. Results 3.1. Variation of Sea Surface Temperature
Figure 1 shows SST variation over tropical Pacific Ocean (between 5° S and 5° N) during November 2008 and December 2009. Variations in SST clearly indicating about the upwelling feature in eastern side and warm pool in the western side of tropical Pacific Ocean. November 2008 explains there is a warm with 30º C observed in the southern Pacific Ocean. Eastern Pacific is showing an upwelling process, especially in the southern side by lower SSTs of 22º C. The temperature ranging between 28º C - 30º C in the western Pacific indicating it is a warm pool. The SST increased in the western Pacific during December 2009. The 30º C areal extent enhanced and upwelling process in the eastern Pacific decreased in December when compared with November. Higher temperatures can be observed in the western Pacific during January 2009, however the 30.5º C can be observed in the southern latitudes of western Pacific. The temperatures in the southern part of eastern Pacific increases to 24º C. It indicating that, the upwelling process reduced and the tropical Pacific temperatures are increasing. At 235º E, there is a area of 24º C can be observed. The 30º C temperature water is present both sides of equator. The upwelling feature observed in December 2008 reduced further in February 2009 and the temperatures increased. SST pattern showing that there is a moment of current is from east to west at the equator. The same features are be prolonged to March 2009. During April 2009, the temperatures are further increased along the equator. The temperature of 30º C can be observed southern part of western Pacific; however there is an increase of SST in the eastern Pacific also to 27.5º C. May 2009 explains the SST in the western Pacific increased further and southern part of eastern pacific is experiencing temperature of 27º C. The SST over eastern Pacific decreased by 0.5 º during June 2009. There is an area of 30º C temperature observed in the southern part of Pacific. Over southern part of eastern Pacific showing lower temperatures, indicating upwelling

52 M. V. Subrahmanyam: Surface and Subsurface Temperature Variations during 2009 El Niño Manifestation over Central and Tropical Pacific Ocean
Figure 1. Variation of Sea Surface Temperature over tropical Pacific Ocean (5°S-5°N) during November 2008 through December 2009.
process is going to start. During July 2009, the SST decrease in the northern part of western Pacific as well as
southern part of eastern Pacific. The upwelling process increased in the southern east Pacific. The upwelling process increased in eastern Pacific during August 2009, evidenced by lower temperature of 22º C. However western Pacific signifying higher SSTs. The SST increased to 30º C between 150º E and 175º E longitudes and the areal extent is from 5º S to 10º N during September 2009. During September, the SST increasing in the western Pacific and in the eastern pacific upwelling process is happening. The 30º C temperature water is confined to 160º E - 185° E, we can observe the water is moving towards south in October 2009. The upwelling processes increased in the eastern Pacific and the temperature in western pacific increased in November 2009. The upwelling process also decreased by indicating increase of SST in eastern Pacific. During December 2009, the upwelling process further reduced in the southern part of east Pacific. And in the western pacific the temperature of 29º C can be observed, however 30º C can be observed at the central Pacific in the southern latitudes. Over all, over Nino 3.4 region or central Pacific region indicating increment in SST from January 2009. It is indicating that the El Nino has manifested during January.
3.2. Variation of Subsurface Temperature in Tropical Pacific Ocean
TAO/TRITON buoy’s sub-surface data has been used for this study during November 08 to December 09. As per latitudinal cross sections, the results are as follows.
3.2.1. Variation of Subsurface Temperatures along the Equatorial Cross-Section
Figure 2 reveals the variation of sub-surface temperatures along equatorial cross section during November 2008 and December 2009. The temperature variations are observed from the surface to 250 m depth. On November 2008, Temperature varies between 29º C and 8º C. Over the western Pacific Ocean 29º C can be observed, which is near to Indonesian coast and eastern Pacific Ocean temperature observed is 20º C. At 155º E, 25º C temperature extended up to 140m depth,however same temperature can be seen at the surface at 220º E. The temperature contours are close over the eastern Pacific with 20º C at the surface, showing that there is an upwelling taking place with an evidence of close contours. The mixed layer is deeper in the western Pacific, however shallow in the eastern Pacific. The same feature can be observed during December 2008. The area of surface temperature at the western Pacific increased, however in the eastern Pacific showing 22º C. There is a increase in temperature both in eastern and western Pacific. The upwelling feature in the eastern Pacific reduced, however the closer contours continues.
When consider the January 2009, the surface temperature increased in the western pacific as well as in the eastern Pacific. The extent of 29º C extended further and deeper also. In the eastern Pacific, the contours are further closer as in December 2008 with the surface temperature

Earth Science 2014; 3(2): 50-57 53
increased to 23º C. It explains the upwelling process is further subsidized. During February 2009, the same feature
Figure 2. Variation of sub-surface temperatures along equatorial cross section during November 2008 and December 2009.
can be observed with the areal extent decreased in western Pacific and increased surface temperature in the eastern Pacific. One interesting feature can be observed is the areal extent of 25º C is growing and shifting to eastern side. This is representing an increase of surface temperature over the tropical Pacific. In the western Pacific the extent and the depth of 29º C temperature reduced further during March 2009. In the eastern Pacific the temperature reduced to 22º C and the contour spacing enlarged. The temperature of the sub-surface temperature also raised in the western Pacific. Again areal extent and the depth of 29º C temperature increased and also the temperature at the eastern Pacific enhanced to 24º C in April 2009. The depth of 28º C increased in the western Pacific. The contour spacing over the eastern pacific further enlarged, however the temperature is growing over the equatorial Pacific Ocean. During May 2009, the temperature in the western Pacific raised to 30º C and also in the eastern Pacific also the temperature increased to 25º C. However the 25º C shifted to eastern Pacific. Even though the surface temperatures increased, the sub-surface temperatures are confined to 150 m depth. During June 2009, the 30º C is absent in the western Pacific, however the 29º C areal extent and depth enlarged. The 25º C again shifted back to the central Pacific Ocean. The 29º C is confined to the same areal extent and depth during July 2009 as of June. In the eastern Pacific the temperature is decreased to 24º C. The 25º C temperature shifted towards central Pacific and the depth of 25º C declined in the western Pacific. The eastern Pacific temperature further decreased to 22º C in August 2009. However, in the western
Pacific temperature remains to 29º C. The 30º C temperature again observed in the western Pacific during September 2009 and the temperature in the eastern Pacific also increased to 23º C. During October 2009, western Pacific temperature is confined to 29º C and the areal extent enlarged. During November 2009, extreme western Pacific temperature increases to 30º C and the extent of 29º C further increased to central Pacific. Again in the eastern Pacific, the temperature increased to 23º C. The 30º C temperature conspicuously present during December 2009. The extent and deepening of 29º C temperature increased further. In the eastern Pacific temperature also increased to 25º C. In the central Pacific the depth of 29º C enhanced up to 100 m. Overall study indicates during November 2008- December 2009, the temperature in the western Pacific is showing greater than 29º C. However in the eastern Pacific, the upwelling feature found in during November 2008 and is decreased in further months, also increment in surface temperature and the contour interval reduced till December 2009. These features are also illustrating that there is an El Niño feature observed in the sub-surface temperatures over central Pacific.

54 M. V. Subrahmanyam: Surface and Subsurface Temperature Variations during 2009 El Niño Manifestation over Central and Tropical Pacific Ocean
Figure 3. Variation of sub-surface temperatures along 5° N cross section during November 2008 and December 2009.
3.2.2. Variation of Subsurface Temperatures along 5º N Cross-Section
Figure 3 demonstrates the variation of sub-surface temperatures along 5° N cross section during November 2008 and December 2009. Along the 5º N transect of Pacific showing higher surface temperatures. Surface temperature over western Pacific is 29º C, however in the eastern Pacific having 27º C in November 2008. The depth of 25º C is around 150m over the western Pacific. Contours are very close around 100 m depth at western Pacific, however 15º C can be found at 170 m. The temperature of 29º C present between western Pacific and central Pacific. During December 2009, 29º C extent decreased and confined to western Pacific. Eastern pacific experienced temperature of 25º C and extended up to central Pacific. The sub-surface contours are showing a slope of temperature from eastern to western Pacific.
January 2009 explains increase in temperature at eastern Pacific, the temperature observed is 26º C. Interval between contours are closer in the eastern Pacific and in the western Pacific the interval of contours are closer below 150 m. Contour interval is very closer over the eastern Pacific during February 2009, however 26º C extending from east to central Pacific. The depth of the 15º C contour can be observed at 75 m. In the western Pacific 29º C is confined to 155º E - 164º E and the areal extent is small and the depth is around 80 m. The 15º C contour is can be observed at 180 m. During March 2009 illustrating larger areal extent with 26º C from central Pacific to eastern Pacific. The 29º C waters are confined to 155º E and up to 100 m in February. Again we can observe the areal extent of 29º C waters over western Pacific is increased and extended to 75 m depth during April 2009. Over eastern Pacific the temperature increased to 27º C and the contour intervals are narrow and up to 70m. During May 2009, over western Pacific 29º C extended up to 180º E. The surface extent of 27º C is confined over central to eastern Pacific. Surface temperatures are increased to 28º C, which is higher than April. In June 2009, 28º C is extended from western pacific to eastern Pacific. The contour intervals are closer in the eastern Pacific and the depth of 15º C is around 140 m in the eastern Pacific and 180 m in the western Pacific. The warm waters of 28º C temperature is carried from western Pacific to eastern Pacific. During July 2009, higher temperature of 29º C is observed at the west of Pacific however temperature of 28º C can be found between central to eastern Pacific. The contour interval is closer at eastern pacific and the depth of 15º C can be seen below 110 m depth, however 200 m in the western Pacific. Temperature in the eastern Pacific decreases to 27º C, however in the western Pacific the temperature remains at 29º C during August 2009. The same feature can be observed during September 2009. During October 2009 the areal extent and the depth of 29º C increased than September in the western Pacific Ocean and temperature of 30º C surface water can be observed between 164º E and 174º E. The temperature in the eastern pacific remained to
Earth Science 2014; 3(2): 50-57 55
the temperature of 27º C. Temperature is increased during November 2009. The 30º C temperature can be found in the western Pacific, however 27º C in the eastern Pacific. The contour interval is closer in the central Pacific Ocean at a depth of 130 m. The 15º C depth in the eastern Pacific is around 100 m, however in the western Pacific is deepened to 180 m. The depth of 27º C is extended up to 140 m in the central Pacific. The extent and the depth of 29º C over western Pacific is higher during December 2009. The 30º C water can be found up to 50 m depth over 180º E - 194º E, however temperature at the eastern Pacific is 27º C.
3.2.3. Variation of Subsurface Temperatures along 5º S Cross-Section
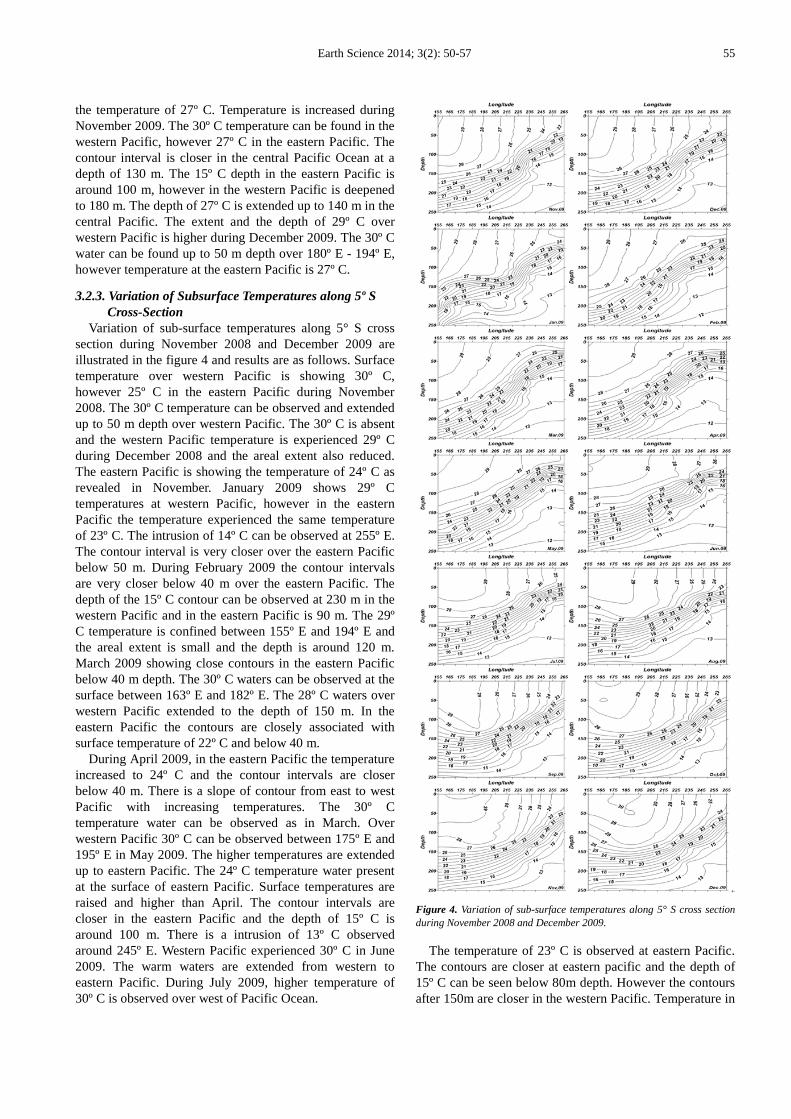
Variation of sub-surface temperatures along 5° S cross section during November 2008 and December 2009 are illustrated in the figure 4 and results are as follows. Surface temperature over western Pacific is showing 30º C, however 25º C in the eastern Pacific during November 2008. The 30º C temperature can be observed and extended up to 50 m depth over western Pacific. The 30º C is absent and the western Pacific temperature is experienced 29º C during December 2008 and the areal extent also reduced. The eastern Pacific is showing the temperature of 24º C as revealed in November. January 2009 shows 29º C temperatures at western Pacific, however in the eastern Pacific the temperature experienced the same temperature of 23º C. The intrusion of 14º C can be observed at 255º E. The contour interval is very closer over the eastern Pacific below 50 m. During February 2009 the contour intervals are very closer below 40 m over the eastern Pacific. The depth of the 15º C contour can be observed at 230 m in the western Pacific and in the eastern Pacific is 90 m. The 29º C temperature is confined between 155º E and 194º E and the areal extent is small and the depth is around 120 m. March 2009 showing close contours in the eastern Pacific below 40 m depth. The 30º C waters can be observed at the surface between 163º E and 182º E. The 28º C waters over western Pacific extended to the depth of 150 m. In the eastern Pacific the contours are closely associated with surface temperature of 22º C and below 40 m.
During April 2009, in the eastern Pacific the temperature increased to 24º C and the contour intervals are closer below 40 m. There is a slope of contour from east to west Pacific with increasing temperatures. The 30º C temperature water can be observed as in March. Over western Pacific 30º C can be observed between 175º E and 195º E in May 2009. The higher temperatures are extended up to eastern Pacific. The 24º C temperature water present at the surface of eastern Pacific. Surface temperatures are raised and higher than April. The contour intervals are closer in the eastern Pacific and the depth of 15º C is around 100 m. There is a intrusion of 13º C observed around 245º E. Western Pacific experienced 30º C in June 2009. The warm waters are extended from western to eastern Pacific. During July 2009, higher temperature of 30º C is observed over west of Pacific Ocean.
Figure 4. Variation of sub-surface temperatures along 5° S cross section during November 2008 and December 2009.
The temperature of 23º C is observed at eastern Pacific. The contours are closer at eastern pacific and the depth of 15º C can be seen below 80m depth. However the contours after 150m are closer in the western Pacific. Temperature in
56 M. V. Subrahmanyam: Surface and Subsurface Temperature Variations during 2009 El Niño Manifestation over Central and Tropical Pacific Ocean
the eastern Pacific increases to 25º C, however in the western Pacific the temperature remains at 30º C during august 2009. During September 2009, higher temperatures in the western pacific with 29º C and in the eastern Pacific the temperature increased to 26º C. The 29º C can be observed n the western Pacific extended up to 120 m. During October 2009, the temperatures at the surface increased than September all over the Pacific Ocean. The temperature in the eastern pacific increased to 27º C. There is a intrusion of 14º C towards shallow depths at 235º E. During November 2009, the temperatures are increased. The 30º C temperature can be found in the western Pacific, however 27º C in the eastern Pacific. The contours are closer in the eastern Pacific Ocean up to the depth of 80 m. The 15º C depth in the eastern pacific is around 85 m, however in the western pacific is deepened to 260 m. The extent and the depth of 30º C over the western pacific is higher during December 2009. The temperature of 30º C can be found between 155º E and 168º E and extended up 50 m depth. The temperature at the eastern pacific is decrease to 26º C. The higher temperature intrusion can be observed from western Pacific up to 230º E. The depth of 15º C deepen up to 250 m in the western Pacific.
3.3. Variation of Surface and Subsurface Temperatures over Nino 3.4 Region
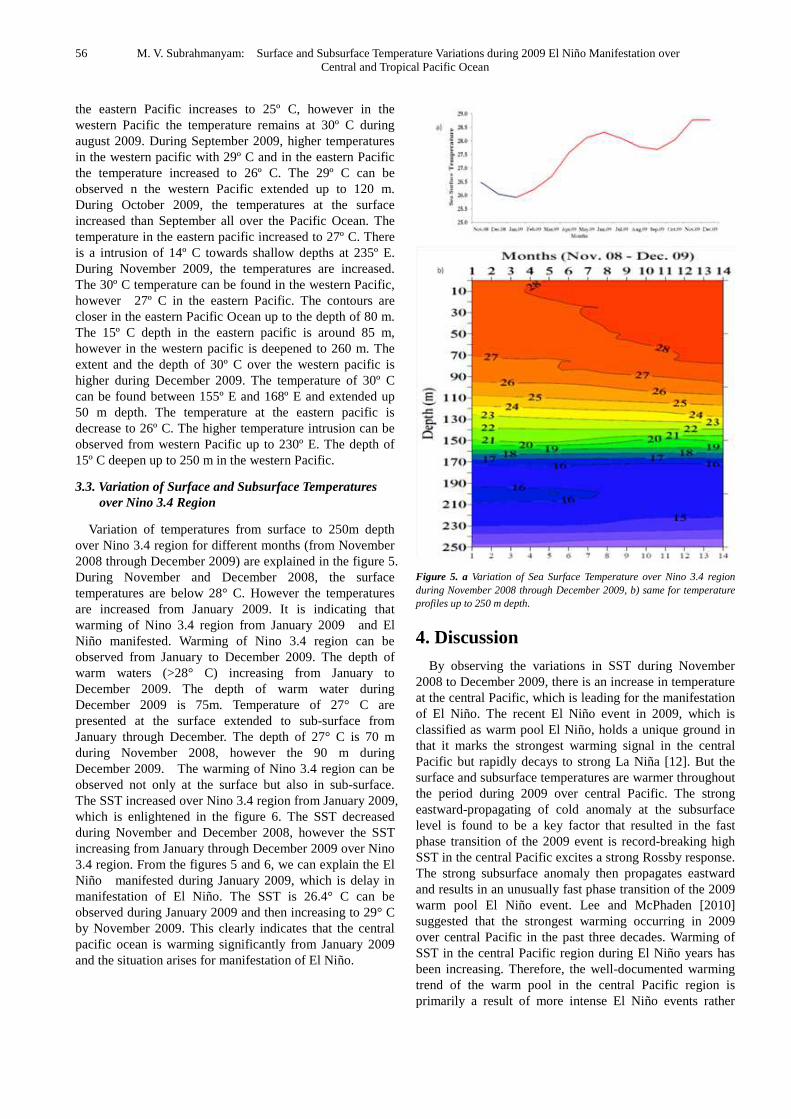
Variation of temperatures from surface to 250m depth over Nino 3.4 region for different months (from November 2008 through December 2009) are explained in the figure 5. During November and December 2008, the surface temperatures are below 28° C. However the temperatures are increased from January 2009. It is indicating that warming of Nino 3.4 region from January 2009 and El Niño manifested. Warming of Nino 3.4 region can be observed from January to December 2009. The depth of warm waters (>28° C) increasing from January to December 2009. The depth of warm water during December 2009 is 75m. Temperature of 27° C are presented at the surface extended to sub-surface from January through December. The depth of 27° C is 70 m during November 2008, however the 90 m during December 2009. The warming of Nino 3.4 region can be observed not only at the surface but also in sub-surface. The SST increased over Nino 3.4 region from January 2009, which is enlightened in the figure 6. The SST decreased during November and December 2008, however the SST increasing from January through December 2009 over Nino 3.4 region. From the figures 5 and 6, we can explain the El Niño manifested during January 2009, which is delay in manifestation of El Niño. The SST is 26.4° C can be observed during January 2009 and then increasing to 29° C by November 2009. This clearly indicates that the central pacific ocean is warming significantly from January 2009 and the situation arises for manifestation of El Niño.
Figure 5. a Variation of Sea Surface Temperature over Nino 3.4 region during November 2008 through December 2009, b) same for temperature profiles up to 250 m depth.
4. Discussion By observing the variations in SST during November
2008 to December 2009, there is an increase in temperature at the central Pacific, which is leading for the manifestation of El Niño. The recent El Niño event in 2009, which is classified as warm pool El Niño, holds a unique ground in that it marks the strongest warming signal in the central Pacific but rapidly decays to strong La Niña [12]. But the surface and subsurface temperatures are warmer throughout the period during 2009 over central Pacific. The strong eastward-propagating of cold anomaly at the subsurface level is found to be a key factor that resulted in the fast phase transition of the 2009 event is record-breaking high SST in the central Pacific excites a strong Rossby response. The strong subsurface anomaly then propagates eastward and results in an unusually fast phase transition of the 2009 warm pool El Niño event. Lee and McPhaden [2010] suggested that the strongest warming occurring in 2009 over central Pacific in the past three decades. Warming of SST in the central Pacific region during El Niño years has been increasing. Therefore, the well-documented warming trend of the warm pool in the central Pacific region is primarily a result of more intense El Niño events rather

Earth Science 2014; 3(2): 50-57 57
than a general rise of background SST. From the figures 2,3 and 4, we can observe that there is a intrusion of subsurface waters to central Pacific up to February and then the surface and subsurface temperatures are increasing, which create the central Pacific warm pool. The same feature is observed not only over equatorial region (figure 2) but also over 5° both sides (figure 3 and 4). Yeh et al. [2011] have also suggested based on a coupled model study that one cannot preclude the possibility of natural variability in causing the more frequent central Pacific El Niño observed in recent decades. McPhaden et al [2011], mentioned that the frequency of central Pacific El Niño increasing, which was proposed by Yeh et al. [2009]. The El Niño feature can be observed not only from the variation of SST, but also can be observed in the sub-surface temperature profiles. The figure 5 indicates that the warming of central Pacific is extending up to sub-surface depths also during 2009. Lee and McPhaden [2010] explained about the warming of central Pacific using 5-day averaged 20° C isotherm variations, the same feature can be observed even with the monthly averaged temperature profile study. So there is a strong warming of central Pacific leading for the manifestation of El Niño 2009.
5. Conclusion This study indicates that there is warm water (>29° C)
present in the western Pacific throughout the study period. In the eastern Pacific upwelling feature can be observed during November and December in 2008. But at the tropical Pacific Ocean the upwelling process is only confined to the eastern part. The temperatures are decreased but the upwelling process do not extended to central Pacific. El Niño phenomena will happens when there is no upwelling process happens in the eastern Pacific. Recently some scientists found that, Warming of central Pacific warming contributing for the for formation of the El Niño phenomenon which manifest El Niño. The same feature of central pacific warming is found during 2009 and it leads to El Niño, but it is mild El Niño as per its intensity and especially delayed El Niño. The same feature can be observed with the surface temperatures data as well as with sub-surface temperature profile data. Higher temperature contours are extended to lower depths in the central Pacific indicating that the waters are warmer as it happens in the El Niño. During November and December 2008 SST decreased over Nino 3.4 region, however SST increased from January 2009 through December 2009. The same feature observed with the sub-surface temperatures also. Further studies has to be done to check the manifestation feature using different oceanographic and atmospheric parameters to get a clear idea..
Acknowledgements Author express his thankfulness to the TAO Project
Office of NOAA/PMEL for providing the data.
References [1] Larkin, N. K., and D. E. Harrison. 2005. Global seasonal
temperature and precipitation anomalies during El Niño autumn and winter, Geophys. Res. Lett., 32 L16705, doi:10.1029/2005GL022860
[2] McPhaden, M. J., S. E. Zebiak, and M. H. Glantz. 2006. ENSO as an integrating concept in Earth science, Science, 314 (1740–1745) doi:10.1126/science.1132588.
[3] Wang, C., and R. H. Weisberg (2000), The 1997–98 El Niño evolution relative to previous El Niño events, Phys. Oceanogr., 13 (488–501) doi:10.1175/1520-0442(2000)
[4] Trenberth, K., and D. P. Stepaniak. 2001. Indices of El Niño evolution, J. Clim., 14 (1697–1701) doi:10.1175/1520-0442(2001)
[5] Larkin, N. K., and D. E. Harrison. 2005a. Global seasonal temperature and precipitation anomalies during El Niño autumn and winter, Geophys. Res. Lett., 32 L16705, doi:10.1029/2005GL022860.
[6] Larkin, N. K., and D. E. Harrison. 2005b. On the definition of El Niño and associated seasonal average U.S. weather anomalies, Geophys. Res. Lett., 32 L13705, doi:10.1029/2005GL022738.
[7] Yu, J.-Y., and H.-Y. Kao (2007), Decadal changes of ENSO persistence barrier in SST and ocean heat content indices: 1958–2001, J. Geophys. Res., 112 D13106, doi:10.1029/2006JD007654.
[8] Ashok, K., S. K. Behera, S. A. Rao, H. Weng, and T. Yamagata (2007). El Niño Modoki and its possible teleconnection, J. Geophys. Res., 112 C11007, doi:10.1029/2006JC003798.
[9] Kao, H.-Y., and J.-Y. Yu. 2009. Contrasting eastern-Pacific and central-Pacific types of ENSO, J. Clim., 22 (615–632) doi:10.1175/2008JCLI2309.1.
[10] Kug, J.-S., F.-F. Jin, and S.-I. An. 2009. Two types of El Niño events: Cold Tongue El Niño and Warm Pool El Niño, J. Clim., 22 (1499–1515) doi:10.1175/2008JCLI2624.1.
[11] Lee, T., and M. J. McPhaden. 2010. Increasing intensity of El Niño in the central-equatorial Pacific, Geophys. Res. Lett., 37 L14603, doi:10.1029/ 2010GL044007
[12] Kim, W., S.-W. Yeh, J.-H. Kim, J.-S. Kug, and M. Kwon. 2011. The unique 2009–2010 El Niño event: A fast phase transition of warm pool El Niño to La Niña, Geophys. Res. Lett., 38 L15809, doi:10.1029/2011GL048521
[13] Yeh, S.-W., B. P. Kirtman, J.!S. Kug, W. Park, and M. Latif (2011), Natural variability of the central Pacific El Niño event on multi-centennial timescales, Geophys. Res. Lett., 38, L02704, doi:10.1029/ 2010GL045886.
[14] McPhaden, M. J., T. Lee, and D. McClurg. 2011. El Niño and its relationship to changing background conditions in the tropical Pacific Ocean, Geophys. Res. Lett., 38 L15709, doi:10.1029/2011GL048275.
[15] Yeh, S.-W., J.-S. Kug, B. Dewitte, M.-H. Kwon, B. P. Kirtman, and F.-F.Jin (2009), El Niño in a changing climate, Nature, 461, 511–514,doi:10.1038/nature08316.