surface and near-surface atmospheric temperatures for the mars exploration rover landing sites
TRANSCRIPT

s
f the twoed radiancetely 1.1 mracterize theratures in thein the dataar-surface
Icarus 180 (2006) 314–320www.elsevier.com/locate/icaru
Surface and near-surface atmospheric temperaturesfor the Mars Exploration Rover landing sites
N. Spanovicha,b,∗, M.D. Smithc, P.H. Smithb, M.J. Wolff d, P.R. Christensene, S.W. Squyresf
a Jet Propulsion Laboratory, MS 264-422, 4800 Oak Grove Drive, Pasadena, CA 91109, USAb Lunar and Planetary Laboratory, University of Arizona, 1629 E. University Boulevard, Tucson, AZ 85721, USA
c NASA Goddard Space Flight Center, Greenbelt, MD 20771, USAd Space Science Institute, 18970 Cavendish Road, Brookfield, WI 53045, USA
e Department of Geological Sciences, Arizona State University, PO Box 871404, Tempe, AZ 85287, USAf Department of Astronomy, Cornell University, 406 Space Sciences, Ithaca, NY 14853, USA
Received 19 January 2005; revised 4 August 2005
Available online 23 November 2005
Abstract
Downward-looking spectra of the martian surface from the Miniature Thermal Emission spectrometer (Mini-TES), onboard each oMars Exploration Rovers, are modeled in order to retrieve surface and near-surface atmospheric temperatures. By fitting the observin the vicinity of the 15-µm CO2 absorption feature, the surface temperature and the near-surface atmospheric temperature, approximaabove the surface, are determined. The temperatures from the first 180 sols (martian days) of each surface mission are used to chadiurnal dependence of temperatures. The near-surface atmospheric temperatures are consistently 20 K cooler than the surface tempewarmest part of each sol, which is 1300–1400 LTST (local true solar time) depending on the location. Seasonal cooling trends are seenby displaying the temperatures as a function of sol. Long ground stares, 8.5 min in duration, show as much as 8 K fluctuation in the neatmospheric temperatures during the early afternoon hours when the near-surface atmosphere is unstable. 2005 Elsevier Inc. All rights reserved.
Keywords: Mars, atmosphere; Mars, climate; Mars, surface
ersccex-dnv
tion
andhetruuse
ni-faceface.va-therices arefromera-
pera-ts onreurnalpera-
1. Introduction
Atmospheric temperatures within the lowest few metabove the martian surface are diagnostic of processes oring within the planetary boundary layer that control thechange of heat and momentum between the surface anmosphere. This region of the atmosphere is also the eronment in which the rovers operate. The Mars ExploraRovers (MER) Athena payload (Squyres et al., 2003) doesnot contain a meteorology package (as did the VikingPathfinder landers) that can measure near-surface atmosptemperature, pressure, and winds directly using in situ insments. However, here we describe a new algorithm thatthe observed absorption in the 15-µm CO2 band in downward-
* Corresponding author. Fax: +1 818 393 2436.E-mail address: [email protected](N. Spanovich).
0019-1035/$ – see front matter 2005 Elsevier Inc. All rights reserved.doi:10.1016/j.icarus.2005.09.014
ur-
at-i-
ric-s
looking MER Miniature Thermal Emission spectrometer (MiTES) observations of the surface to retrieve the near-suratmospheric temperature at about 1.1 m above the surMini-TES is the first infrared spectrometer to take obsertions from the surface of Mars, and here we demonstrateutility of this method for obtaining near-surface atmosphetemperatures. These near-surface atmospheric temperaturcomplementary to the atmospheric temperatures retrievedupward-looking observations, which are sensitive to temptures between 20 m and 2 km above the surface (Smith et al.,2004).
Previous observations of near-surface atmospheric temtures have been made by thermocouples mounted to masthe two Viking landers (Hess et al., 1977) and the Pathfindelander (Schofield et al., 1997) at heights of 0.25 to 1.6 m abovthe surface. Those observations have shown the large diand seasonal variations in near-surface atmospheric tem

MER surface and near-surface temperatures 315
ort
S)red
da
un-dom3
a-at
facinpoine18nd
ths,overares,
on-ypi-eennd
ed toat-been80rva-vers-ckseenand;
del-s
eob-e aise.the
tures that occur on Mars, as well as the fluctuations on shtime scales that are caused by convective turbulence.
2. Data set and retrieval algorithm
2.1. Instrument
The Miniature Thermal Emission spectrometer (Mini-TEis a Michelson interferometer operating in the thermal infrawith a spectral range from 340 to 1997 cm−1 (5–29 µm) in167 spectral channels with a spectral resolution of 10 cm−1
(Christensen et al., 2003). The nominal angular field-of-viewis 20 mrad, which at an angle of 20◦ below the horizoncovers an area on the surface approximately 25 cm inameter. Each Mini-TES spectrum takes two seconds toquire with 1.8 s spent integrating. The combination ofcertainties associated with radiometric precision and rannoise result in an expected radiance uncertainty of about×10−8 Wcm−2 ster−1/cm−1, which corresponds to an equivlent temperature uncertainty of less than 0.3 K at 15 µmtypical surface temperature of 250 K.
2.2. Data set
The data used for the retrieval of surface and near-suratmospheric temperatures are “ground stares” taken by MTES in which spectra are continuously taken of a single son the ground for a period of time. In this paper we examthe more than 800 ground stares observed during the firstsols of each of the two rover missions. Two types of grou
er
i-c-
a
ei-t
0
stares, “short” and “long,” were taken at a pointing of 20◦ be-low the horizon. To ensure accurate calculation of path lengangles translated into the local coordinate system of the rwere used in the retrieval process. The short ground st10–20 s in duration, collect 5–10 spectra and are used to mitor the diurnal and seasonal variation of temperatures. Tcally, one to four short ground stares were collected betw0800 and 1800 LTST (local true solar time). The long groustares, 8.5 min in duration, collect 255 spectra and are uslook for any short time scale variations in the near-surfacemospheric temperature. Fourteen long ground stares havecollected on Opportunity and five on Spirit through sol 1between 1000 and 1730 LTST. A total of 16 overnight obsetions, between 1800 and 0530 LTST, were taken by both roand usually had a pointing of 40◦ below the horizon to accommodate parallel efforts to derive thermal inertia of roand soil. No Mini-TES observations were collected betw0600 and 0750 LTST, when data from previous missionsmodels show the coldest temperatures (Schofield et al., 1997Martin et al., 2003).
2.3. Retrieval algorithm
Near-surface atmospheric temperature is derived by moing the observed radiance within the 15-µm CO2 band. Gaseouabsorption by CO2 is modeled using the correlated-k approxi-mation (Lacis and Oinas, 1991). Although not opaque at thspectral resolution of Mini-TES over the short path lengthsserved, the 15-µm CO2 absorption is strong enough to producspectral feature that is well above the level of instrument noFig. 1 shows three examples from different local times of
c
Fig. 1. Mini-TES ground spectra: Compilation of Mini-TES spectra for three different local times that show an absorption, isothermal, and emissionase.
316 N. Spanovich et al. / Icarus 180 (2006) 314–320
owfacturthetursiopesht d
-at-wi
atuatutweat
hetp
l ath
raturs ipnlusm
raniniionintythesu
herrat
obsy.g.e
tytu
ke
cureri
eri-andgin-r).ob-
dur-athe
thate at-t theions
be-etimefacerredere
d byva-
ateri,ude,per-arlyer-
hericres,
facefacevedK at
ctedthe
t 65e firstith-
thSpiritectsthisbedoca-oundfacee, in-ret ofhas
s be-taset
spectra that make up a short ground stare. The red lines shset of five absorption spectra, taken at 1253 LTST with a surtemperature 29 K warmer than the near-surface temperaThe blue lines show a set of five spectra that are almost isomal, which were taken in the late afternoon with temperadifferences of 1 K. The purple lines show a set of ten emisspectra, taken at 1833 LTST, where the near-surface temture was 6 K warmer than the surface temperature. Theseground stares have a smooth, nearly-blackbody shape thafines the surface temperature, while the CO2 absorption centered at 667 cm−1 (15 µm) is used to retrieve near-surfacemospheric temperature. We model the observed radiancea surface temperature and a single atmospheric temperTherefore, the retrieved near-surface atmospheric temperis an average representative temperature along the path bethe Mini-TES mast height of 1.5 m and the surface. To estimthe effective height of the representative temperature, syntspectra were computed from several assumed temperaturefiles. The synthetic spectrum was run through the retrievagorithm and the effective height was obtained by matchingretrieved near-surface temperature to the assumed tempeprofile. The resulting effective height is 1.1 m about the sface. The effective height is relatively insensitive to changethe elevation angle of the observation and the assumed temature profile (e.g., superadiabatic vs inverted), varying by oabout 1 cm. The surface temperature is derived simultaneoby matching the observed radiance of the spectral region imdiately surrounding the CO2 band.
2.4. Uncertainties
Uncertainties in the retrieved temperatures come fromdom noise and systematic calibration uncertainties in the MTES instrument, and from approximations and assumptmade in the retrieval algorithm. The instrumental uncertacan be estimated directly from the data by calculatingroot-mean-square (rms) spectrum-to-spectrum variation offace temperature in the long ground stares. While atmospturbulence can cause the near-surface atmospheric tempeto vary on short time scales (see Section3.3), we expect surfacetemperature to vary only slowly and systematically. Theserved rms surface temperature variations are 1–2 K. Thetematic uncertainty introduced by the retrieval algorithm (euse of the correlated-k approximation) is small compared to thinstrumental uncertainty, and so we estimate the uncertainthe retrieved surface and near-surface atmospheric temperaas 1–2 K.
3. Results
3.1. Diurnal variations
Surface temperatures retrieved from Mini-TES spectra taby Opportunity at Meridiani Planum (roughly 2◦ S, 6◦ W) fol-low a well-defined diurnal curve with peak temperatures ocring at about 1300 LTST, while the near-surface atmosph
aee.r-
enra-orte-
thre.reen
eicro-l-eure-ner-ylye-
--s
r-icure
-s-,
inres
n
-c
temperatures peak at about 1430 LTST. Opportunity expenced a maximum daily surface temperature of 295 Knear-surface atmospheric temperature of 265 K at the bening of the mission (Ls = 339◦, southern hemisphere summeNear-surface atmospheric temperatures at Meridiani wereserved to rise more slowly than the surface temperatureing the morning hours, but to fall off in the evening atsimilar rate. Surface temperature remained warmer thannear-surface atmospheric temperature until 1630 LTST. Attime, the surface temperatures fell below the near-surfacmospheric temperatures and stayed that way throughoulate evening and overnight. The lack of pre-dawn observatonly allows us to determine that the surface temperaturescame warmer than the near-surface atmosphere again sombetween 0500 and 0750 LTST. The coldest overnight surtemperature observed by Opportunity was 175 K, and occuat 0415 LTST on sol 137. Somewhat lower temperatures wundoubtedly experienced by the rover but were not recordeMini-TES because of the limited number of nighttime obsertions.
Temperatures retrieved from the Spirit rover at Gusev cr(roughly 15◦ S, 185◦ W) are similar to those at Meridianbut there are differences caused by the difference in latitsurface visible albedo, and thermal inertia. The surface temature at Gusev increases more slowly in the morning and eafternoon hours than it does at Meridiani, with peak tempatures occurring at 1400 LTST. The near-surface atmosptemperature variation mirrors that of the surface temperatubut peaks at 1500 LTST. Spirit experienced a maximum surtemperature shortly after landing of 280 K and a near-suratmospheric temperature of 260 K. The minimum obserovernight surface temperature at Gusev crater was 1830040 LTST on sol 180.
Since there were not enough short ground stares colleover any single sol to effectively produce a curve showingdiurnal variation of temperature,Figs. 2 and 3show a combi-nation of all of the short ground stares taken during the firssols of each surface mission. The data are constrained to th65 sols to adequately show the shape of the diurnal curve wout introducing seasonal effects (see Section3.2). Opportunity(Fig. 2) data show well-defined curves with little scatter for bosurface and near-surface atmospheric temperatures, whiledata (Fig. 3) show significant scatter. Since the seasonal effwere reduced by constraining the dataset, the majority ofscatter can be attributed small-scale variations in surface aland thermal inertia (i.e. rocks vs soil) at different rover lotions, causing real changes in surface temperature. The grstare observations were usually taken with no specific surtarget selected, so the chances of having a mixed surfaccluding both rocks and soil, in the Mini-TES field of view ahigh. It is this rock/soil mixture that accounts for a large parthe dispersion seen in the Spirit dataset. The Meridiani sitea more homogeneous surface with a smaller chance of rocking present in the field of view, and therefore produces a dawith less dispersion.

MER surface and near-surface temperatures 317
taint
tai
Fig. 2. Opportunity diurnal curve: Surface (black) temperature and near-surface (red) atmospheric temperature (1.1 m) retrieved from the first 65 sols of Mini-TESspectra as a function of local time. The data are constrained to the first 65 sols to reduce scatter due to the seasonal cooling. The estimated uncery in eachretrieved temperature is 1–2 K. Notice that the surface temperature drops below the near-surface atmospheric temperature in the evening and overnight hours.
Fig. 3. Spirit diurnal curve: Surface (black) temperature and near-surface (red) atmospheric temperature (1.1 m) retrieved from the first 65 sols of Mini-TES spectraas a function of local time. The data are constrained to the first 65 sols to reduce the scatter that is due to the seasonal cooling. The estimated uncernty in eachretrieved temperature is 1–2 K.

318 N. Spanovich et al. / Icarus 180 (2006) 314–320
Fig. 4. Opportunity seasonal plot: Surface (black) temperature and near-surface (red) atmospheric temperature (1.1 m) retrieved from the first 180 sols of Mini-TESspectra as a function of sol. To reduce the scatter from diurnal variations, the data are constrained to local times between 1030 and 1230 LTST. Distinct changes tothe surface temperatures can be linked to specific events during the Opportunity traverse. Opportunity began ingress into Endurance crater around sol 132 and theparameters of all atmospheric Mini-TES observations were changed.
ma
l-ngolasdu
besTSrealinanhe
d b
thngwes to
hetares,ightindi-in ae andfor aric
ppor-b-
seenoisevalsur-
seentionsonsaf-re is
per-om
3.2. Seasonal variations
The data presented here, spanning from the middle oftian southern hemisphere summer (Ls = 327◦) to the end ofsouthern-hemisphere fall (Ls ∼ 60◦), show the expected cooing trend experienced by the two rovers as the seasons chaFigs. 4 and 5show the seasonal curve spanning all 180 sfor the Meridiani and Gusev sites, respectively. Each dathas been constrained to a certain local time range to rethe scatter from changes over a diurnal cycle.Fig. 4, show-ing Opportunity data, has been constrained to local timestween 1030 and 1230 LTST andFig. 5, showing Spirit data, habeen constrained to local times between 1200 and 1500 LThese local times were chosen because they contain the gest number of observations that best represent the seasonfect on the temperatures. The Spirit and Opportunity landsites experienced similar rates of cooling for both surfacenear-surface temperatures. Afternoon near-surface atmosptemperatures decreased by 0.14 K sol−1 at Meridiani, and by0.17 K sol−1 at Gusev. The surface temperature decreaseabout 0.21 K sol−1 at both sites.
3.3. Short time scale variations
Long ground stares were designed to look at variations innear-surface atmospheric temperatures on time scales rafrom two seconds to several minutes. Long ground starestaken at different local times throughout the daytime hour
r-
ed.setce
-
T.at-ef-
gdric
y
eingre
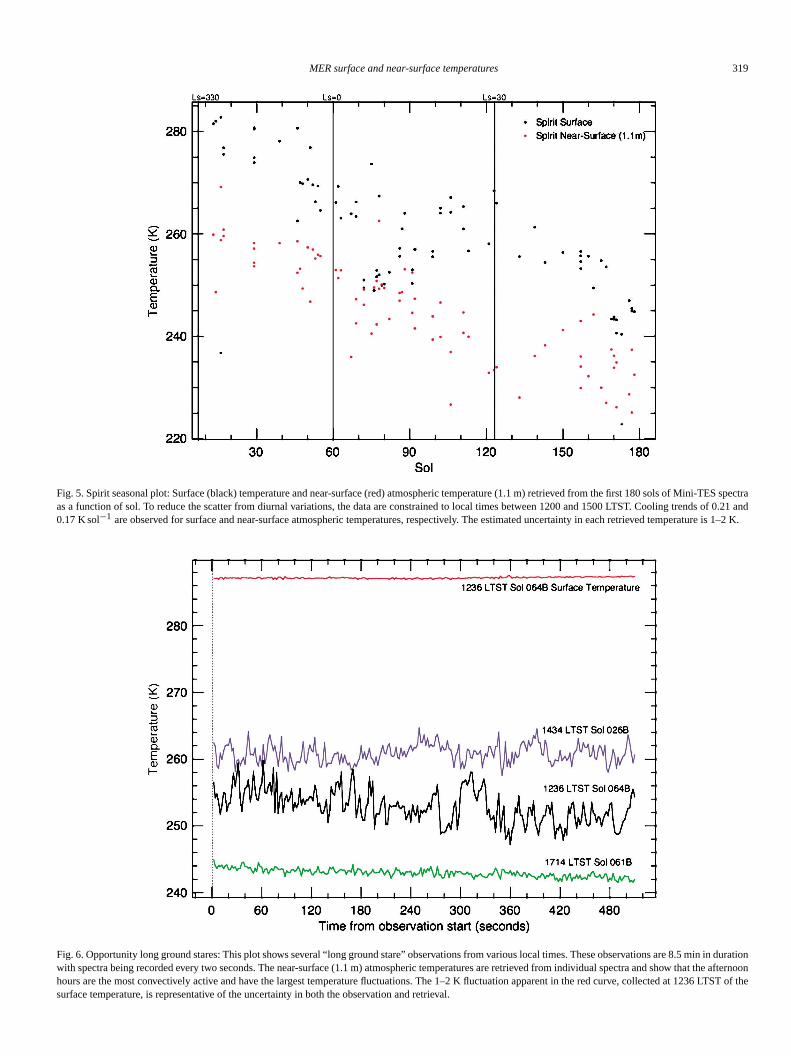
look at the diurnal variation of temperature fluctuations. Tsame retrieval process that is used for the short ground sis also used for the long ground stares, but with the sladjustment that the temperatures are retrieved for eachvidual spectrum instead of for the average of all spectrastare. This provides an independent measure of the surfacnear-surface atmospheric temperatures every two secondsperiod of 8.5 min.Fig. 6 shows the near-surface atmosphetemperatures from these long ground stares, taken on Otunity, at different local times. Morning and late afternoon oservations have little to no temperature fluctuations as isin the green curve taken at 1714 LTST. The combined nlevel, approximately 1 to 2 K, in the observations and retrieare illustrated in the late afternoon green curve and the redface temperature curve. The larger fluctuations, up to 8 K,in the other curves are caused by real temperature variawithin the lowest 1.5 m of the atmosphere. The fluctuatihave maximum amplitude and occur most often during theternoon between 1200 and 1500 LTST, when the atmospheunstable due to convective motions (Smith et al., 2004).
4. Discussion
4.1. Comparison with Viking Lander and Pathfinderobservations
Direct comparison of the near-surface atmospheric tematures derived from Mini-TES observations with those fr
MER surface and near-surface temperatures 319
ore is 1–2
Fig. 5. Spirit seasonal plot: Surface (black) temperature and near-surface (red) atmospheric temperature (1.1 m) retrieved from the first 180 sols ofMini-TES spectraas a function of sol. To reduce the scatter from diurnal variations, the data are constrained to local times between 1200 and 1500 LTST. Cooling trendsf 0.21 and0.17 K sol−1 are observed for surface and near-surface atmospheric temperatures, respectively. The estimated uncertainty in each retrieved temperatuK.
Fig. 6. Opportunity long ground stares: This plot shows several “long ground stare” observations from various local times. These observations are 8.5 min in durationwith spectra being recorded every two seconds. The near-surface (1.1 m) atmospheric temperatures are retrieved from individual spectra and show that the afternoonhours are the most convectively active and have the largest temperature fluctuations. The 1–2 K fluctuation apparent in the red curve, collected at 1236LTST of thesurface temperature, is representative of the uncertainty in both the observation and retrieval.

320 N. Spanovich et al. / Icarus 180 (2006) 314–320
e lo
enwia
minmeas tva
ionthean
owalsto
ateighooyetemargdaser
pe
ceua-hic
rom-
th
en-nityved
butwn)rtu-ights are
Spec-12),
.A.,, R.,S.W.,pre-
ete-hys.
, andphys.
ures. 108
agal-derent.
s of
ey,ris-from
sen,M.,nce
hro-dust
Viking (Tillman, 1988) and Pathfinder (Schofield et al., 1997)measurements is complicated by differences in landing sitcations (22◦ N for Viking Lander 1 and Pathfinder, 48◦ N forViking Lander 2) and thermal characteristics. However, the geral trends observed at the two MER sites are consistentthose of previous missions. Specifically, the near-surfacemospheric temperatures peak near 1500 local time, withima located in the 0500–0800 local time interval (exact tiof minimum varies with season). The seasonal trend ofmospheric temperature for a given local time also possessesame gross behavior among the landing sites, but the largeations in solar insolation (approximately 40% from perihelto aphelion) for the same season in the northern and souhemispheres can produce distinct differences in the coolingwarming rates.
4.2. Comparison with upward-looking Mini-TES observations
Near-surface atmospheric temperatures retrieved from dward-looking Mini-TES spectra extend the range of retrievfrom upward-looking Mini-TES spectra, which are sensitivetemperatures between 20 m and 2 km above the surface (Smithet al., 2004). The peak diurnal temperature at 1.1 m occurs lthan that for the surface, but earlier than that at 20 m. Overntemperatures at 1.1 m are warmer than the surface, but cthan those at 20 m indicating that the nighttime inversion laextends down to at least the 1.1 m level. The large daytimeperature difference between 1.1 and 20 m, and the even ldifference between the surface and 1.1 m, shows that thetime superadiabatic layer becomes even more unstable clothe surface.
4.3. Comparison with modeled temperatures
Comparisons with model predictions of near-surface tematures at the MER landing sites (Martin et al., 2003) show gen-erally good agreement, but also some significant differenMid-afternoon times generally have the poorest fit, but residrarely exceed 15 K. TheMartin et al. (2003)model uses thermal inertia and albedo estimates based on orbital data, ware somewhat different than the values derived directly frover data (Golombek et al., 2005). This difference in parameters can account for much of the discrepancy between
-
-tht--
t-heri-
rnd
n-
rt
lerr-ery-to
r-
s.ls
h
e
modeled and observed temperatures.Martin et al. (2003)usedthe models to predict that Spirit would have a 3% chance ofcountering temperatures below 176 K at 1 m, and Opportua 7% chance. Based on the Mini-TES data collected, retrietemperatures at 1.1 m from Spirit never fell below 183 K,no observations were taken during the very coldest (predatimes. Likewise, retrieved temperatures at 1.1 m from Opponity were also never as cold as 176 K, but very few overnobservations were taken in the season when temperaturegenerally coldest (Smith, 2004).
References
Christensen, P.R., and 19 colleagues, 2003. Miniature Thermal Emissiontrometer for the Mars Exploration Rovers. J. Geophys. Res. 108 (Edoi:10.1029/2003JE002117.
Golombek, M.P., Arvidson, R.E., Bell III, J.F., Christensen, P.R., Crisp, JCrumpler, L.S., Ehlmann, B.L., Fergason, R.L., Grant, J.A., GreeleyHaldemann, A.F.C., Kass, D.M., Parker, T.J., Schofield, J.T., Squyres,Zurek, R.W., 2005. Assessment of Mars Exploration Rover landing sitedictions and implications for climate change. Nature. In press.
Hess, S.L., Henry, R.M., Leovy, C.B., Ryan, J.A., Tillman, J.E., 1977. Morological results from the surface of Mars: Viking 1 and 2. J. GeopRes. 82, 4559–4574.
Lacis, A.A., Oinas, V., 1991. A description of the correlatedk distributedmethod for modeling nongray gaseous absorption, thermal emissionmultiple scattering in vertically inhomogeneous atmospheres. J. GeoRes. 96, 9027–9063.
Martin, T.Z., Bridges, N.T., Murphy, J.R., 2003. Near-surface temperatat proposed Mars Exploration Rover landing sites. J. Geophys. Res(E12),doi:10.1029/2003JE002063. 8089.
Schofield, J.T., Barnes, J.R., Crisp, D., Haberle, R.M., Larsen, S., Mhães, J.A., Murphy, J.R., Seiff, A., Wilson, G., 1997. The Mars Pathfinatmospheric structure investigation/meteorology (ASI/MET) experimScience 278, 1752–1757.
Smith, M.D., 2004. Interannual variability in TES atmospheric observationMars during 1999–2003. Icarus 167, 148–165.
Smith, M.D., Wolff, M.J., Lemmon, M.T., Spanovich, N., Banfield, D., BudnC.J., Clancy, R.T., Ghosh, A., Landis, G.A., Smith, P., Whitney, B., Chtensen, P.R., Squyres, S.W., 2004. First atmospheric science resultsthe Mars Exploration Rovers Mini-TES. Science 306, 1750–1753.
Squyres, S.W., Arvidson, R.E., Baumgartner, E.T., Bell III, J.F., ChristenP.R., Gorevan, S., Herkenhoff, K.E., Klingelhöfer, G., Bo Madsen,Morris, R.V., Rieder, R., Romero, R.A., 2003. Athena Mars Rover scieinvestigation. J. Geophys. Res. 108 (E12),doi:10.1029/2003JE002121.
Tillman, J.E., 1988. Mars global atmospheric oscillations—Annually syncnized, transient normal-mode oscillations and the triggering of globalstorms. J. Geophys. Res. 93, 9433–9451.