suprajit engineering ltd
TRANSCRIPT
IND
IA
INSTITUTIONAL RESEARCH
EISEC Research is also available on Bloomberg and Thomson Reuters
Initiating Coverage
Source: Bloomberg, EISEC Research
| Shareholding pattern (%) Dec-19 Sep-19 Jun-19 Mar-19
Promoter 44.6 44.6 44.5 44.5
FIIs 11.3 13.0 12.0 11.4
DIIs 6.8 5.5 5.1 5.6
Public/others 37.3 36.9 38.4 38.5
Source: AceEquity, EISEC Research
| Price Performance (%)*
YE Mar (R) 1M 3M 12M 36M
Nifty 500 -4.9 -6.3 0.1 19.3
SEL -3.7 7.1 -2.5 -7.9
*as on 2nd Mar 2020; Source: AceEquity, EISEC Research
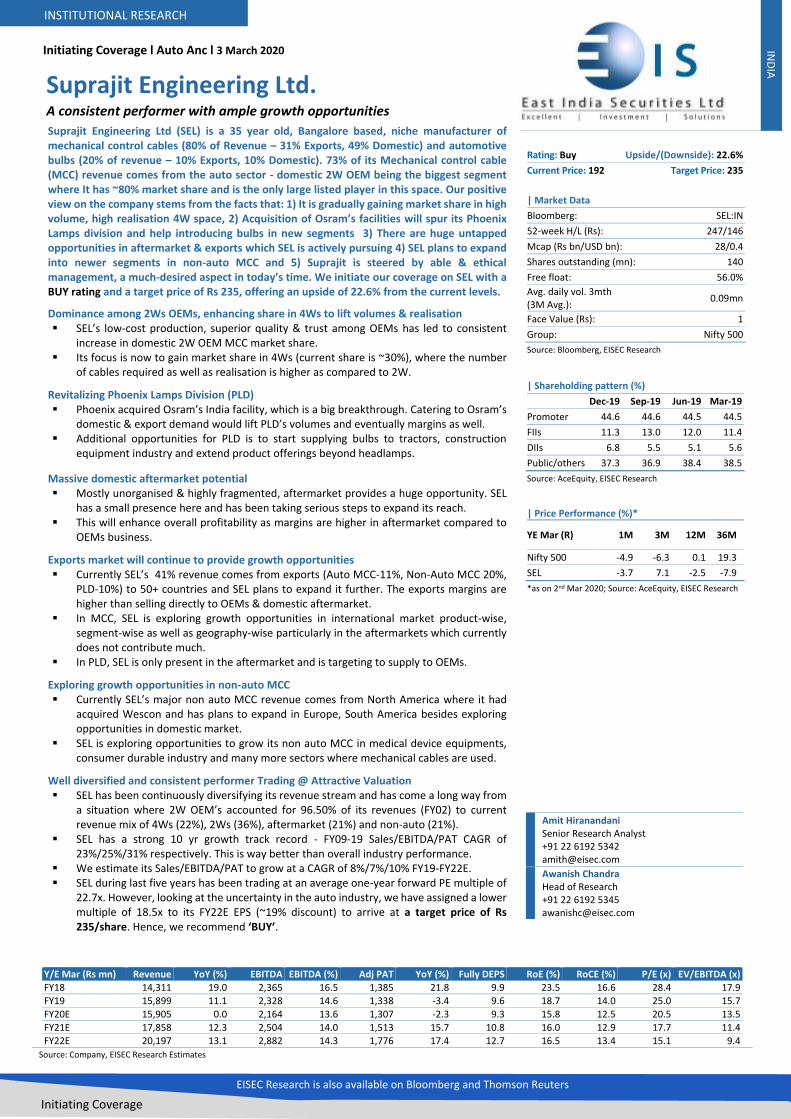
Suprajit Engineering Ltd (SEL) is a 35 year old, Bangalore based, niche manufacturer of mechanical control cables (80% of Revenue – 31% Exports, 49% Domestic) and automotive bulbs (20% of revenue – 10% Exports, 10% Domestic). 73% of its Mechanical control cable (MCC) revenue comes from the auto sector - domestic 2W OEM being the biggest segment where It has ~80% market share and is the only large listed player in this space. Our positive view on the company stems from the facts that: 1) It is gradually gaining market share in high volume, high realisation 4W space, 2) Acquisition of Osram’s facilities will spur its Phoenix Lamps division and help introducing bulbs in new segments 3) There are huge untapped opportunities in aftermarket & exports which SEL is actively pursuing 4) SEL plans to expand into newer segments in non-auto MCC and 5) Suprajit is steered by able & ethical management, a much-desired aspect in today’s time. We initiate our coverage on SEL with a BUY rating and a target price of Rs 235, offering an upside of 22.6% from the current levels. Dominance among 2Ws OEMs, enhancing share in 4Ws to lift volumes & realisation SEL’s low-cost production, superior quality & trust among OEMs has led to consistent
increase in domestic 2W OEM MCC market share. Its focus is now to gain market share in 4Ws (current share is ~30%), where the number
of cables required as well as realisation is higher as compared to 2W. Revitalizing Phoenix Lamps Division (PLD) Phoenix acquired Osram’s India facility, which is a big breakthrough. Catering to Osram’s
domestic & export demand would lift PLD’s volumes and eventually margins as well. Additional opportunities for PLD is to start supplying bulbs to tractors, construction
equipment industry and extend product offerings beyond headlamps. Massive domestic aftermarket potential Mostly unorganised & highly fragmented, aftermarket provides a huge opportunity. SEL
has a small presence here and has been taking serious steps to expand its reach. This will enhance overall profitability as margins are higher in aftermarket compared to
OEMs business. Exports market will continue to provide growth opportunities Currently SEL’s 41% revenue comes from exports (Auto MCC-11%, Non-Auto MCC 20%,
PLD-10%) to 50+ countries and SEL plans to expand it further. The exports margins are higher than selling directly to OEMs & domestic aftermarket.
In MCC, SEL is exploring growth opportunities in international market product-wise, segment-wise as well as geography-wise particularly in the aftermarkets which currently does not contribute much.
In PLD, SEL is only present in the aftermarket and is targeting to supply to OEMs. Exploring growth opportunities in non-auto MCC Currently SEL’s major non auto MCC revenue comes from North America where it had
acquired Wescon and has plans to expand in Europe, South America besides exploring opportunities in domestic market.
SEL is exploring opportunities to grow its non auto MCC in medical device equipments, consumer durable industry and many more sectors where mechanical cables are used.
Well diversified and consistent performer Trading @ Attractive Valuation SEL has been continuously diversifying its revenue stream and has come a long way from
a situation where 2W OEM’s accounted for 96.50% of its revenues (FY02) to current revenue mix of 4Ws (22%), 2Ws (36%), aftermarket (21%) and non-auto (21%).
SEL has a strong 10 yr growth track record - FY09-19 Sales/EBITDA/PAT CAGR of 23%/25%/31% respectively. This is way better than overall industry performance.
We estimate its Sales/EBITDA/PAT to grow at a CAGR of 8%/7%/10% FY19-FY22E. SEL during last five years has been trading at an average one-year forward PE multiple of
22.7x. However, looking at the uncertainty in the auto industry, we have assigned a lower multiple of 18.5x to its FY22E EPS (~19% discount) to arrive at a target price of Rs 235/share. Hence, we recommend ‘BUY’.
Rating: Buy Upside/(Downside): 22.6%
Current Price: 192 Target Price: 235
| Market Data
Bloomberg: SEL:IN
52-week H/L (Rs): 247/146
Mcap (Rs bn/USD bn): 28/0.4
Shares outstanding (mn): 140
Free float: 56.0%
Avg. daily vol. 3mth (3M Avg.):
0.09mn
Face Value (Rs): 1
Group: Nifty 500
Amit Hiranandani Senior Research Analyst +91 22 6192 5342 [email protected]
Awanish Chandra Head of Research +91 22 6192 5345 [email protected]
Initiating Coverage l Auto Anc l 3 March 2020
Report Name: Q2FY20 Update l Sector Name: Auto l 3 March 2020
Suprajit Engineering Ltd. A consistent performer with ample growth opportunities
Despite challenges in the demand environment, TVS Motor Company (TVS) reported good performance on all fronts during 2QFY20. The reported profit jumped by 21% YoY to Rs2,550mn on account of a) lower effective tax rate of 17.8% in Q2FY20 vis-à-vis 31.0% in Q2FY19, b) better operational performance, c) higher other income and d) exceptional gains of Rs760mn. 2HFY20 is expected to be better than 1HFY20 with reasonable growth in exports and presence of levers for margin improvement. However, we believe current valuations already discount most of the positives of the better product mix, growth at export front and margin improvement and hence offer limited upside from here. We assign accumulate rating with target price of Rs. 474 (21xFY21E EPS). Improvement in margins despite sales decline
Revenues declined by 13% yoy, higher than our estimates, while realization increased by 6.9% YoY & 1.4% QoQ. Total volumes degrew by 18.5% YoY in Q2FY20.
EBITDA margin stood at 8.8% in Q2FY20 (+20bps YoY & +80bps QoQ) majorly due to softening of commodity prices, better mix and localisation benefits.
The improvement in margins was despite lower volumes in Q2FY20 and we expect the benefits of soft commodity prices to continue in coming quarters as well.
Sentiments improving; outlook positive
The festivals started on a slow note, but picked up during the last few days of Navratri/Dussehra post clarification on GST, good monsoon & attractive pricing/offers.
Auto industry is looking forward for a better Diwali. On the back of improvement in rural demand, the outlook for Q4FY20 and Q1FY21 is good.
Exports contributing well
TVS exports of 2Ws as well as 3Ws outperformed the industry’s growth rate.
We believe growth momentum at export fronts to continue on account of sufficient dollar availability and stabilization of currency, along with an excellent product portfolio.
All set for a smooth BS6 transition
TVS is going to launch BS6 products November 2019 onwards in a phased manner and would cut down its BS4 inventories much ahead of the transition date.
The inventory is at normal level of five weeks.
Beat estimates on all counts; maintain Accumulate Y/E Mar (Rs mn) Revenue YoY (%) EBITDA EBITDA (%) Adj PAT YoY (%) Fully DEPS RoE (%) RoCE (%) P/E (x) EV/EBITDA (x)
FY18 14,311 19.0 2,365 16.5 1,385 21.8 9.9 23.5 16.6 28.4 17.9
FY19 15,899 11.1 2,328 14.6 1,338 -3.4 9.6 18.7 14.0 25.0 15.7
FY20E 15,905 0.0 2,164 13.6 1,307 -2.3 9.3 15.8 12.5 20.5 13.5
FY21E 17,858 12.3 2,504 14.0 1,513 15.7 10.8 16.0 12.9 17.7 11.4
FY22E 20,197 13.1 2,882 14.3 1,776 17.4 12.7 16.5 13.4 15.1 9.4
Source: Company, EISEC Research Estimates
Suprajit Engineering Ltd. 2 Initiating Coverage
Index Investment thesis in charts ............................................................................................ 3 Dominant player in 2W domestic cables with 80% share in OEMs .................................. 5 Enhancing presence in four-wheelers to lift volumes & realisation ................................. 8 Revitalizing Phoenix Lamps division ............................................................................. 12
So far story endured painful for Lamps division .............................................................. 13 What’s next in the store...? ............................................................................................. 13
Automotive lighting industry ....................................................................................... 15 Gigantic aftermarket potential .................................................................................... 16
Potential for aftermarket cable industry ......................................................................... 16 Additional opportunities for Phoenix in aftermarket ...................................................... 17
Enormous opportunities in exports .............................................................................. 19 Exploring new opportunities in non-auto cables .......................................................... 21 Well diversified across segments, customers, products, location and brand ................. 24
Strategic past acquisitions - a step towards diversification ............................................. 26 Company background .................................................................................................. 27
Company milestones ....................................................................................................... 28 Key takeaways from the past annual reports .................................................................. 31
Financial analysis ......................................................................................................... 33 Corporate governance check ....................................................................................... 35 Valuation and Recommendations ................................................................................ 38 Key Risks ..................................................................................................................... 39
Slowdown in the automobile industry ............................................................................. 39 Commodity price risk ....................................................................................................... 39 Trade war & Brexit concern ............................................................................................. 39 Technological changes ..................................................................................................... 39
Quarterly Financials, Operating Metrics and Key Performance Indicators ..................... 40 Plenty of opportunities in two-wheeler industry .......................................................... 41
Indian two-wheeler industry ........................................................................................... 41 Premiumisation trend is picking up ................................................................................. 41 Scooterisation play in urban can extend in rural as well ................................................. 42 Multiple growth levers..................................................................................................... 42
Key trends shaping PV industry .................................................................................... 43 Passenger vehicle industry .............................................................................................. 43 Macroeconomic favourable trends ................................................................................. 43 Four developments reshaping PV industry ...................................................................... 44
Commercial vehicle (CV) industry ................................................................................ 45 Cyclicality ......................................................................................................................... 45 Competitive scenario ....................................................................................................... 46
Consolidated financials ................................................................................................ 47
Suprajit Engineering Ltd. 3 Initiating Coverage
Investment thesis in charts
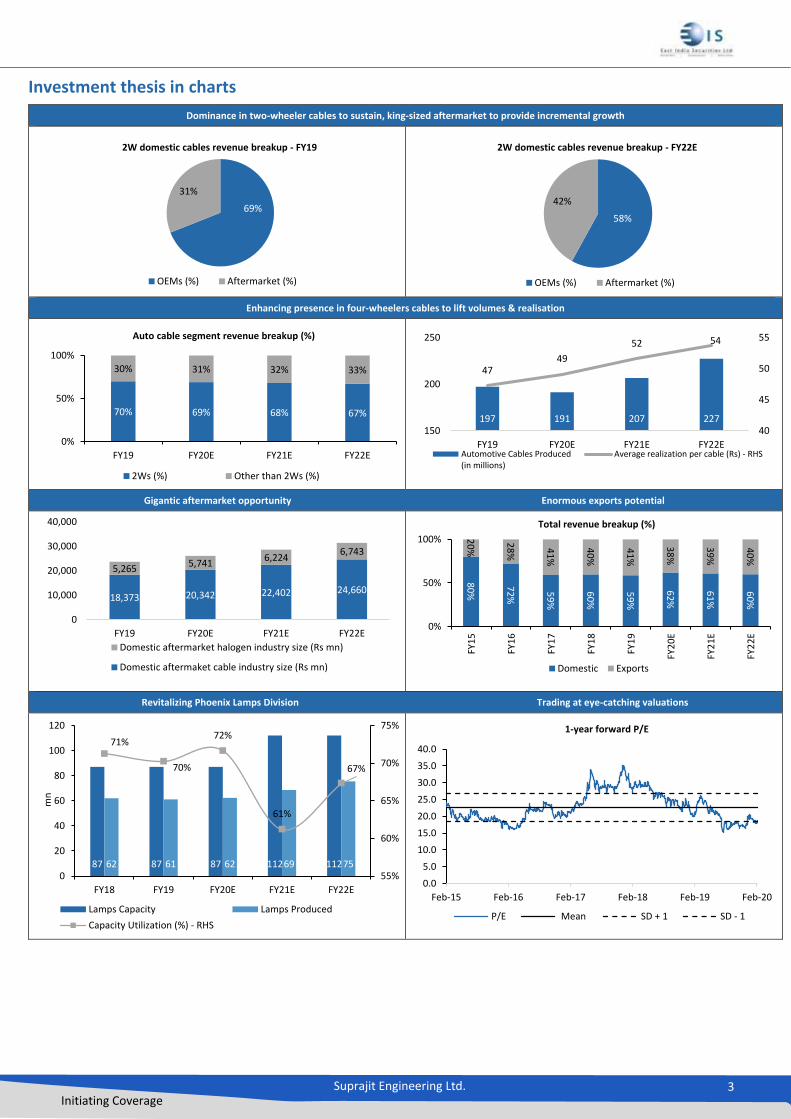
Dominance in two-wheeler cables to sustain, king-sized aftermarket to provide incremental growth
Enhancing presence in four-wheelers cables to lift volumes & realisation
Gigantic aftermarket opportunity Enormous exports potential
Revitalizing Phoenix Lamps Division Trading at eye-catching valuations
69%
31%
2W domestic cables revenue breakup - FY19
OEMs (%) Aftermarket (%)
58%
42%
2W domestic cables revenue breakup - FY22E
OEMs (%) Aftermarket (%)
70% 69% 68% 67%
30% 31% 32% 33%
0%
50%
100%
FY19 FY20E FY21E FY22E
Auto cable segment revenue breakup (%)
2Ws (%) Other than 2Ws (%)
197 191 207 227
4749
52 54
40
45
50
55
150
200
250
FY19 FY20E FY21E FY22EAutomotive Cables Produced(in millions)
Average realization per cable (Rs) - RHS
18,373 20,342 22,402 24,660
5,2655,741
6,2246,743
0
10,000
20,000
30,000
40,000
FY19 FY20E FY21E FY22E
Domestic aftermarket halogen industry size (Rs mn)
Domestic aftermaket cable industry size (Rs mn)
80
%
72
% 59
%
60
%
59
%
62
%
61
%
60
%
20
%
28
% 41
%
40
%
41
%
38
%
39
%
40
%
0%
50%
100%
FY1
5
FY1
6
FY1
7
FY1
8
FY1
9
FY2
0E
FY2
1E
FY2
2E
Total revenue breakup (%)
Domestic Exports
87 87 87 112 11262 61 62 69 75
71%
70%
72%
61%
67%
55%
60%
65%
70%
75%
0
20
40
60
80
100
120
FY18 FY19 FY20E FY21E FY22E
mn
Lamps Capacity Lamps Produced
Capacity Utilization (%) - RHS
0.0
5.0
10.0
15.0
20.0
25.0
30.0
35.0
40.0
Feb-15 Feb-16 Feb-17 Feb-18 Feb-19 Feb-20
1-year forward P/E
P/E Mean SD + 1 SD - 1
Suprajit Engineering Ltd. 4 Initiating Coverage
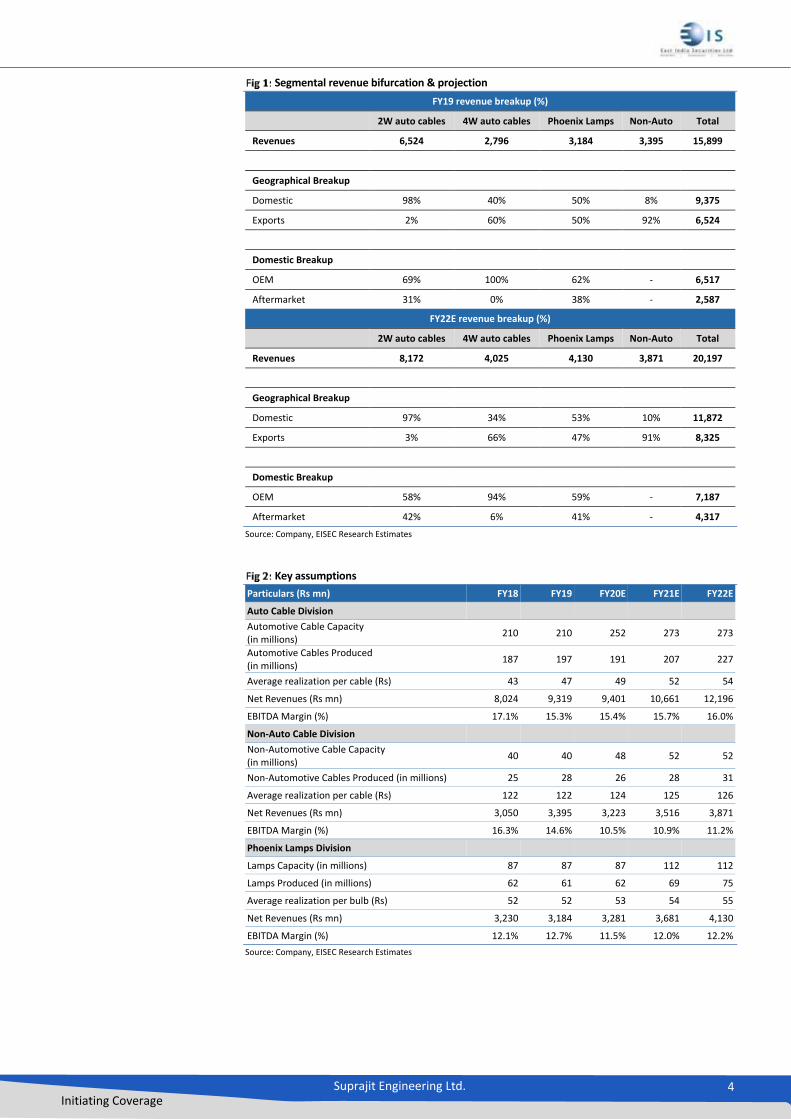
Segmental revenue bifurcation & projection
FY19 revenue breakup (%)
2W auto cables 4W auto cables Phoenix Lamps Non-Auto Total
Revenues 6,524 2,796 3,184 3,395 15,899
Geographical Breakup
Domestic 98% 40% 50% 8% 9,375
Exports 2% 60% 50% 92% 6,524
Domestic Breakup
OEM 69% 100% 62% - 6,517
Aftermarket 31% 0% 38% - 2,587
FY22E revenue breakup (%)
2W auto cables 4W auto cables Phoenix Lamps Non-Auto Total
Revenues 8,172 4,025 4,130 3,871 20,197
Geographical Breakup
Domestic 97% 34% 53% 10% 11,872
Exports 3% 66% 47% 91% 8,325
Domestic Breakup
OEM 58% 94% 59% - 7,187
Aftermarket 42% 6% 41% - 4,317
Source: Company, EISEC Research Estimates
Key assumptions
Particulars (Rs mn) FY18 FY19 FY20E FY21E FY22E
Auto Cable Division
Automotive Cable Capacity (in millions)
210 210 252 273 273
Automotive Cables Produced (in millions)
187 197 191 207 227
Average realization per cable (Rs) 43 47 49 52 54
Net Revenues (Rs mn) 8,024 9,319 9,401 10,661 12,196
EBITDA Margin (%) 17.1% 15.3% 15.4% 15.7% 16.0%
Non-Auto Cable Division
Non-Automotive Cable Capacity (in millions)
40 40 48 52 52
Non-Automotive Cables Produced (in millions) 25 28 26 28 31
Average realization per cable (Rs) 122 122 124 125 126
Net Revenues (Rs mn) 3,050 3,395 3,223 3,516 3,871
EBITDA Margin (%) 16.3% 14.6% 10.5% 10.9% 11.2%
Phoenix Lamps Division
Lamps Capacity (in millions) 87 87 87 112 112
Lamps Produced (in millions) 62 61 62 69 75
Average realization per bulb (Rs) 52 52 53 54 55
Net Revenues (Rs mn) 3,230 3,184 3,281 3,681 4,130
EBITDA Margin (%) 12.1% 12.7% 11.5% 12.0% 12.2%
Source: Company, EISEC Research Estimates
Suprajit Engineering Ltd. 5 Initiating Coverage
Dominant player in 2W domestic cables with 80% share in OEMs
Key arguments
There is immense potential to expand in two-wheeler domestic aftermarket segment, where Suprajit’s market share is close to 16.9%.
Expect to maintain its key dominance in the two-wheeler cables on account of low-cost production, superior quality and a trust built among OEMs.
The product pricing will slightly go up post BS6 due to change in the product specification and technical reasons.
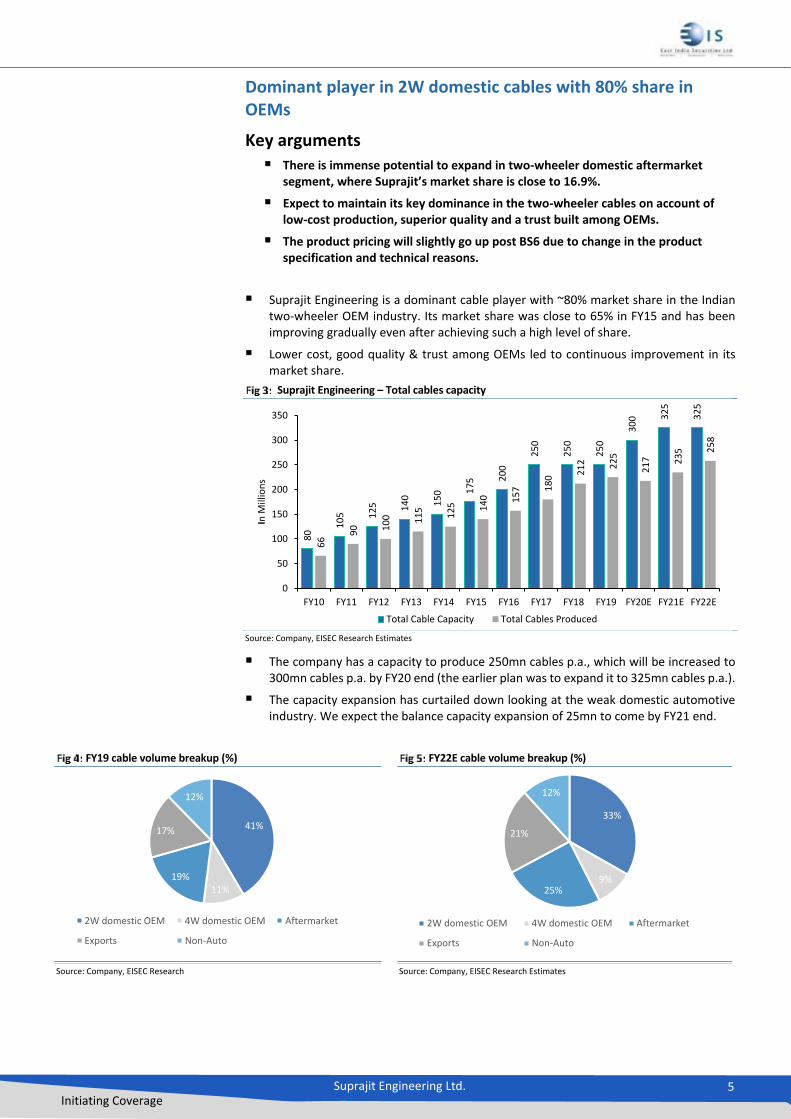
Suprajit Engineering is a dominant cable player with ~80% market share in the Indian two-wheeler OEM industry. Its market share was close to 65% in FY15 and has been improving gradually even after achieving such a high level of share.
Lower cost, good quality & trust among OEMs led to continuous improvement in its market share.
Suprajit Engineering – Total cables capacity
Source: Company, EISEC Research Estimates
The company has a capacity to produce 250mn cables p.a., which will be increased to 300mn cables p.a. by FY20 end (the earlier plan was to expand it to 325mn cables p.a.).
The capacity expansion has curtailed down looking at the weak domestic automotive industry. We expect the balance capacity expansion of 25mn to come by FY21 end.
FY19 cable volume breakup (%) FY22E cable volume breakup (%)
Source: Company, EISEC Research Source: Company, EISEC Research Estimates
80
10
5 12
5 14
0
15
0 17
5 20
0
25
0
25
0
25
0
30
0 32
5
32
5
66
90 1
00 11
5
12
5 14
0 15
7 18
0 21
2 22
5
21
7 23
5 25
8
0
50
100
150
200
250
300
350
FY10 FY11 FY12 FY13 FY14 FY15 FY16 FY17 FY18 FY19 FY20E FY21E FY22E
In M
illio
ns
Total Cable Capacity Total Cables Produced
41%
11%19%
17%
12%
2W domestic OEM 4W domestic OEM Aftermarket
Exports Non-Auto
33%
9%25%
21%
12%
2W domestic OEM 4W domestic OEM Aftermarket
Exports Non-Auto
Suprajit Engineering Ltd. 6 Initiating Coverage
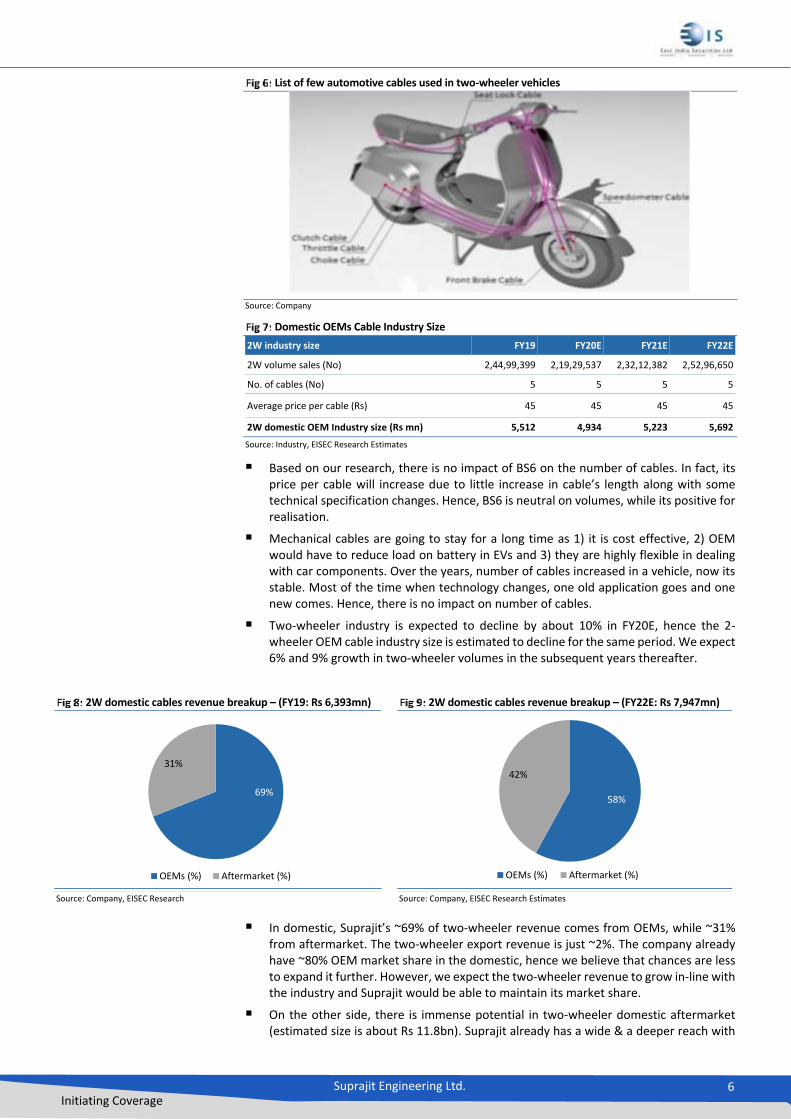
List of few automotive cables used in two-wheeler vehicles
Source: Company
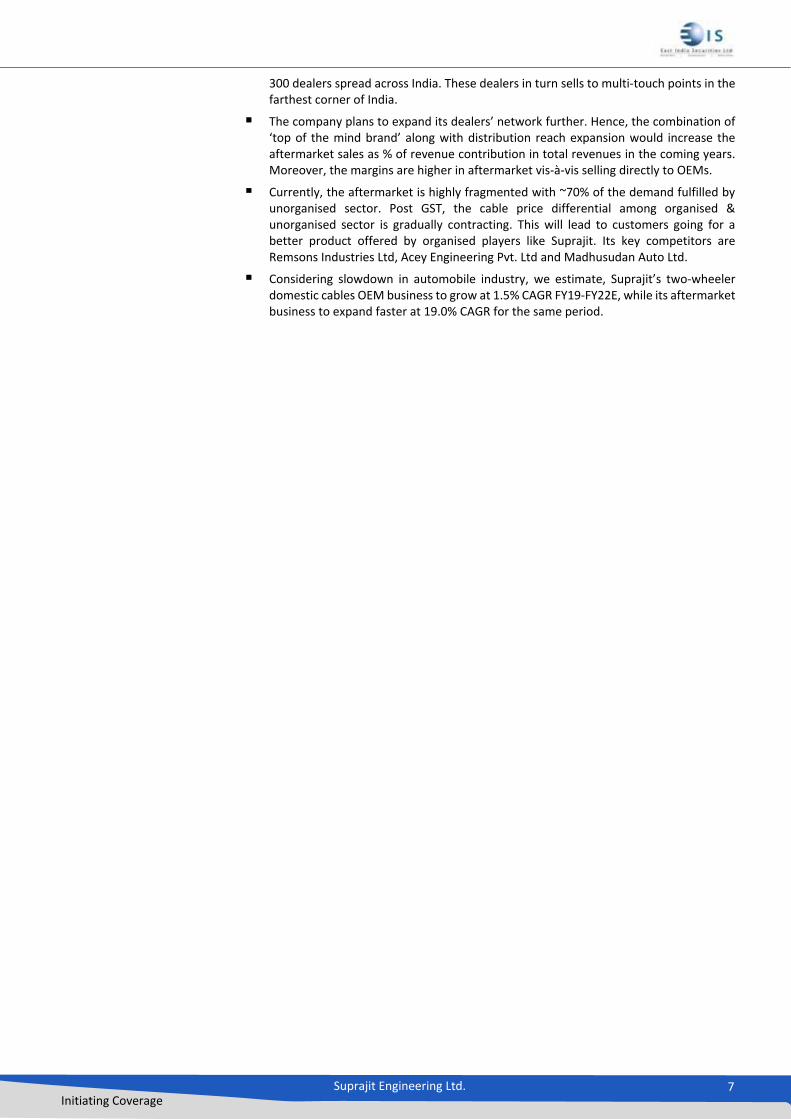
Domestic OEMs Cable Industry Size
2W industry size FY19 FY20E FY21E FY22E
2W volume sales (No) 2,44,99,399 2,19,29,537 2,32,12,382 2,52,96,650
No. of cables (No) 5 5 5 5
Average price per cable (Rs) 45 45 45 45
2W domestic OEM Industry size (Rs mn) 5,512 4,934 5,223 5,692
Source: Industry, EISEC Research Estimates
Based on our research, there is no impact of BS6 on the number of cables. In fact, its price per cable will increase due to little increase in cable’s length along with some technical specification changes. Hence, BS6 is neutral on volumes, while its positive for realisation.
Mechanical cables are going to stay for a long time as 1) it is cost effective, 2) OEM would have to reduce load on battery in EVs and 3) they are highly flexible in dealing with car components. Over the years, number of cables increased in a vehicle, now its stable. Most of the time when technology changes, one old application goes and one new comes. Hence, there is no impact on number of cables.
Two-wheeler industry is expected to decline by about 10% in FY20E, hence the 2-wheeler OEM cable industry size is estimated to decline for the same period. We expect 6% and 9% growth in two-wheeler volumes in the subsequent years thereafter.
2W domestic cables revenue breakup – (FY19: Rs 6,393mn) 2W domestic cables revenue breakup – (FY22E: Rs 7,947mn)
Source: Company, EISEC Research Source: Company, EISEC Research Estimates
In domestic, Suprajit’s ~69% of two-wheeler revenue comes from OEMs, while ~31% from aftermarket. The two-wheeler export revenue is just ~2%. The company already have ~80% OEM market share in the domestic, hence we believe that chances are less to expand it further. However, we expect the two-wheeler revenue to grow in-line with the industry and Suprajit would be able to maintain its market share.
On the other side, there is immense potential in two-wheeler domestic aftermarket (estimated size is about Rs 11.8bn). Suprajit already has a wide & a deeper reach with
69%
31%
OEMs (%) Aftermarket (%)
58%
42%
OEMs (%) Aftermarket (%)
Suprajit Engineering Ltd. 7 Initiating Coverage
300 dealers spread across India. These dealers in turn sells to multi-touch points in the farthest corner of India.
The company plans to expand its dealers’ network further. Hence, the combination of ‘top of the mind brand’ along with distribution reach expansion would increase the aftermarket sales as % of revenue contribution in total revenues in the coming years. Moreover, the margins are higher in aftermarket vis-à-vis selling directly to OEMs.
Currently, the aftermarket is highly fragmented with ~70% of the demand fulfilled by unorganised sector. Post GST, the cable price differential among organised & unorganised sector is gradually contracting. This will lead to customers going for a better product offered by organised players like Suprajit. Its key competitors are Remsons Industries Ltd, Acey Engineering Pvt. Ltd and Madhusudan Auto Ltd.
Considering slowdown in automobile industry, we estimate, Suprajit’s two-wheeler domestic cables OEM business to grow at 1.5% CAGR FY19-FY22E, while its aftermarket business to expand faster at 19.0% CAGR for the same period.

Suprajit Engineering Ltd. 8 Initiating Coverage
Enhancing presence in four-wheelers to lift volumes & realisation
Key arguments
The number of cables required in four-wheelers as well as realisations are higher as compared to two-wheeler cables.
Four-wheelers penetration level is low, while industry pool size is large.
Entry of international OEMs along with localisation strategy would aid in cable industry growth.
The company has entered into manufacturing cables for four-wheelers, post acquisition of Shah Concabs Pvt. Ltd. in the year 2002. Shah Concabs was the leading manufacturer of cables for commercial vehicles in India. In addition, Pricol Ltd has sold its Speedo cables business to Suprajit in FY15. This was an entry point for Suprajit to serve India’s passenger vehicle OEMs. Suprajit’s derives close to 30% of auto cables revenue by selling components to four wheelers.
Automotive cables segment revenue breakup (%)
Source: Company, EISEC Research Estimates
The company’s market share in four wheelers is gradually improving from ~20% in FY15 to close to 30% in FY19, this was majorly on account of the addition of new clients in its kitty and increasing share of business from existing clients. Please note Suprajit is not a direct vendor to Maruti Suzuki and has been supplying few cables as a tier-II vendor.
Four-wheeler auto cable revenues are birfucated below. The management expects increased opportunities from international markets; hence we estimate revenue from exports to grow faster than domestic.
4W cables revenue breakup – (FY19: Rs 2,796mn) 4W cables revenue breakup – (FY22E: Rs 4,025mn)
Source: Company, EISEC Research Source: Company, EISEC Research Estimates
70% 69% 68% 67%
30% 31% 32% 33%
0%
10%
20%
30%
40%
50%
60%
70%
80%
90%
100%
FY19 FY20E FY21E FY22E
2Ws (%) Other than 2Ws (%)
40%
60%
Domestic Exports
34%
66%
Domestic Exports
Suprajit Engineering Ltd. 9 Initiating Coverage
Domestic OEMs Cable Industry Size
PV industry size FY19 FY20E FY21E FY22E
PV volume sales (No) 40,27,669 36,32,915 38,09,064 41,59,181
No. of cables (No) 10 10 10 10
Average price per cable (Rs) 65 65 65 65
PV domestic OEM Industry size (Rs mn) 2,618 2,361 2,476 2,703
CV industry size FY19 FY20E FY21E FY22E
4W volume sales (No) 11,12,212 8,83,848 8,47,845 9,84,537
No. of cables (No) 7 7 7 7
Average price per cable (Rs) 110 110 110 110
CV domestic OEM Industry size (Rs mn) 856 681 653 758
Source: Industry, EISEC Research Estimates
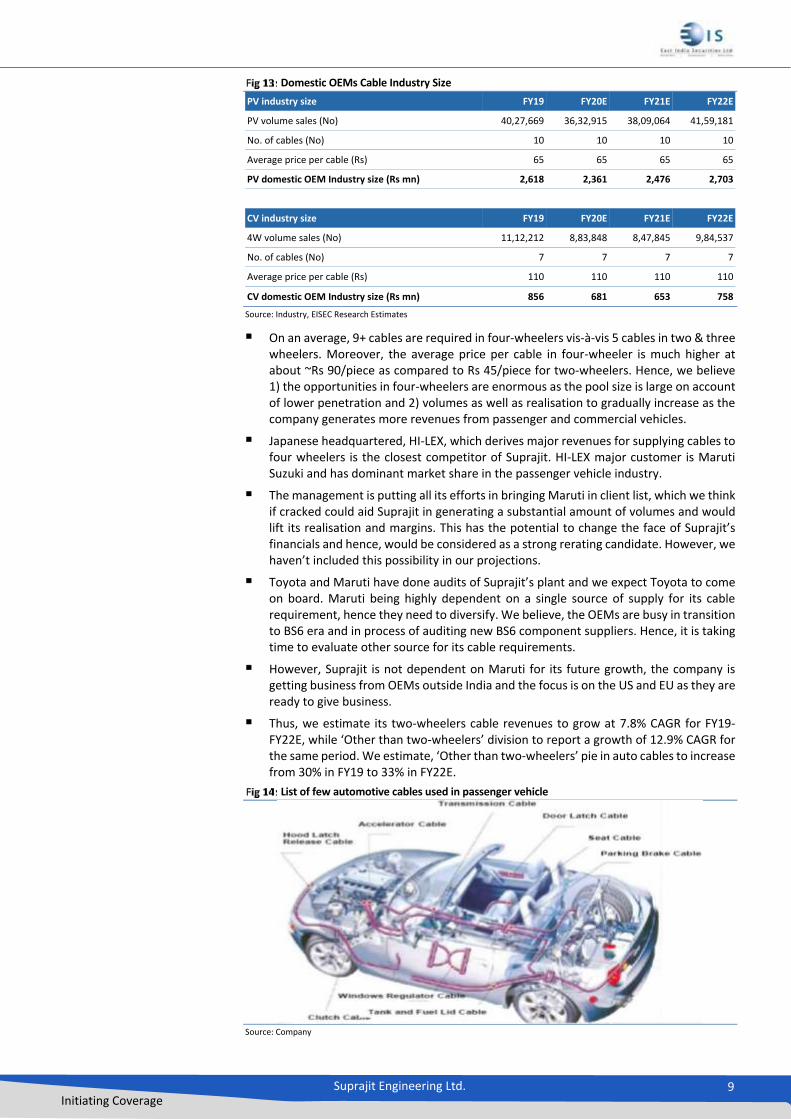
On an average, 9+ cables are required in four-wheelers vis-à-vis 5 cables in two & three wheelers. Moreover, the average price per cable in four-wheeler is much higher at about ~Rs 90/piece as compared to Rs 45/piece for two-wheelers. Hence, we believe 1) the opportunities in four-wheelers are enormous as the pool size is large on account of lower penetration and 2) volumes as well as realisation to gradually increase as the company generates more revenues from passenger and commercial vehicles.
Japanese headquartered, HI-LEX, which derives major revenues for supplying cables to four wheelers is the closest competitor of Suprajit. HI-LEX major customer is Maruti Suzuki and has dominant market share in the passenger vehicle industry.
The management is putting all its efforts in bringing Maruti in client list, which we think if cracked could aid Suprajit in generating a substantial amount of volumes and would lift its realisation and margins. This has the potential to change the face of Suprajit’s financials and hence, would be considered as a strong rerating candidate. However, we haven’t included this possibility in our projections.
Toyota and Maruti have done audits of Suprajit’s plant and we expect Toyota to come on board. Maruti being highly dependent on a single source of supply for its cable requirement, hence they need to diversify. We believe, the OEMs are busy in transition to BS6 era and in process of auditing new BS6 component suppliers. Hence, it is taking time to evaluate other source for its cable requirements.
However, Suprajit is not dependent on Maruti for its future growth, the company is getting business from OEMs outside India and the focus is on the US and EU as they are ready to give business.
Thus, we estimate its two-wheelers cable revenues to grow at 7.8% CAGR for FY19-FY22E, while ‘Other than two-wheelers’ division to report a growth of 12.9% CAGR for the same period. We estimate, ‘Other than two-wheelers’ pie in auto cables to increase from 30% in FY19 to 33% in FY22E.
List of few automotive cables used in passenger vehicle
Source: Company
Suprajit Engineering Ltd. 10 Initiating Coverage
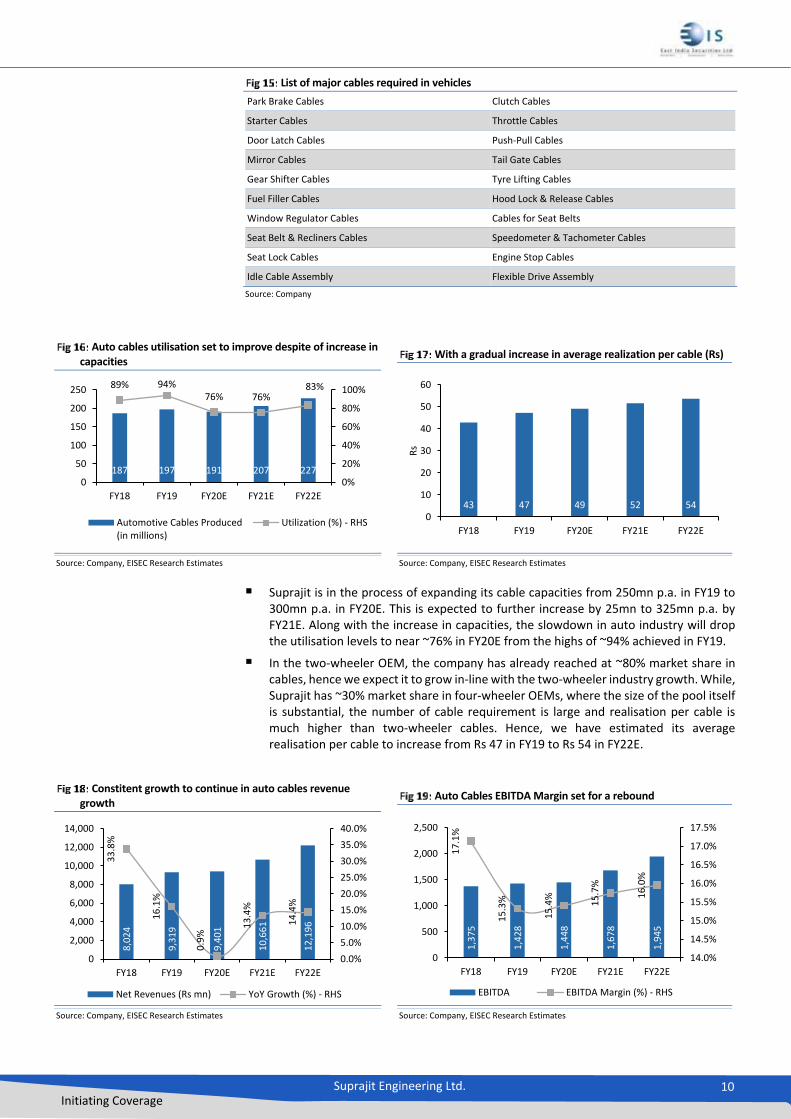
List of major cables required in vehicles
Park Brake Cables Clutch Cables
Starter Cables Throttle Cables
Door Latch Cables Push-Pull Cables
Mirror Cables Tail Gate Cables
Gear Shifter Cables Tyre Lifting Cables
Fuel Filler Cables Hood Lock & Release Cables
Window Regulator Cables Cables for Seat Belts
Seat Belt & Recliners Cables Speedometer & Tachometer Cables
Seat Lock Cables Engine Stop Cables
Idle Cable Assembly Flexible Drive Assembly
Source: Company
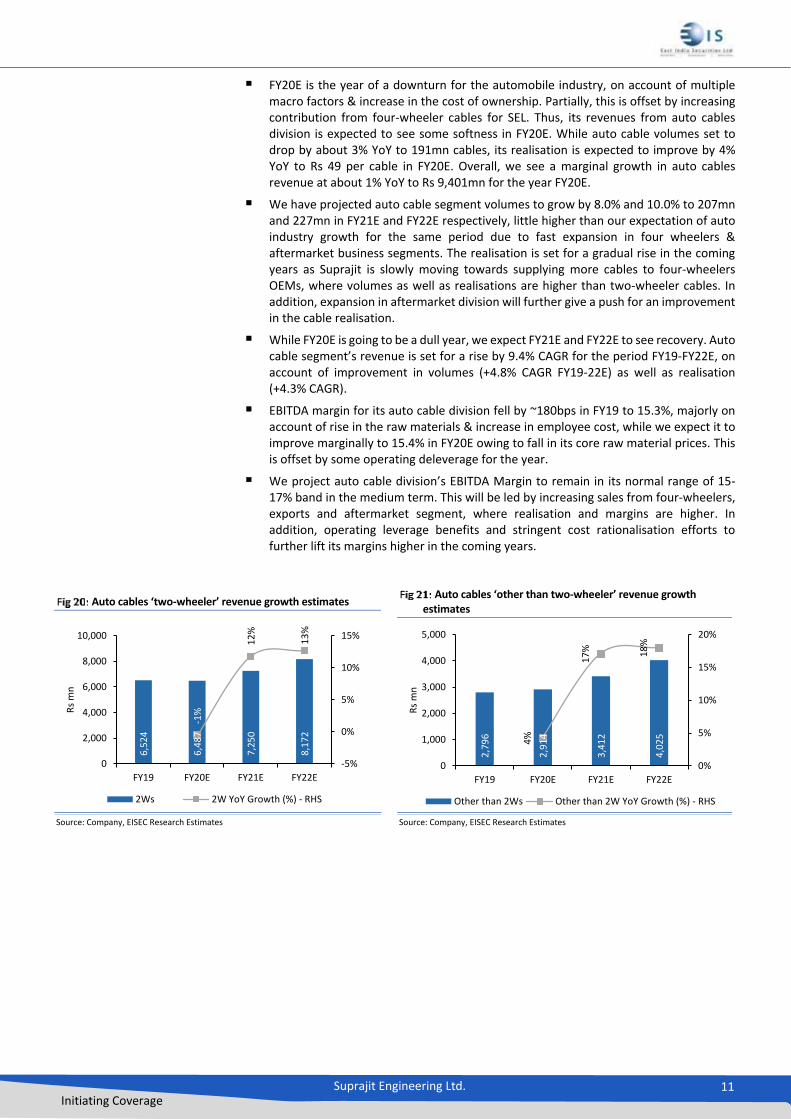
Auto cables utilisation set to improve despite of increase in capacities
With a gradual increase in average realization per cable (Rs)
Source: Company, EISEC Research Estimates Source: Company, EISEC Research Estimates
Suprajit is in the process of expanding its cable capacities from 250mn p.a. in FY19 to 300mn p.a. in FY20E. This is expected to further increase by 25mn to 325mn p.a. by FY21E. Along with the increase in capacities, the slowdown in auto industry will drop the utilisation levels to near ~76% in FY20E from the highs of ~94% achieved in FY19.
In the two-wheeler OEM, the company has already reached at ~80% market share in cables, hence we expect it to grow in-line with the two-wheeler industry growth. While, Suprajit has ~30% market share in four-wheeler OEMs, where the size of the pool itself is substantial, the number of cable requirement is large and realisation per cable is much higher than two-wheeler cables. Hence, we have estimated its average realisation per cable to increase from Rs 47 in FY19 to Rs 54 in FY22E.
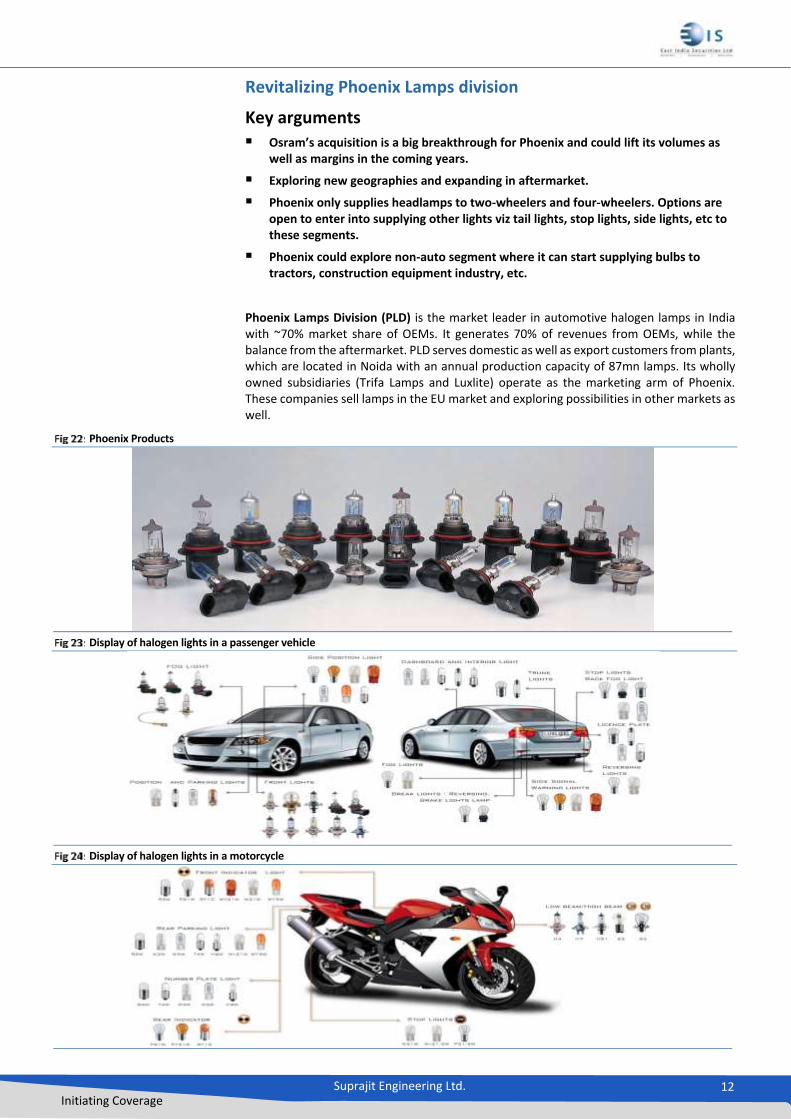
Constitent growth to continue in auto cables revenue growth
Auto Cables EBITDA Margin set for a rebound
Source: Company, EISEC Research Estimates Source: Company, EISEC Research Estimates
187 197 191 207 227
89% 94%76% 76%
83%
0%
20%
40%
60%
80%
100%
0
50
100
150
200
250
FY18 FY19 FY20E FY21E FY22E
Automotive Cables Produced(in millions)
Utilization (%) - RHS
43 47 49 52 540
10
20
30
40
50
60
FY18 FY19 FY20E FY21E FY22E
Rs
8,0
24
9,3
19
9,4
01
10
,66
1
12
,19
6
33
.8%
16
.1%
0.9
%
13
.4%
14
.4%
0.0%
5.0%
10.0%
15.0%
20.0%
25.0%
30.0%
35.0%
40.0%
0
2,000
4,000
6,000
8,000
10,000
12,000
14,000
FY18 FY19 FY20E FY21E FY22E
Net Revenues (Rs mn) YoY Growth (%) - RHS
1,3
75
1,4
28
1,4
48
1,6
78
1,9
45
17
.1%
15
.3%
15
.4%
15
.7%
16
.0%
14.0%
14.5%
15.0%
15.5%
16.0%
16.5%
17.0%
17.5%
0
500
1,000
1,500
2,000
2,500
FY18 FY19 FY20E FY21E FY22E
EBITDA EBITDA Margin (%) - RHS
Suprajit Engineering Ltd. 11 Initiating Coverage
FY20E is the year of a downturn for the automobile industry, on account of multiple macro factors & increase in the cost of ownership. Partially, this is offset by increasing contribution from four-wheeler cables for SEL. Thus, its revenues from auto cables division is expected to see some softness in FY20E. While auto cable volumes set to drop by about 3% YoY to 191mn cables, its realisation is expected to improve by 4% YoY to Rs 49 per cable in FY20E. Overall, we see a marginal growth in auto cables revenue at about 1% YoY to Rs 9,401mn for the year FY20E.
We have projected auto cable segment volumes to grow by 8.0% and 10.0% to 207mn and 227mn in FY21E and FY22E respectively, little higher than our expectation of auto industry growth for the same period due to fast expansion in four wheelers & aftermarket business segments. The realisation is set for a gradual rise in the coming years as Suprajit is slowly moving towards supplying more cables to four-wheelers OEMs, where volumes as well as realisations are higher than two-wheeler cables. In addition, expansion in aftermarket division will further give a push for an improvement in the cable realisation.
While FY20E is going to be a dull year, we expect FY21E and FY22E to see recovery. Auto cable segment’s revenue is set for a rise by 9.4% CAGR for the period FY19-FY22E, on account of improvement in volumes (+4.8% CAGR FY19-22E) as well as realisation (+4.3% CAGR).
EBITDA margin for its auto cable division fell by ~180bps in FY19 to 15.3%, majorly on account of rise in the raw materials & increase in employee cost, while we expect it to improve marginally to 15.4% in FY20E owing to fall in its core raw material prices. This is offset by some operating deleverage for the year.
We project auto cable division’s EBITDA Margin to remain in its normal range of 15-17% band in the medium term. This will be led by increasing sales from four-wheelers, exports and aftermarket segment, where realisation and margins are higher. In addition, operating leverage benefits and stringent cost rationalisation efforts to further lift its margins higher in the coming years.
Auto cables ‘two-wheeler’ revenue growth estimates Auto cables ‘other than two-wheeler’ revenue growth
estimates
Source: Company, EISEC Research Estimates Source: Company, EISEC Research Estimates
6,5
24
6,4
87
7,2
50
8,1
72
-1%
12
%
13
%
-5%
0%
5%
10%
15%
0
2,000
4,000
6,000
8,000
10,000
FY19 FY20E FY21E FY22E
Rs
mn
2Ws 2W YoY Growth (%) - RHS
2,7
96
2,9
14
3,4
12
4,0
25
4%
17
% 18
%
0%
5%
10%
15%
20%
0
1,000
2,000
3,000
4,000
5,000
FY19 FY20E FY21E FY22E
Rs
mn
Other than 2Ws Other than 2W YoY Growth (%) - RHS
Suprajit Engineering Ltd. 12 Initiating Coverage
Revitalizing Phoenix Lamps division
Key arguments
Osram’s acquisition is a big breakthrough for Phoenix and could lift its volumes as well as margins in the coming years.
Exploring new geographies and expanding in aftermarket.
Phoenix only supplies headlamps to two-wheelers and four-wheelers. Options are open to enter into supplying other lights viz tail lights, stop lights, side lights, etc to these segments.
Phoenix could explore non-auto segment where it can start supplying bulbs to tractors, construction equipment industry, etc.
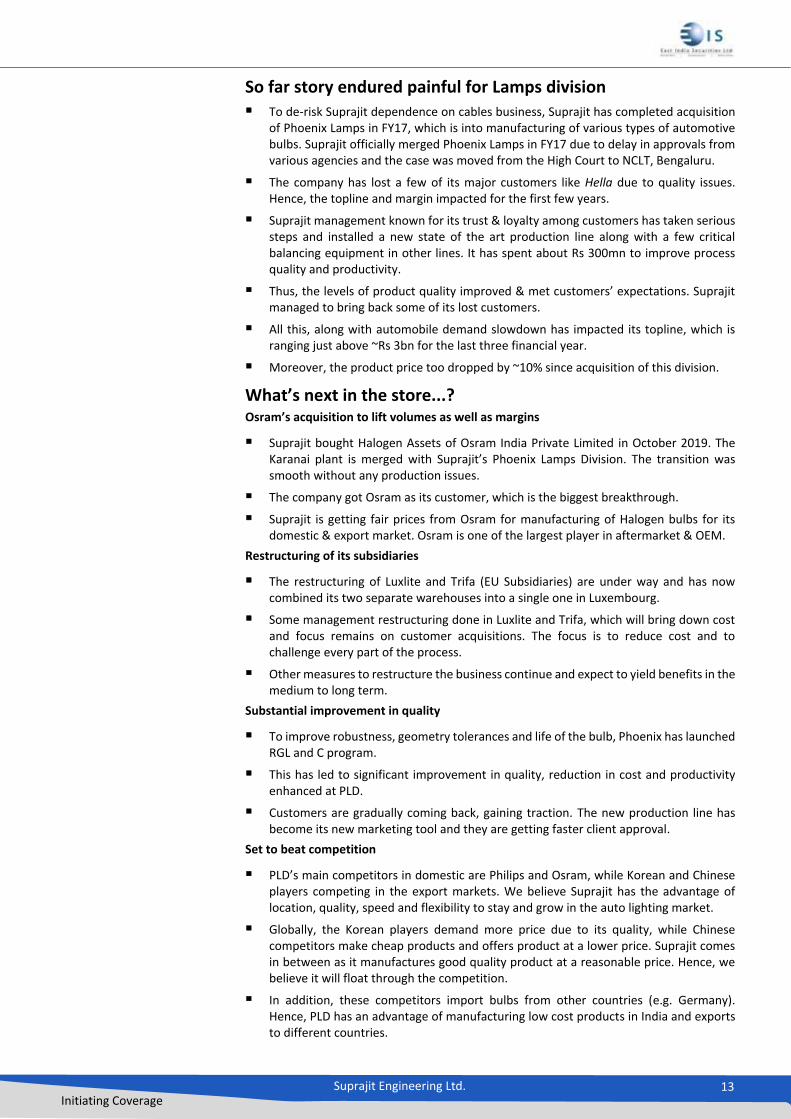
Phoenix Lamps Division (PLD) is the market leader in automotive halogen lamps in India with ~70% market share of OEMs. It generates 70% of revenues from OEMs, while the balance from the aftermarket. PLD serves domestic as well as export customers from plants, which are located in Noida with an annual production capacity of 87mn lamps. Its wholly owned subsidiaries (Trifa Lamps and Luxlite) operate as the marketing arm of Phoenix. These companies sell lamps in the EU market and exploring possibilities in other markets as well.
Phoenix Products
Display of halogen lights in a passenger vehicle
Display of halogen lights in a motorcycle
Suprajit Engineering Ltd. 13 Initiating Coverage
So far story endured painful for Lamps division
To de-risk Suprajit dependence on cables business, Suprajit has completed acquisition of Phoenix Lamps in FY17, which is into manufacturing of various types of automotive bulbs. Suprajit officially merged Phoenix Lamps in FY17 due to delay in approvals from various agencies and the case was moved from the High Court to NCLT, Bengaluru.
The company has lost a few of its major customers like Hella due to quality issues. Hence, the topline and margin impacted for the first few years.
Suprajit management known for its trust & loyalty among customers has taken serious steps and installed a new state of the art production line along with a few critical balancing equipment in other lines. It has spent about Rs 300mn to improve process quality and productivity.
Thus, the levels of product quality improved & met customers’ expectations. Suprajit managed to bring back some of its lost customers.
All this, along with automobile demand slowdown has impacted its topline, which is ranging just above ~Rs 3bn for the last three financial year.
Moreover, the product price too dropped by ~10% since acquisition of this division.
What’s next in the store...? Osram’s acquisition to lift volumes as well as margins
Suprajit bought Halogen Assets of Osram India Private Limited in October 2019. The Karanai plant is merged with Suprajit’s Phoenix Lamps Division. The transition was smooth without any production issues.
The company got Osram as its customer, which is the biggest breakthrough.
Suprajit is getting fair prices from Osram for manufacturing of Halogen bulbs for its domestic & export market. Osram is one of the largest player in aftermarket & OEM.
Restructuring of its subsidiaries
The restructuring of Luxlite and Trifa (EU Subsidiaries) are under way and has now combined its two separate warehouses into a single one in Luxembourg.
Some management restructuring done in Luxlite and Trifa, which will bring down cost and focus remains on customer acquisitions. The focus is to reduce cost and to challenge every part of the process.
Other measures to restructure the business continue and expect to yield benefits in the medium to long term.
Substantial improvement in quality
To improve robustness, geometry tolerances and life of the bulb, Phoenix has launched RGL and C program.
This has led to significant improvement in quality, reduction in cost and productivity enhanced at PLD.
Customers are gradually coming back, gaining traction. The new production line has become its new marketing tool and they are getting faster client approval.
Set to beat competition
PLD’s main competitors in domestic are Philips and Osram, while Korean and Chinese players competing in the export markets. We believe Suprajit has the advantage of location, quality, speed and flexibility to stay and grow in the auto lighting market.
Globally, the Korean players demand more price due to its quality, while Chinese competitors make cheap products and offers product at a lower price. Suprajit comes in between as it manufactures good quality product at a reasonable price. Hence, we believe it will float through the competition.
In addition, these competitors import bulbs from other countries (e.g. Germany). Hence, PLD has an advantage of manufacturing low cost products in India and exports to different countries.

Suprajit Engineering Ltd. 14 Initiating Coverage
In domestic market, PLD has the largest capacity of 87mn bulbs (plus addition of 25mn bulbs post Osram’s plant acquisition). Its nearest competitor has 30mn of capacity.
Phoenix’s two-wheeler OEM market share is close to 70%, while in passenger vehicle OEM the share remains in the range of 60-70%. Phoenix has good potential to expand in the aftermarket division as its share is close to 11%. The company is taking branding efforts and increasing distribution channels to increase its share in the aftermarket and we expect it to reach ~13% by FY22E.
Suprajit Engineering Ltd. 15 Initiating Coverage
Automotive lighting industry
Key arguments
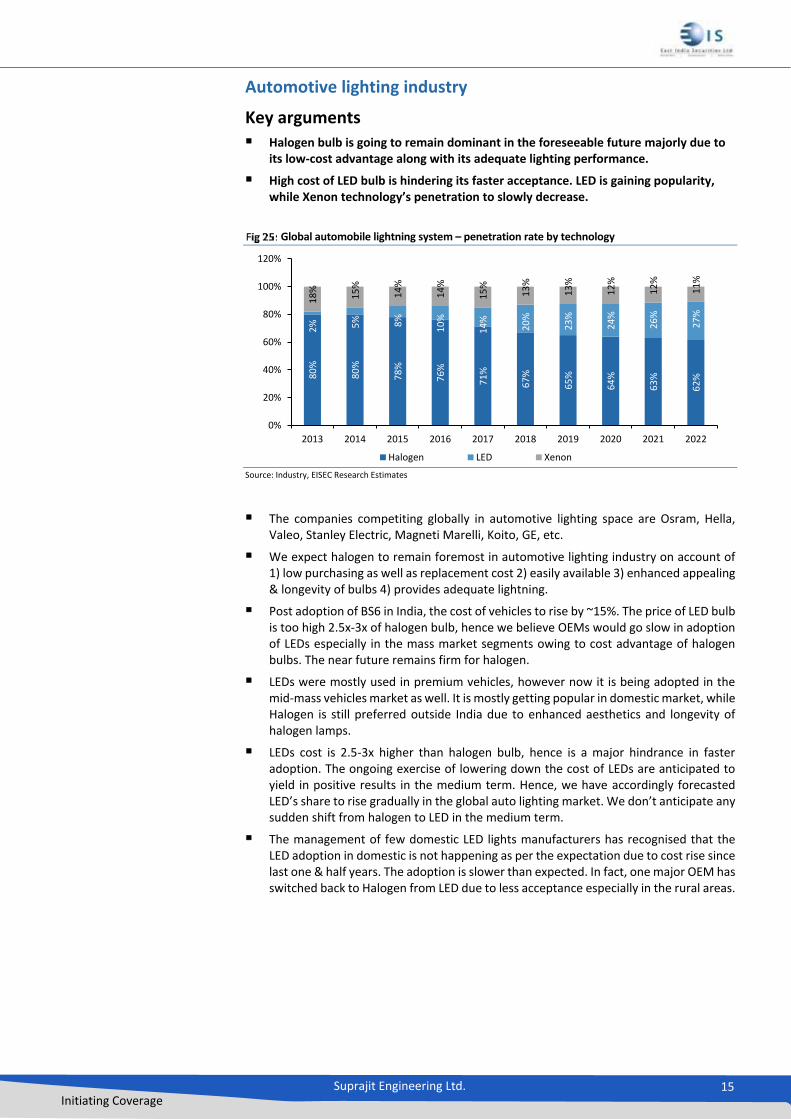
Halogen bulb is going to remain dominant in the foreseeable future majorly due to its low-cost advantage along with its adequate lighting performance.
High cost of LED bulb is hindering its faster acceptance. LED is gaining popularity, while Xenon technology’s penetration to slowly decrease.
Global automobile lightning system – penetration rate by technology
Source: Industry, EISEC Research Estimates
The companies competiting globally in automotive lighting space are Osram, Hella, Valeo, Stanley Electric, Magneti Marelli, Koito, GE, etc.
We expect halogen to remain foremost in automotive lighting industry on account of 1) low purchasing as well as replacement cost 2) easily available 3) enhanced appealing & longevity of bulbs 4) provides adequate lightning.
Post adoption of BS6 in India, the cost of vehicles to rise by ~15%. The price of LED bulb is too high 2.5x-3x of halogen bulb, hence we believe OEMs would go slow in adoption of LEDs especially in the mass market segments owing to cost advantage of halogen bulbs. The near future remains firm for halogen.
LEDs were mostly used in premium vehicles, however now it is being adopted in the mid-mass vehicles market as well. It is mostly getting popular in domestic market, while Halogen is still preferred outside India due to enhanced aesthetics and longevity of halogen lamps.
LEDs cost is 2.5-3x higher than halogen bulb, hence is a major hindrance in faster adoption. The ongoing exercise of lowering down the cost of LEDs are anticipated to yield in positive results in the medium term. Hence, we have accordingly forecasted LED’s share to rise gradually in the global auto lighting market. We don’t anticipate any sudden shift from halogen to LED in the medium term.
The management of few domestic LED lights manufacturers has recognised that the LED adoption in domestic is not happening as per the expectation due to cost rise since last one & half years. The adoption is slower than expected. In fact, one major OEM has switched back to Halogen from LED due to less acceptance especially in the rural areas.
80
%
80
%
78
%
76
%
71
%
67
%
65
%
64
%
63
%
62
%
2% 5% 8%
10
%
14
%
20
%
23
%
24
%
26
%
27
%
18
%
15
%
14
%
14
%
15
%
13
%
13
%
12
%
12
%
11
%
0%
20%
40%
60%
80%
100%
120%
2013 2014 2015 2016 2017 2018 2019 2020 2021 2022
Halogen LED Xenon
Suprajit Engineering Ltd. 16 Initiating Coverage
Gigantic aftermarket potential
Key arguments
Suprajit’s minimal presence in the aftermarket and king-sized opportunity makes a perfect match for the company to grow exponentially.
It will help in reducing cyclicality in the automobile business segment.
Expect substantial growth in aftermarket of cables and lamps division.
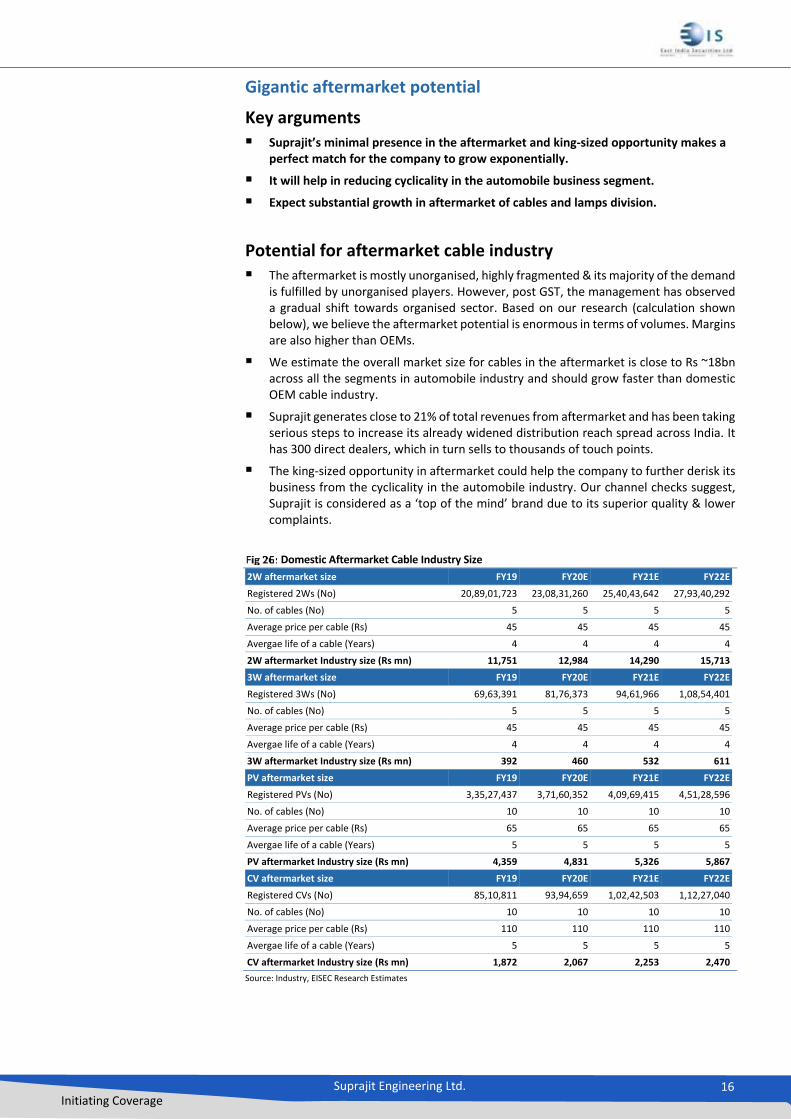
Potential for aftermarket cable industry
The aftermarket is mostly unorganised, highly fragmented & its majority of the demand is fulfilled by unorganised players. However, post GST, the management has observed a gradual shift towards organised sector. Based on our research (calculation shown below), we believe the aftermarket potential is enormous in terms of volumes. Margins are also higher than OEMs.
We estimate the overall market size for cables in the aftermarket is close to Rs ~18bn across all the segments in automobile industry and should grow faster than domestic OEM cable industry.
Suprajit generates close to 21% of total revenues from aftermarket and has been taking serious steps to increase its already widened distribution reach spread across India. It has 300 direct dealers, which in turn sells to thousands of touch points.
The king-sized opportunity in aftermarket could help the company to further derisk its business from the cyclicality in the automobile industry. Our channel checks suggest, Suprajit is considered as a ‘top of the mind’ brand due to its superior quality & lower complaints.
Domestic Aftermarket Cable Industry Size
2W aftermarket size FY19 FY20E FY21E FY22E
Registered 2Ws (No) 20,89,01,723 23,08,31,260 25,40,43,642 27,93,40,292
No. of cables (No) 5 5 5 5
Average price per cable (Rs) 45 45 45 45
Avergae life of a cable (Years) 4 4 4 4
2W aftermarket Industry size (Rs mn) 11,751 12,984 14,290 15,713
3W aftermarket size FY19 FY20E FY21E FY22E
Registered 3Ws (No) 69,63,391 81,76,373 94,61,966 1,08,54,401
No. of cables (No) 5 5 5 5
Average price per cable (Rs) 45 45 45 45
Avergae life of a cable (Years) 4 4 4 4
3W aftermarket Industry size (Rs mn) 392 460 532 611
PV aftermarket size FY19 FY20E FY21E FY22E
Registered PVs (No) 3,35,27,437 3,71,60,352 4,09,69,415 4,51,28,596
No. of cables (No) 10 10 10 10
Average price per cable (Rs) 65 65 65 65
Avergae life of a cable (Years) 5 5 5 5
PV aftermarket Industry size (Rs mn) 4,359 4,831 5,326 5,867
CV aftermarket size FY19 FY20E FY21E FY22E
Registered CVs (No) 85,10,811 93,94,659 1,02,42,503 1,12,27,040
No. of cables (No) 10 10 10 10
Average price per cable (Rs) 110 110 110 110
Avergae life of a cable (Years) 5 5 5 5
CV aftermarket Industry size (Rs mn) 1,872 2,067 2,253 2,470
Source: Industry, EISEC Research Estimates
Suprajit Engineering Ltd. 17 Initiating Coverage
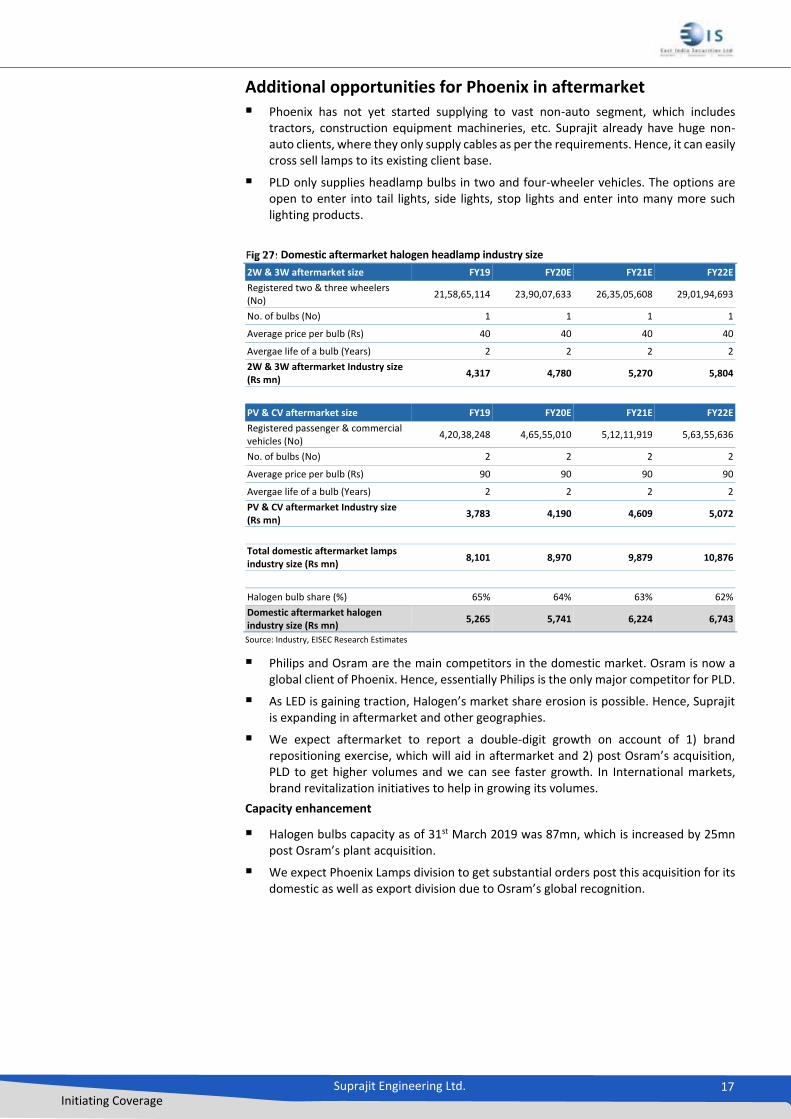
Additional opportunities for Phoenix in aftermarket
Phoenix has not yet started supplying to vast non-auto segment, which includes tractors, construction equipment machineries, etc. Suprajit already have huge non-auto clients, where they only supply cables as per the requirements. Hence, it can easily cross sell lamps to its existing client base.
PLD only supplies headlamp bulbs in two and four-wheeler vehicles. The options are open to enter into tail lights, side lights, stop lights and enter into many more such lighting products.
Domestic aftermarket halogen headlamp industry size
2W & 3W aftermarket size FY19 FY20E FY21E FY22E
Registered two & three wheelers (No)
21,58,65,114 23,90,07,633 26,35,05,608 29,01,94,693
No. of bulbs (No) 1 1 1 1
Average price per bulb (Rs) 40 40 40 40
Avergae life of a bulb (Years) 2 2 2 2
2W & 3W aftermarket Industry size (Rs mn)
4,317 4,780 5,270 5,804
PV & CV aftermarket size FY19 FY20E FY21E FY22E
Registered passenger & commercial vehicles (No)
4,20,38,248 4,65,55,010 5,12,11,919 5,63,55,636
No. of bulbs (No) 2 2 2 2
Average price per bulb (Rs) 90 90 90 90
Avergae life of a bulb (Years) 2 2 2 2
PV & CV aftermarket Industry size (Rs mn)
3,783 4,190 4,609 5,072
Total domestic aftermarket lamps industry size (Rs mn)
8,101 8,970 9,879 10,876
Halogen bulb share (%) 65% 64% 63% 62%
Domestic aftermarket halogen industry size (Rs mn)
5,265 5,741 6,224 6,743
Source: Industry, EISEC Research Estimates
Philips and Osram are the main competitors in the domestic market. Osram is now a global client of Phoenix. Hence, essentially Philips is the only major competitor for PLD.
As LED is gaining traction, Halogen’s market share erosion is possible. Hence, Suprajit is expanding in aftermarket and other geographies.
We expect aftermarket to report a double-digit growth on account of 1) brand repositioning exercise, which will aid in aftermarket and 2) post Osram’s acquisition, PLD to get higher volumes and we can see faster growth. In International markets, brand revitalization initiatives to help in growing its volumes.
Capacity enhancement
Halogen bulbs capacity as of 31st March 2019 was 87mn, which is increased by 25mn post Osram’s plant acquisition.
We expect Phoenix Lamps division to get substantial orders post this acquisition for its domestic as well as export division due to Osram’s global recognition.
Suprajit Engineering Ltd. 18 Initiating Coverage
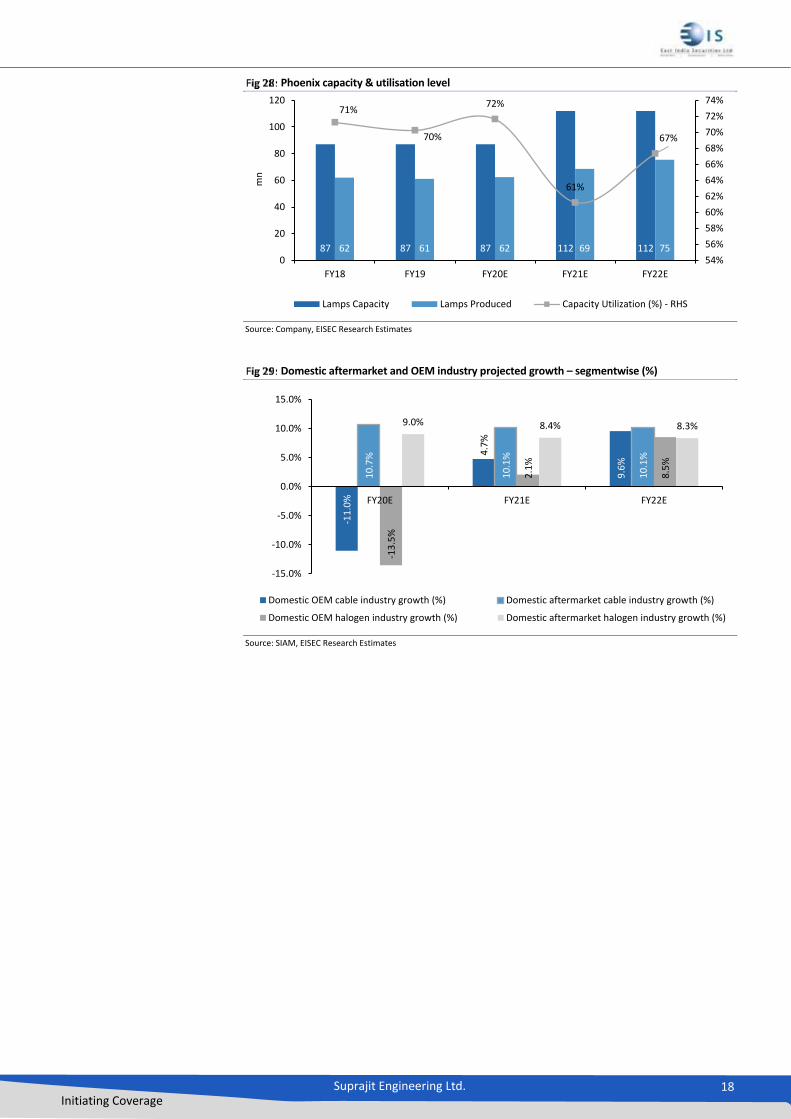
Phoenix capacity & utilisation level
Source: Company, EISEC Research Estimates
Domestic aftermarket and OEM industry projected growth – segmentwise (%)
Source: SIAM, EISEC Research Estimates
87 87 87 112 11262 61 62 69 75
71%
70%
72%
61%
67%
54%
56%
58%
60%
62%
64%
66%
68%
70%
72%
74%
0
20
40
60
80
100
120
FY18 FY19 FY20E FY21E FY22E
mn
Lamps Capacity Lamps Produced Capacity Utilization (%) - RHS
-11
.0%
4.7
%
9.6
%
10
.7%
10
.1%
10
.1%
-13
.5%
2.1
%
8.5
%
9.0% 8.4% 8.3%
-15.0%
-10.0%
-5.0%
0.0%
5.0%
10.0%
15.0%
FY20E FY21E FY22E
Domestic OEM cable industry growth (%) Domestic aftermarket cable industry growth (%)
Domestic OEM halogen industry growth (%) Domestic aftermarket halogen industry growth (%)
Suprajit Engineering Ltd. 19 Initiating Coverage
Enormous opportunities in exports
Key arguments
Phoenix Lamps only supply to the aftermarket in exports. Hence, there are immense opportunities on the OEMs side in international markets.
Cables in aftermarket outside India is still unexplored as entire four-wheeler cables gets supplied only to OEMs.
Exports realisation is higher than selling directly to OEMs & aftermarket.
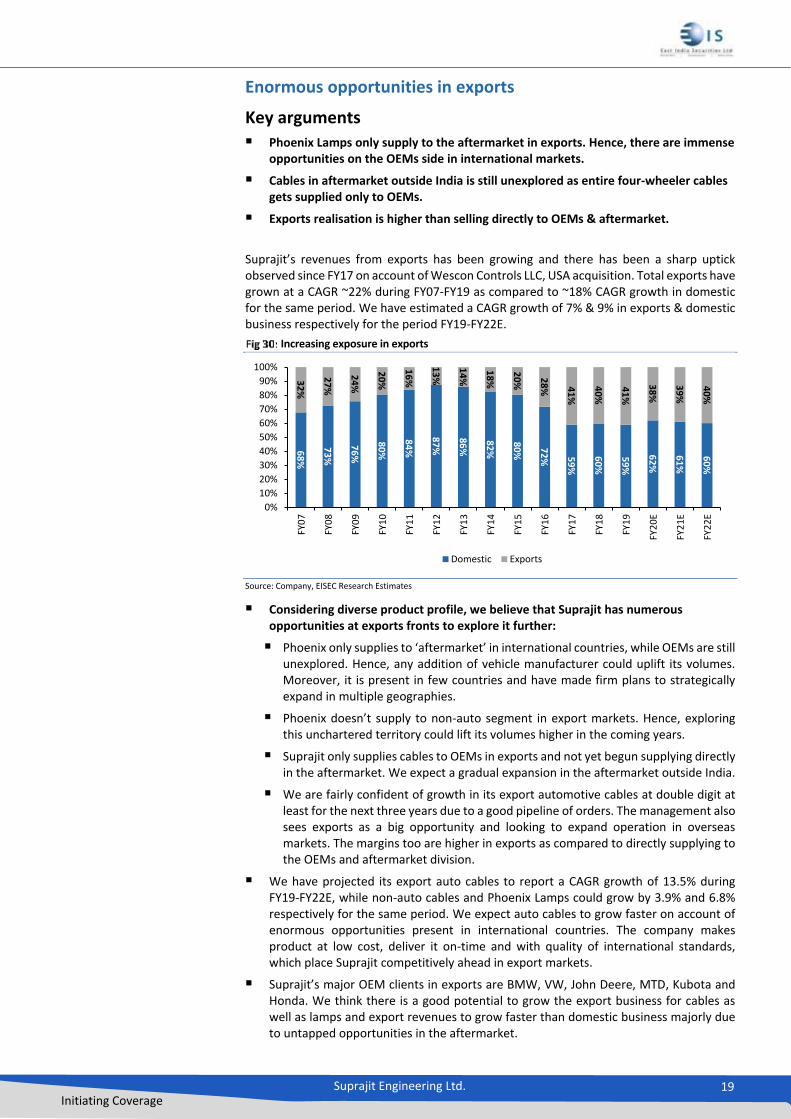
Suprajit’s revenues from exports has been growing and there has been a sharp uptick observed since FY17 on account of Wescon Controls LLC, USA acquisition. Total exports have grown at a CAGR ~22% during FY07-FY19 as compared to ~18% CAGR growth in domestic for the same period. We have estimated a CAGR growth of 7% & 9% in exports & domestic business respectively for the period FY19-FY22E.
Increasing exposure in exports
Source: Company, EISEC Research Estimates
Considering diverse product profile, we believe that Suprajit has numerous opportunities at exports fronts to explore it further:
Phoenix only supplies to ‘aftermarket’ in international countries, while OEMs are still unexplored. Hence, any addition of vehicle manufacturer could uplift its volumes. Moreover, it is present in few countries and have made firm plans to strategically expand in multiple geographies.
Phoenix doesn’t supply to non-auto segment in export markets. Hence, exploring this unchartered territory could lift its volumes higher in the coming years.
Suprajit only supplies cables to OEMs in exports and not yet begun supplying directly in the aftermarket. We expect a gradual expansion in the aftermarket outside India.
We are fairly confident of growth in its export automotive cables at double digit at least for the next three years due to a good pipeline of orders. The management also sees exports as a big opportunity and looking to expand operation in overseas markets. The margins too are higher in exports as compared to directly supplying to the OEMs and aftermarket division.
We have projected its export auto cables to report a CAGR growth of 13.5% during FY19-FY22E, while non-auto cables and Phoenix Lamps could grow by 3.9% and 6.8% respectively for the same period. We expect auto cables to grow faster on account of enormous opportunities present in international countries. The company makes product at low cost, deliver it on-time and with quality of international standards, which place Suprajit competitively ahead in export markets.
Suprajit’s major OEM clients in exports are BMW, VW, John Deere, MTD, Kubota and Honda. We think there is a good potential to grow the export business for cables as well as lamps and export revenues to grow faster than domestic business majorly due to untapped opportunities in the aftermarket.
68
%
73
%
76
%
80
%
84
%
87
%
86
%
82
%
80
% 72
% 59
%
60
%
59
%
62
%
61
%
60
%
32
%
27
%
24
%
20
%
16
%
13
%
14
%
18
%
20
% 28
% 41
%
40
%
41
%
38
%
39
%
40
%
0%
10%
20%
30%
40%
50%
60%
70%
80%
90%
100%
FY0
7
FY0
8
FY0
9
FY1
0
FY1
1
FY1
2
FY1
3
FY1
4
FY1
5
FY1
6
FY1
7
FY1
8
FY1
9
FY2
0E
FY2
1E
FY2
2E
Domestic Exports
Suprajit Engineering Ltd. 20 Initiating Coverage
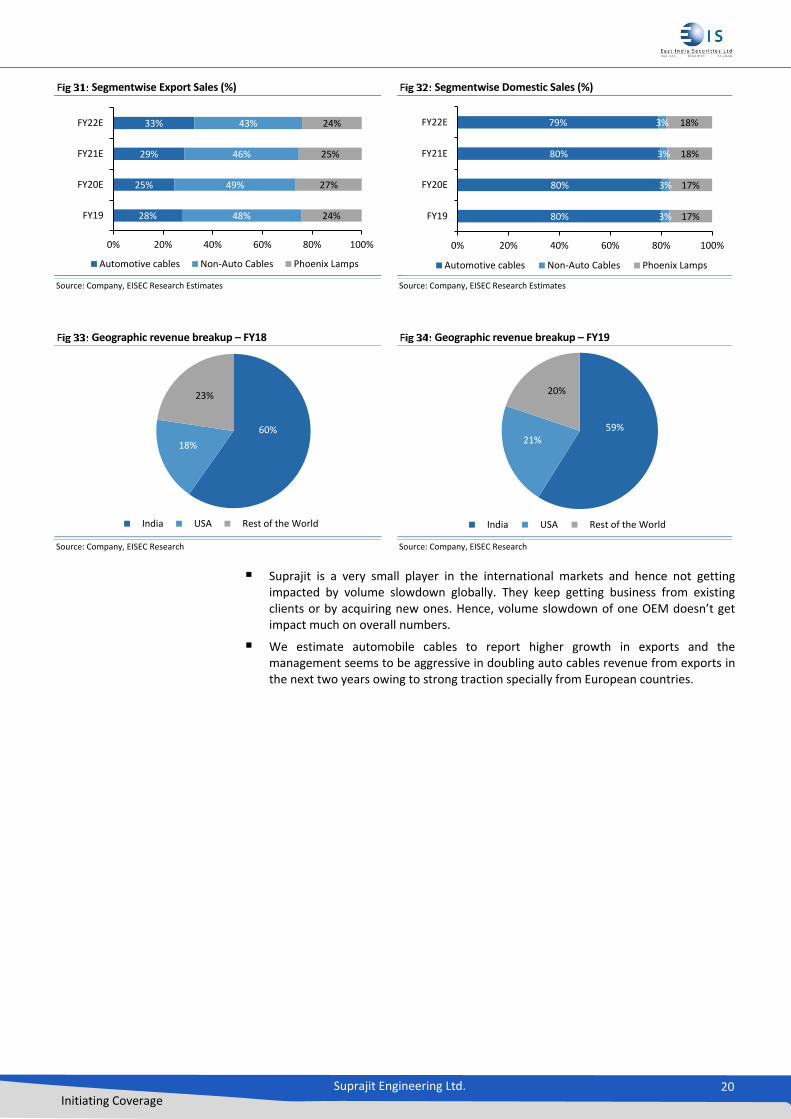
Segmentwise Export Sales (%) Segmentwise Domestic Sales (%)
Source: Company, EISEC Research Estimates Source: Company, EISEC Research Estimates
Geographic revenue breakup – FY18 Geographic revenue breakup – FY19
Source: Company, EISEC Research Source: Company, EISEC Research
Suprajit is a very small player in the international markets and hence not getting impacted by volume slowdown globally. They keep getting business from existing clients or by acquiring new ones. Hence, volume slowdown of one OEM doesn’t get impact much on overall numbers.
We estimate automobile cables to report higher growth in exports and the management seems to be aggressive in doubling auto cables revenue from exports in the next two years owing to strong traction specially from European countries.
28%
25%
29%
33%
48%
49%
46%
43%
24%
27%
25%
24%
0% 20% 40% 60% 80% 100%
FY19
FY20E
FY21E
FY22E
Automotive cables Non-Auto Cables Phoenix Lamps
80%
80%
80%
79%
3%
3%
3%
3%
17%
17%
18%
18%
0% 20% 40% 60% 80% 100%
FY19
FY20E
FY21E
FY22E
Automotive cables Non-Auto Cables Phoenix Lamps
60%
18%
23%
India USA Rest of the World
59%21%
20%
India USA Rest of the World
Suprajit Engineering Ltd. 21 Initiating Coverage
Exploring new opportunities in non-auto cables
Key arguments
The options are open to explore into unchartered territory in medical device equipments, consumer durables, agriculture, construction equipment and many more related industries where mechanical cables are used.
Geographic expansion – Suprajit is mostly present in the North America, entering into EU, South America. There are possibilities of growth in domestic as well.
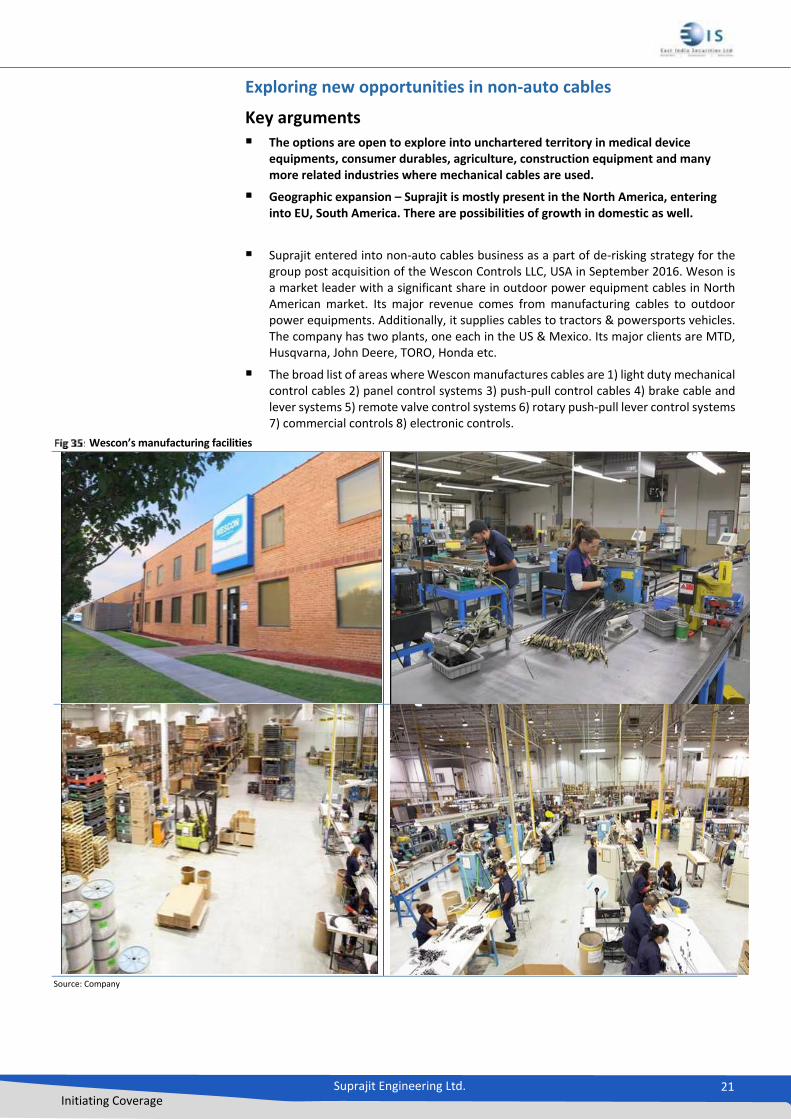
Suprajit entered into non-auto cables business as a part of de-risking strategy for the group post acquisition of the Wescon Controls LLC, USA in September 2016. Weson is a market leader with a significant share in outdoor power equipment cables in North American market. Its major revenue comes from manufacturing cables to outdoor power equipments. Additionally, it supplies cables to tractors & powersports vehicles. The company has two plants, one each in the US & Mexico. Its major clients are MTD, Husqvarna, John Deere, TORO, Honda etc.
The broad list of areas where Wescon manufactures cables are 1) light duty mechanical control cables 2) panel control systems 3) push-pull control cables 4) brake cable and lever systems 5) remote valve control systems 6) rotary push-pull lever control systems 7) commercial controls 8) electronic controls.
Wescon’s manufacturing facilities
Source: Company
Suprajit Engineering Ltd. 22 Initiating Coverage
The focus is:
on expanding its Global footprint in Europe and South America
to diversify into other non-automotive markets outside the Outdoor Power Equipment industry
to acquire new customers/OEMs outside the North American market and
to improve operational performance
Growth opportunities:
Suprajit is exploring medical equipment device industry (wheel chairs, hospital beds, etc) where mechical cables are used. This opportunity is big enough & will continue to grow in the years ahead. It is also exploring other industries viz. Agriculture and Construction Equipment where mechanical cables are used. Size of the business for each of these segments is in the range of $25-75mn in North America.
The company is approaching new customers in these industries, but it takes time to dislodge the existing competitor and get into with OEMs. At present, it doesn’t have any specific contracts.
Margins in these new industries are similar to current margins. Suprajit’s strategy is to give three options to OEMs viz. Made in US, Made in Mexico and Made in India cables. It is getting good leads and expect to get new business.
The company has a long list of already established clients in the domestic market, hence it would be easy for Suprajit to cross-sell to OEMs present in tractors, construction equipment industry and other unexplored areas. Hence, we expect its domestic revenues to grow faster than its exports in non-auto cables business.
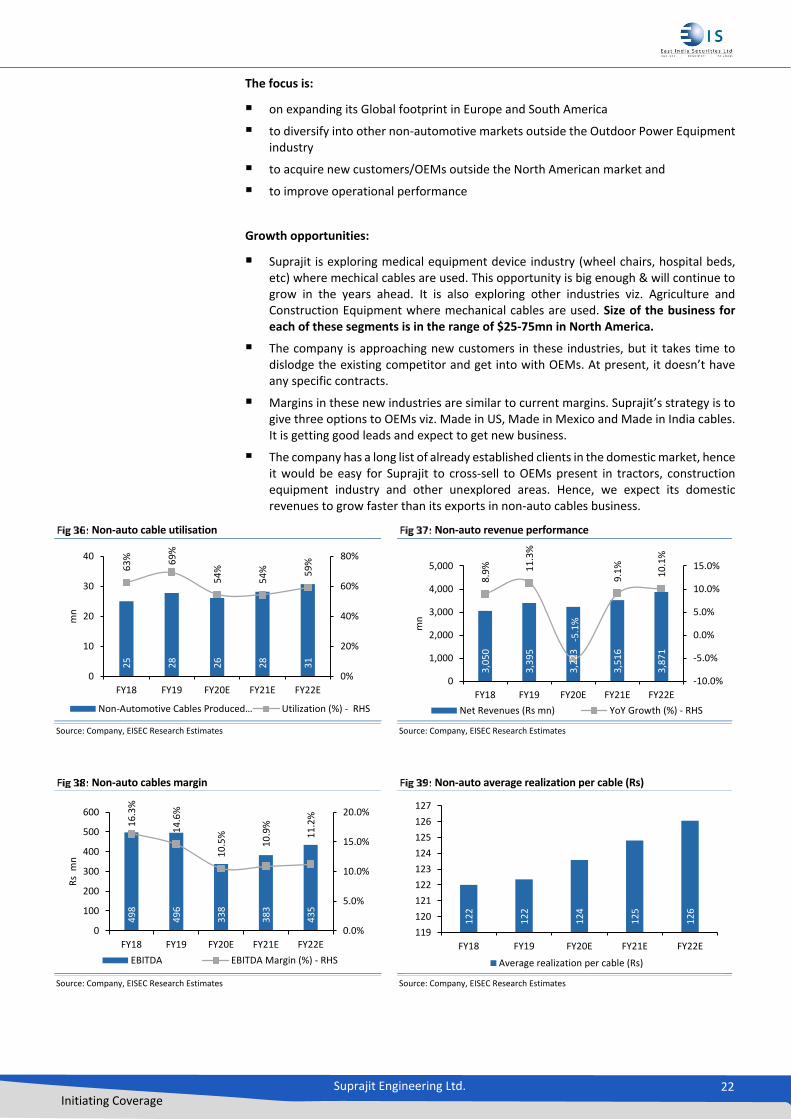
Non-auto cable utilisation Non-auto revenue performance
Source: Company, EISEC Research Estimates Source: Company, EISEC Research Estimates
Non-auto cables margin Non-auto average realization per cable (Rs)
Source: Company, EISEC Research Estimates Source: Company, EISEC Research Estimates
25
28
26
28
31
63
% 69
%
54
%
54
% 59
%
0%
20%
40%
60%
80%
0
10
20
30
40
FY18 FY19 FY20E FY21E FY22E
mn
Non-Automotive Cables Produced… Utilization (%) - RHS
3,0
50
3,3
95
3,2
23
3,5
16
3,8
71
8.9
% 11
.3%
-5.1
%
9.1
%
10
.1%
-10.0%
-5.0%
0.0%
5.0%
10.0%
15.0%
0
1,000
2,000
3,000
4,000
5,000
FY18 FY19 FY20E FY21E FY22E
mn
Net Revenues (Rs mn) YoY Growth (%) - RHS
49
8
49
6
33
8
38
3
43
5
16
.3%
14
.6%
10
.5%
10
.9%
11
.2%
0.0%
5.0%
10.0%
15.0%
20.0%
0
100
200
300
400
500
600
FY18 FY19 FY20E FY21E FY22E
Rs
mn
EBITDA EBITDA Margin (%) - RHS
12
2
12
2
12
4
12
5
12
6
119
120
121
122
123
124
125
126
127
FY18 FY19 FY20E FY21E FY22E
Average realization per cable (Rs)
Suprajit Engineering Ltd. 23 Initiating Coverage
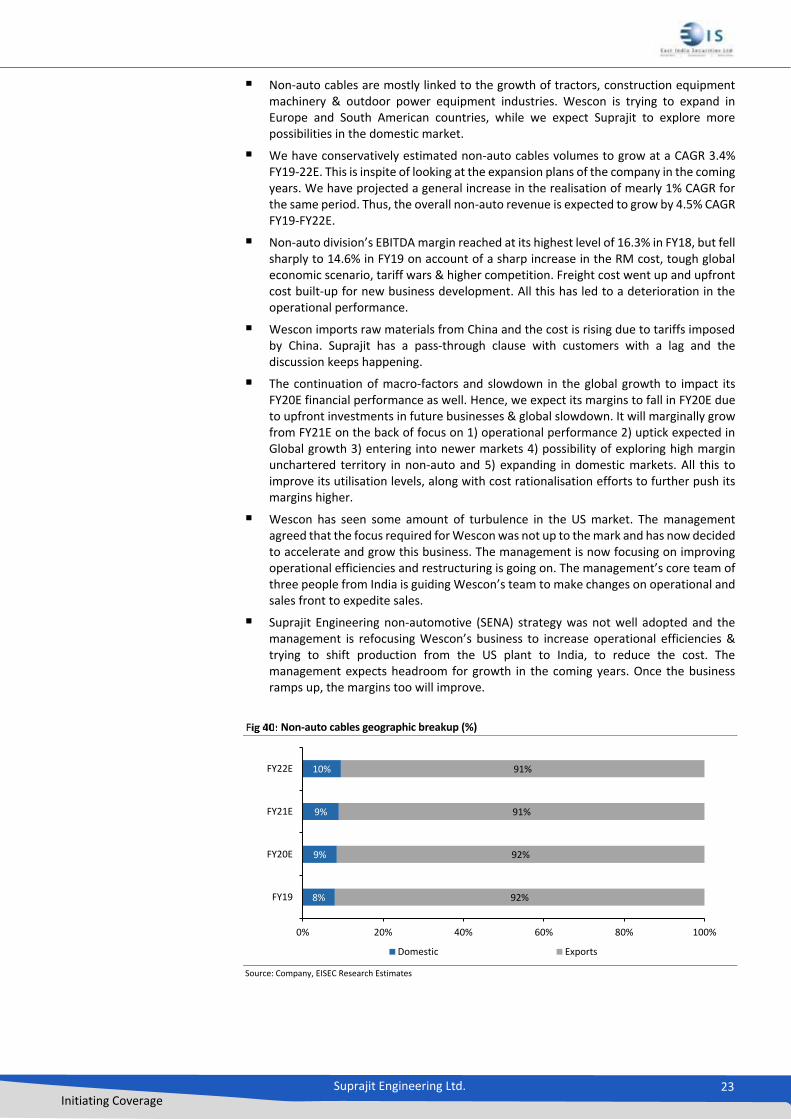
Non-auto cables are mostly linked to the growth of tractors, construction equipment machinery & outdoor power equipment industries. Wescon is trying to expand in Europe and South American countries, while we expect Suprajit to explore more possibilities in the domestic market.
We have conservatively estimated non-auto cables volumes to grow at a CAGR 3.4% FY19-22E. This is inspite of looking at the expansion plans of the company in the coming years. We have projected a general increase in the realisation of mearly 1% CAGR for the same period. Thus, the overall non-auto revenue is expected to grow by 4.5% CAGR FY19-FY22E.
Non-auto division’s EBITDA margin reached at its highest level of 16.3% in FY18, but fell sharply to 14.6% in FY19 on account of a sharp increase in the RM cost, tough global economic scenario, tariff wars & higher competition. Freight cost went up and upfront cost built-up for new business development. All this has led to a deterioration in the operational performance.
Wescon imports raw materials from China and the cost is rising due to tariffs imposed by China. Suprajit has a pass-through clause with customers with a lag and the discussion keeps happening.
The continuation of macro-factors and slowdown in the global growth to impact its FY20E financial performance as well. Hence, we expect its margins to fall in FY20E due to upfront investments in future businesses & global slowdown. It will marginally grow from FY21E on the back of focus on 1) operational performance 2) uptick expected in Global growth 3) entering into newer markets 4) possibility of exploring high margin unchartered territory in non-auto and 5) expanding in domestic markets. All this to improve its utilisation levels, along with cost rationalisation efforts to further push its margins higher.
Wescon has seen some amount of turbulence in the US market. The management agreed that the focus required for Wescon was not up to the mark and has now decided to accelerate and grow this business. The management is now focusing on improving operational efficiencies and restructuring is going on. The management’s core team of three people from India is guiding Wescon’s team to make changes on operational and sales front to expedite sales.
Suprajit Engineering non-automotive (SENA) strategy was not well adopted and the management is refocusing Wescon’s business to increase operational efficiencies & trying to shift production from the US plant to India, to reduce the cost. The management expects headroom for growth in the coming years. Once the business ramps up, the margins too will improve.
Non-auto cables geographic breakup (%)
Source: Company, EISEC Research Estimates
8%
9%
9%
10%
92%
92%
91%
91%
0% 20% 40% 60% 80% 100%
FY19
FY20E
FY21E
FY22E
Domestic Exports
Suprajit Engineering Ltd. 24 Initiating Coverage
Well diversified across segments, customers, products, location and brand
Key arguments
The company has already diversified itself from a single product, single customer, single segment, single brand, single location company to a multi-product, multi-business, multi-customer, multi-brand, multi-location global company.
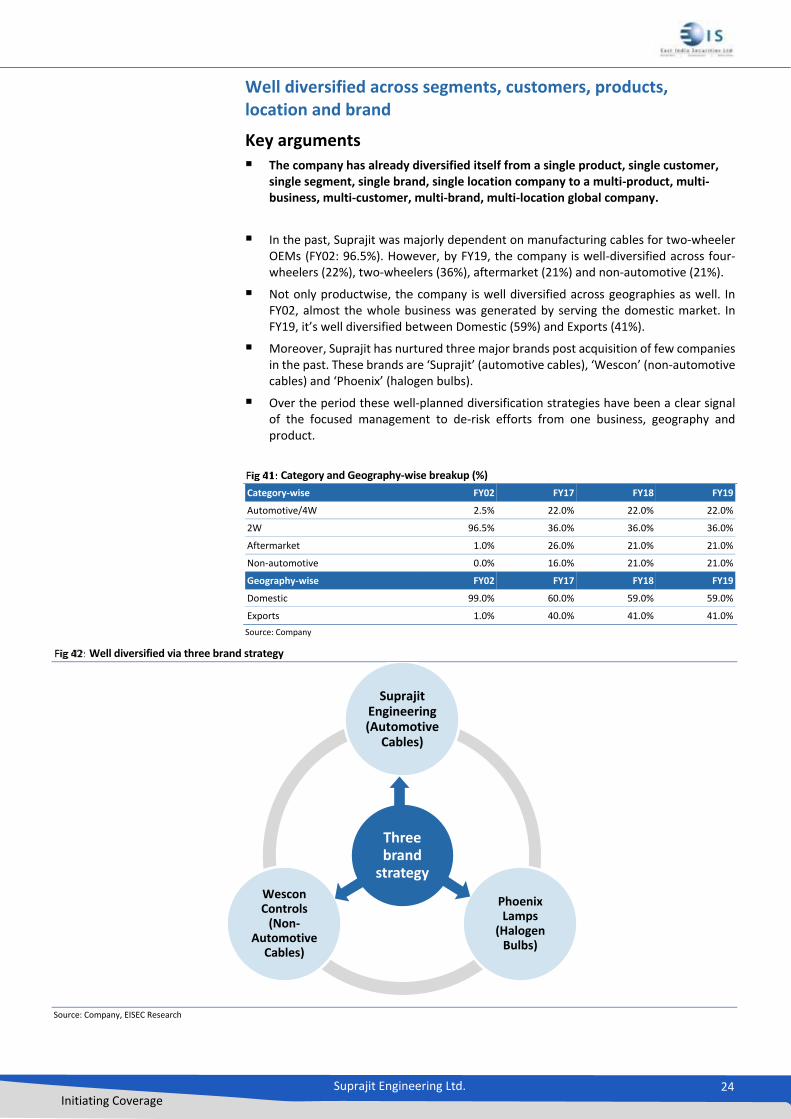
In the past, Suprajit was majorly dependent on manufacturing cables for two-wheeler OEMs (FY02: 96.5%). However, by FY19, the company is well-diversified across four-wheelers (22%), two-wheelers (36%), aftermarket (21%) and non-automotive (21%).
Not only productwise, the company is well diversified across geographies as well. In FY02, almost the whole business was generated by serving the domestic market. In FY19, it’s well diversified between Domestic (59%) and Exports (41%).
Moreover, Suprajit has nurtured three major brands post acquisition of few companies in the past. These brands are ‘Suprajit’ (automotive cables), ‘Wescon’ (non-automotive cables) and ‘Phoenix’ (halogen bulbs).
Over the period these well-planned diversification strategies have been a clear signal of the focused management to de-risk efforts from one business, geography and product.
Category and Geography-wise breakup (%)
Category-wise FY02 FY17 FY18 FY19
Automotive/4W 2.5% 22.0% 22.0% 22.0%
2W 96.5% 36.0% 36.0% 36.0%
Aftermarket 1.0% 26.0% 21.0% 21.0%
Non-automotive 0.0% 16.0% 21.0% 21.0%
Geography-wise FY02 FY17 FY18 FY19
Domestic 99.0% 60.0% 59.0% 59.0%
Exports 1.0% 40.0% 41.0% 41.0%
Source: Company
Well diversified via three brand strategy
Source: Company, EISEC Research
Three brand
strategy
Suprajit Engineering (Automotive
Cables)
Phoenix Lamps
(Halogen Bulbs)
Wescon Controls
(Non-Automotive
Cables)
Suprajit Engineering Ltd. 25 Initiating Coverage
Suprajit diversified to:
Multiple segments: The company started its journey by supplying cables only to two-wheeler OEMs. Over the time, it’s now well diversified across two-wheelers, three-wheelers, passenger vehicles, commercial vehicles, non-auto segments, exports and aftermarket.
Multiple customers: Suprajit has started with one customer (TVS Motor). Now it has almost all the major auto OEMs in domestic as well as in export markets. The company’s domestic clientele has marquee names such as TVS, Bajaj Auto, Tata Motors, Swaraj Mazda, Eicher Motors in domestic. While, in exports the clients which majorly contributes are leading European and North American OEMs. It also supplies to John Deere, Kubota and likes of similar companies as well.
Multiple products: Manufacturing mechanical control cables with good quality & low costs is the forte of Suprajit. It is now making Speedometers, other auto components, cable-based assemblies and has entered into automotive halogen lamps post Phoenix acquisition. In addition, the company is working on adding new products like cable mechanism, which fits at the end of a cable. The plan is to go beyond cables and offer a complete solution. It is also exploring parking brake handle and its complete assembly, along with few more projects in the line.
Multiple locations: The company started its journey from Karnataka, expanded in all the Indian states and now serving to 50+ countries globally. Hence, Suprajit is not dependent on single geography for its bread & butter.
Multiple brands: Along with its core ‘Suprajit’ brand, the management has inducted & nurtured valuable brands viz. Wescon Controls, Phoenix, Trifa & Luxlite.
Post various acquisitions, the company is now well-diversified from a single product, single customer, single segment, single brand, single location company to a multi-product, multi-business, multi-customer, multi-brand, multi-location global company.

Suprajit Engineering Ltd. 26 Initiating Coverage
Strategic past acquisitions - a step towards diversification Past acquisitions and its rationales
No. Target company Acquisition year Rationale behind acquisitons
1 Shah Concabs Pvt. Ltd FY03
Gujarat based manufacturer of LCV, HCV, heavy-duty cables was acquired by Suprajit in FY03. It was one of the leading manufacturers of cables in India.
It was acquired for increasing volumes, top-line and to get synergy benefits.
Through this acquisition, Suprajit entered into cable manufacturing for the commercial vehicles segment.
2 CTP Gills Cables Ltd. FY07
To get a significant foothold in European markets, Suprajit acquired CTP Gills, a UK based automotive cable manufacturer.
This is set up as 100% export-oriented unit. Suprajit entered into supplying cables to International OEMs in the passenger vehicle space.
Its customers include Ford, Toyota, Jaguar and General Motors.
3 Speedo cable unit
(Pricol Ltd) FY15
Pricol Ltd has sold its Speedo cables business to Suprajit in FY15, this was an entry point for Suprajit to serve India passenger vehicle OEMs.
In FY15, the business has clocked an annual sale of Rs 100mn. It almost had all the major OEMs as its customers, along with the aftermarket business.
4 Phoenix Lamps Division FY17
To de-risk its dependency on cables business, Suprajit has acquired Phoenix Lamps Business, which is into manufacturing of various types of automotive bulbs.
Suprajit started the process of acquisition of Phoenix Lamps since FY15 including an open offer to its minority shareholders, however, Phoenix Lamps officially merged with Suprajit Engineering in FY17.
The delay was due to getting approvals from various agencies has taken time & the case was further moved from the high court to NCLT, Bengaluru.
5 Wecson Controls, LLC, USA FY17
To diversify further, Suprajit acquired US based Wescon Controls, LLC, which is a leading manufacturer of control cables in non-automotive Outdoor Power Equipment.
MTD, Husqvarna, John Deere, TORO, Honda, etc are few marquee clients of Wescon. This was considered as a strategic acquisition by Suprajit.
The aim is now to further diversify non-auto segment geographically as well as product wise.
Source: Company, EISEC Research
Suprajit Engineering Ltd. 27 Initiating Coverage
Company background
Based out of Bengaluru, Suprajit Engineering Limited (SEL) led by Mr. Ajith Kumar Rai, designs, manufactures & distributes automotive cables, non-automotive cables and halogen lights. The company is a niche player in manufacturing of mechanical control cables. Its products consist mainly control cables, speedo cables and other components for automobiles. The Company supplies its products to Original Equipment Manufacturers (OEMs) and the aftermarket. It also exports its products to various countries.
SEL is the largest manufacturer of control cables for two-wheelers in India and it exports to 50+ countries. The company is a dominant supplier in India for cables and is a preferred supplier for OEMs. In the past, the company was only supplying to two-wheeler OEMs and over the period, it is diversified in all auto & non-auto segments viz. two-wheelers, three-wheelers, passenger vehicles, commercial vehicles, tractors, construction equipments, etc. Moreover, it is geographically well diversified.
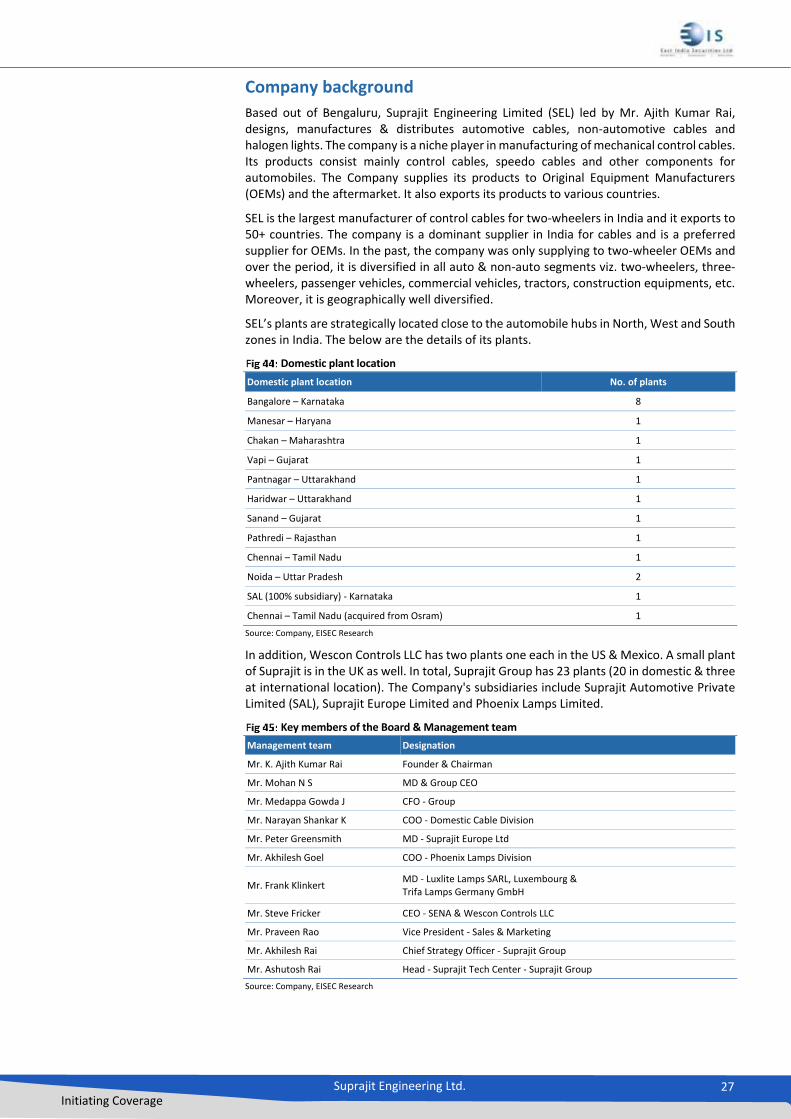
SEL’s plants are strategically located close to the automobile hubs in North, West and South zones in India. The below are the details of its plants.
Domestic plant location
Domestic plant location No. of plants
Bangalore – Karnataka 8
Manesar – Haryana 1
Chakan – Maharashtra 1
Vapi – Gujarat 1
Pantnagar – Uttarakhand 1
Haridwar – Uttarakhand 1
Sanand – Gujarat 1
Pathredi – Rajasthan 1
Chennai – Tamil Nadu 1
Noida – Uttar Pradesh 2
SAL (100% subsidiary) - Karnataka 1
Chennai – Tamil Nadu (acquired from Osram) 1
Source: Company, EISEC Research
In addition, Wescon Controls LLC has two plants one each in the US & Mexico. A small plant of Suprajit is in the UK as well. In total, Suprajit Group has 23 plants (20 in domestic & three at international location). The Company's subsidiaries include Suprajit Automotive Private Limited (SAL), Suprajit Europe Limited and Phoenix Lamps Limited.
Key members of the Board & Management team
Management team Designation
Mr. K. Ajith Kumar Rai Founder & Chairman
Mr. Mohan N S MD & Group CEO
Mr. Medappa Gowda J CFO - Group
Mr. Narayan Shankar K COO - Domestic Cable Division
Mr. Peter Greensmith MD - Suprajit Europe Ltd
Mr. Akhilesh Goel COO - Phoenix Lamps Division
Mr. Frank Klinkert MD - Luxlite Lamps SARL, Luxembourg & Trifa Lamps Germany GmbH
Mr. Steve Fricker CEO - SENA & Wescon Controls LLC
Mr. Praveen Rao Vice President - Sales & Marketing
Mr. Akhilesh Rai Chief Strategy Officer - Suprajit Group
Mr. Ashutosh Rai Head - Suprajit Tech Center - Suprajit Group
Source: Company, EISEC Research
Suprajit Engineering Ltd. 28 Initiating Coverage
Company milestones
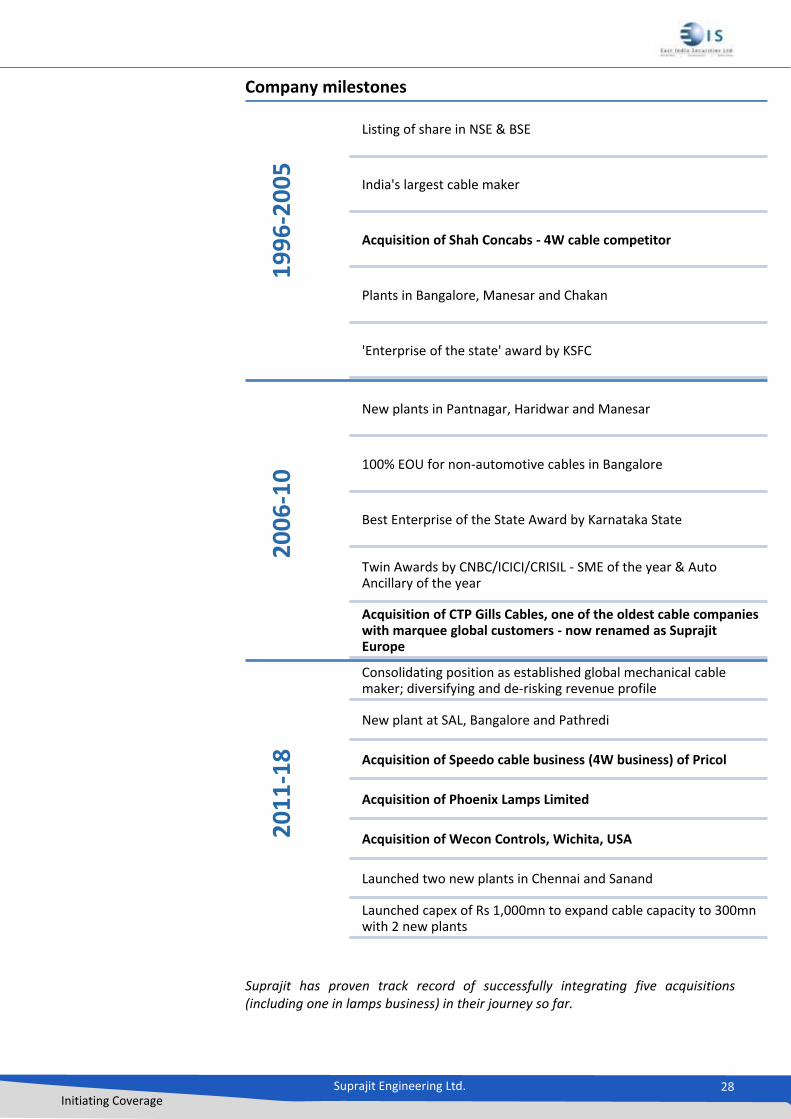
Suprajit has proven track record of successfully integrating five acquisitions (including one in lamps business) in their journey so far.
19
96
-20
05
Listing of share in NSE & BSE
India's largest cable maker
Acquisition of Shah Concabs - 4W cable competitor
Plants in Bangalore, Manesar and Chakan
'Enterprise of the state' award by KSFC
20
06
-10
New plants in Pantnagar, Haridwar and Manesar
100% EOU for non-automotive cables in Bangalore
Best Enterprise of the State Award by Karnataka State
Twin Awards by CNBC/ICICI/CRISIL - SME of the year & Auto Ancillary of the year
Acquisition of CTP Gills Cables, one of the oldest cable companies with marquee global customers - now renamed as Suprajit Europe
20
11
-18
Consolidating position as established global mechanical cable maker; diversifying and de-risking revenue profile
New plant at SAL, Bangalore and Pathredi
Acquisition of Speedo cable business (4W business) of Pricol
Acquisition of Phoenix Lamps Limited
Acquisition of Wecon Controls, Wichita, USA
Launched two new plants in Chennai and Sanand
Launched capex of Rs 1,000mn to expand cable capacity to 300mn with 2 new plants
Suprajit Engineering Ltd. 29 Initiating Coverage
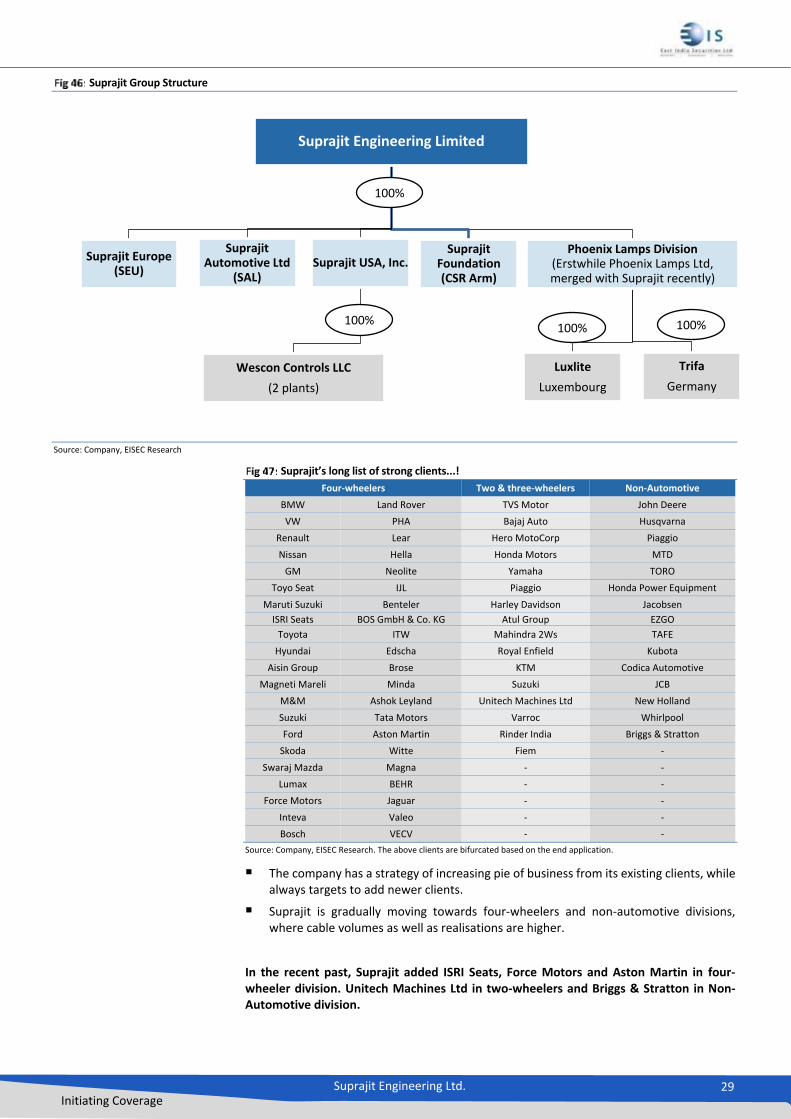
Suprajit Group Structure
Source: Company, EISEC Research
Suprajit’s long list of strong clients...!
Four-wheelers Two & three-wheelers Non-Automotive
BMW Land Rover TVS Motor John Deere
VW PHA Bajaj Auto Husqvarna
Renault Lear Hero MotoCorp Piaggio
Nissan Hella Honda Motors MTD
GM Neolite Yamaha TORO
Toyo Seat IJL Piaggio Honda Power Equipment
Maruti Suzuki Benteler Harley Davidson Jacobsen
ISRI Seats BOS GmbH & Co. KG Atul Group EZGO
Toyota ITW Mahindra 2Ws TAFE
Hyundai Edscha Royal Enfield Kubota
Aisin Group Brose KTM Codica Automotive
Magneti Mareli Minda Suzuki JCB
M&M Ashok Leyland Unitech Machines Ltd New Holland
Suzuki Tata Motors Varroc Whirlpool
Ford Aston Martin Rinder India Briggs & Stratton
Skoda Witte Fiem -
Swaraj Mazda Magna - -
Lumax BEHR - -
Force Motors Jaguar - -
Inteva Valeo - -
Bosch VECV - -
Source: Company, EISEC Research. The above clients are bifurcated based on the end application.
The company has a strategy of increasing pie of business from its existing clients, while always targets to add newer clients.
Suprajit is gradually moving towards four-wheelers and non-automotive divisions, where cable volumes as well as realisations are higher.
In the recent past, Suprajit added ISRI Seats, Force Motors and Aston Martin in four-wheeler division. Unitech Machines Ltd in two-wheelers and Briggs & Stratton in Non-Automotive division.
Suprajit Engineering Limited
Suprajit Europe (SEU)
Suprajit Automotive Ltd
(SAL)Suprajit USA, Inc.
Wescon Controls LLC
(2 plants)
Suprajit Foundation (CSR Arm)
Phoenix Lamps Division (Erstwhile Phoenix Lamps Ltd, merged with Suprajit recently)
Luxlite
Luxembourg
Trifa
Germany
100%
100% 100% 100%
Suprajit Engineering Ltd. 30 Initiating Coverage
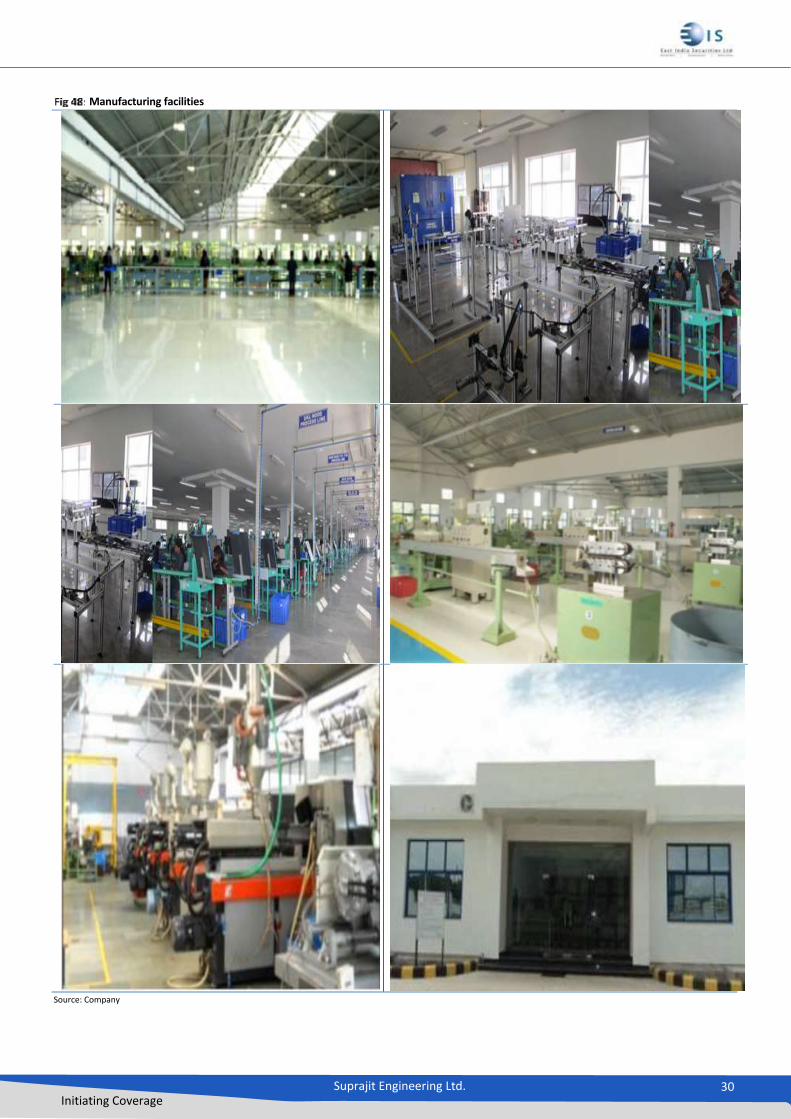
Manufacturing facilities
Source: Company
Suprajit Engineering Ltd. 31 Initiating Coverage
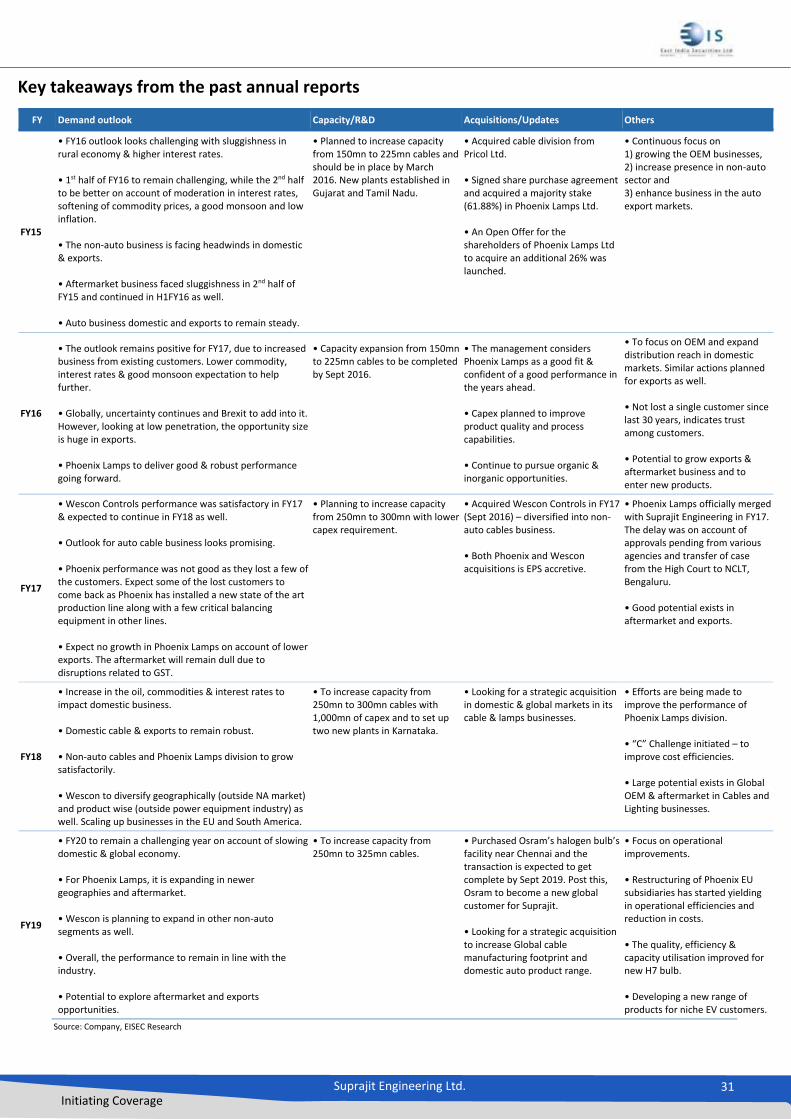
Key takeaways from the past annual reports
Source: Company, EISEC Research
FY Demand outlook Capacity/R&D Acquisitions/Updates Others
FY15
• FY16 outlook looks challenging with sluggishness in rural economy & higher interest rates. • 1st half of FY16 to remain challenging, while the 2nd half to be better on account of moderation in interest rates, softening of commodity prices, a good monsoon and low inflation. • The non-auto business is facing headwinds in domestic & exports. • Aftermarket business faced sluggishness in 2nd half of FY15 and continued in H1FY16 as well. • Auto business domestic and exports to remain steady.
• Planned to increase capacity from 150mn to 225mn cables and should be in place by March 2016. New plants established in Gujarat and Tamil Nadu.
• Acquired cable division from Pricol Ltd. • Signed share purchase agreement and acquired a majority stake (61.88%) in Phoenix Lamps Ltd. • An Open Offer for the shareholders of Phoenix Lamps Ltd to acquire an additional 26% was launched.
• Continuous focus on 1) growing the OEM businesses, 2) increase presence in non-auto sector and 3) enhance business in the auto export markets.
FY16
• The outlook remains positive for FY17, due to increased business from existing customers. Lower commodity, interest rates & good monsoon expectation to help further. • Globally, uncertainty continues and Brexit to add into it. However, looking at low penetration, the opportunity size is huge in exports. • Phoenix Lamps to deliver good & robust performance going forward.
• Capacity expansion from 150mn to 225mn cables to be completed by Sept 2016.
• The management considers Phoenix Lamps as a good fit & confident of a good performance in the years ahead. • Capex planned to improve product quality and process capabilities. • Continue to pursue organic & inorganic opportunities.
• To focus on OEM and expand distribution reach in domestic markets. Similar actions planned for exports as well. • Not lost a single customer since last 30 years, indicates trust among customers. • Potential to grow exports & aftermarket business and to enter new products.
FY17
• Wescon Controls performance was satisfactory in FY17 & expected to continue in FY18 as well. • Outlook for auto cable business looks promising. • Phoenix performance was not good as they lost a few of the customers. Expect some of the lost customers to come back as Phoenix has installed a new state of the art production line along with a few critical balancing equipment in other lines. • Expect no growth in Phoenix Lamps on account of lower exports. The aftermarket will remain dull due to disruptions related to GST.
• Planning to increase capacity from 250mn to 300mn with lower capex requirement.
• Acquired Wescon Controls in FY17 (Sept 2016) – diversified into non-auto cables business. • Both Phoenix and Wescon acquisitions is EPS accretive.
• Phoenix Lamps officially merged with Suprajit Engineering in FY17. The delay was on account of approvals pending from various agencies and transfer of case from the High Court to NCLT, Bengaluru. • Good potential exists in aftermarket and exports.
FY18
• Increase in the oil, commodities & interest rates to impact domestic business. • Domestic cable & exports to remain robust. • Non-auto cables and Phoenix Lamps division to grow satisfactorily. • Wescon to diversify geographically (outside NA market) and product wise (outside power equipment industry) as well. Scaling up businesses in the EU and South America.
• To increase capacity from 250mn to 300mn cables with 1,000mn of capex and to set up two new plants in Karnataka.
• Looking for a strategic acquisition in domestic & global markets in its cable & lamps businesses.
• Efforts are being made to improve the performance of Phoenix Lamps division. • “C” Challenge initiated – to improve cost efficiencies. • Large potential exists in Global OEM & aftermarket in Cables and Lighting businesses.
FY19
• FY20 to remain a challenging year on account of slowing domestic & global economy. • For Phoenix Lamps, it is expanding in newer geographies and aftermarket. • Wescon is planning to expand in other non-auto segments as well. • Overall, the performance to remain in line with the industry. • Potential to explore aftermarket and exports opportunities.
• To increase capacity from 250mn to 325mn cables.
• Purchased Osram’s halogen bulb’s facility near Chennai and the transaction is expected to get complete by Sept 2019. Post this, Osram to become a new global customer for Suprajit. • Looking for a strategic acquisition to increase Global cable manufacturing footprint and domestic auto product range.
• Focus on operational improvements. • Restructuring of Phoenix EU subsidiaries has started yielding in operational efficiencies and reduction in costs. • The quality, efficiency & capacity utilisation improved for new H7 bulb. • Developing a new range of products for niche EV customers.
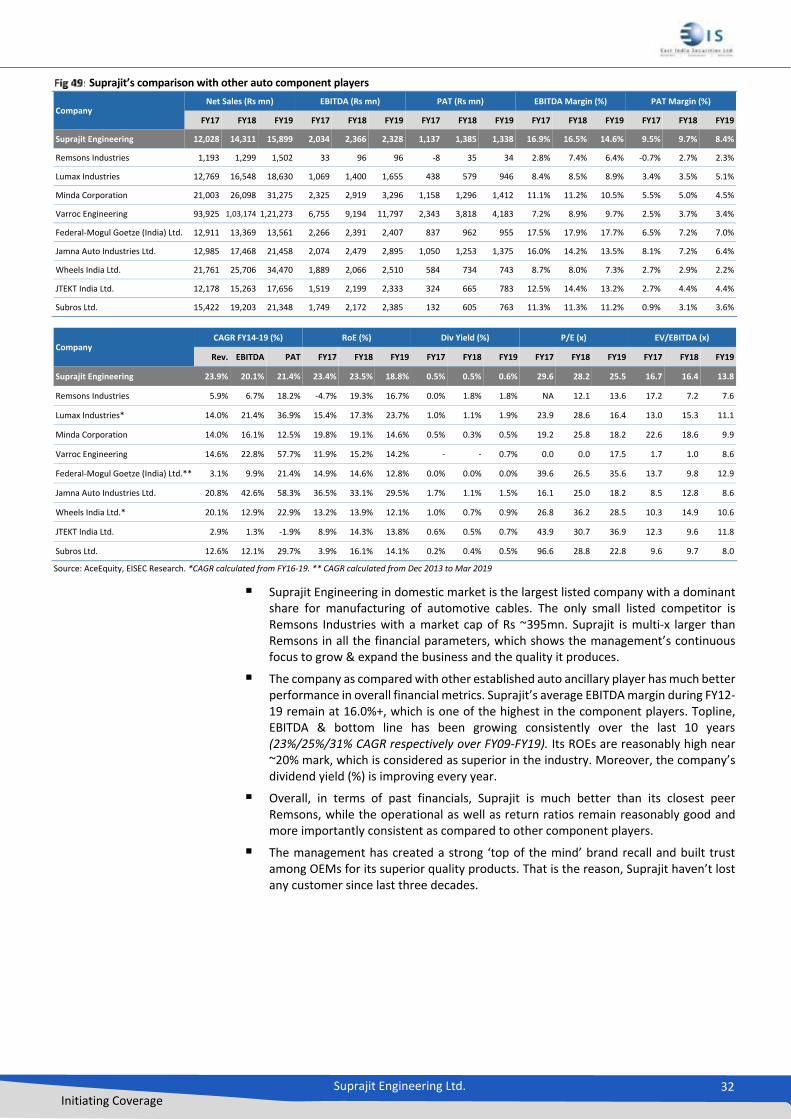
Suprajit Engineering Ltd. 32 Initiating Coverage
Suprajit’s comparison with other auto component players
Company Net Sales (Rs mn) EBITDA (Rs mn) PAT (Rs mn) EBITDA Margin (%) PAT Margin (%)
FY17 FY18 FY19 FY17 FY18 FY19 FY17 FY18 FY19 FY17 FY18 FY19 FY17 FY18 FY19
Suprajit Engineering 12,028 14,311 15,899 2,034 2,366 2,328 1,137 1,385 1,338 16.9% 16.5% 14.6% 9.5% 9.7% 8.4%
Remsons Industries 1,193 1,299 1,502 33 96 96 -8 35 34 2.8% 7.4% 6.4% -0.7% 2.7% 2.3%
Lumax Industries 12,769 16,548 18,630 1,069 1,400 1,655 438 579 946 8.4% 8.5% 8.9% 3.4% 3.5% 5.1%
Minda Corporation 21,003 26,098 31,275 2,325 2,919 3,296 1,158 1,296 1,412 11.1% 11.2% 10.5% 5.5% 5.0% 4.5%
Varroc Engineering 93,925 1,03,174 1,21,273 6,755 9,194 11,797 2,343 3,818 4,183 7.2% 8.9% 9.7% 2.5% 3.7% 3.4%
Federal-Mogul Goetze (India) Ltd. 12,911 13,369 13,561 2,266 2,391 2,407 837 962 955 17.5% 17.9% 17.7% 6.5% 7.2% 7.0%
Jamna Auto Industries Ltd. 12,985 17,468 21,458 2,074 2,479 2,895 1,050 1,253 1,375 16.0% 14.2% 13.5% 8.1% 7.2% 6.4%
Wheels India Ltd. 21,761 25,706 34,470 1,889 2,066 2,510 584 734 743 8.7% 8.0% 7.3% 2.7% 2.9% 2.2%
JTEKT India Ltd. 12,178 15,263 17,656 1,519 2,199 2,333 324 665 783 12.5% 14.4% 13.2% 2.7% 4.4% 4.4%
Subros Ltd. 15,422 19,203 21,348 1,749 2,172 2,385 132 605 763 11.3% 11.3% 11.2% 0.9% 3.1% 3.6%
Company CAGR FY14-19 (%) RoE (%) Div Yield (%) P/E (x) EV/EBITDA (x)
Rev. EBITDA PAT FY17 FY18 FY19 FY17 FY18 FY19 FY17 FY18 FY19 FY17 FY18 FY19
Suprajit Engineering 23.9% 20.1% 21.4% 23.4% 23.5% 18.8% 0.5% 0.5% 0.6% 29.6 28.2 25.5 16.7 16.4 13.8
Remsons Industries 5.9% 6.7% 18.2% -4.7% 19.3% 16.7% 0.0% 1.8% 1.8% NA 12.1 13.6 17.2 7.2 7.6
Lumax Industries* 14.0% 21.4% 36.9% 15.4% 17.3% 23.7% 1.0% 1.1% 1.9% 23.9 28.6 16.4 13.0 15.3 11.1
Minda Corporation 14.0% 16.1% 12.5% 19.8% 19.1% 14.6% 0.5% 0.3% 0.5% 19.2 25.8 18.2 22.6 18.6 9.9
Varroc Engineering 14.6% 22.8% 57.7% 11.9% 15.2% 14.2% - - 0.7% 0.0 0.0 17.5 1.7 1.0 8.6
Federal-Mogul Goetze (India) Ltd.** 3.1% 9.9% 21.4% 14.9% 14.6% 12.8% 0.0% 0.0% 0.0% 39.6 26.5 35.6 13.7 9.8 12.9
Jamna Auto Industries Ltd. 20.8% 42.6% 58.3% 36.5% 33.1% 29.5% 1.7% 1.1% 1.5% 16.1 25.0 18.2 8.5 12.8 8.6
Wheels India Ltd.* 20.1% 12.9% 22.9% 13.2% 13.9% 12.1% 1.0% 0.7% 0.9% 26.8 36.2 28.5 10.3 14.9 10.6
JTEKT India Ltd. 2.9% 1.3% -1.9% 8.9% 14.3% 13.8% 0.6% 0.5% 0.7% 43.9 30.7 36.9 12.3 9.6 11.8
Subros Ltd. 12.6% 12.1% 29.7% 3.9% 16.1% 14.1% 0.2% 0.4% 0.5% 96.6 28.8 22.8 9.6 9.7 8.0
Source: AceEquity, EISEC Research. *CAGR calculated from FY16-19. ** CAGR calculated from Dec 2013 to Mar 2019
Suprajit Engineering in domestic market is the largest listed company with a dominant share for manufacturing of automotive cables. The only small listed competitor is Remsons Industries with a market cap of Rs ~395mn. Suprajit is multi-x larger than Remsons in all the financial parameters, which shows the management’s continuous focus to grow & expand the business and the quality it produces.
The company as compared with other established auto ancillary player has much better performance in overall financial metrics. Suprajit’s average EBITDA margin during FY12-19 remain at 16.0%+, which is one of the highest in the component players. Topline, EBITDA & bottom line has been growing consistently over the last 10 years (23%/25%/31% CAGR respectively over FY09-FY19). Its ROEs are reasonably high near ~20% mark, which is considered as superior in the industry. Moreover, the company’s dividend yield (%) is improving every year.
Overall, in terms of past financials, Suprajit is much better than its closest peer Remsons, while the operational as well as return ratios remain reasonably good and more importantly consistent as compared to other component players.
The management has created a strong ‘top of the mind’ brand recall and built trust among OEMs for its superior quality products. That is the reason, Suprajit haven’t lost any customer since last three decades.
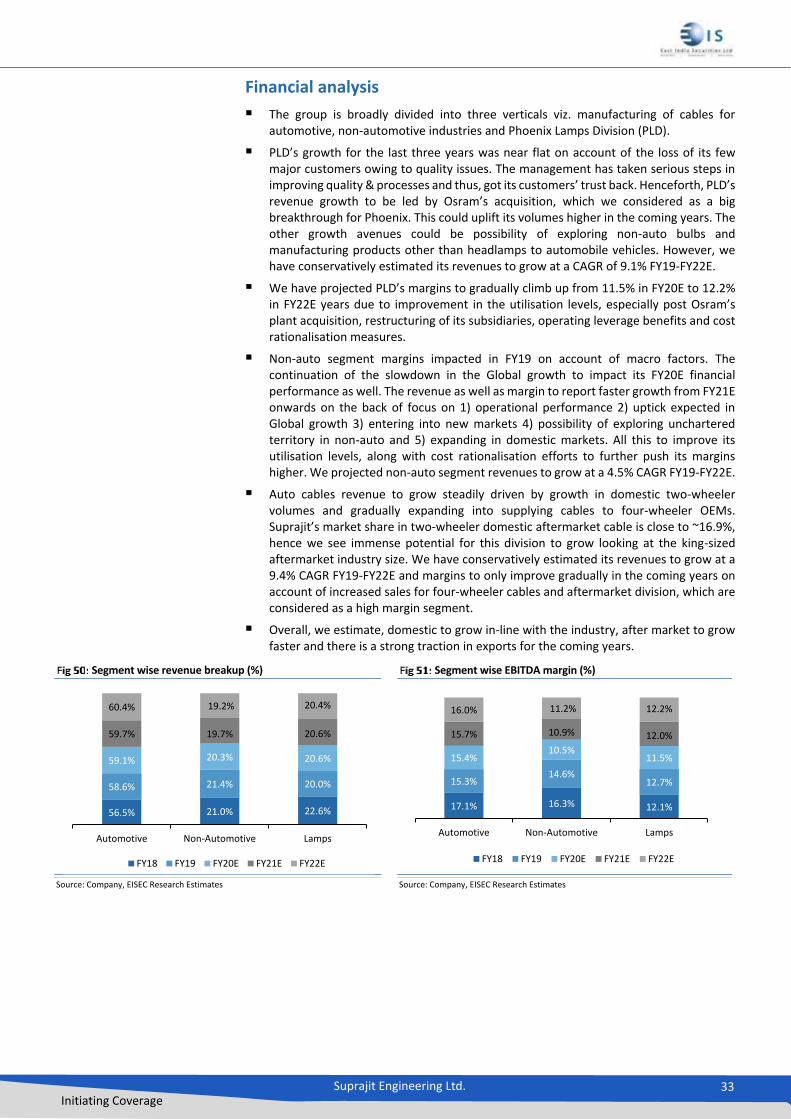
Suprajit Engineering Ltd. 33 Initiating Coverage
Financial analysis
The group is broadly divided into three verticals viz. manufacturing of cables for automotive, non-automotive industries and Phoenix Lamps Division (PLD).
PLD’s growth for the last three years was near flat on account of the loss of its few major customers owing to quality issues. The management has taken serious steps in improving quality & processes and thus, got its customers’ trust back. Henceforth, PLD’s revenue growth to be led by Osram’s acquisition, which we considered as a big breakthrough for Phoenix. This could uplift its volumes higher in the coming years. The other growth avenues could be possibility of exploring non-auto bulbs and manufacturing products other than headlamps to automobile vehicles. However, we have conservatively estimated its revenues to grow at a CAGR of 9.1% FY19-FY22E.
We have projected PLD’s margins to gradually climb up from 11.5% in FY20E to 12.2% in FY22E years due to improvement in the utilisation levels, especially post Osram’s plant acquisition, restructuring of its subsidiaries, operating leverage benefits and cost rationalisation measures.
Non-auto segment margins impacted in FY19 on account of macro factors. The continuation of the slowdown in the Global growth to impact its FY20E financial performance as well. The revenue as well as margin to report faster growth from FY21E onwards on the back of focus on 1) operational performance 2) uptick expected in Global growth 3) entering into new markets 4) possibility of exploring unchartered territory in non-auto and 5) expanding in domestic markets. All this to improve its utilisation levels, along with cost rationalisation efforts to further push its margins higher. We projected non-auto segment revenues to grow at a 4.5% CAGR FY19-FY22E.
Auto cables revenue to grow steadily driven by growth in domestic two-wheeler volumes and gradually expanding into supplying cables to four-wheeler OEMs. Suprajit’s market share in two-wheeler domestic aftermarket cable is close to ~16.9%, hence we see immense potential for this division to grow looking at the king-sized aftermarket industry size. We have conservatively estimated its revenues to grow at a 9.4% CAGR FY19-FY22E and margins to only improve gradually in the coming years on account of increased sales for four-wheeler cables and aftermarket division, which are considered as a high margin segment.
Overall, we estimate, domestic to grow in-line with the industry, after market to grow faster and there is a strong traction in exports for the coming years.
Segment wise revenue breakup (%) Segment wise EBITDA margin (%)
Source: Company, EISEC Research Estimates Source: Company, EISEC Research Estimates
56.5% 21.0% 22.6%
58.6% 21.4% 20.0%
59.1% 20.3% 20.6%
59.7% 19.7% 20.6%
60.4% 19.2% 20.4%
Automotive Non-Automotive Lamps
FY18 FY19 FY20E FY21E FY22E
17.1% 16.3% 12.1%
15.3%14.6%
12.7%
15.4%10.5%
11.5%
15.7% 10.9% 12.0%
16.0% 11.2% 12.2%
Automotive Non-Automotive Lamps
FY18 FY19 FY20E FY21E FY22E
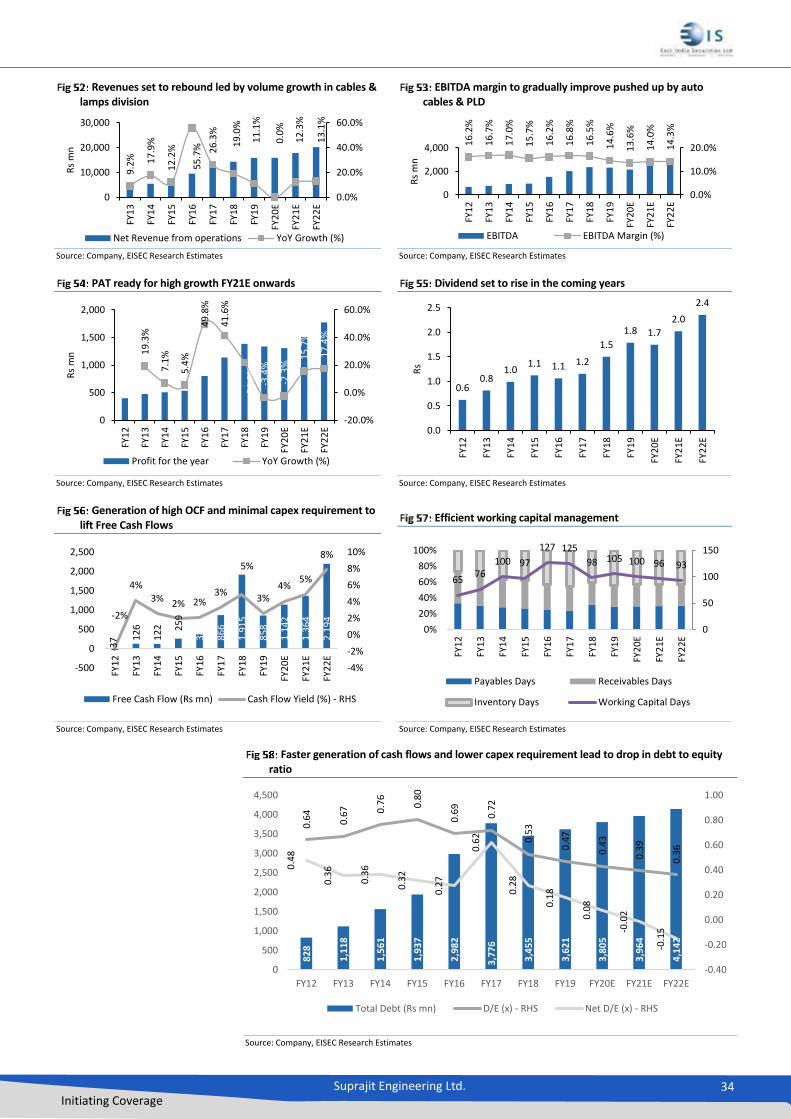
Suprajit Engineering Ltd. 34 Initiating Coverage
Revenues set to rebound led by volume growth in cables & lamps division
EBITDA margin to gradually improve pushed up by auto
cables & PLD
Source: Company, EISEC Research Estimates Source: Company, EISEC Research Estimates
PAT ready for high growth FY21E onwards Dividend set to rise in the coming years
Source: Company, EISEC Research Estimates Source: Company, EISEC Research Estimates
Generation of high OCF and minimal capex requirement to lift Free Cash Flows
Efficient working capital management
Source: Company, EISEC Research Estimates Source: Company, EISEC Research Estimates
Faster generation of cash flows and lower capex requirement lead to drop in debt to equity ratio
Source: Company, EISEC Research Estimates
9.2
% 17
.9%
12
.2%
55
.7% 26
.3%
19
.0%
11
.1%
0.0
%
12
.3%
13
.1%
0.0%
20.0%
40.0%
60.0%
0
10,000
20,000
30,000FY
13
FY1
4
FY1
5
FY1
6
FY1
7
FY1
8
FY1
9
FY2
0E
FY2
1E
FY2
2E
Rs
mn
Net Revenue from operations YoY Growth (%)
16
.2%
16
.7%
17
.0%
15
.7%
16
.2%
16
.8%
16
.5%
14
.6%
13
.6%
14
.0%
14
.3%
0.0%
10.0%
20.0%
0
2,000
4,000
FY1
2
FY1
3
FY1
4
FY1
5
FY1
6
FY1
7
FY1
8
FY1
9
FY2
0E
FY2
1E
FY2
2E
Rs
mn
EBITDA EBITDA Margin (%)
19
.3%
7.1
%
5.4
%
49
.8%
41
.6%
21
.8%
-3.4
%
-2.3
%
15
.7%
17
.4%
-20.0%
0.0%
20.0%
40.0%
60.0%
0
500
1,000
1,500
2,000
FY1
2
FY1
3
FY1
4
FY1
5
FY1
6
FY1
7
FY1
8
FY1
9
FY2
0E
FY2
1E
FY2
2E
Rs
mn
Profit for the year YoY Growth (%)
0.60.8
1.01.1 1.1 1.2
1.5
1.8 1.7
2.0
2.4
0.0
0.5
1.0
1.5
2.0
2.5
FY1
2
FY1
3
FY1
4
FY1
5
FY1
6
FY1
7
FY1
8
FY1
9
FY2
0E
FY2
1E
FY2
2E
Rs
-37 1
26
12
2 25
9
38
4
86
6
1,9
15
85
8
1,1
42
1,3
64
2,1
94-2%
4%
3% 2% 2%3%
5%
3%4%
5%
8%
-4%
-2%
0%
2%
4%
6%
8%
10%
-500
0
500
1,000
1,500
2,000
2,500
FY1
2
FY1
3
FY1
4
FY1
5
FY1
6
FY1
7
FY1
8
FY1
9
FY2
0E
FY2
1E
FY2
2E
Free Cash Flow (Rs mn) Cash Flow Yield (%) - RHS
6576
100 97
127 125
98 105 100 96 93
0
50
100
150
0%
20%
40%
60%
80%
100%
FY1
2
FY1
3
FY1
4
FY1
5
FY1
6
FY1
7
FY1
8
FY1
9
FY2
0E
FY2
1E
FY2
2EPayables Days Receivables Days
Inventory Days Working Capital Days
82
8
1,1
18
1,5
61
1,9
37
2,9
82
3,7
76
3,4
55
3,6
21
3,8
05
3,9
64
4,1
42
0.6
4
0.6
7 0.7
6
0.8
0
0.6
9
0.7
2
0.5
3
0.4
7
0.4
3
0.3
9
0.3
6
0.4
8
0.3
6
0.3
6
0.3
2
0.2
7
0.6
2
0.2
8
0.1
8
0.0
8
-0.0
2
-0.1
5
-0.40
-0.20
0.00
0.20
0.40
0.60
0.80
1.00
0
500
1,000
1,500
2,000
2,500
3,000
3,500
4,000
4,500
FY12 FY13 FY14 FY15 FY16 FY17 FY18 FY19 FY20E FY21E FY22E
Total Debt (Rs mn) D/E (x) - RHS Net D/E (x) - RHS

Suprajit Engineering Ltd. 35 Initiating Coverage
Corporate governance check
To keep the faith & trust of shareholders and other stakeholders, we believe that through corporate governance is necessary in today’s world. Hence, we have undertaken a detailed exercise on corporate governance study and covered broad aspects such as the composition of directors, compensation paid to promoter & independent directors, details of auditors & their remuneration, nature & amount of contingent liabilities, CSR spends and related party transactions.
Promoters’ Shareholding Suprajit Engineering is promoted by Mr. K Ajith Kumar Rai, an industry veteran in the mechanical cable industry. The promoters as of 31st Dec 2019 holds ~44.6% of the equity capital. The promoters’ family trust holds the highest equity capital (38.0%) in the company. The promoters haven’t sold any shares, however shareholding diluted on account of acquisition & merger accomplished during FY15-FY18. The company issued QIP in FY16 for acquisition of Phoenix Lamps, while in FY18 swapped shares with minority shareholders of Phoenix Lamps. Hence, promoters’ shareholding declined from ~51.8% in FY15 to ~44.5% in FY19.
Promoter Shareholding as on 31st December 2019
Particulars % Holding
Aashish Rai 0.86
Akhilesh Rai 0.86
Ashutosh Rai 0.86
Kula Ajith Kumar Rai 2.73
Supriya Ajith Rai 1.26
Supriyajith Family Trust 38.00
Total 44.57
Source: Company, EISEC Research
Promoters’ shareholding (%)
Source: Company, EISEC Research
51
.84
47
.37
47
.37
44
.48
44
.50
40.00
42.00
44.00
46.00
48.00
50.00
52.00
54.00
FY15 FY16 FY17 FY18 FY19
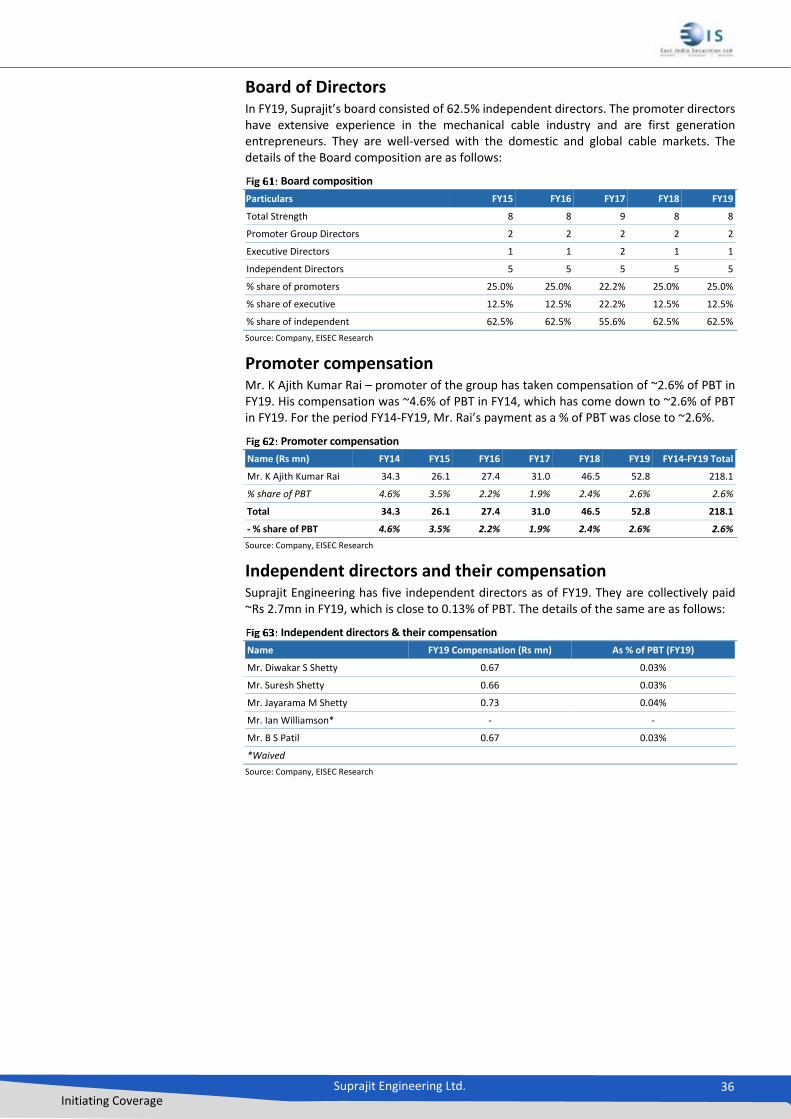
Suprajit Engineering Ltd. 36 Initiating Coverage
Board of Directors In FY19, Suprajit’s board consisted of 62.5% independent directors. The promoter directors have extensive experience in the mechanical cable industry and are first generation entrepreneurs. They are well-versed with the domestic and global cable markets. The details of the Board composition are as follows:
Board composition
Particulars FY15 FY16 FY17 FY18 FY19
Total Strength 8 8 9 8 8
Promoter Group Directors 2 2 2 2 2
Executive Directors 1 1 2 1 1
Independent Directors 5 5 5 5 5
% share of promoters 25.0% 25.0% 22.2% 25.0% 25.0%
% share of executive 12.5% 12.5% 22.2% 12.5% 12.5%
% share of independent 62.5% 62.5% 55.6% 62.5% 62.5%
Source: Company, EISEC Research
Promoter compensation Mr. K Ajith Kumar Rai – promoter of the group has taken compensation of ~2.6% of PBT in FY19. His compensation was ~4.6% of PBT in FY14, which has come down to ~2.6% of PBT in FY19. For the period FY14-FY19, Mr. Rai’s payment as a % of PBT was close to ~2.6%.
Promoter compensation
Name (Rs mn) FY14 FY15 FY16 FY17 FY18 FY19 FY14-FY19 Total
Mr. K Ajith Kumar Rai 34.3 26.1 27.4 31.0 46.5 52.8 218.1
% share of PBT 4.6% 3.5% 2.2% 1.9% 2.4% 2.6% 2.6%
Total 34.3 26.1 27.4 31.0 46.5 52.8 218.1
- % share of PBT 4.6% 3.5% 2.2% 1.9% 2.4% 2.6% 2.6%
Source: Company, EISEC Research
Independent directors and their compensation Suprajit Engineering has five independent directors as of FY19. They are collectively paid ~Rs 2.7mn in FY19, which is close to 0.13% of PBT. The details of the same are as follows:
Independent directors & their compensation
Name FY19 Compensation (Rs mn) As % of PBT (FY19)
Mr. Diwakar S Shetty 0.67 0.03%
Mr. Suresh Shetty 0.66 0.03%
Mr. Jayarama M Shetty 0.73 0.04%
Mr. Ian Williamson* - -
Mr. B S Patil 0.67 0.03%
*Waived
Source: Company, EISEC Research
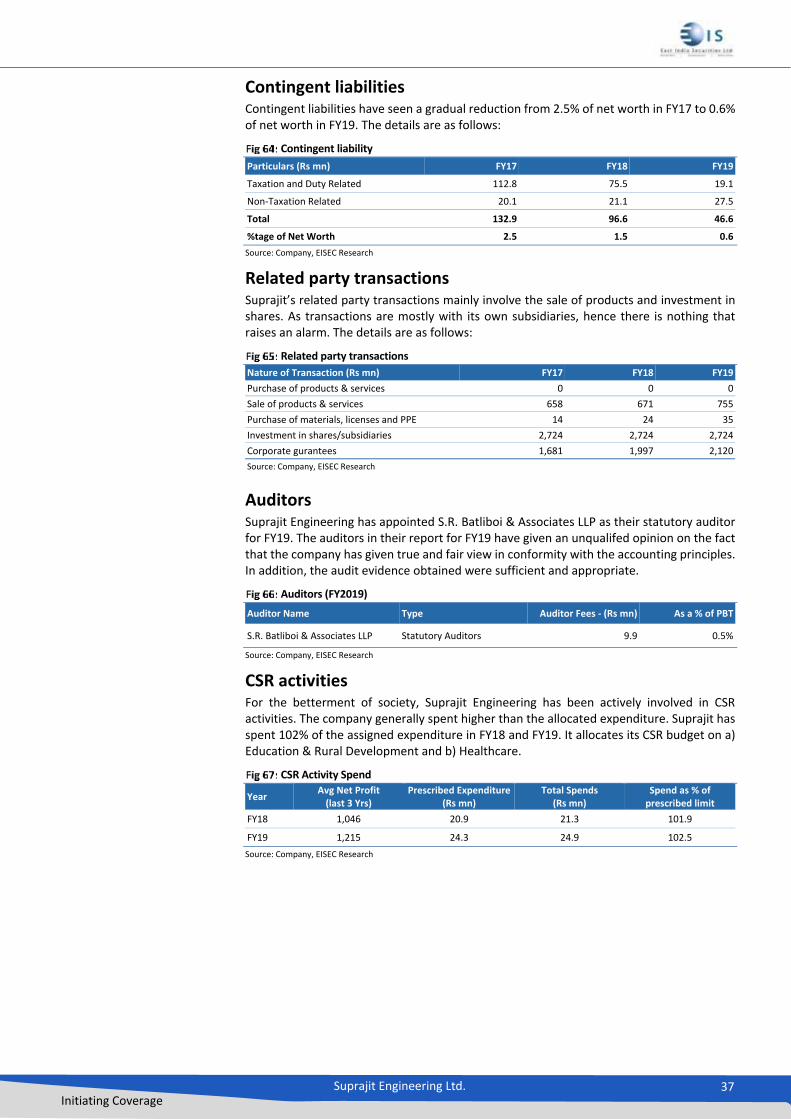
Suprajit Engineering Ltd. 37 Initiating Coverage
Contingent liabilities Contingent liabilities have seen a gradual reduction from 2.5% of net worth in FY17 to 0.6% of net worth in FY19. The details are as follows:
Contingent liability
Particulars (Rs mn) FY17 FY18 FY19
Taxation and Duty Related 112.8 75.5 19.1
Non-Taxation Related 20.1 21.1 27.5
Total 132.9 96.6 46.6
%tage of Net Worth 2.5 1.5 0.6
Source: Company, EISEC Research
Related party transactions Suprajit’s related party transactions mainly involve the sale of products and investment in shares. As transactions are mostly with its own subsidiaries, hence there is nothing that raises an alarm. The details are as follows:
Related party transactions
Nature of Transaction (Rs mn) FY17 FY18 FY19
Purchase of products & services 0 0 0
Sale of products & services 658 671 755
Purchase of materials, licenses and PPE 14 24 35
Investment in shares/subsidiaries 2,724 2,724 2,724
Corporate gurantees 1,681 1,997 2,120
Source: Company, EISEC Research
Auditors Suprajit Engineering has appointed S.R. Batliboi & Associates LLP as their statutory auditor for FY19. The auditors in their report for FY19 have given an unqualifed opinion on the fact that the company has given true and fair view in conformity with the accounting principles. In addition, the audit evidence obtained were sufficient and appropriate.
Auditors (FY2019)
Auditor Name Type Auditor Fees - (Rs mn) As a % of PBT
S.R. Batliboi & Associates LLP Statutory Auditors 9.9 0.5%
Source: Company, EISEC Research
CSR activities For the betterment of society, Suprajit Engineering has been actively involved in CSR activities. The company generally spent higher than the allocated expenditure. Suprajit has spent 102% of the assigned expenditure in FY18 and FY19. It allocates its CSR budget on a) Education & Rural Development and b) Healthcare.
CSR Activity Spend
Year Avg Net Profit
(last 3 Yrs) Prescribed Expenditure
(Rs mn) Total Spends
(Rs mn) Spend as % of
prescribed limit
FY18 1,046 20.9 21.3 101.9
FY19 1,215 24.3 24.9 102.5
Source: Company, EISEC Research
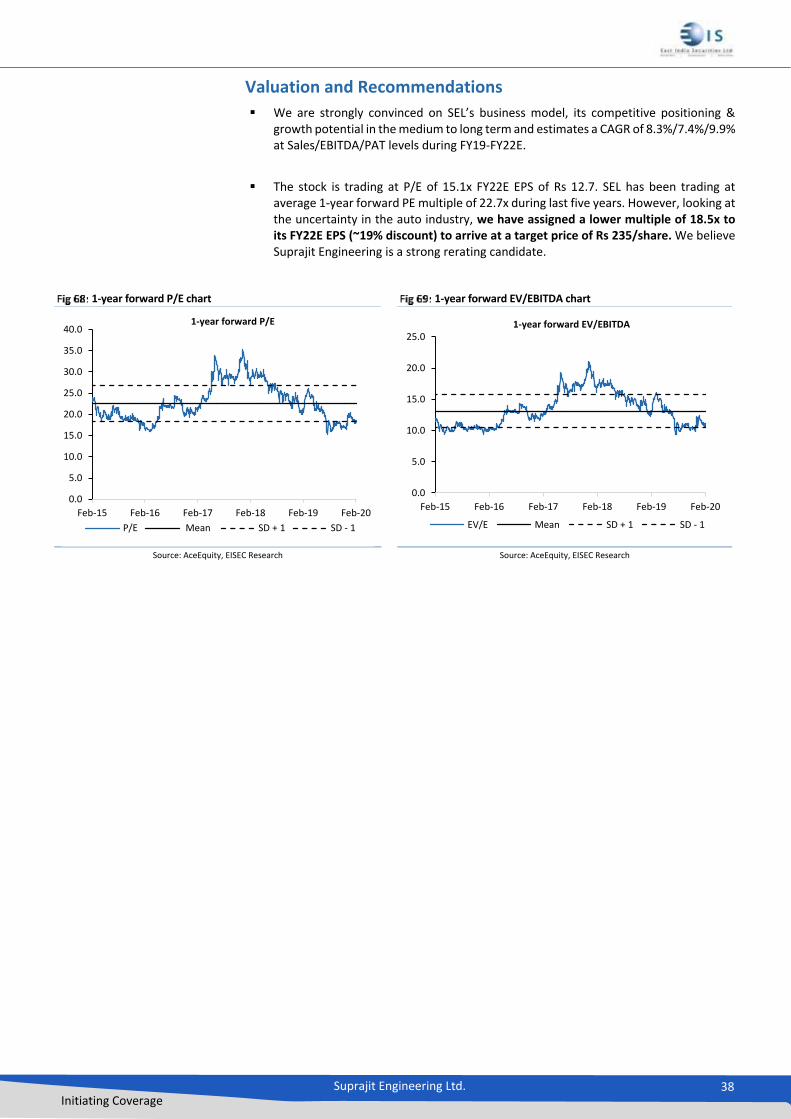
Suprajit Engineering Ltd. 38 Initiating Coverage
Valuation and Recommendations
We are strongly convinced on SEL’s business model, its competitive positioning & growth potential in the medium to long term and estimates a CAGR of 8.3%/7.4%/9.9% at Sales/EBITDA/PAT levels during FY19-FY22E.
The stock is trading at P/E of 15.1x FY22E EPS of Rs 12.7. SEL has been trading at average 1-year forward PE multiple of 22.7x during last five years. However, looking at the uncertainty in the auto industry, we have assigned a lower multiple of 18.5x to its FY22E EPS (~19% discount) to arrive at a target price of Rs 235/share. We believe Suprajit Engineering is a strong rerating candidate.
1-year forward P/E chart 1-year forward EV/EBITDA chart
Source: AceEquity, EISEC Research Source: AceEquity, EISEC Research
0.0
5.0
10.0
15.0
20.0
25.0
30.0
35.0
40.0
Feb-15 Feb-16 Feb-17 Feb-18 Feb-19 Feb-20
1-year forward P/E
P/E Mean SD + 1 SD - 1
0.0
5.0
10.0
15.0
20.0
25.0
Feb-15 Feb-16 Feb-17 Feb-18 Feb-19 Feb-20
1-year forward EV/EBITDA
EV/E Mean SD + 1 SD - 1
Suprajit Engineering Ltd. 39 Initiating Coverage
Key Risks
Slowdown in the automobile industry Suprajit’s growth is dependent on the automobile industry, which in turn depends upon the macro-economic stability. However, the company has been strategically diversifying its revenue streams to exports and aftermarket. In addition, the domestic long-term fundamentals for auto industry remains strong.
Commodity price risk Steel, PVC, Rubber, Plastic and Brass are its key RMs. Any increase in the commodity prices could impact its financials and can bring down its overall margins. Although, Suprajit does have some pass-through clause with its major customers.
Trade war & Brexit concern The exports contribute about ~39% of its revenues. The ongoing US-China trade war and Brexit has the potential to disrupt Global automotive demand and in turn could impact the finacials of Suprajit. The company is expanding its aftermarket reach, which could aid offset some of the pain in exports.
Technological changes At present there are no replacement available for mechanical cables as it is cost effective. Any technology disruption in the control cables could be seen as a threat.
In two-wheeler electric vehicles, there are chances that few cables might vanished, but it depends on what design an OEM adopts. OEMs prefer to retain cables, the reasons ascribed for this are 1) the problem is the cost of an electronic throttle (taken as a case) is very high compared to a mechanical cable. Digitally controlled sensor driven throttle system might cost Rs. 2,000+ a piece. On the other hand, the cost of a cable to manage this is just in the range of Rs 45-90. 2) secondly, the weight of a cable is just 100 grams, but the weight of an electronic sensor along with related equipments is near 2kg. The OEMs need to reduce the cost and ease load on the battery as much as possible in an electric vehicle. 3) electronic motor will always make some noise, but cable is completely noise free. Hence, Despite of all the automation & electronification seen over the last multi-years, the number of cables has only increased during this period. In addition, there won’t be any impact on the number of cables in an electric four-wheeler as currently in all the ICE cars, an electronic throttle has already been present. Hence, in electric four-wheeler, mostly the number of cables will remain the same.
We have seen China is pushing electric vehicles since last 10 years by giving subsidies, hence seen some adoption of EV overthere. But recently the Chinese government is gradually withdrawing the subsidy and the impact is a substantial reduction in the electric car sales. Hence, the whole system was supported by the government subsidy.
From the industry research, we understand that India is going to adopt a gradual route for electric vehicle adoption, which will be a self-sustaining route instead of Chinese strategy of subsidy driven route. This, along with the lack of charging infrastructure & the high cost of owning a vehicle remains a hindrance in adopting an electric vehicle and will take time for the EV high adoption celebration in India. Moreover, most of the automobile sales comes from rural areas, where there are still issues with respect to electricity. The high cost of EVs and fluctuating power, especially in rural areas is a major hindrance to EV adoption. Hence, we don’t think electric vehicle would be a major part at least in the coming three years. Recent estimates from Bloomberg suggests just 7% penetration of an electric vehicle by FY2030. Overall, we don’t see any impact on a cable in the medium term and in fact, in an electric vehicle, there are possibilities of some new application comes in and a requirement of cable increases further.

Suprajit Engineering Ltd. 40 Initiating Coverage
Quarterly Financials, Operating Metrics and Key Performance Indicators
Quarterly Financials
Y/E March (Rs mn) Q4FY18 Q1FY19 Q2FY19 Q3FY19 Q4FY19 Q1FY20 Q2FY20 Q3FY20
Net Sales 4,064 3,618 3,914 4,056 4,311 3,634 3,982 4,123
Raw Materials 2,278 2,012 2,265 2,347 2,524 2,073 2,366 2,430
Employee Costs 662 712 764 762 798 720 725 770
Other Expenditure 390 339 353 340 354 329 334 422
EBITDA 734 554 531 607 635 513 558 501
Depreciation 95 99 102 104 107 128 159 149
Interest 59 64 64 58 60 66 52 52
Other Income 68 41 30 184 125 62 134 53
PBT 649 433 396 630 594 380 480 353
Tax 85 145 155 238 177 132 30 41
Tax rate (%) 13 33 39 38 30 35 6 12
Reported PAT 563 288 241 392 417 249 450 312
Y-o-Y Growth (%)
Revenue 5.6 4.7 16.3 10.7 6.1 0.4 1.7 1.6
EBITDA 12.7 20.8 -5.1 0.9 -13.5 -7.5 4.9 -17.4
PAT 38.8 27.4 -23.1 38.8 -25.9 -13.7 86.9 -20.4
Q-o-Q Growth (%)
Revenue 11.0 -11.0 8.2 3.6 6.3 -15.7 9.6 3.5
EBITDA 22.2 -24.5 -4.1 14.2 4.7 -19.3 8.7 -10.2
PAT 99.5 -48.9 -16.5 62.9 6.5 -40.5 80.9 -30.6
Margin (%)
EBITDA 18.1 15.3 13.6 15.0 14.7 14.1 14.0 12.1
PAT 13.9 8.0 6.1 9.7 9.7 6.8 11.3 7.6
Source: Company, EISEC Research
Key Assumptions
Particulars (Rs mn) FY18 FY19 FY20E FY21E FY22E
Auto Cable Division
Automotive Cable Capacity (in millions)
210 210 252 273 273
Automotive Cables Produced (in millions)
187 197 191 207 227
Average realization per cable (Rs) 43 47 49 52 54
Net Revenues (Rs mn) 8,024 9,319 9,401 10,661 12,196
EBITDA Margin (%) 17.1% 15.3% 15.4% 15.7% 16.0%
Non-Auto Cable Division
Non-Automotive Cable Capacity (in millions)
40 40 48 52 52
Non-Automotive Cables Produced (in millions) 25 28 26 28 31
Average realization per cable (Rs) 122 122 124 125 126
Net Revenues (Rs mn) 3,050 3,395 3,223 3,516 3,871
EBITDA Margin (%) 16.3% 14.6% 10.5% 10.9% 11.2%
Phoenix Lamps Division
Lamps Capacity (in millions) 87 87 87 112 112
Lamps Produced (in millions) 62 61 62 69 75
Average realization per bulb (Rs) 52 52 53 54 55
Net Revenues (Rs mn) 3,230 3,184 3,281 3,681 4,130
EBITDA Margin (%) 12.1% 12.7% 11.5% 12.0% 12.2%
Source: Company, EISEC Research Estimates

Suprajit Engineering Ltd. 41 Initiating Coverage
Plenty of opportunities in two-wheeler industry
Indian two-wheeler industry India is the largest 2W industry in the world since 2016 and a global leader in this particular segment of the automobile industry. Motorcycles commands the majority share, while scooters in the recent past have grown faster than motorcycles.
Two-wheeler production (FY08-19 - CAGR 11%)
Source: SIAM, EISEC Research
Two-wheeler sales (FY08-19 - CAGR 11%)
Source: SIAM, EISEC Research
Premiumisation trend is picking up Rising income levels, aspirations and eye-catching product launches at a reasonable price have been the driving factors for the premium bike segment that has been gaining market share. As per the study, there are 70mn households who can afford premium bikes (150cc & above). Hence, the penetration level is ~25%. With rising income of households and lower penetration, we think premium bike sales will continue to grow. Secondly, due to aspirational levels attached to it, we believe this will continue to drive premium bike sales. The new launches at a reasonable price, along with the strong demand for Royal Enfield, TVS Apache, KTM, Dominar, FZ, etc to continue to push the sales higher.
5%
26
% 28
%
14
%
2% 7
% 10
%
2% 6
%
16
% 6%
-13
%
-15%
-10%
-5%
0%
5%
10%
15%
20%
25%
30%
35%
0
5,000,000
10,000,000
15,000,000
20,000,000
25,000,000
30,000,000
FY0
8
FY0
9
FY1
0
FY1
1
FY1
2
FY1
3
FY1
4
FY1
5
FY1
6
FY1
7
FY1
8
FY1
9
YTD
FY2
0
No
of
un
its
pro
du
ced
2W Production Growth (%)
5%
25% 27%
15%
2%7%
9% 3%5%
15% 6%
-13%
-15%
-10%
-5%
0%
5%
10%
15%
20%
25%
30%
0
5,000,000
10,000,000
15,000,000
20,000,000
25,000,000
30,000,000
FY0
8
FY0
9
FY1
0
FY1
1
FY1
2
FY1
3
FY1
4
FY1
5
FY1
6
FY1
7
FY1
8
FY1
9
YTD
FY2
0
No
of
un
its
sold
2W sales Growth (%)
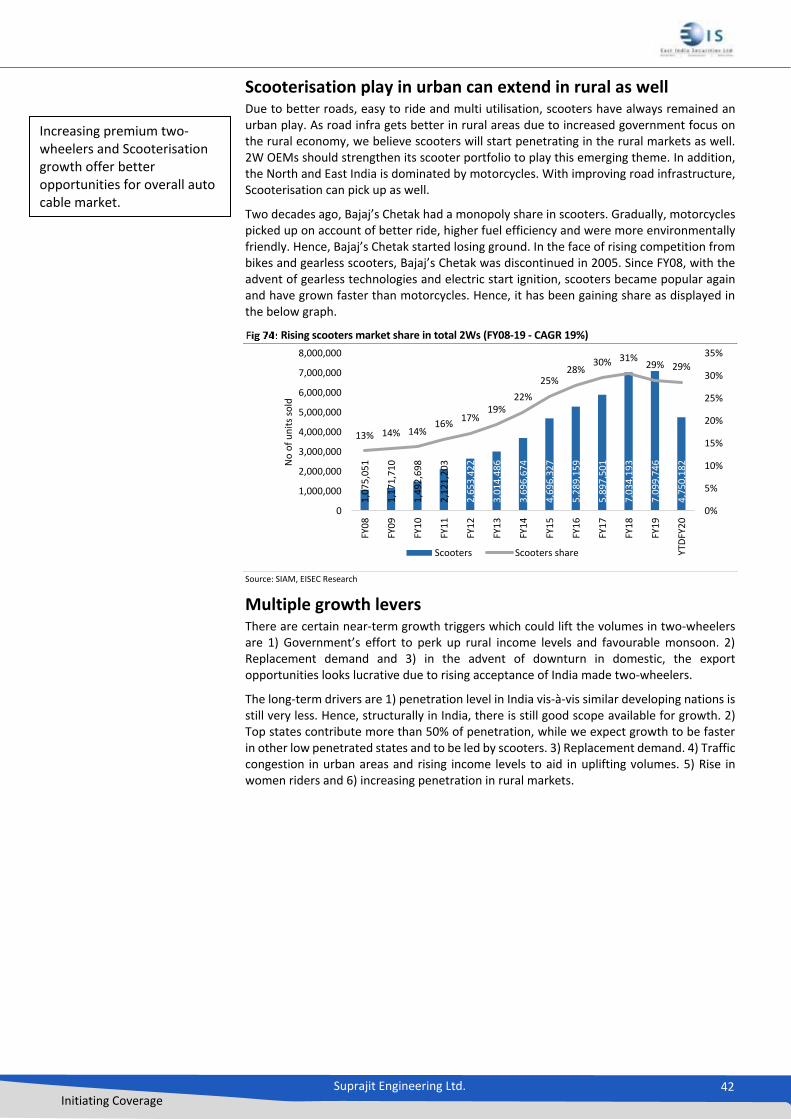
Suprajit Engineering Ltd. 42 Initiating Coverage
Scooterisation play in urban can extend in rural as well Due to better roads, easy to ride and multi utilisation, scooters have always remained an urban play. As road infra gets better in rural areas due to increased government focus on the rural economy, we believe scooters will start penetrating in the rural markets as well. 2W OEMs should strengthen its scooter portfolio to play this emerging theme. In addition, the North and East India is dominated by motorcycles. With improving road infrastructure, Scooterisation can pick up as well.
Two decades ago, Bajaj’s Chetak had a monopoly share in scooters. Gradually, motorcycles picked up on account of better ride, higher fuel efficiency and were more environmentally friendly. Hence, Bajaj’s Chetak started losing ground. In the face of rising competition from bikes and gearless scooters, Bajaj’s Chetak was discontinued in 2005. Since FY08, with the advent of gearless technologies and electric start ignition, scooters became popular again and have grown faster than motorcycles. Hence, it has been gaining share as displayed in the below graph.
Rising scooters market share in total 2Ws (FY08-19 - CAGR 19%)
Source: SIAM, EISEC Research
Multiple growth levers There are certain near-term growth triggers which could lift the volumes in two-wheelers are 1) Government’s effort to perk up rural income levels and favourable monsoon. 2) Replacement demand and 3) in the advent of downturn in domestic, the export opportunities looks lucrative due to rising acceptance of India made two-wheelers.
The long-term drivers are 1) penetration level in India vis-à-vis similar developing nations is still very less. Hence, structurally in India, there is still good scope available for growth. 2) Top states contribute more than 50% of penetration, while we expect growth to be faster in other low penetrated states and to be led by scooters. 3) Replacement demand. 4) Traffic congestion in urban areas and rising income levels to aid in uplifting volumes. 5) Rise in women riders and 6) increasing penetration in rural markets.
1,0
75
,05
1
1,1
71
,71
0
1,4
92
,69
8
2,1
21
,20
3
2,6
53
,42
2
3,0
14
,48
6
3,6
96
,67
4
4,6
96
,32
7
5,2
89
,15
9
5,8
97
,50
1
7,0
34
,19
3
7,0
99
,74
6
4,7
50
,18
2
13% 14% 14%16%
17%19%
22%
25%28%
30% 31%29% 29%
0%
5%
10%
15%
20%
25%
30%
35%
0
1,000,000
2,000,000
3,000,000
4,000,000
5,000,000
6,000,000
7,000,000
8,000,000FY
08
FY0
9
FY1
0
FY1
1
FY1
2
FY1
3
FY1
4
FY1
5
FY1
6
FY1
7
FY1
8
FY1
9
YTD
FY2
0
No
of
un
its
sold
Scooters Scooters share
Increasing premium two-wheelers and Scooterisation growth offer better opportunities for overall auto cable market.

Suprajit Engineering Ltd. 43 Initiating Coverage
Key trends shaping PV industry
Passenger vehicle industry The Indian passenger vehicle industry has grown more or less in line with India’s GDP growth rate and is anticipated to grow in a similar fashion in the coming five years led by traction in the UV space (UVs reported 15% CAGR during FY08-19 vis-à-vis 8% CAGR for total PVs for the same period). The growth was owing to an improvement in economic condition and rise in consumer disposal incomes. We have observed that there has been a gradual shift from transportation to comfortable transportation and now to a luxurious & safe transportation. The electric vehicle sales are expected to pick up in the coming years as well.
Passenger cars production (FY08-19 - CAGR 6%) Utility vehicles production (FY08-19 - CAGR 15%)
Source: SIAM, EISEC Research Source: SIAM, EISEC Research
Vans production (FY08-19 - CAGR 7%) Total passenger vehicles production (FY08-19 - CAGR 8%)
Source: SIAM, EISEC Research Source: SIAM, EISEC Research
Macroeconomic favourable trends
Rapid urbanisation – 500mn people to live in cities by 2030, ~1.5x the current US population.
Rising income levels – there will be 60mn households could enter the consumption class, earnings greater than $8,000 per annum by 2025. In addition, more people would join the workforce.
Mini cars and hatchbacks to remain dominant in the industry, however the majority of growth is expected to come from SUVs, Sedans and Luxury vehicles.
7%
27
%
29
%
3%
-4%
-4% 4% 6
% 6% 1%
-1%
-19
%
-30%
-20%
-10%
0%
10%
20%
30%
40%
0
500,000
1,000,000
1,500,000
2,000,000
2,500,000
3,000,000
FY0
8
FY0
9
FY1
0
FY1
1
FY1
2
FY1
3
FY1
4
FY1
5
FY1
6
FY1
7
FY1
8
FY1
9
YTD
FY2
0
No
of
un
its
pro
du
ced
Passenger Cars (Nos) Passenger cars growth (%)
-11
%
25
%
18
%
15
%
53
%
0% 10
% 15
%
27
% 20
% 1%
5%
-20%
-10%
0%
10%
20%
30%
40%
50%
60%
0
200,000
400,000
600,000
800,000
1,000,000
1,200,000
FY0
8
FY0
9
FY1
0
FY1
1
FY1
2
FY1
3
FY1
4
FY1
5
FY1
6
FY1
7
FY1
8
FY1
9
YTD
FY2
0
No
of
un
its
pro
du
ced
Utility Vehicles (Nos) UVs growth (%)
-5%
58
%
44
%
9%
1%
-18
%
-12
%
5%
-1%
0% 2
1%
-36
%
-60%
-40%
-20%
0%
20%
40%
60%
80%
0
50,000
100,000
150,000
200,000
250,000
300,000
FY0
8
FY0
9
FY1
0
FY1
1
FY1
2
FY1
3
FY1
4
FY1
5
FY1
6
FY1
7
FY1
8
FY1
9
YTD
FY2
0
No
of
un
its
pro
du
ced
Vans (Nos) Vans growth (%)
4%
28
%
28
%
4% 3%
-4% 4% 7%
10
%
6%
0%
-14
%-20%
-10%
0%
10%
20%
30%
40%
0
1,000,000
2,000,000
3,000,000
4,000,000
5,000,000
FY0
8
FY0
9
FY1
0
FY1
1
FY1
2
FY1
3
FY1
4
FY1
5
FY1
6
FY1
7
FY1
8
FY1
9
YTD
FY2
0
No
of
un
its
pro
du
ced
Total PVs (Nos) PVs growth (%)
Suprajit Engineering Ltd. 44 Initiating Coverage
Four developments reshaping PV industry
Electrification: The traction in the EV is emerging faster than expected due to decline in battery prices and enhanced support from the government. We expect commercial transportation vehicles, 2Ws, luxury PVs, and LCVs could see maximum acceptance of EV in the coming 10 years. Currently, consumers remain cautious on EVs due to high cost, low range, and lack of options.
Shared mobility: Penetration of shared mobility is rising in densely populated cities in India, where consumers believe cab costs is comparatively less than owning a car. 1) Better asset utilisation for cab owners 2) simplification of regulations and 3) upgradation of infrastructure are three main triggers to continue its growth momentum.
Connected vehicles: It’s still in early stages in India, however faster adoption of smartphones could bloom this feature in vehicles. Entertainment, navigation, and Bluetooth connectivity emerging faster from last several years. Sensor data, vehicle health and driving behaviour are also evolving.
Autonomous vehicles: AVs have the potential to resolve few road safety challenges viz. to reduce traffic congestion, improve safety and fuel efficiency. We expect this trend not to evolve in the medium term owing to weak infrastructure, technology related challenges, loss of jobs, etc.

Suprajit Engineering Ltd. 45 Initiating Coverage
Commercial vehicle (CV) industry
Cyclicality CV industry is cyclical in nature. M&HCV sales are closely linked to key segments of economy viz. infrastructure, construction, and industrial growth whereas LCV sales are dependent on overall consumption growth. During economy upcycle, with higher demand and increase in freight rates, fleet operators keep increasing their capacities to cater to the peak demand. When the growth takes a breather, the fleet operators come in the over capacity zone and this impacts the freight rates, which in turn affect the cash flows negatively for fleet operators and hence they start avoid further buying of CVs. And this leads to slowdown in CV sales. The below graph depicts this situation.
MHCVs production (FY08-19 - CAGR 4%)
Source: SIAM, EISEC Research
LCVs production (FY08-19 - CAGR 9%)
Source: SIAM, EISEC Research
Total CVs production (FY08-19 - CAGR 7%)
Source: SIAM, EISEC Research
-35
%
30
% 41
%
9%
-27
%
-21
%
20
% 28
%
0% 0%
29
%
-43
%
-60%
-40%
-20%
0%
20%
40%
60%
0
100,000
200,000
300,000
400,000
500,000
FY0
8
FY0
9
FY1
0
FY1
1
FY1
2
FY1
3
FY1
4
FY1
5
FY1
6
FY1
7
FY1
8
FY1
9
YTD
FY2
0
No
of
un
its
pro
du
ced
M&HCVs MHCV growth (%) - RHS
-12
%
41
%
33
%
28
%
2%
-13
%
-10
%
4% 5
% 18
%
21
%
-16
%-20%
-10%
0%
10%
20%
30%
40%
50%
0
200,000
400,000
600,000
800,000
FY0
8
FY0
9
FY1
0
FY1
1
FY1
2
FY1
3
FY1
4
FY1
5
FY1
6
FY1
7
FY1
8
FY1
9
YTD
FY2
0
No
of
un
its
pro
du
ced
LCVs LCVs growth (%) - RHS
-24
%
36
%
37
%
20
%
-10
%
-16
%
-1%
13
%
3% 1
0%
24
%
-27
%
-40%
-30%
-20%
-10%
0%
10%
20%
30%
40%
0
200,000
400,000
600,000
800,000
1,000,000
1,200,000
FY0
8
FY0
9
FY1
0
FY1
1
FY1
2
FY1
3
FY1
4
FY1
5
FY1
6
FY1
7
FY1
8
FY1
9
YTD
FY2
0
No
of
un
its
pro
du
ced
Total CVs CVs growth (%) - RHS
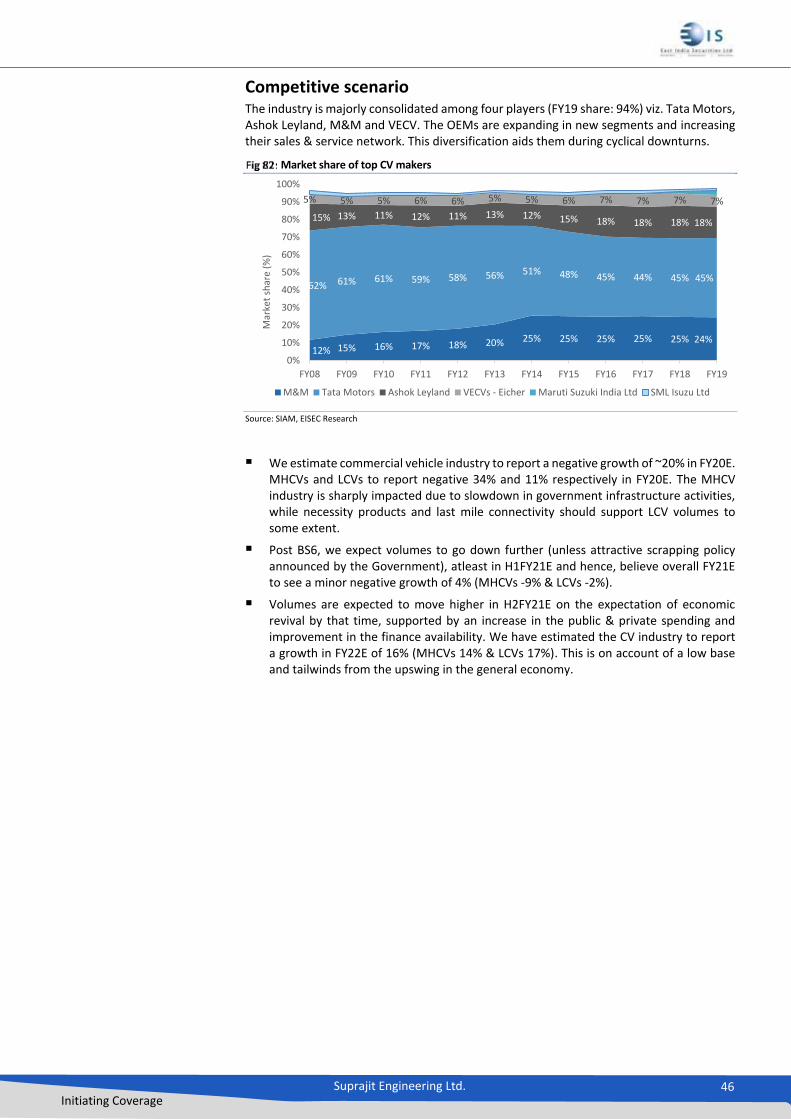
Suprajit Engineering Ltd. 46 Initiating Coverage
Competitive scenario The industry is majorly consolidated among four players (FY19 share: 94%) viz. Tata Motors, Ashok Leyland, M&M and VECV. The OEMs are expanding in new segments and increasing their sales & service network. This diversification aids them during cyclical downturns.
Market share of top CV makers
Source: SIAM, EISEC Research
We estimate commercial vehicle industry to report a negative growth of ~20% in FY20E. MHCVs and LCVs to report negative 34% and 11% respectively in FY20E. The MHCV industry is sharply impacted due to slowdown in government infrastructure activities, while necessity products and last mile connectivity should support LCV volumes to some extent.
Post BS6, we expect volumes to go down further (unless attractive scrapping policy announced by the Government), atleast in H1FY21E and hence, believe overall FY21E to see a minor negative growth of 4% (MHCVs -9% & LCVs -2%).
Volumes are expected to move higher in H2FY21E on the expectation of economic revival by that time, supported by an increase in the public & private spending and improvement in the finance availability. We have estimated the CV industry to report a growth in FY22E of 16% (MHCVs 14% & LCVs 17%). This is on account of a low base and tailwinds from the upswing in the general economy.
12% 15% 16% 17% 18% 20% 25% 25% 25% 25% 25% 24%
62% 61% 61% 59% 58% 56% 51% 48% 45% 44% 45% 45%
15% 13% 11% 12% 11% 13% 12% 15% 18% 18% 18% 18%
5% 5% 5% 6% 6% 5% 5% 6% 7% 7% 7% 7%
0%
10%
20%
30%
40%
50%
60%
70%
80%
90%
100%
FY08 FY09 FY10 FY11 FY12 FY13 FY14 FY15 FY16 FY17 FY18 FY19
Mar
ket
shar
e (%
)
M&M Tata Motors Ashok Leyland VECVs - Eicher Maruti Suzuki India Ltd SML Isuzu Ltd
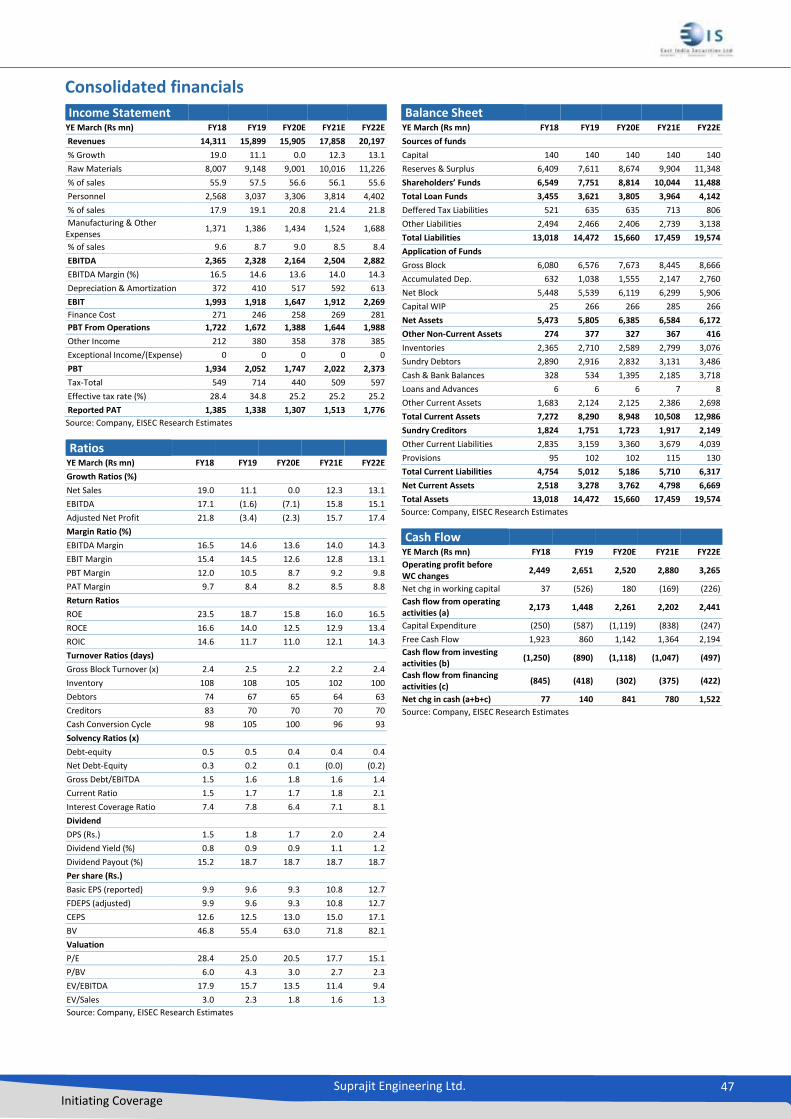
Suprajit Engineering Ltd. 47 Initiating Coverage
Consolidated financials
Income Statement
YE March (Rs mn) FY18 FY19 FY20E FY21E FY22E
Revenues 14,311 15,899 15,905 17,858 20,197
% Growth 19.0 11.1 0.0 12.3 13.1
Raw Materials 8,007 9,148 9,001 10,016 11,226
% of sales 55.9 57.5 56.6 56.1 55.6
Personnel 2,568 3,037 3,306 3,814 4,402
% of sales 17.9 19.1 20.8 21.4 21.8
Manufacturing & Other Expenses
1,371 1,386 1,434 1,524 1,688
% of sales 9.6 8.7 9.0 8.5 8.4
EBITDA 2,365 2,328 2,164 2,504 2,882
EBITDA Margin (%) 16.5 14.6 13.6 14.0 14.3
Depreciation & Amortization 372 410 517 592 613
EBIT 1,993 1,918 1,647 1,912 2,269
Finance Cost 271 246 258 269 281
PBT From Operations 1,722 1,672 1,388 1,644 1,988
Other Income 212 380 358 378 385
Exceptional Income/(Expense) 0 0 0 0 0
PBT 1,934 2,052 1,747 2,022 2,373
Tax-Total 549 714 440 509 597
Effective tax rate (%) 28.4 34.8 25.2 25.2 25.2
Reported PAT 1,385 1,338 1,307 1,513 1,776
Source: Company, EISEC Research Estimates
Ratios
YE March (Rs mn) FY18 FY19 FY20E FY21E FY22E
Growth Ratios (%)
Net Sales 19.0 11.1 0.0 12.3 13.1
EBITDA 17.1 (1.6) (7.1) 15.8 15.1
Adjusted Net Profit 21.8 (3.4) (2.3) 15.7 17.4
Margin Ratio (%)
EBITDA Margin 16.5 14.6 13.6 14.0 14.3
EBIT Margin 15.4 14.5 12.6 12.8 13.1
PBT Margin 12.0 10.5 8.7 9.2 9.8
PAT Margin 9.7 8.4 8.2 8.5 8.8
Return Ratios
ROE 23.5 18.7 15.8 16.0 16.5
ROCE 16.6 14.0 12.5 12.9 13.4
ROIC 14.6 11.7 11.0 12.1 14.3
Turnover Ratios (days)
Gross Block Turnover (x) 2.4 2.5 2.2 2.2 2.4
Inventory 108 108 105 102 100
Debtors 74 67 65 64 63
Creditors 83 70 70 70 70
Cash Conversion Cycle 98 105 100 96 93
Solvency Ratios (x)
Debt-equity 0.5 0.5 0.4 0.4 0.4
Net Debt-Equity 0.3 0.2 0.1 (0.0) (0.2)
Gross Debt/EBITDA 1.5 1.6 1.8 1.6 1.4
Current Ratio 1.5 1.7 1.7 1.8 2.1
Interest Coverage Ratio 7.4 7.8 6.4 7.1 8.1
Dividend
DPS (Rs.) 1.5 1.8 1.7 2.0 2.4
Dividend Yield (%) 0.8 0.9 0.9 1.1 1.2
Dividend Payout (%) 15.2 18.7 18.7 18.7 18.7
Per share (Rs.)
Basic EPS (reported) 9.9 9.6 9.3 10.8 12.7
FDEPS (adjusted) 9.9 9.6 9.3 10.8 12.7
CEPS 12.6 12.5 13.0 15.0 17.1
BV 46.8 55.4 63.0 71.8 82.1
Valuation
P/E 28.4 25.0 20.5 17.7 15.1
P/BV 6.0 4.3 3.0 2.7 2.3
EV/EBITDA 17.9 15.7 13.5 11.4 9.4
EV/Sales 3.0 2.3 1.8 1.6 1.3
Source: Company, EISEC Research Estimates
Balance Sheet
YE March (Rs mn) FY18 FY19 FY20E FY21E FY22E
Sources of funds
Capital 140 140 140 140 140
Reserves & Surplus 6,409 7,611 8,674 9,904 11,348
Shareholders’ Funds 6,549 7,751 8,814 10,044 11,488
Total Loan Funds 3,455 3,621 3,805 3,964 4,142
Deffered Tax Liabilities 521 635 635 713 806
Other Liabilities 2,494 2,466 2,406 2,739 3,138
Total Liabilities 13,018 14,472 15,660 17,459 19,574
Application of Funds
Gross Block 6,080 6,576 7,673 8,445 8,666
Accumulated Dep. 632 1,038 1,555 2,147 2,760
Net Block 5,448 5,539 6,119 6,299 5,906
Capital WIP 25 266 266 285 266
Net Assets 5,473 5,805 6,385 6,584 6,172
Other Non-Current Assets 274 377 327 367 416
Inventories 2,365 2,710 2,589 2,799 3,076
Sundry Debtors 2,890 2,916 2,832 3,131 3,486
Cash & Bank Balances 328 534 1,395 2,185 3,718
Loans and Advances 6 6 6 7 8
Other Current Assets 1,683 2,124 2,125 2,386 2,698
Total Current Assets 7,272 8,290 8,948 10,508 12,986
Sundry Creditors 1,824 1,751 1,723 1,917 2,149
Other Current Liabilities 2,835 3,159 3,360 3,679 4,039
Provisions 95 102 102 115 130
Total Current Liabilities 4,754 5,012 5,186 5,710 6,317
Net Current Assets 2,518 3,278 3,762 4,798 6,669
Total Assets 13,018 14,472 15,660 17,459 19,574
Source: Company, EISEC Research Estimates
Cash Flow
YE March (Rs mn) FY18 FY19 FY20E FY21E FY22E
Operating profit before WC changes
2,449 2,651 2,520 2,880 3,265
Net chg in working capital 37 (526) 180 (169) (226)
Cash flow from operating activities (a)
2,173 1,448 2,261 2,202 2,441
Capital Expenditure (250) (587) (1,119) (838) (247)
Free Cash Flow 1,923 860 1,142 1,364 2,194
Cash flow from investing activities (b)
(1,250) (890) (1,118) (1,047) (497)
Cash flow from financing activities (c)
(845) (418) (302) (375) (422)
Net chg in cash (a+b+c) 77 140 841 780 1,522
Source: Company, EISEC Research Estimates

Suprajit Engineering Ltd. 48
Initiating Coverage
Disclaimer
East India Securities Limited (hereinafter EISEC), a publically listed company, registered as Research Analyst with SEBI (Registration No. INH300003231). EISEC is engaged in broking services, distribution and marketing of financial products, and in the normal course of business, EISEC prepares and shares research data and reports periodically with clients, investors, stake holders and general public in compliance with Securities and Exchange Board of India Act, 1992, Securities And Exchange Board Of India (Research Analysts) Regulations, 2014 and/or any other applicable directives, instructions or guidelines issued by the Regulators from time to time. Research report is a written or electronic communication that includes research analysis, research recommendation or an opinion concerning securities or public offer, providing a basis for investment decisions. The views expressed therein are based solely on information available publicly/internal data/other reliable sources believed to be true. The information is provided merely as a complementary service and do not constitute an offer, solicitation for the purchase or sale of any financial instruments, inducement, promise, guarantee, warranty, or as an official confirmation of any transactions or contract of any kind. Research data and reports published/ emailed/ text messaged via Short Messaging Services, Online Messengers, WhatsAppetc/transmitted through mobile application/s, including but not limited to FLIP™, Video Widget, telephony networks, print or electronic media and or those made available/uploaded on social networking sites (e.g. Facebook, Twitter, LinkedIn etc) by EISEC or those recommendation or offers or opinions concerning securities or public offer which are expressed as and during the course of “Public Appearance” are for informational purposes only. The reports are provided for assistance and are not intended to be and must not alone be taken as the basis for an investment decision. The user assumes the entire risk of any use made of this information. Though disseminated to clients simultaneously, not all clients may receive the reports at the same time. EISEC will not treat recipients as clients by virtue of their receiving this report. The reports include projections, forecasts and other predictive statements which represent EISEC’s assumptions and expectations in the light of currently available information. These projections and forecasts are based on industry trends, circumstances and factors which involve risks, variables and uncertainties. The actual performance of the companies represented in the report may vary from those projected. The projections and forecasts described in this report should be evaluated keeping in mind the fact that these- • are based on estimates and assumptions • are subject to significant uncertainties and contingencies • will vary from actual results and such variations may increase over a period of time • are not scientifically proven to guarantee certain intended results • are not published as a warranty and do not carry any evidentiary value. • are not based on certain generally accepted accounting principles • are not to be relied on in contractual, legal or tax advice. Prospective investors and others are cautioned that any forward-looking statements are not predictions and may be subject to change without notice. Reports based on technical analysis is focused on studying charts of a stock's price movement and trading volume, as opposed to focusing on a company's fundamentals and as such, may not match with a report on a company's fundamentals. Though we review the research reports for any untrue statements of material facts or any false or misleading information, , we do not represent that it is accurate or complete and it should not be relied on in connection with a commitment or contract whatsoever. Because of the possibility of human, technical or mechanical error by our sources of transmission of Reports/Data, we do not guarantee the accuracy, adequacy, completeness or availability of any information and are not to be held responsible for any errors or omissions or for the results obtained from the use of such information. EISEC and/or its Affiliates and its officers, directors and employees including the analysts/authors shall not be in any way responsible for any indirect, special or consequential damages that may arise to any person from any inadvertent error in the information contained in the reports nor do they take guarantee or assume liability for any omissions of the information contained therein. Information contained therein cannot be the basis for any claim, demand or cause of action. These data, reports and information do not constitute scientific publication and do not carry any evidentiary value whatsoever. The reports are not for public distribution. Reproduction or dissemination, directly or indirectly, of research data and reports of EISEC in any form is prohibited except with the written permission of EISEC. Persons into whose possession the reports may come are required to observe these restrictions. Opinions expressed therein are our current opinion as of the date appearing on the report only. Data may be subject to update and correction without notice. While we endeavour to update on a reasonable basis the information discussed in the reports, there may be regulatory, compliance, or other reasons that prevent us from doing so. The reports do not take into account the particular investment objectives, financial situations, risk profile or needs of individual clients. The user assumes the entire risk of any use made of this information. Each recipient of the reports should make such investigation as deemed necessary to arrive at an independent evaluation of an investment in the securities of companies referred to in such reports (including the merits and risks involved). Certain transactions - futures, options and other derivatives as well as non-investment grade securities - involve substantial risks and are not suitable for all investors. Investors may lose his/her entire investment under certain market conditions. Before acting on any advice or recommendation in this material, investors should consider whether it is suitable for their particular circumstances and, if necessary, seek professional advice. The price and value of investments referred to in research reports and the income from them may fluctuate. Transaction costs may be significant in option strategies calling for multiple purchase and sales of options. Foreign currencies denominated securities are

Suprajit Engineering Ltd. 49
Initiating Coverage
subject to fluctuations in exchange rates that could have an adverse effect on the value or price of or income derived from the investment. Investors in securities such as ADRs, the value of which are influenced by foreign currencies effectively assume currency risk. The recommendations in the reports are based on 12 month horizon, unless otherwise specified. The investment ratings are on absolute positive/negative return basis. It is possible that due to volatile price fluctuation in the near to medium term, there could be a temporary mismatch to rating. For reasons of valuations/return/lack of clarity/event we may revisit rating at appropriate time. The stocks always carry the risk of being upgraded to buy or downgraded to a hold, reduce or sell. The opinions expressed in the reports are subject to change but we have no obligation to tell our clients when our opinions or recommendations change. The reports are non-inclusive and do not consider all the information that the recipients may consider material to investments. The reports are issued by EISEC without any liability/undertaking/commitment on the part of itself or any of its entities. Recipients of the research reports should assume that entities of EISEC may receive commission, brokerage, fees or other compensation from the company or companies that are the subject of the reports. We and our affiliates, officers, directors, and employees, including persons involved in the preparation or issuance of reports/data/material, may, from time to time have 'long' or 'short' positions in, act as principal in, and buy or sell the securities thereof of companies mentioned therein or be engaged in any other transaction involving such securities and earn brokerage or other compensation or act as market maker in the financial instruments of the company/ies discussed therein or act as advisor or lender/borrower to such company/ies or have other potential conflicts of interests with respect to any recommendation and related information and opinions.
We further undertake that-
No disciplinary action has been taken against the research analyst or EISEC by any authority in connection with their respective business activity.
EISEC, Research analysts, persons reporting to research analysts and their relatives may have financial interests and material conflict of interest in the subject company.
EISEC, Research analysts, persons reporting to research analysts and their relatives may have actual/beneficial ownership of 1% or more in the subject company’s securities, at the month immediately preceding the date of publication of this research report.
Past performance is not a guide for future performance, future returns are not guaranteed and investors may suffer losses which may exceed their original capital.
The securities described herein may not be eligible for sale in all jurisdictions or to all categories of investors. The countries in which the companies mentioned in this report are organized may have restrictions on investments, voting rights or dealings in securities by nationals of other countries. Distributing/taking/sending/dispatching/transmitting this document in certain foreign jurisdictions may be restricted by law, and persons into whose possession this document comes should inform themselves about, and observe any such restrictions. Failure to comply with this restriction may constitute a violation of any foreign jurisdiction laws.
The user should consult their own advisors to determine the merits and risks of investment and also read the Risk Disclosure Documents for Capital Markets and Derivative Segments as prescribed by Securities and Exchange Board of India before investing in the Indian Markets.
Suprajit Engineering Ltd.
Source: ACEEquity, EISEC Research
Analyst holding in stock: NO
Key to EISEC Investment Rankings
Buy: Upside by>15%, Accumulate: Upside by 5%to 15%, Hold: Downside/Upside by -5% to +5%, Reduce: Downside by 5% to 15%, Sell: Downside by>15%
East India Securities Ltd. (http://www.eisec.com/)
Office: - 201, Garnet Palladium, Pandit Motilal Nehru Marg, Panch Bawadi, Behind Express Zone, Malad East, Mumbai – 400097
0
100
200
300
400
Feb-15 Feb-16 Feb-17 Feb-18 Feb-19 Feb-20
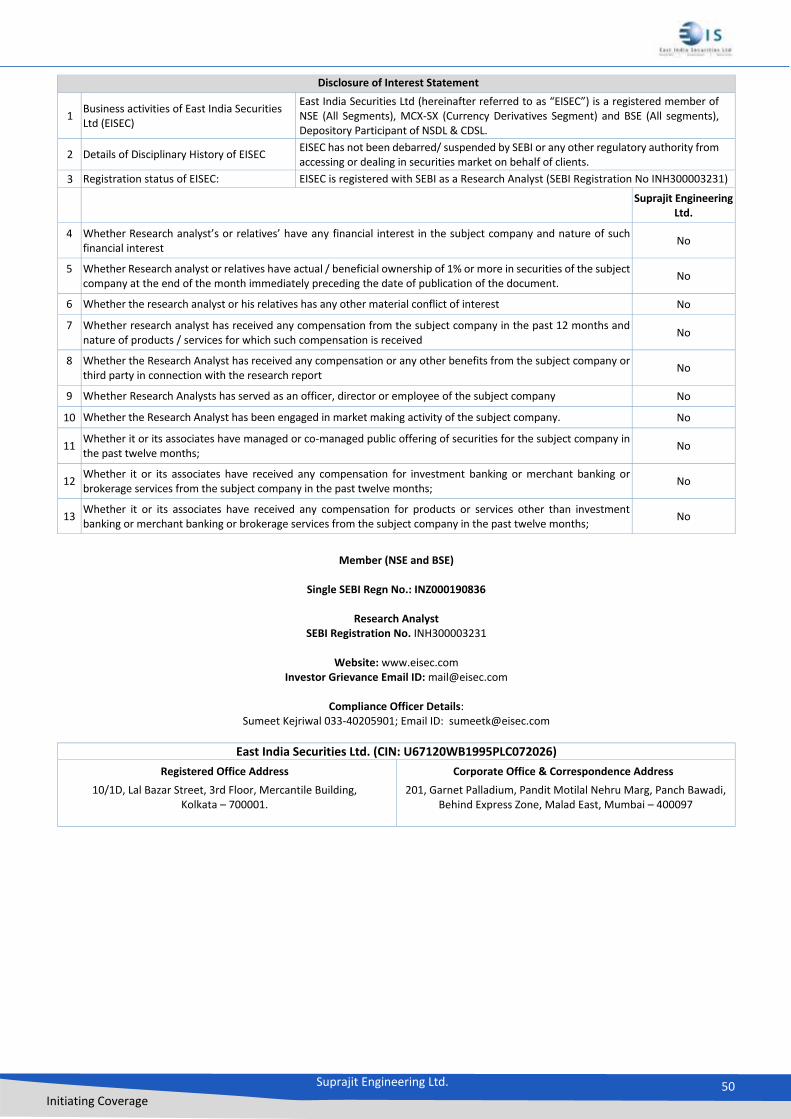
Suprajit Engineering Ltd. 50
Initiating Coverage
Disclosure of Interest Statement
1 Business activities of East India Securities Ltd (EISEC)
East India Securities Ltd (hereinafter referred to as “EISEC”) is a registered member of NSE (All Segments), MCX-SX (Currency Derivatives Segment) and BSE (All segments), Depository Participant of NSDL & CDSL.
2 Details of Disciplinary History of EISEC EISEC has not been debarred/ suspended by SEBI or any other regulatory authority from accessing or dealing in securities market on behalf of clients.
3 Registration status of EISEC: EISEC is registered with SEBI as a Research Analyst (SEBI Registration No INH300003231)
Suprajit Engineering Ltd.
4 Whether Research analyst’s or relatives’ have any financial interest in the subject company and nature of such financial interest
No
5 Whether Research analyst or relatives have actual / beneficial ownership of 1% or more in securities of the subject company at the end of the month immediately preceding the date of publication of the document.
No
6 Whether the research analyst or his relatives has any other material conflict of interest No
7 Whether research analyst has received any compensation from the subject company in the past 12 months and nature of products / services for which such compensation is received
No
8 Whether the Research Analyst has received any compensation or any other benefits from the subject company or third party in connection with the research report
No
9 Whether Research Analysts has served as an officer, director or employee of the subject company No
10 Whether the Research Analyst has been engaged in market making activity of the subject company. No
11 Whether it or its associates have managed or co-managed public offering of securities for the subject company in the past twelve months;
No
12 Whether it or its associates have received any compensation for investment banking or merchant banking or brokerage services from the subject company in the past twelve months;
No
13 Whether it or its associates have received any compensation for products or services other than investment banking or merchant banking or brokerage services from the subject company in the past twelve months;
No
Member (NSE and BSE)
Single SEBI Regn No.: INZ000190836
Research Analyst
SEBI Registration No. INH300003231
Website: www.eisec.com Investor Grievance Email ID: [email protected]
Compliance Officer Details:
Sumeet Kejriwal 033-40205901; Email ID: [email protected]
East India Securities Ltd. (CIN: U67120WB1995PLC072026)
Registered Office Address
10/1D, Lal Bazar Street, 3rd Floor, Mercantile Building, Kolkata – 700001.
Corporate Office & Correspondence Address
201, Garnet Palladium, Pandit Motilal Nehru Marg, Panch Bawadi, Behind Express Zone, Malad East, Mumbai – 400097