suppression of v 6 integrin expression by …10.1038...1 suppression of avb6 integrin expression by...
TRANSCRIPT
1
Suppression of avb6 Integrin Expression by Polymicrobial Oral Biofilms in Gingival Epithelial Cells Jiarui Bi, Leeni Koivisto, Aihui Pang, Ming Li, Guoqiao Jiang, Saljae Aurora, Zhejun Wang, Gethin R. Owen, Jiayin Dai, Ya Shen, Daniel Grenier, Markus Haapasalo, Lari Häkkinen, Hannu Larjava
Supplementary information
Methods RT-qPCR on mouse gingiva
The gingiva around molar teeth was excised from the maxilla of 2-month-old WT and Itgb6-/- mice under a surgical microscope. Gingival tissues from three mice were pooled together as one biological replicate. The samples were ground over dry ice using a mortar and pestle, followed by extraction of total RNA using NucleoSpin RNA II kit and RT-qPCR to determine the differences in gene expression between WT and Itgb6-/- mice. Total of 18 WT and Itgb6-/- mice were used in the study per genotype (six biological replicates). PCR primer sequences are listed in Supplementary Table S2.
Immunohistochemistry of mouse gingiva
The gingiva around molar teeth was excised from the maxilla of 9-month-old WT and Itgb6-/- mice under a surgical microscope and processed for frozen sections and immunohistochemistry as described for the human tissue. Primary antibodies used for immunostaining were: b1 integrin (rat; mAb13; a kind gift from Dr. Kenneth Yamada, National Institutes of Health, Bethesda, MD, USA), a6 integrin (rat; mAb1378; Chemicon) and avb6 integrin (rabbit; b6B1). Primary antibodies were omitted from the negative control stainings. To highlight tissue structure, comparable sections were stained with hematoxylin and eosin, as described.
Culture of mouse macrophages
The murine macrophage-like cell line RAW 264.7 (ATCC) was used for confirming receptor agonist activity. Cells were cultured as periviously decribed1 and seeded into plates at 3×10⁴ cells/cm2 for 48 h in their complete growth medium for the experiments. The cells were then rinsed once with PBS, changed to FBS-free medium and treated with receptor agonists or left untreated for 24 h. RNA isolation and RT-qPCR were performed as described.
P. gingivalis and T. denticola bacterial extracts
P. gingivalis (ATCC 33277) and T. denticola (ATCC 35405) were cultured as previously described2. The bacterial extracts were produced and heat-or proteinase K-treated as described for biofilm. The bacterial extracts were tested at concentrations 3-60 µg protein/ml and used in the experiments at concentration of 30 µg protein/ml (maximal efficacy without cytotoxity).

2
Genomic PCR of bacterial biofilms
Genomic PCR was used to determine the presence of total oral mycoplasma in the bacterial biofilms and to estimate the relative proportion of these bacteria in them using mycoplasma-specific and universal bacterial primers for 16S ribosomal RNA. The bacterial samples were boiled for 15 min. PCR amplification was performed with the CFX96 system (Bio-Rad; program for Mycoplasma gene: 5 min at 95°C, followed by 40 cycles of 30 s at 94°C, 1 min at 55°C and 1 min at 72°C; program for universal bacterial gene: 5 min at 95°C, followed by 20 cycles of 30 s at 94°C, 1 min at 59°C and 1 min at 72°C). The sequences of Mycoplasma primers were: Forward: 5'-ACA CCA TGG GAG CT GGT AAT-3’; Reverse: 5'-CTT CTT CGA CTT TCA GA-CCC AAG -3’. The universal bacterial primer sequences were: Forward: 5'-CAD ACT CCT ACG GGA GGC-3’; Reverse: 5'-ATC CTG TTT GMT MCC CVC RC-3’ (M=A/C, R=A/G, V=A/G/C). The PCR products were resolved by agarose gel electrophoresis (1% gel) and the images captured under UV light. ImageJ software was used for the quantification of blots.
References 1 Barth, K. A., Waterfield, J. D. & Brunette, D. M. The effect of surface roughness on RAW
264.7 macrophage phenotype. J Biomed Mater Res A 101, 2679-2688, doi:10.1002/jbm.a.34562 (2013).
2 Bodet, C., Chandad, F. & Grenier, D. Inflammatory responses of a macrophage/epithelial cell co-culture model to mono and mixed infections with Porphyromonas gingivalis, Treponema denticola, and Tannerella forsythia. Microbes Infect 8, 27-35, doi:10.1016/j.micinf.2005.05.015 (2006).
Supplementary Figure S1. Integrin and IL-1b gene expression in WT and Itgb6-/- mouse
gingiva
A-D, RNA from WT and Itgb6-/- mouse gingiva was extracted and analyzed for Itgav (A), Itgb1 (B), Itgb4 (C) and Il1b (D) expression by RT-qPCR. Gingival tissue from three animals was pooled as one biological replicate. Mean ± SEM of total of six replicates (18 mice) per group is presented. *, p<0.05.

3
Supplementary Figure S2. Immunolocalization of integrins in WT and Itgb6-/- mouse gingiva
Immunolocalization of b1 (A, G), a6 (B, H) and avb6 integrins (E, K) in WT (E-F) and Itgb6-/- (G-L) mouse gingiva. Species-appropriate negative controls were performed with secondary antibodies only: anti-rat (C, I) and anti-rabbit (F, L). Comparable hematoxylin-eosin-stained sections of WT (D) and Itgb6-/- (J) mouse gingiva highlight the tissue structure. OE, Oral epithelium; CT, connective tissue; JE, junctional epithelium; PE, pocket epithelium. Arrows point the most coronal and apical aspects of the JE/PE. Bar is 50 µm.
4
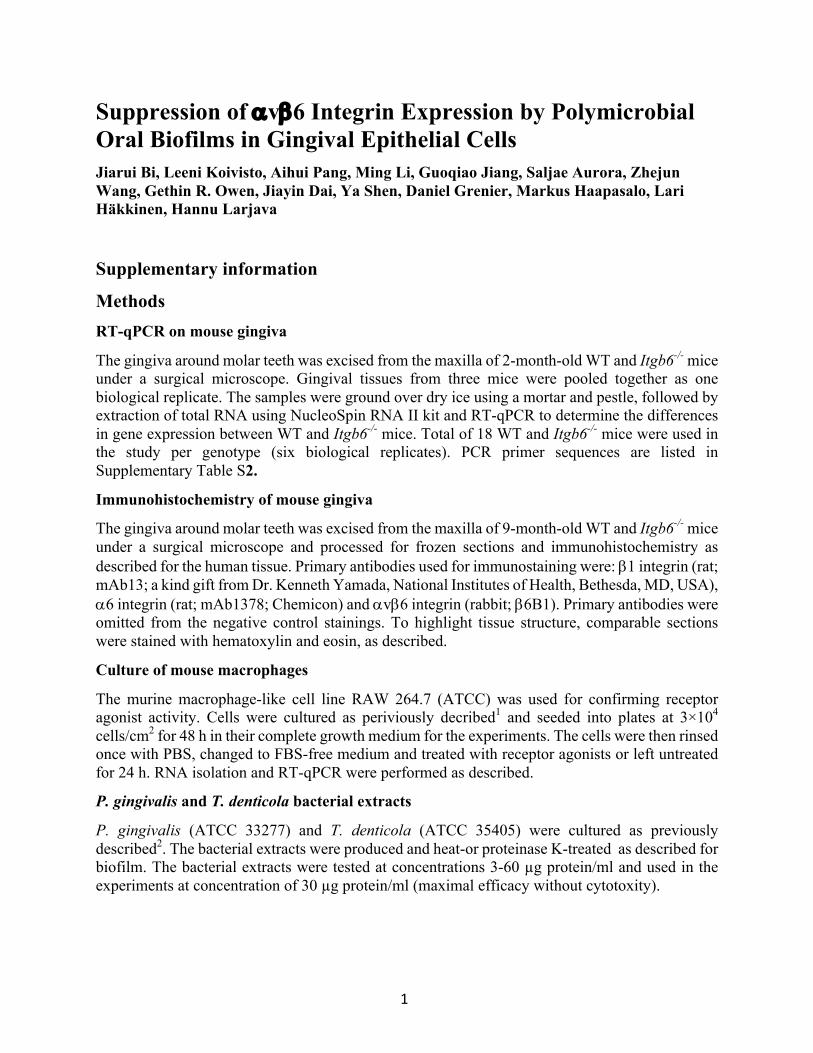
Supplementary Figure S3. Structure of oral bacterial biofilm from three donors.
A-F, The multi-species oral bacterial biofilms from three different donors were cultured for three weeks for SEM micrographs. (A-C) scale bar = 20 µm; (D-F) scale bar = 200 µm. D-F, Cross section (cs) SEM of oral bacterial biofilms reflects the thickness of biofilms of A-C, respectively.
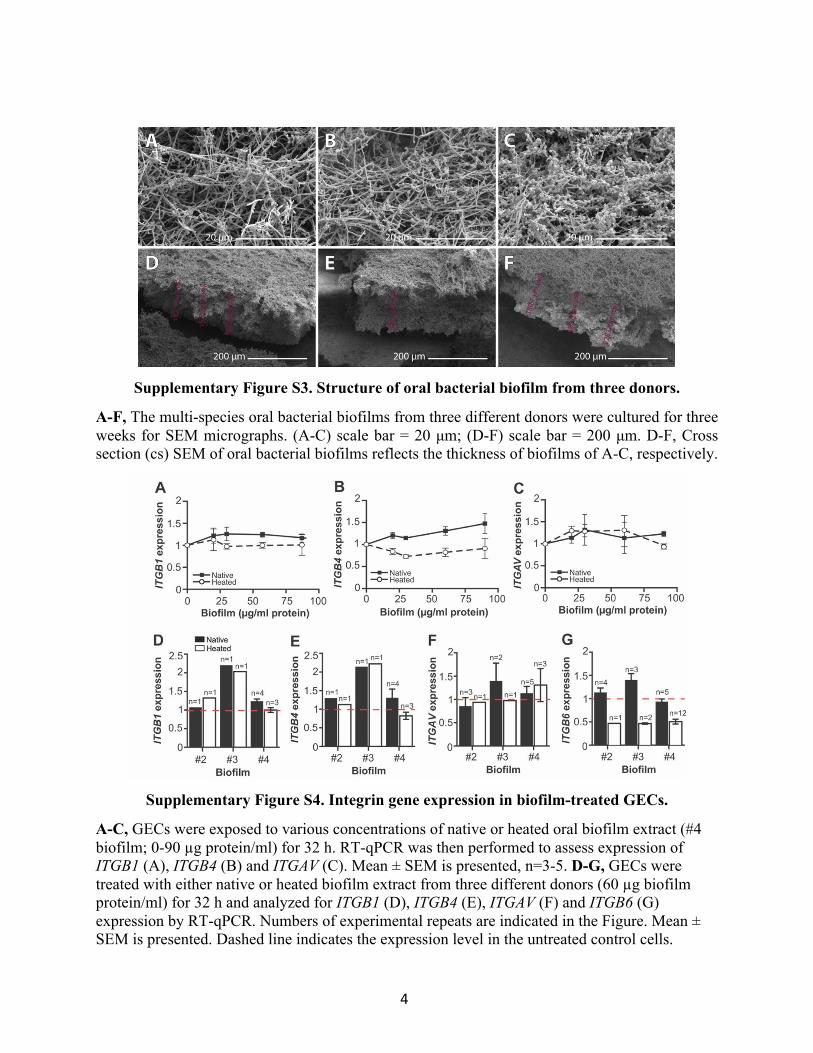
Supplementary Figure S4. Integrin gene expression in biofilm-treated GECs.
A-C, GECs were exposed to various concentrations of native or heated oral biofilm extract (#4 biofilm; 0-90 µg protein/ml) for 32 h. RT-qPCR was then performed to assess expression of ITGB1 (A), ITGB4 (B) and ITGAV (C). Mean ± SEM is presented, n=3-5. D-G, GECs were treated with either native or heated biofilm extract from three different donors (60 µg biofilm protein/ml) for 32 h and analyzed for ITGB1 (D), ITGB4 (E), ITGAV (F) and ITGB6 (G) expression by RT-qPCR. Numbers of experimental repeats are indicated in the Figure. Mean ± SEM is presented. Dashed line indicates the expression level in the untreated control cells.
5
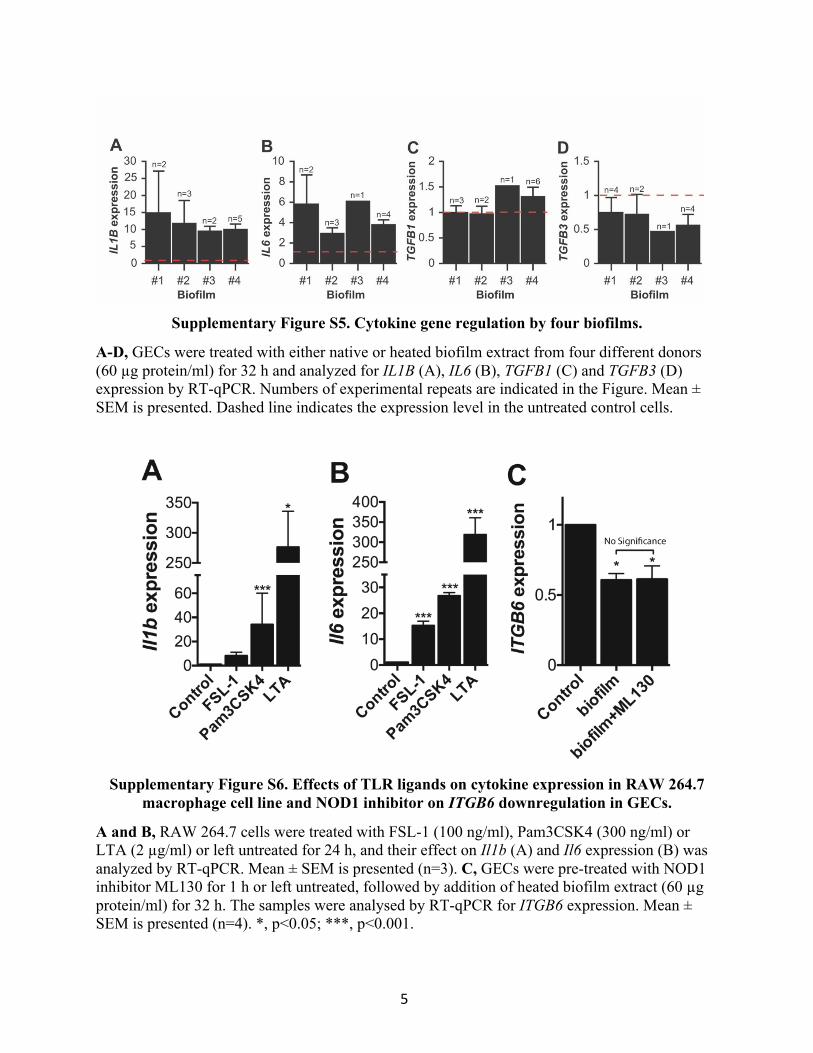
Supplementary Figure S5. Cytokine gene regulation by four biofilms.
A-D, GECs were treated with either native or heated biofilm extract from four different donors (60 µg protein/ml) for 32 h and analyzed for IL1B (A), IL6 (B), TGFB1 (C) and TGFB3 (D) expression by RT-qPCR. Numbers of experimental repeats are indicated in the Figure. Mean ± SEM is presented. Dashed line indicates the expression level in the untreated control cells.
Supplementary Figure S6. Effects of TLR ligands on cytokine expression in RAW 264.7
macrophage cell line and NOD1 inhibitor on ITGB6 downregulation in GECs.
A and B, RAW 264.7 cells were treated with FSL-1 (100 ng/ml), Pam3CSK4 (300 ng/ml) or LTA (2 µg/ml) or left untreated for 24 h, and their effect on Il1b (A) and Il6 expression (B) was analyzed by RT-qPCR. Mean ± SEM is presented (n=3). C, GECs were pre-treated with NOD1 inhibitor ML130 for 1 h or left untreated, followed by addition of heated biofilm extract (60 µg protein/ml) for 32 h. The samples were analysed by RT-qPCR for ITGB6 expression. Mean ± SEM is presented (n=4). *, p<0.05; ***, p<0.001.
6
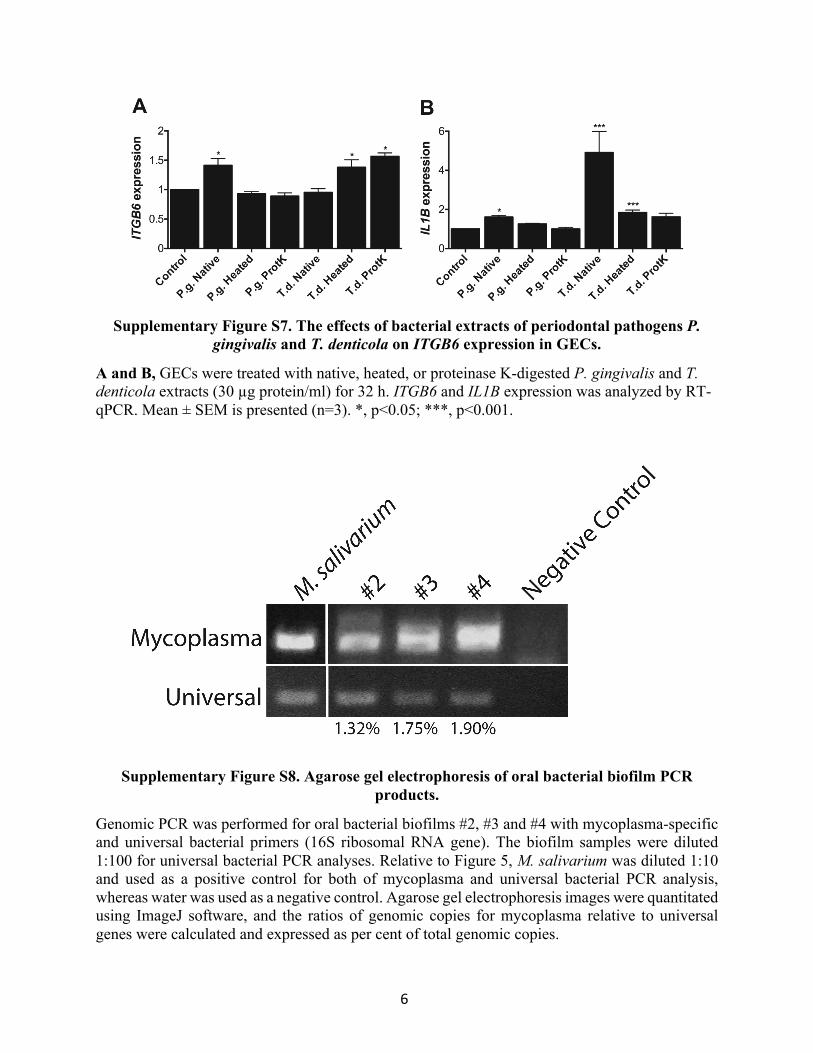
Supplementary Figure S7. The effects of bacterial extracts of periodontal pathogens P.
gingivalis and T. denticola on ITGB6 expression in GECs.
A and B, GECs were treated with native, heated, or proteinase K-digested P. gingivalis and T. denticola extracts (30 µg protein/ml) for 32 h. ITGB6 and IL1B expression was analyzed by RT-qPCR. Mean ± SEM is presented (n=3). *, p<0.05; ***, p<0.001.
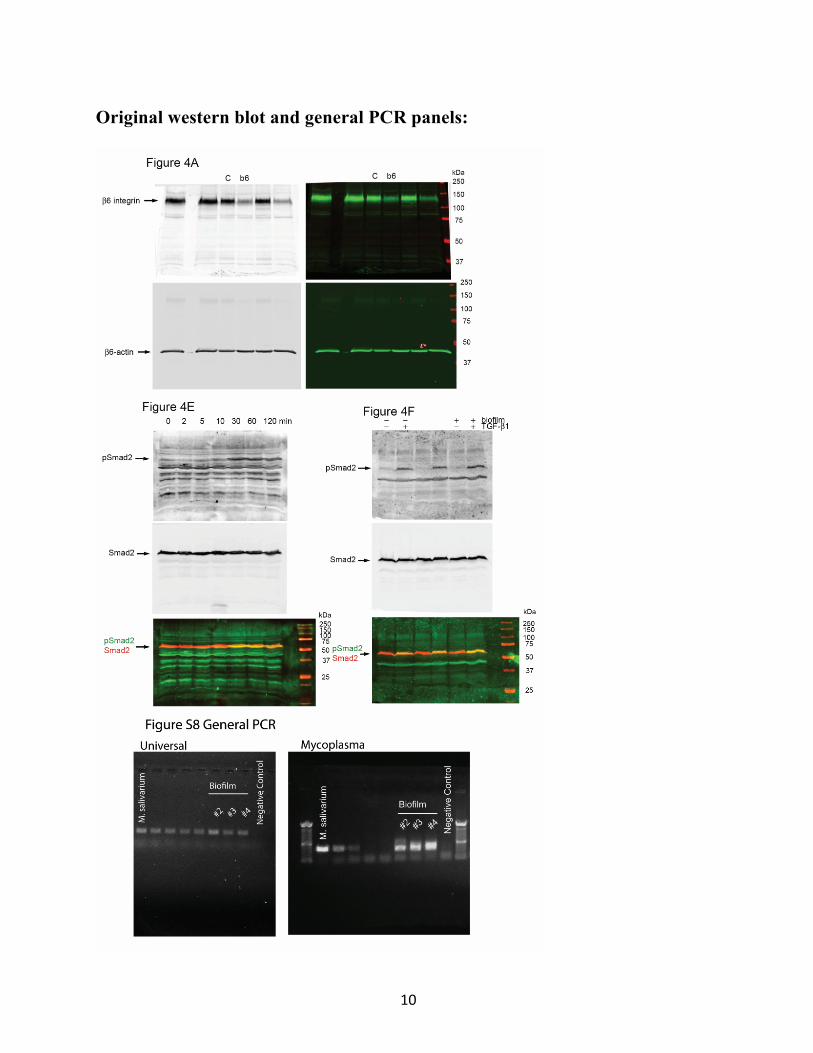
Supplementary Figure S8. Agarose gel electrophoresis of oral bacterial biofilm PCR
products.
Genomic PCR was performed for oral bacterial biofilms #2, #3 and #4 with mycoplasma-specific and universal bacterial primers (16S ribosomal RNA gene). The biofilm samples were diluted 1:100 for universal bacterial PCR analyses. Relative to Figure 5, M. salivarium was diluted 1:10 and used as a positive control for both of mycoplasma and universal bacterial PCR analysis, whereas water was used as a negative control. Agarose gel electrophoresis images were quantitated using ImageJ software, and the ratios of genomic copies for mycoplasma relative to universal genes were calculated and expressed as per cent of total genomic copies.
7
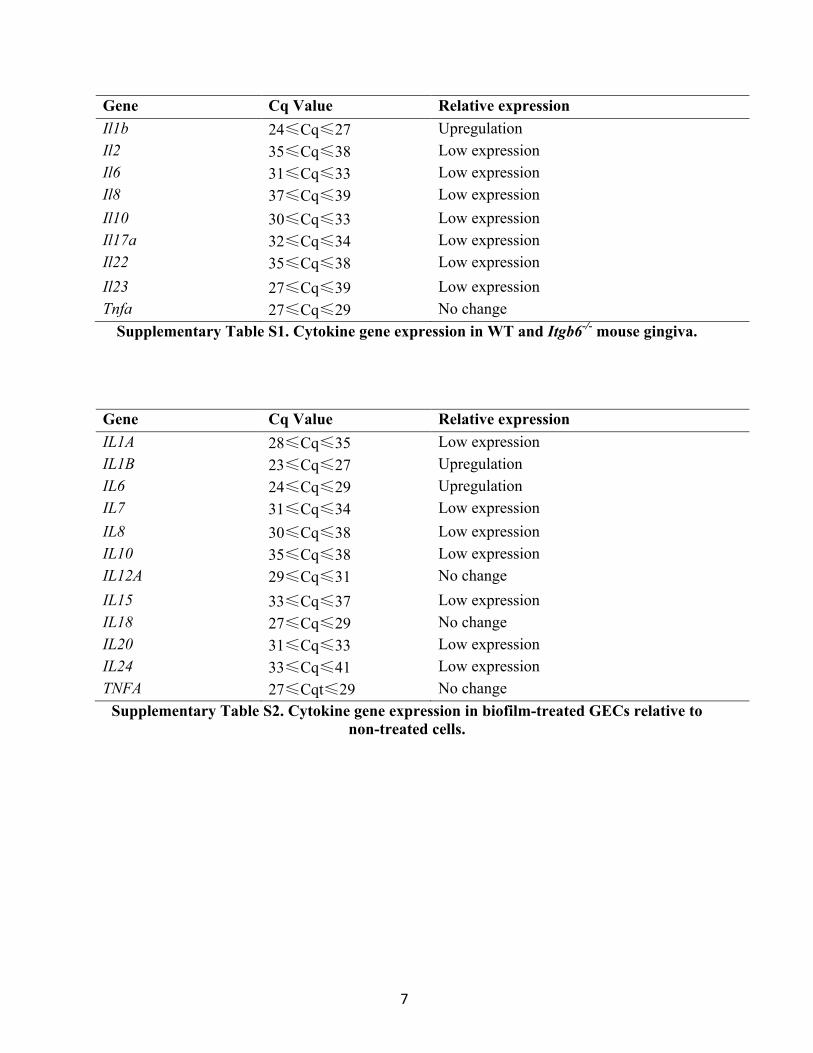
Gene Cq Value Relative expression Il1b 24�Cq�27 Upregulation Il2 35�Cq�38 Low expression Il6 31�Cq�33 Low expression Il8 37�Cq�39 Low expression Il10 30�Cq�33 Low expression Il17a 32�Cq�34 Low expression Il22 35�Cq�38 Low expression Il23 27�Cq�39 Low expression Tnfa 27�Cq�29 No change
Supplementary Table S1. Cytokine gene expression in WT and Itgb6-/- mouse gingiva.
Gene Cq Value Relative expression IL1A 28�Cq�35 Low expression IL1B 23�Cq�27 Upregulation IL6 24�Cq�29 Upregulation IL7 31�Cq�34 Low expression IL8 30�Cq�38 Low expression IL10 35�Cq�38 Low expression IL12A 29�Cq�31 No change IL15 33�Cq�37 Low expression IL18 27�Cq�29 No change IL20 31�Cq�33 Low expression IL24 33�Cq�41 Low expression TNFA 27�Cqt�29 No change
Supplementary Table S2. Cytokine gene expression in biofilm-treated GECs relative to non-treated cells.
8
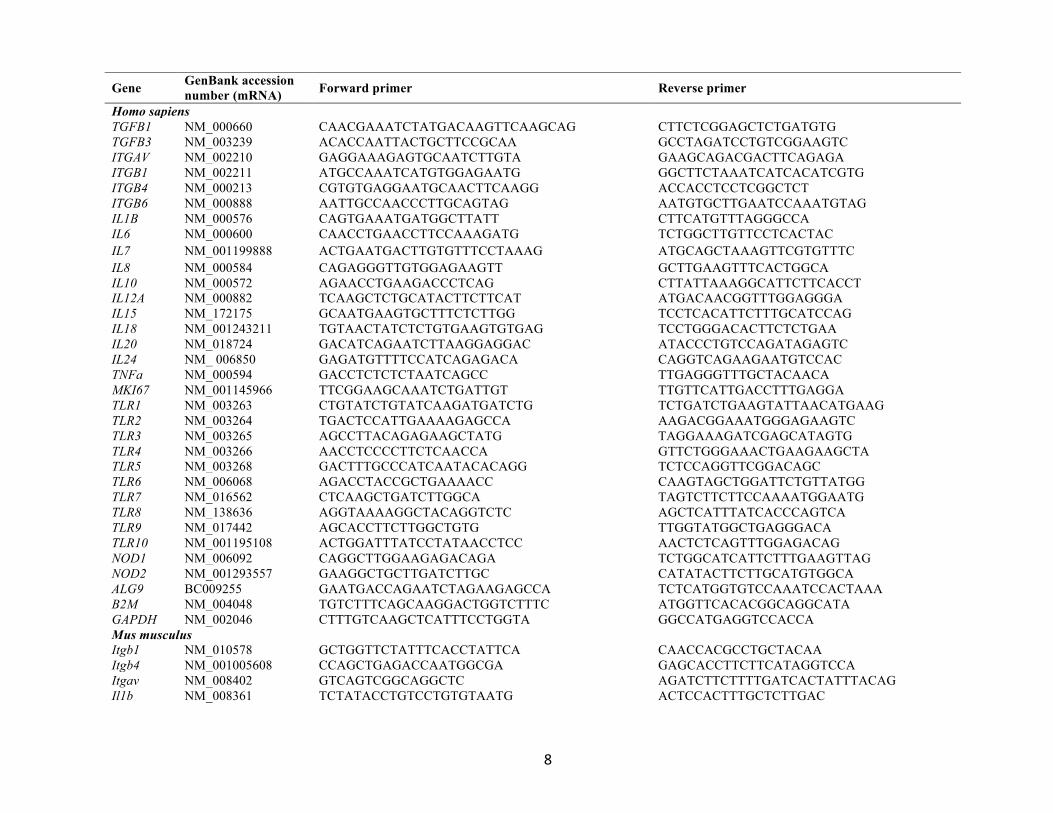
Gene GenBank accession number (mRNA) Forward primer Reverse primer
Homo sapiens TGFB1 NM_000660 CAACGAAATCTATGACAAGTTCAAGCAG CTTCTCGGAGCTCTGATGTG TGFB3 NM_003239 ACACCAATTACTGCTTCCGCAA GCCTAGATCCTGTCGGAAGTC ITGAV NM_002210 GAGGAAAGAGTGCAATCTTGTA GAAGCAGACGACTTCAGAGA ITGB1 NM_002211 ATGCCAAATCATGTGGAGAATG GGCTTCTAAATCATCACATCGTG ITGB4 NM_000213 CGTGTGAGGAATGCAACTTCAAGG ACCACCTCCTCGGCTCT ITGB6 NM_000888 AATTGCCAACCCTTGCAGTAG AATGTGCTTGAATCCAAATGTAG IL1B NM_000576 CAGTGAAATGATGGCTTATT CTTCATGTTTAGGGCCA IL6 NM_000600 CAACCTGAACCTTCCAAAGATG TCTGGCTTGTTCCTCACTAC IL7 NM_001199888 ACTGAATGACTTGTGTTTCCTAAAG ATGCAGCTAAAGTTCGTGTTTC IL8 NM_000584 CAGAGGGTTGTGGAGAAGTT GCTTGAAGTTTCACTGGCA IL10 NM_000572 AGAACCTGAAGACCCTCAG CTTATTAAAGGCATTCTTCACCT IL12A NM_000882 TCAAGCTCTGCATACTTCTTCAT ATGACAACGGTTTGGAGGGA IL15 NM_172175 GCAATGAAGTGCTTTCTCTTGG TCCTCACATTCTTTGCATCCAG IL18 NM_001243211 TGTAACTATCTCTGTGAAGTGTGAG TCCTGGGACACTTCTCTGAA IL20 NM_018724 GACATCAGAATCTTAAGGAGGAC ATACCCTGTCCAGATAGAGTC IL24 NM_ 006850 GAGATGTTTTCCATCAGAGACA CAGGTCAGAAGAATGTCCAC TNFa NM_000594 GACCTCTCTCTAATCAGCC TTGAGGGTTTGCTACAACA MKI67 NM_001145966 TTCGGAAGCAAATCTGATTGT TTGTTCATTGACCTTTGAGGA TLR1 NM_003263 CTGTATCTGTATCAAGATGATCTG TCTGATCTGAAGTATTAACATGAAG TLR2 NM_003264 TGACTCCATTGAAAAGAGCCA AAGACGGAAATGGGAGAAGTC TLR3 NM_003265 AGCCTTACAGAGAAGCTATG TAGGAAAGATCGAGCATAGTG TLR4 NM_003266 AACCTCCCCTTCTCAACCA GTTCTGGGAAACTGAAGAAGCTA TLR5 NM_003268 GACTTTGCCCATCAATACACAGG TCTCCAGGTTCGGACAGC TLR6 NM_006068 AGACCTACCGCTGAAAACC CAAGTAGCTGGATTCTGTTATGG TLR7 NM_016562 CTCAAGCTGATCTTGGCA TAGTCTTCTTCCAAAATGGAATG TLR8 NM_138636 AGGTAAAAGGCTACAGGTCTC AGCTCATTTATCACCCAGTCA TLR9 NM_017442 AGCACCTTCTTGGCTGTG TTGGTATGGCTGAGGGACA TLR10 NM_001195108 ACTGGATTTATCCTATAACCTCC AACTCTCAGTTTGGAGACAG NOD1 NM_006092 CAGGCTTGGAAGAGACAGA TCTGGCATCATTCTTTGAAGTTAG NOD2 NM_001293557 GAAGGCTGCTTGATCTTGC CATATACTTCTTGCATGTGGCA ALG9 BC009255 GAATGACCAGAATCTAGAAGAGCCA TCTCATGGTGTCCAAATCCACTAAA B2M NM_004048 TGTCTTTCAGCAAGGACTGGTCTTTC ATGGTTCACACGGCAGGCATA GAPDH NM_002046 CTTTGTCAAGCTCATTTCCTGGTA GGCCATGAGGTCCACCA Mus musculus Itgb1 NM_010578 GCTGGTTCTATTTCACCTATTCA CAACCACGCCTGCTACAA Itgb4 NM_001005608 CCAGCTGAGACCAATGGCGA GAGCACCTTCTTCATAGGTCCA Itgav NM_008402 GTCAGTCGGCAGGCTC AGATCTTCTTTTGATCACTATTTACAG Il1b NM_008361 TCTATACCTGTCCTGTGTAATG ACTCCACTTTGCTCTTGAC
9
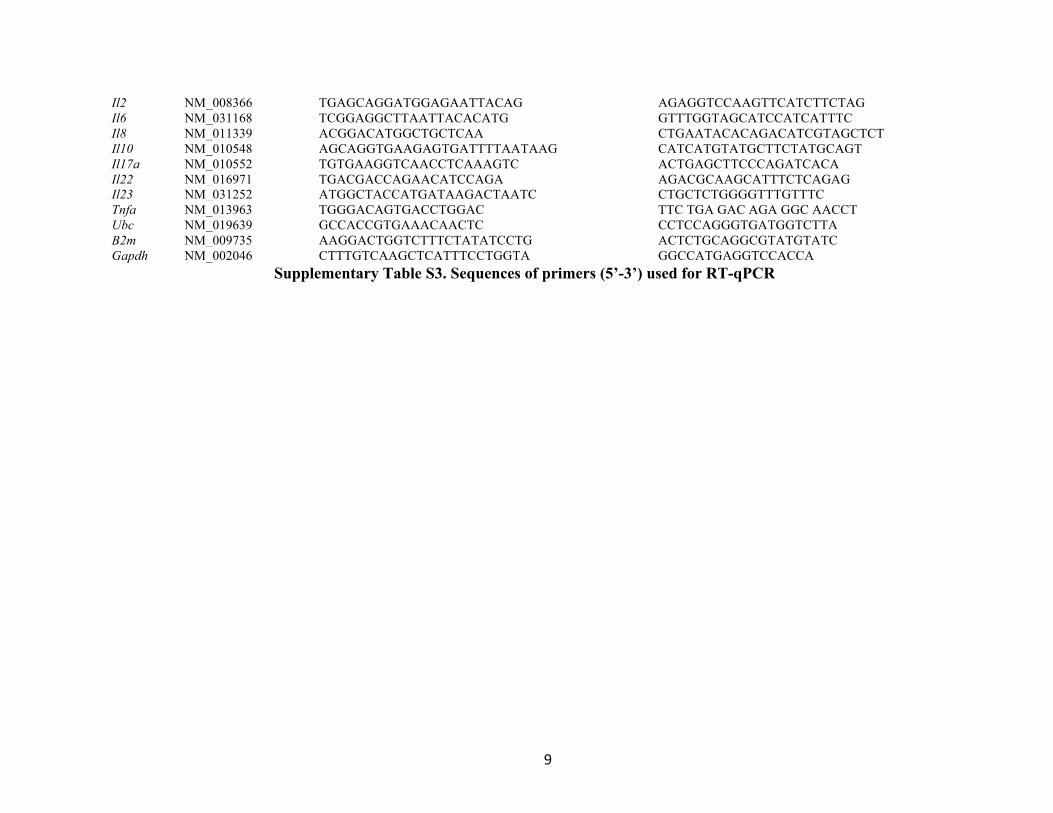
Supplementary Table S3. Sequences of primers (5’-3’) used for RT-qPCR
Il2 NM_008366 TGAGCAGGATGGAGAATTACAG AGAGGTCCAAGTTCATCTTCTAG Il6 NM_031168 TCGGAGGCTTAATTACACATG GTTTGGTAGCATCCATCATTTC Il8 NM_011339 ACGGACATGGCTGCTCAA CTGAATACACAGACATCGTAGCTCT Il10 NM_010548 AGCAGGTGAAGAGTGATTTTAATAAG CATCATGTATGCTTCTATGCAGT Il17a NM_010552 TGTGAAGGTCAACCTCAAAGTC ACTGAGCTTCCCAGATCACA Il22 NM_016971 TGACGACCAGAACATCCAGA AGACGCAAGCATTTCTCAGAG Il23 NM_031252 ATGGCTACCATGATAAGACTAATC CTGCTCTGGGGTTTGTTTC Tnfa NM_013963 TGGGACAGTGACCTGGAC TTC TGA GAC AGA GGC AACCT Ubc NM_019639 GCCACCGTGAAACAACTC CCTCCAGGGTGATGGTCTTA B2m NM_009735 AAGGACTGGTCTTTCTATATCCTG ACTCTGCAGGCGTATGTATC Gapdh NM_002046 CTTTGTCAAGCTCATTTCCTGGTA GGCCATGAGGTCCACCA
10
Original western blot and general PCR panels: