supporting u.s. trade and growth
TRANSCRIPT
S U P P O R T I N G U . S . T R A D E A N D G R O W T HT H R O U G H F U N D I N G E X P O R T S
A N N U A L
R E P O R T
2 0 1 6
P R I V A T E
E X P O R T
F U N D I N G
C O R P O R A T I O N

P R I V A T E E X P O R T F U N D I N G C O R P O R A T I O NA N N U A L R E P O R T 2 0 1 6
CHAIRMAN’S LETTER 2
BUSINESS YEAR IN REVIEW 4
SUMMARY OF PEFCO’S BUSINESS 8
PEFCO’S RELATIONSHIP WITH EX-IM BANK 16
MANAGEMENT’S DISCUSSION & ANALYSIS 21
INDEPENDENT AUDITOR’S REPORT 27
FINANCIAL STATEMENTS 29
MANAGEMENT’S REPORT ON INTERNAL CONTROL OVER
FINANCIAL REPORTING 53
FIVE YEAR FINANCIAL DATA 54
INDEPENDENT AUDIT FEES 55
BOARD OF DIRECTORS 56
ADVISORY BOARD 57
OFFICERS 58
PEFCO SHAREOWNERS 59
ADDITIONAL INFORMATION 60
T A B L E O F C O N T E N T S

H E R I T A G E O F S U C C E S S
F O U N D E D B Y A S S U R E D F I N A N C I N G A N D S U P P O R T I N G A M E R I C A N E X P O R T S

T I M O T H Y C . D U N N E C H A I R M A N , P R E S I D E N T & C H I E F E X E C U T I V E O F F I C E R
T O O U R S H A R E O W N E R S :
W E L C O M E T O T H E 2 0 1 6 P E F C O A N N U A L R E P O R T .
T H E O P E R A T I N G E N V I R O N M E N T O V E R F I S C A L Y E A R
2 0 1 6 W A S C H A L L E N G I N G D U E T O D E V E L O P M E N T S
A T U . S . E X - I M B A N K .
P E F C O A N N U A L R E P O R T 2 0 1 6
2
C H A I R M A N ’ S L E T T E R

“ O V E R F I S C A L Y E A R 2 0 1 6 , T H E P E F C O T E A M C O N T I N U E D
T O E N G A G E O U R C U S T O M E R S ( E X P O R T E R S , B A N K S ,
T R A D E F I N A N C E F I R M S A N D B O R R O W E R S ) T O
U N D E R S T A N D N E A R T E R M F I N A N C I N G P L A N S A N D
L O N G E R T E R M O U T L O O K O N F U N D I N G R E Q U I R E M E N T S . ”
Although the reauthorization of U.S. Ex-Im Bank was passed
by Congress and signed into law on December 4, 2015, the
Senate did not act on confirming pending nominations to
the Ex-Im Bank Board of Directors, resulting in a lack of a
voting quorum for approving new loans with amounts in
excess of $10 million. The result was a significant reduction
in lending transactions approved during the fiscal year, and
a build-up of new lending transactions awaiting approval.
It is important to note that the role of PEFCO in financing
U.S. exports is to provide funding for guaranteed loans
under the loan programs of U.S. Ex-Im Bank as an
alternative to other sources of liquidity. PEFCO is involved
in a guaranteed loan transaction only after the transaction
is proposed, reviewed and approved by U.S. Ex-Im Bank
based on information provided by the borrower, the
exporter and the financial institution acting in the role
as the deal arranger. PEFCO plays a similar role in loan
transactions backed by OPIC.
For PEFCO, the developments at U.S. Ex-Im Bank have
resulted in a significant reduction in loan commitments.
We committed to 10 loan transactions for a total amount
of $292 million, with the bulk of the volume from the
purchase of two long term guaranteed loan transactions.
The modest amount of medium term guaranteed loans
in fiscal year 2016 follows a multi-year trend of declining
volume in this form of buyer financing.
The financial results for fiscal year 2016 are lower than the
prior year, with net income resulting in a net loss at ($0.6)
million versus $2.2 million for fiscal year 2015. Due to the
financial results, the Board did not declare a dividend for
fiscal year 2016.
Over fiscal year 2016, the PEFCO team continued to
engage our customers (exporters, banks, trade finance
firms and borrowers) to understand near term financing
plans and longer term outlook on funding requirements.
In addition, the PEFCO team completed a technology
upgrade on an accelerated time schedule to improve
operational flexibility and efficiency.
This past year also saw the departure of two valued
board members. Karen Peetz has served on the PEFCO
Board since 2010, and Phil Bleser has served since 2011.
I appreciate their insights and support over the years in
furthering the PEFCO mission. In addition, I welcome the
opportunity to work in the coming fiscal year with our two
new board members: Andrew O’Brien of JP Morgan and
Samir Pandiri of The Bank of New York Mellon.
In meeting the challenges raised this past fiscal year,
I have benefited greatly from the dedication of the
PEFCO Team, the valuable contributions of the PEFCO
Board in guiding the Firm, and for the continuing support
of our loyal shareowners. Our colleagues at U.S. Ex-Im
Bank demonstrate a continued focus on promoting and
financing U.S. exports in partnership with our own efforts.
We welcome the opportunity over the coming fiscal years
to work with, and serve, our clients: the banks and trade
finance firms that serve as partners, the borrowers who
acquire U.S. products and the U.S. exporters who
produce them.
Sincerely yours,
Timothy C. Dunne
Chairman, President & Chief Executive Officer
P E F C O A N N U A L R E P O R T 2 0 1 6
3
C H A I R M A N ’ S L E T T E R

C O M M I T T E D T O G R O W I N G O P P O R T U N I T I E S F O R A M E R I C A ’ S E X P O R T B U S I N E S S E S
4
B U S I N E S S Y E A R I N R E V I E WP E F C O A N N U A L R E P O R T 2 0 1 6

W E A R E F O C U S E D O N T H E G R O W T H O F U . S . E X P O R T S . B Y H E L P I N G O U R C O U N T R Y C O M P E T E , W E O P E N M O R E M A R K E T S A N D C R E A T E M O R E O P P O R T U N I T I E S T O G R O W O U R E C O N O M Y .
5
B U S I N E S S Y E A R I N R E V I E WP E F C O A N N U A L R E P O R T 2 0 1 6
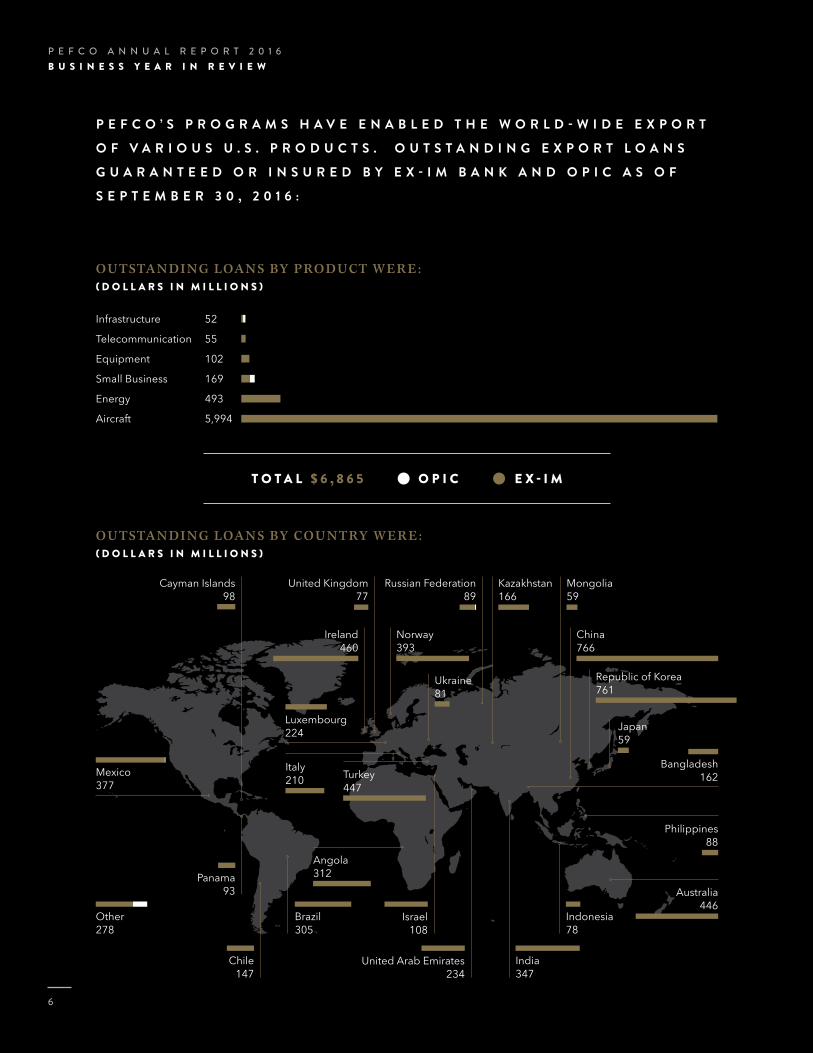
P E F C O ’ S P R O G R A M S H A V E E N A B L E D T H E W O R L D - W I D E E X P O R T
O F V A R I O U S U . S . P R O D U C T S . O U T S T A N D I N G E X P O R T L O A N S
G U A R A N T E E D O R I N S U R E D B Y E X - I M B A N K A N D O P I C A S O F
S E P T E M B E R 3 0 , 2 0 1 6 :
O U TSTAN D I N G LOAN S BY P RO D U CT WE R E : ( D O L L A R S I N M I L L I O N S )
O U TSTAN D I N G LOAN S BY C O U N TRY WE R E : ( D O L L A R S I N M I L L I O N S )
Australia446
Philippines88
Luxembourg224
Italy210 Turkey
447
Angola312
Mexico377
Bangladesh162
Republic of Korea761
Russian Federation89
China766
Kazakhstan166
Indonesia78
India347
Brazil305
Panama93
Chile147
Other278
Norway393
Ukraine81
Ireland460
Infrastructure 52
Telecommunication 55
Equipment 102
Small Business 169
Energy 493
Aircraft 5,994
T O T A L $ 6 , 8 6 5 E X - I MO P I C
United Kingdom77
Cayman Islands98
Japan59
Mongolia59
United Arab Emirates234
Israel108
P E F C O A N N U A L R E P O R T 2 0 1 6
6
B U S I N E S S Y E A R I N R E V I E W

LENDINGPrivate Export Funding Corporation’s (“PEFCO”) new
loan commitments were $292 million in 2016, compared
to new loan commitments of $1,995 million in 2015.
New commitments in the Short and Medium – term Loan
Programs and under our Small Business Programs were
$24 million in 2016 and $108 million in 2015.
EARNINGSPEFCO’s net loss in 2016 was ($0.6) million compared
to net income of $2.2 million in 2015. Net financing
income decreased to $7.8 million in 2016 from $13.5
million in 2015. The average balance of financing assets
increased in 2016 by $155 million and the average
balance of financing liabilities increased by $59 million
in 2016. The average financing revenue interest rate
increased by 0.22% and the average financing expense
interest rate increased by 0.27%.
DIVIDENDPEFCO did not declare a dividend for the fiscal year ending
September 30, 2016. Given the Export-Import Bank of
the United States reauthorization and their Board quorum
issues in fiscal 2016, PEFCO’s Management believes that
preservation of capital is in the best interest of PEFCO and
its shareowners.
No. of Loan Commitments
Products
Amounts (in millions)
2 ENERGY $ 240
2 EQUIPMENT 28
6 SMALL BUSINESS 24
10 $ 292
T H E A V E R A G E B A L A N C E O F F I N A N C I N G A S S E T S
I N C R E A S E D I N 2 0 1 6 B Y $ 1 5 5 M I L L I O N A N D T H E
A V E R A G E B A L A N C E O F F I N A N C I N G L I A B I L I T I E S
I N C R E A S E D B Y $ 5 9 M I L L I O N I N 2 0 1 6 .
P E F C O A N N U A L R E P O R T 2 0 1 6
7
B U S I N E S S Y E A R I N R E V I E W

P E F C O A N N U A L R E P O R T 2 0 1 6S U M M A R Y O F P E F C O ’ S B U S I N E S S
8

P E F C O W A S I N C O R P O R A T E D O N A P R I L 9 , 1 9 7 0 U N D E R D E L A W A R E L A W A N D I S P R I N C I P A L L Y E N G A G E D I N M A K I N G U . S . D O L L A R L O A N S T O F O R E I G N I M P O R T E R S T O F I N A N C E P U R C H A S E S O F G O O D S A N D S E R V I C E S O F U N I T E D S T A T E S M A N U F A C T U R E O R O R I G I N .
PEFCO’s shareowners include most of the major commercial banks involved in financing U.S. exports,
industrial companies involved in exporting U.S. products and services, and financial services companies.
PEFCO was established with the support of the United States Department of the Treasury and the
Export-Import Bank of the United States (“Ex-Im Bank”) to assist in the financing of U.S. exports through
the mobilization of private capital as a supplement to the financing already available through Ex-Im Bank,
commercial banks and other lending institutions. Ex-Im Bank has cooperated in the operation of PEFCO
through various agreements described under “PEFCO’s Relationship with Ex-Im Bank” and in the
“Notes to Consolidated Financial Statements.”
Since all loans made by PEFCO are guaranteed as to the due and punctual payment of principal and
interest by Ex-Im Bank or other U.S. government institutions, such as the Overseas Private Investment
Corporation (“OPIC”), whose obligations are backed by the full faith and credit of th e United States,
PEFCO relies upon this U.S. government support and does not make evaluations of credit risks,
appraisals of economic conditions in foreign countries, or reviews of other factors in making its loans.
P E F C O A N N U A L R E P O R T 2 0 1 6
9
S U M M A R Y O F P E F C O ’ S B U S I N E S S

PEFCO’S LENDING PROGRAMSShort and Medium-term ProgramsThese programs are a dependable source of liquidity
for lenders using Ex-Im Bank Short-term and Medium-
term Guarantee Programs. The lender is always our
customer; PEFCO does not finance exporters directly.
The PEFCO Short and Medium-term Programs include
our Standard Programs and our Special Initiatives.
PEFCO will purchase loans from lenders who have
demonstrated an understanding of, and ability to work with
Ex-Im Bank guarantee programs. Loan amount, exporter
size, borrower’s country, and the underlying item financed
are not factors in our decision to purchase. All loans are
purchased by PEFCO on a non-recourse basis. While
defaulted loans must and will be assigned to Ex-Im Bank
upon its payment of a claim, performing loans are held by
PEFCO in its portfolio to maturity. By selling to PEFCO,
a lender achieves its financial objectives – improved
profitability, removal from the balance sheet of low-yielding
assets, a freeing-up of capacity for borrowers, and reduced
loan portfolio size while maintaining its lending relationship
with the borrower.
Standard ProgramsThe loans must be covered against non-payment under a
guarantee by Ex-Im Bank. PEFCO will only purchase the
amount covered by the Ex-Im Bank guarantee, and not the
uncovered portion.
Short-term Program PEFCO offers to purchase short-term loans under the
Working Capital Facility.
Working Capital Facility: PEFCO purchases participations
in working capital loans guaranteed against non-payment
under an Ex-Im Bank Working Capital Guarantee. PEFCO
will purchase the 90% guaranteed portion of each loan.
The lender funds and retains the risk of the 10% non-
guaranteed portion. PEFCO will purchase transaction
specific or revolving loans, and can include participations
in standby letters of credit included under the Ex-Im
Bank guarantee.
Other features of PEFCO’s Short-term Facilities: • All purchases are governed by a master loan participation
agreement between the lender and PEFCO.
• There is no minimum amount per loan.
• PEFCO will purchase a participation in any short-term
loan or letter of credit structure acceptable to Ex-Im Bank.
• The lender retains responsibility for servicing the loan
and maintaining the Ex-Im Bank guarantee.
2016 PEFCO Programs
Long-term: $ 268 million (4 transactions)
Short/Medium-term: 24 million (6 transactions)
Total: $ 292 million (10 transactions)
F O R L E N D E R S N O T A B L E T O M A K E A
L O A N D I R E C T L Y , P E F C O W I L L “ S T A N D - I N ”
A S D I R E C T L E N D E R O N B E H A L F O F T H E
O R I G I N A T I N G P A R T Y .
P E F C O A N N U A L R E P O R T 2 0 1 6S U M M A R Y O F P E F C O ’ S B U S I N E S S
1 0

Medium-term Program PEFCO offers three medium-term secondary market
facilities and a medium-term direct loan facility.
Guaranteed Note Facility: PEFCO purchases medium-term
loans guaranteed against non-payment under an
Ex-Im Bank medium-term guarantee (“ECP-MGA”).
Interest rates can be floating or fixed. Fixed rates can be
set in advance of the PEFCO purchase date.
Discount Facility: PEFCO offers a special program under
the Guaranteed Note Facility used for guaranteed loans
requiring a fixed interest rate to be set prior to shipment of
the items. Once set, the fixed interest is held constant until
the final disbursement, even when the note has multiple
disbursements over many months, without payment of an
up-front fee.
Guaranteed Lease Facility: PEFCO purchases medium-term
leases guaranteed against non-payment under an
Ex-Im Bank ECP-MGA. Interest rates can be floating or
fixed. Fixed rates can be set in advance of the PEFCO
purchase date.
Stand-in Lender Facility: For lenders not able to make a
loan directly, PEFCO will “stand-in” as direct lender on
behalf of the originating party. The originating lender must
participate in preparing the application to Ex-Im Bank,
acquiring related documentation and maintaining the
borrower relationship.
Other features of PEFCO Medium-term Facilities: • All purchases are governed by a master note purchase
agreement.
• Note amounts range from $100,000 (and possibly smaller)
to $20,000,000.
• PEFCO will fund any note structure acceptable to
Ex-Im Bank.
• PEFCO will purchase single notes or portfolios, new notes
or partially repaid notes, single-disbursement or multiple-
disbursement notes, financial leases.
• Except for the Discount Facility and the Stand-in Lender
Facility, the lender retains responsibility for servicing
the loan and maintaining the Ex-Im Bank guarantee or
policy. PEFCO holds the original note.
• For the Discount Facility and the Stand-in Lender Facility,
PEFCO always assumes responsibility for collecting
payments and maintaining the Ex-Im Bank guarantee.
PEFCO holds the original note.
Special InitiativesAccessible Lender Program: A referral service for exporters.
PEFCO will introduce the exporter to a reliable lender
willing to provide medium-term export financing on a
transactional basis.
Committed Purchase Program: For lenders needing
certainty of access to PEFCO funding over extended
periods. PEFCO provides a written commitment to
purchase an aggregate amount over a specified term
(typically one year) on defined terms and interest rates.
Actual loan commitments are made individually.
Emerging Markets Lender Program: For foreign lenders
with their own Master Guarantee Agreement (“MGA”) that
finance importers in their own and other countries, but
which lack access to competitively-priced U.S. dollars.
Small Lender Program: For small U.S. and foreign lenders
with their own MGA that specialize in financing small
exporters and small-value loans but which fail to meet
PEFCO’s minimum standards for financial strength.
Small Note Program: For exporters of small-value products
or services, PEFCO will work with the exporter’s lender, or
a reliable lender is introduced by PEFCO, to enable the
exporter to obtain financing.
P E F C O A N N U A L R E P O R T 2 0 1 6S U M M A R Y O F P E F C O ’ S B U S I N E S S
1 1
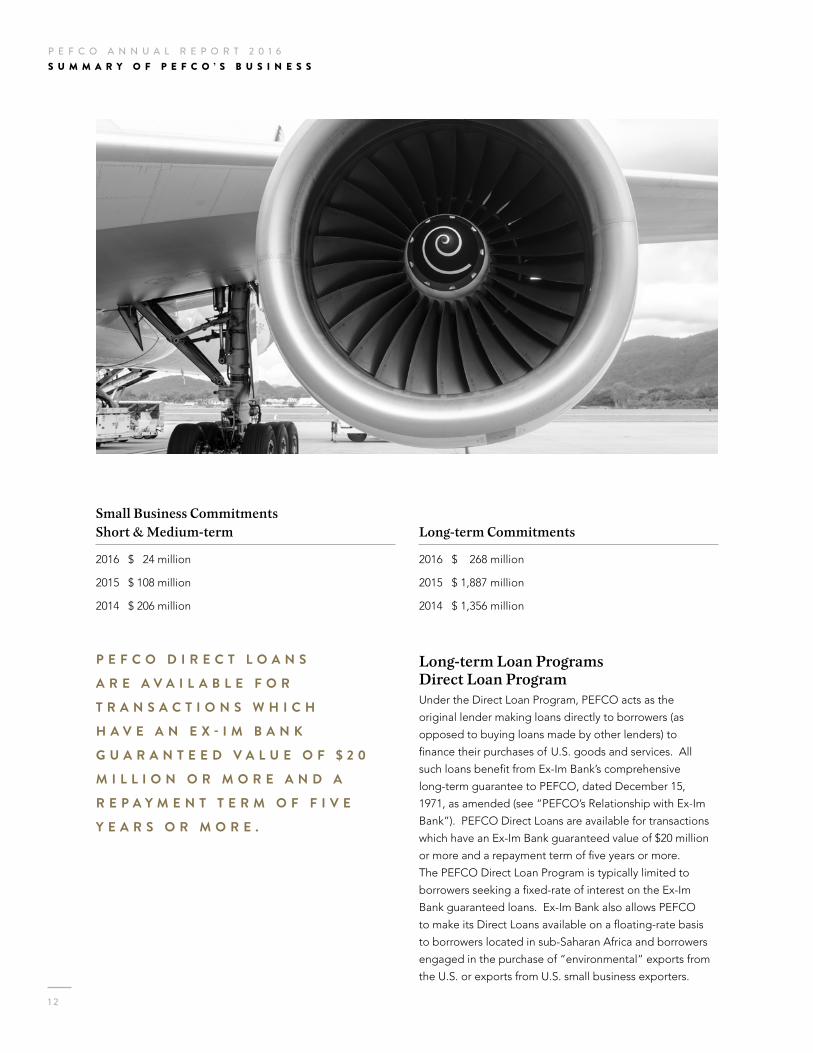
Small Business CommitmentsShort & Medium-term
2016 $ 24 million
2015 $ 108 million
2014 $ 206 million
Long-term Commitments
2016 $ 268 million
2015 $ 1,887 million
2014 $ 1,356 million
P E F C O D I R E C T L O A N S
A R E A V A I L A B L E F O R
T R A N S A C T I O N S W H I C H
H A V E A N E X - I M B A N K
G U A R A N T E E D V A L U E O F $ 2 0
M I L L I O N O R M O R E A N D A
R E P A Y M E N T T E R M O F F I V E
Y E A R S O R M O R E .
Long-term Loan Programs Direct Loan Program Under the Direct Loan Program, PEFCO acts as the
original lender making loans directly to borrowers (as
opposed to buying loans made by other lenders) to
finance their purchases of U.S. goods and services. All
such loans benefit from Ex-Im Bank’s comprehensive
long-term guarantee to PEFCO, dated December 15,
1971, as amended (see “PEFCO’s Relationship with Ex-Im
Bank”). PEFCO Direct Loans are available for transactions
which have an Ex-Im Bank guaranteed value of $20 million
or more and a repayment term of five years or more.
The PEFCO Direct Loan Program is typically limited to
borrowers seeking a fixed-rate of interest on the Ex-Im
Bank guaranteed loans. Ex-Im Bank also allows PEFCO
to make its Direct Loans available on a floating-rate basis
to borrowers located in sub-Saharan Africa and borrowers
engaged in the purchase of “environmental” exports from
the U.S. or exports from U.S. small business exporters.
P E F C O A N N U A L R E P O R T 2 0 1 6S U M M A R Y O F P E F C O ’ S B U S I N E S S
1 2

PEFCO is now free to purchase both floating and fixed-
rate long-term loans for which Ex-Im Bank gave its
guarantee commitment on or after September 29, 2009
without restriction.
In fiscal year 2013, PEFCO developed with Ex-Im Bank
the Secondary Market Long-term Loan Purchase Program
(SMLTPP) to facilitate the development of an active
secondary market in long term Ex-Im Bank guaranteed
loans. To be eligible for the purchase under SMLTPP, the
loan must be fully disbursed and have been on the books
of the originating lender for at least one year, determined
from the date of the first disbursement under the facility
sold. In addition, the selling institution will sign a
representation stating that they are active in the business of
originating Ex-Im Bank guaranteed loans, and will continue
to generate such loans for their own account. PEFCO has
agreed to set aside up to $250 million of lending capacity
per quarter for an aggregate annual amount of up to $800
million. Pricing is subject to PEFCO pricing models for
fixed-rate loans and current PEFCO spread quotations for
floating-rate loans.
PEFCO’S FUNDING ACTIVITIESPEFCO manages the liquidity and interest rate exposures
arising from loan assets and unfunded loan commitments
through the combination of short term funding, secured
note issuances and interest rate derivatives. This approach
allows for targeting the proper liquidity profile, while
controlling exposure to market fluctuations. For fixed-rate
loan commitments, PEFCO hedges the loan pricing at the
time that a borrower accepts a fixed-rate loan offer, either
through specific hedging actions or within the context
of managing the interest rate risk in the overall book. In
cases where a derivative hedge is utilized, PEFCO hedges
the fixed-rate loan commitments using interest rate swaps
in advance of loan funding to immunize the interest rate
exposure. In cases where a cash hedge is utilized for fixed-
rate loan commitments, PEFCO issues term funding and
invests in U.S. Government Securities for the warehousing
period prior to loan funding.
This approach allows for flexibility in accommodating
a range of disbursement schedules. The impact of
warehousing may reduce earnings during the warehousing
period prior to disbursement of funds, which is
incorporated into the loan pricing.
The interest rates on Direct Loans (whether fixed or floating)
are based on PEFCO’s estimated cost of funds at the time
the rate is calculated, taking into account the disbursement
and repayment characteristics of the loan. PEFCO’s
estimated cost of funds is a function of the then current
U.S. Treasury yield for a maturity similar to the average life
of the loan being funded, plus the estimated margin over
the Treasury yield required to place PEFCO Secured Notes
with investors, warehousing and hedging costs, if any, and a
modest margin for expenses, risk and return to shareholders.
In the case of fixed-rate loans, PEFCO allows a great deal
of flexibility with respect to the timing of the rate fixing.
Borrowers are able to set forward rates in advance of
any disbursement under the loan facility or, if they prefer,
borrowers may elect to wait up to one year after final
disbursement of the loan to set the fixed rate.
Floating interest rates are set by determining a fixed spread
to LIBOR, based on PEFCO’s estimated cost of funds
described above.
PEFCO may also charge commitment fees calculated
on the undisbursed and uncancelled amount of the
loan commitment.
Once the fixed rate has been established, a borrower
may only cancel or prepay a portion of a loan or loan
commitment by paying PEFCO a “make-whole” fee equal
to the present value of the reinvestment loss, if any,
that would be incurred by PEFCO as a result of such
prepayment or cancellation.
Secondary Loan Program The purpose of the Secondary Loan Program is to provide
liquidity to lenders participating in the Ex-Im Bank
guaranteed loan market. PEFCO will support lenders
making long-term Ex-Im Bank guaranteed loans by buying
such loans from the originating lender. As with the Direct
Loan Program, the rates (yields) at which PEFCO is willing
to buy such loans will be a function of PEFCO’s estimated
cost of funds at the time of such purchase.
Lenders are also able to obtain commitments from PEFCO
to purchase loans in the future (in advance of disbursement
of such loan by the originating lender). Moreover, by
agreement with Ex-Im Bank, as of September 29, 2009,
PEFCO is no longer limited to purchasing floating rate
loans in connection with “environmental” transactions,
small business exporters and sub-Saharan borrowers.
P E F C O A N N U A L R E P O R T 2 0 1 6S U M M A R Y O F P E F C O ’ S B U S I N E S S
1 3

Secured Note IssuancesFor longer term U.S. dollar funding requirements,
PEFCO issues secured notes in public markets through
underwriters. The Secured Note Program is issued through
a trust arrangement on the books of Private Export Funding
Corporation under the Indenture, dated June 15, 1975,
as supplemented and amended (the “Indenture”). The
principal repayments for the Secured Notes are backed by
foreign importer notes, export loans guaranteed by Ex-Im
Bank, and investment securities explicitly backed by the full
faith and credit of the U.S. For each Secured Note issue,
the principal cash flows backing the principal must mature
prior to the maturity date for redemption of the Secured
Note principal. Pledged assets are assigned to and held
by The Bank of New York Mellon (a shareowner o f PEFCO),
as Trustee, as collateral for the benefit of the holders of
PEFCO Secured Notes. Foreign importer notes pledged
against the notes are backed by the 1971 Guarantee
Agreement between Ex-Im Bank and PEFCO. Interest
paid on the Secured Note Program is explicitly guaranteed
by Ex-Im Bank, as specified in the 1971 Guarantee &
Credit Agreement.
Since inception, PEFCO has issued $17.6 billion aggregate
principal amount of Secured Notes, of which $6.1 billion
aggregate principal amount were outstanding at
September 30, 2016, currently rated, Aaa, by Moody’s and
AAA by Fitch on the long-term Issuer Default Rating for
PEFCO, consistent with Fitch’s U.S. sovereign rating.
Short-term BorrowingsPEFCO raises short-term liquidity to finance loan
commitments through the issuance of commercial paper.
As of September 30, 2016, PEFCO received short-term
ratings of P-1 by Moodys’ and F1+ by Fitch. In 2016,
PEFCO established a new $1.02 billion 364 day facility
maturing in May 2017 and entered into a new $256 million
three-year facility. In addition, PEFCO has an existing
$272 million three-year facility maturing in May 2018. The
combined total of all three facilities is $1.55 billion. Of the
fifteen lenders across the three credit facilities, twelve are
shareholders of PEFCO. The credit agreements contain
a number of covenants, including a covenant that PEFCO
comply with its contractual commitments with Ex-Im Bank,
with customary exceptions. As of September 30, 2016,
there were no amounts outstanding under any of the credit
agreements. In addition, there were no amounts drawn
under any of the credit agreements during fiscal year 2016.
Certain underwriters of PEFCO Secured Notes, certain
dealers of PEFCO short-term notes, and certain participants
in the 364 day and three year syndicated credit agreements
are shareowners (or their affiliates are shareowners) of
PEFCO. Certain officers of certain shareowners also
serve as Directors of PEFCO as described herein. Certain
shareowners have provided and presently provide a variety
of commercial banking services to PEFCO. See Note 13,
Related Party Transactions, for more information.
PEFCO POLICIES REGARDING RISK MANAGEMENTPEFCO manages risk exposures for interest rate risk,
liquidity and counterparty risk using guidelines approved
by its Board of Directors. Management reports twice a year
to the Risk Policy Committee of the Board.
For interest rate risk, Management routinely measures the
net present value and duration of interest-sensitive assets
and liabilities and maintains current schedules which show
asset/liability mismatches and simulation of future income.
Management will not place at risk a 100 basis point
movement in interest rates in more than 10% of the pre-tax
net present value of capital.
S I N C E I N C E P T I O N , P E F C O H A S I S S U E D $ 1 7 . 6
B I L L I O N A G G R E G A T E P R I N C I P A L A M O U N T O F
S E C U R E D N O T E S , O F W H I C H $ 6 . 1 B I L L I O N
A G G R E G A T E P R I N C I P A L A M O U N T W E R E
O U T S T A N D I N G A T S E P T E M B E R 3 0 , 2 0 1 6 .
P E F C O A N N U A L R E P O R T 2 0 1 6S U M M A R Y O F P E F C O ’ S B U S I N E S S
1 4

Management may use derivative contracts, such as interest
rate swaps, in fair value and cash flow hedge strategies as
part of the process to mitigate risk exposure to changes
in market interest rates. However, Management will not
use swaps or other derivative financial instruments for
speculative purposes. As a financial institution, PEFCO has
been required to clear all swap trades through a centralized
clearinghouse since June 2013. As of September 30, 2016,
over 80% of the derivatives portfolio are cleared through
the Chicago Mercantile Exchange.
As a position limit on investments, Management will not
allow non-core business investments (those investments
that are not required to cover secured note installments
in the trust estate and that are unrelated to the secured
note program) with a maturity of more than 90 days to
exceed $250 million and will mark these investments to
market daily.
To mitigate liquidity risk, the amount of short-term funding
due to mature within a two-week period, including
commercial paper, will not exceed the unutilized portion of
the credit facility. In addition, a balance of unencumbered
assets will be maintained to equal the level of outstanding
unsecured borrowings less the unutilized portion of the
credit facility.
For managing capital leverage, Management operates
under a leverage ratio limit that caps guaranteed assets to
shareowners’ equity to a level no greater than 75 to 1.
PEFCO has had a long and significant relationship with the
Export-Import Bank of the United States since its inception,
providing liquidity support for certain of its guarantee
financing facilities. These arrangements are set forth in
various agreements that are described herein.
P E F C O H A S H A D A L O N G A N D S I G N I F I C A N T
R E L A T I O N S H I P W I T H T H E E X P O R T - I M P O R T B A N K
O F T H E U N I T E D S T A T E S S I N C E I T S I N C E P T I O N ,
P R O V I D I N G L I Q U I D I T Y S U P P O R T F O R C E R T A I N
O F I T S G U A R A N T E E F I N A N C I N G F A C I L I T I E S .
P E F C O A N N U A L R E P O R T 2 0 1 6S U M M A R Y O F P E F C O ’ S B U S I N E S S
1 5

1 6
P E F C O A N N U A L R E P O R T 2 0 1 6P E F C O ’ S R E L A T I O N S H I P W I T H E X - I M B A N K
U N D E R T H E T E R M S O F A G U A R A N T E E A G R E E M E N T ,D A T E D D E C E M B E R 1 5 , 1 9 7 1 , A S A M E N D E D , B E T W E E N P E F C O A N D E X - I M B A N K , D U E A N D P U N C T U A L P A Y M E N T O F T H E P R I N C I P A L O F A N D I N T E R E S T O N A L L F O R E I G N I M P O R T E R N O T E S E V I D E N C I N G L O A N S M A D E B Y P E F C O W I T H T H E A P P R O V A L O F E X - I M B A N K W I L L B E F U L L Y A N D U N C O N D I T I O N A L L Y G U A R A N T E E D B Y E X - I M B A N K .
1 7
P E F C O A N N U A L R E P O R T 2 0 1 6P E F C O ’ S R E L A T I O N S H I P W I T H E X - I M B A N K
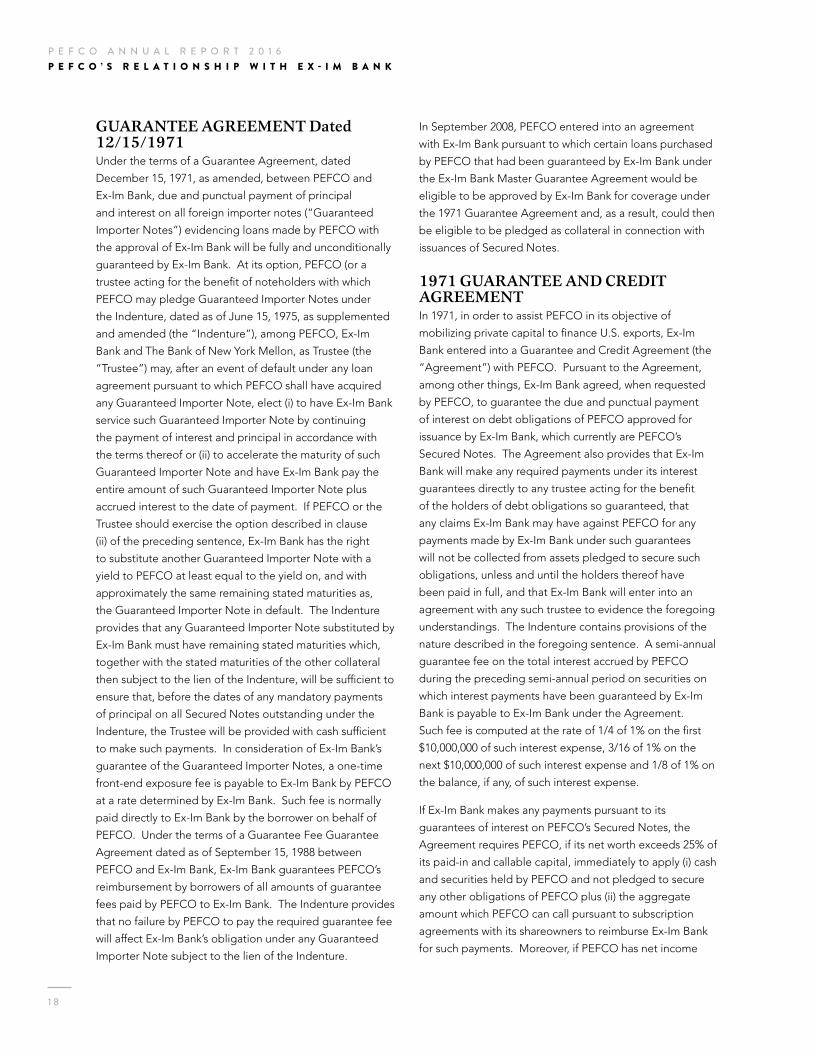
GUARANTEE AGREEMENT Dated 12/15/1971Under the terms of a Guarantee Agreement, dated
December 15, 1971, as amended, between PEFCO and
Ex-Im Bank, due and punctual payment of principal
and interest on all foreign importer notes (“Guaranteed
Importer Notes”) evidencing loans made by PEFCO with
the approval of Ex-Im Bank will be fully and unconditionally
guaranteed by Ex-Im Bank. At its option, PEFCO (or a
trustee acting for the benefit of noteholders with which
PEFCO may pledge Guaranteed Importer Notes under
the Indenture, dated as of June 15, 1975, as supplemented
and amended (the “Indenture”), among PEFCO, Ex-Im
Bank and The Bank of New York Mellon, as Trustee (the
“Trustee”) may, after an event of default under any loan
agreement pursuant to which PEFCO shall have acquired
any Guaranteed Importer Note, elect (i) to have Ex-Im Bank
service such Guaranteed Importer Note by continuing
the payment of interest and principal in accordance with
the terms thereof or (ii) to accelerate the maturity of such
Guaranteed Importer Note and have Ex-Im Bank pay the
entire amount of such Guaranteed Importer Note plus
accrued interest to the date of payment. If PEFCO or the
Trustee should exercise the option described in clause
(ii) of the preceding sentence, Ex-Im Bank has the right
to substitute another Guaranteed Importer Note with a
yield to PEFCO at least equal to the yield on, and with
approximately the same remaining stated maturities as,
the Guaranteed Importer Note in default. The Indenture
provides that any Guaranteed Importer Note substituted by
Ex-Im Bank must have remaining stated maturities which,
together with the stated maturities of the other collateral
then subject to the lien of the Indenture, will be sufficient to
ensure that, before the dates of any mandatory payments
of principal on all Secured Notes outstanding under the
Indenture, the Trustee will be provided with cash sufficient
to make such payments. In consideration of Ex-Im Bank’s
guarantee of the Guaranteed Importer Notes, a one-time
front-end exposure fee is payable to Ex-Im Bank by PEFCO
at a rate determined by Ex-Im Bank. Such fee is normally
paid directly to Ex-Im Bank by the borrower on behalf of
PEFCO. Under the terms of a Guarantee Fee Guarantee
Agreement dated as of September 15, 1988 between
PEFCO and Ex-Im Bank, Ex-Im Bank guarantees PEFCO’s
reimbursement by borrowers of all amounts of guarantee
fees paid by PEFCO to Ex-Im Bank. The Indenture provides
that no failure by PEFCO to pay the required guarantee fee
will affect Ex-Im Bank’s obligation under any Guaranteed
Importer Note subject to the lien of the Indenture.
In September 2008, PEFCO entered into an agreement
with Ex-Im Bank pursuant to which certain loans purchased
by PEFCO that had been guaranteed by Ex-Im Bank under
the Ex-Im Bank Master Guarantee Agreement would be
eligible to be approved by Ex-Im Bank for coverage under
the 1971 Guarantee Agreement and, as a result, could then
be eligible to be pledged as collateral in connection with
issuances of Secured Notes.
1971 GUARANTEE AND CREDIT AGREEMENTIn 1971, in order to assist PEFCO in its objective of
mobilizing private capital to finance U.S. exports, Ex-Im
Bank entered into a Guarantee and Credit Agreement (the
“Agreement”) with PEFCO. Pursuant to the Agreement,
among other things, Ex-Im Bank agreed, when requested
by PEFCO, to guarantee the due and punctual payment
of interest on debt obligations of PEFCO approved for
issuance by Ex-Im Bank, which currently are PEFCO’s
Secured Notes. The Agreement also provides that Ex-Im
Bank will make any required payments under its interest
guarantees directly to any trustee acting for the benefit
of the holders of debt obligations so guaranteed, that
any claims Ex-Im Bank may have against PEFCO for any
payments made by Ex-Im Bank under such guarantees
will not be collected from assets pledged to secure such
obligations, unless and until the holders thereof have
been paid in full, and that Ex-Im Bank will enter into an
agreement with any such trustee to evidence the foregoing
understandings. The Indenture contains provisions of the
nature described in the foregoing sentence. A semi-annual
guarantee fee on the total interest accrued by PEFCO
during the preceding semi-annual period on securities on
which interest payments have been guaranteed by Ex-Im
Bank is payable to Ex-Im Bank under the Agreement.
Such fee is computed at the rate of 1/4 of 1% on the first
$10,000,000 of such interest expense, 3/16 of 1% on the
next $10,000,000 of such interest expense and 1/8 of 1% on
the balance, if any, of such interest expense.
If Ex-Im Bank makes any payments pursuant to its
guarantees of interest on PEFCO’s Secured Notes, the
Agreement requires PEFCO, if its net worth exceeds 25% of
its paid-in and callable capital, immediately to apply (i) cash
and securities held by PEFCO and not pledged to secure
any other obligations of PEFCO plus (ii) the aggregate
amount which PEFCO can call pursuant to subscription
agreements with its shareowners to reimburse Ex-Im Bank
for such payments. Moreover, if PEFCO has net income
P E F C O A N N U A L R E P O R T 2 0 1 6
1 8
P E F C O ’ S R E L A T I O N S H I P W I T H E X - I M B A N K

I N 1 9 7 1 , I N O R D E R T O A S S I S T
P E F C O I N I T S O B J E C T I V E O F
M O B I L I Z I N G P R I V A T E C A P I T A L
T O F I N A N C E U . S . E X P O R T S ,
E X - I M B A N K E N T E R E D I N T O
A G U A R A N T E E A N D C R E D I T
A G R E E M E N T W I T H P E F C O .
P E F C O A N N U A L R E P O R T 2 0 1 6
1 9
P E F C O ’ S R E L A T I O N S H I P W I T H E X - I M B A N K
in any subsequent semi-annual period, it must apply the
amount of such net income to repay Ex-Im Bank for any
unreimbursed payments made by Ex-Im Bank under its
guarantees of interest on PEFCO debt obligations. Finally,
any amounts paid by Ex-Im Bank pursuant to its guarantees
of interest must be repaid by PEFCO within one year after
payment in full of the last maturing PEFCO debt obligation
on which interest is guaranteed by Ex-Im Bank. Amounts
paid by Ex-Im Bank under its guarantee of interest will
bear interest at the prevailing rate of interest charged by
Ex-Im Bank on direct loans made in the ordinary course of
business on the date of such payment by Ex-Im Bank. Such
interest is to be payable semi-annually.
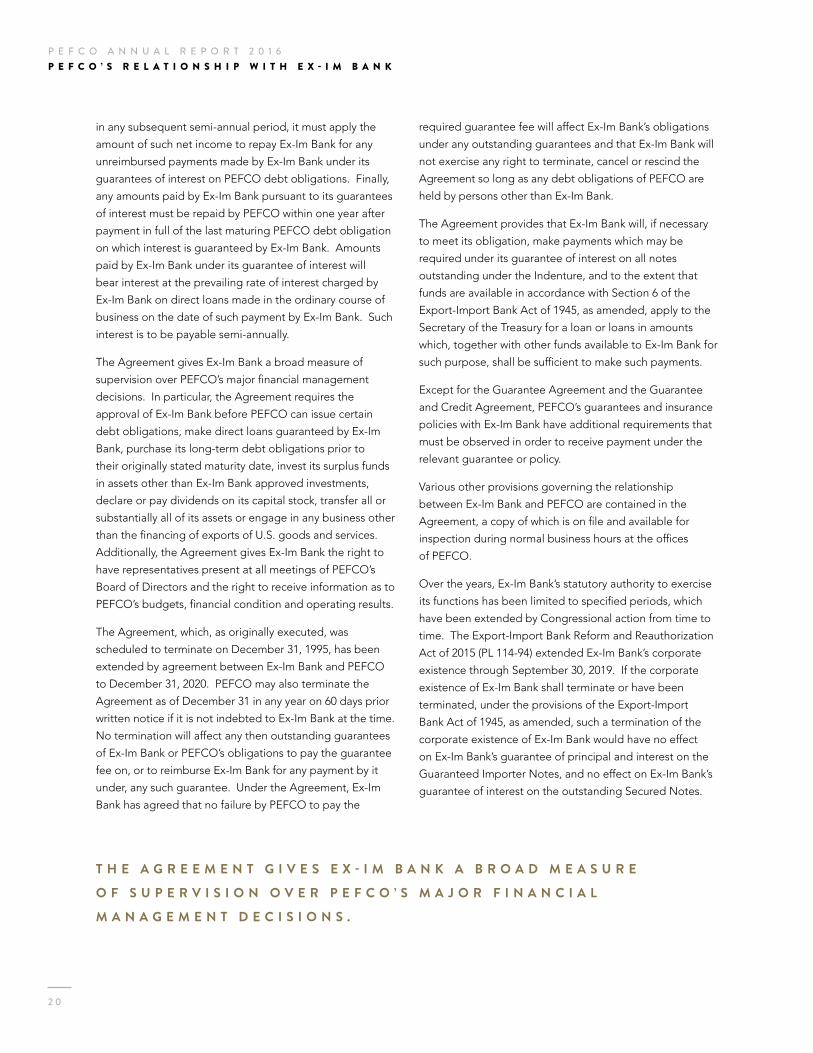
The Agreement gives Ex-Im Bank a broad measure of
supervision over PEFCO’s major financial management
decisions. In particular, the Agreement requires the
approval of Ex-Im Bank before PEFCO can issue certain
debt obligations, make direct loans guaranteed by Ex-Im
Bank, purchase its long-term debt obligations prior to
their originally stated maturity date, invest its surplus funds
in assets other than Ex-Im Bank approved investments,
declare or pay dividends on its capital stock, transfer all or
substantially all of its assets or engage in any business other
than the financing of exports of U.S. goods and services.
Additionally, the Agreement gives Ex-Im Bank the right to
have representatives present at all meetings of PEFCO’s
Board of Directors and the right to receive information as to
PEFCO’s budgets, financial condition and operating results.
The Agreement, which, as originally executed, was
scheduled to terminate on December 31, 1995, has been
extended by agreement between Ex-Im Bank and PEFCO
to December 31, 2020. PEFCO may also terminate the
Agreement as of December 31 in any year on 60 days prior
written notice if it is not indebted to Ex-Im Bank at the time.
No termination will affect any then outstanding guarantees
of Ex-Im Bank or PEFCO’s obligations to pay the guarantee
fee on, or to reimburse Ex-Im Bank for any payment by it
under, any such guarantee. Under the Agreement, Ex-Im
Bank has agreed that no failure by PEFCO to pay the
required guarantee fee will affect Ex-Im Bank’s obligations
under any outstanding guarantees and that Ex-Im Bank will
not exercise any right to terminate, cancel or rescind the
Agreement so long as any debt obligations of PEFCO are
held by persons other than Ex-Im Bank.
The Agreement provides that Ex-Im Bank will, if necessary
to meet its obligation, make payments which may be
required under its guarantee of interest on all notes
outstanding under the Indenture, and to the extent that
funds are available in accordance with Section 6 of the
Export-Import Bank Act of 1945, as amended, apply to the
Secretary of the Treasury for a loan or loans in amounts
which, together with other funds available to Ex-Im Bank for
such purpose, shall be sufficient to make such payments.
Except for the Guarantee Agreement and the Guarantee
and Credit Agreement, PEFCO’s guarantees and insurance
policies with Ex-Im Bank have additional requirements that
must be observed in order to receive payment under the
relevant guarantee or policy.
Various other provisions governing the relationship
between Ex-Im Bank and PEFCO are contained in the
Agreement, a copy of which is on file and available for
inspection during normal business hours at the offices
of PEFCO.
Over the years, Ex-Im Bank’s statutory authority to exercise
its functions has been limited to specified periods, which
have been extended by Congressional action from time to
time. The Export-Import Bank Reform and Reauthorization
Act of 2015 (PL 114-94) extended Ex-Im Bank’s corporate
existence through September 30, 2019. If the corporate
existence of Ex-Im Bank shall terminate or have been
terminated, under the provisions of the Export-Import
Bank Act of 1945, as amended, such a termination of the
corporate existence of Ex-Im Bank would have no effect
on Ex-Im Bank’s guarantee of principal and interest on the
Guaranteed Importer Notes, and no effect on Ex-Im Bank’s
guarantee of interest on the outstanding Secured Notes.
T H E A G R E E M E N T G I V E S E X - I M B A N K A B R O A D M E A S U R E
O F S U P E R V I S I O N O V E R P E F C O ’ S M A J O R F I N A N C I A L
M A N A G E M E N T D E C I S I O N S .
P E F C O A N N U A L R E P O R T 2 0 1 6
2 0
P E F C O ’ S R E L A T I O N S H I P W I T H E X - I M B A N K

OperationsThe following discussion should be read in conjunction with
PEFCO’s Financial Statements and the Notes thereto found
elsewhere in this report.
PEFCO’s mission is to assist in the financing of U.S. exports
by mobilizing private capital as a supplement to the
financing already available through the Export-Import Bank
of the United States (Ex-Im), commercial banks and other
lending institutions. PEFCO accomplishes this objective
primarily by purchasing medium– and long–term debt
obligations issued by foreign importers of U.S. goods and
services which are guaranteed or insured as to the timely
payment of principal and interest by Ex-Im Bank, or by
other U.S. government institutions whose obligations are
backed by the full faith and credit of the United States, or
The following table is an analysis of Financing Revenue for the years ended September 30,
by purchasing from commercial bank lenders participating
interests in such obligations. PEFCO finances these
purchases through the sale of its own securities to investors
in private transactions. PEFCO also assists small businesses
in financing U.S. exports and provides support for certain
securitized, guaranteed financing facilities of Ex-Im Bank.
Since PEFCO’s creation, the volume of its export loan
business has been subject to the initiation of financing
transactions involving PEFCO by commercial banks and
other lending institutions (including the shareowners
of PEFCO), the approval by Ex-Im Bank of PEFCO’s
participation in each such transaction, the volume of U.S.
exports, and the requirements and policies of Ex-Im Bank
with respect to the financing of those exports.
2016 2015 2014
In thousands
Average Balance
Average Rate
Interest Revenue
Average Balance
Average Rate
Interest Revenue
Average Balance
Average Rate
Interest Revenue
Financing Revenue
Interest Revenue
Export loans guaranteed or insured by Ex-Im Bank: Primary Long-term Loan Program Fixed-rate $ 4,241,000 1.15% $ 48,945 $ 4,699,000 0.90% $ 42,253 $ 4,336,000 0.91% $ 39,667 Floating-rate 96,000 1.27% 1,218 120,000 0.94% 1,124 416,000 0.91% 3,782 Secondary Long-term Loan Program Fixed-rate 758,000 1.64% 12,437 891,000 1.40% 12,454 1,020,000 1.48% 15,124 Floating-rate 2,043,000 1.12% 22,859 1,146,000 0.87% 9,964 893,000 0.82% 7,361 Short & Medium-term Programs Medium-term Programs Medium-term 119,000 2.16% 2,561 169,000 1.96% 3,313 221,000 1.81% 4,002 Working Capital & Short-term Insurance 23,000 2.23% 503 54,000 1.88% 1,016 311,000 1.50% 4,665 Loans Insured by OPIC Long-term 36,000 1.16% 422 51,000 0.82% 419 66,000 0.82% 538 Medium-term 74,000 1.75% 1,299 93,000 1.44% 1,339 112,000 1.35% 1,508
Loans 7,390,000 1.22% 90,244 7,223,000 1.00% 71,882 7,375,000 1.04% 76,647 Investment securities 528,000 0.88% 4,667 687,000 0.59% 4,033 653,000 0.66% 4,326 Cash Equivalents 454,000 0.18% 826 307,000 0.03% 80 432,000 0.03% 111 Total $ 8,372,000 1.14% $ 95,737 $ 8,217,000 0.92% $ 75,995 $ 8,460,000 0.96% $ 81,084
Commitment and prepayment fees 928 2,335 614
Financing Revenue $ 96,665 $ 78,330 $ 81,698
P E F C O A N N U A L R E P O R T 2 0 1 6
2 1
M A N A G E M E N T ’ S D I S C U S S I O N & A N A L Y S I S

Ex-Im Bank’s CharterOver the recent past, there has been significant debate in
the U.S. Congress surrounding the reauthorization of the
charter of the Export-Import Bank with opinions expressed
for reauthorizing the original charter, reauthorizing under
a revised charter, and permanent dissolution. On June
30, 2015, Congress recessed without reauthorizing Ex-Im’s
charter, thereby allowing the charter to lapse effective
July 1.
Ex-Im’s board of directors and employees were prohibited
from approving any new authorizations, engaging in
business development or other prohibited activities.
During the period of the lapse, Ex-Im continued to monitor
and manage its existing portfolio and met its continuing
legal obligations under its charter. On December 4, 2015,
President Barrack Obama signed into law the Export-Import
Bank Reform and Reauthorization Act of 2015 reauthorizing
Ex-Im through September 30, 2019.
Since the reauthorization, Ex-Im has not had the requisite
number of directors appointed by Congress to form the
necessary quorum to approve loans greater than $10
million. Under a continuing resolution to be presented to
Congress in 2017, Ex-Im hopes to resume normal business
operations under a reduced quorum.
This disruption in Ex-Im’s charter has had a direct impact
on PEFCO over this period, as Ex-Im, through certain
agreements with PEFCO, exerts a broad measure of
supervision over PEFCO’s major financial management
decisions, such as issuing certain debt obligations, making
direct loans guaranteed by Ex-Im, investing surplus funds in
The following table is an analysis of Financing Expense and Net Financing Income for the years ended September 30,
assets other than Ex-Im approved investments or engaging
in any business other than the financing of exports of U.S.
goods and services.
2016 compared to 2015PEFCO’s Net Loss for 2016 was $(595 thousand) compared
to Net Income of $2.2 million in 2015. The decrease in Net
Income was primarily the result of a $5.7 million decrease
in Net Financing Income. Total Financing Revenue
increased by $18.3 million; however the increase in Total
Financing Expense amounted to $24.0 million, resulting
in the decrease in Net Financing Income. Net securities
gains increased by $1.5 million. General and administrative
expenses were up slightly in 2016 to $10.8 million from
$10.7 million in 2015.
Total Financing RevenueTotal Financing Revenue is composed of interest income
on loans, investment securities available for sale, and
cash and cash equivalents, and also includes commitment
and other fees earned. In addition, any gains recognized
on the prepayment of a loan are reported as part of
Total Financing Revenue. Interest income on loans is
net of interest expense on fair value hedges, as well as
ineffectiveness gains or losses related to fair value hedge
relationships on loans.
For the year ended September 30, 2016, Total Financing
Revenue increased by $18.3 million to $96.7 million from
$78.3 million in 2015. Ineffectiveness losses on a portion
of the Company’s fair value hedge relationships amounted
to $0.6 million in both years. The primary reason for the
2016 2015 2014
In thousands
Average Balance
Average Rate
Interest Expense
Average Balance
Average Rate
Interest Expense
Average Balance
Average Rate
Interest Expense
Financing Expense
Interest Expense
Long-term Notes $ 6,656,000 1.10% $ 72,941 $ 6,593,000 0.83% $ 54,708 $ 6,322,000 0.78% $ 49,604
Short-term Notes 2,171,000 0.54% 11,765 2,175,000 0.27% 5,902 2,191,000 0.38% 8,409
Total $ 8,827,000 0.96% $ 84,706 $ 8,768,000 0.69% $ 60,610 $ 8,513,000 0.68% $ 58,013
Commitment and other fees 4,167 4,214 3,898
Financing Expense $ 88,873 $ 64,824 $ 61,911
Net Financing Income $ 7,792 $ 13,506 $ 19,787
P E F C O A N N U A L R E P O R T 2 0 1 6
2 2
M A N A G E M E N T ’ S D I S C U S S I O N & A N A L Y S I S

increase in Total Financing Revenue was attributable to an
increase in portfolio yield. Average loan volume increased
by $167 million compared to 2015 and the average yield
increased by 22 basis points. Interest on investment
securities available for sale increased by $0.6 million in fiscal
2016 from $4.0 million in fiscal 2015 due to increased yield.
Interest on cash and cash equivalents increased year over
year by $746 thousand to $826 thousand largely due to an
increase in average volume of $147 million and an increase
in yield of 15 basis points.
The overall average balance and yield of the lending
portfolio was $7,390 million and 1.22% in 2016 (inclusive
of hedge ineffectiveness losses; 1.23% without) compared
with $7,223 million and 1.00% in 2015 (with and without
hedge ineffectiveness). PEFCO utilizes interest rate swap
contracts to hedge certain fixed-rate loans and accounts
for these as fair value hedges. The net interest expense
on these fair value hedges reported as an adjustment of
interest income on fixed-rate loans was $93.6 million in 2016
and $123.3 million in 2015.
The available for sale investment securities portfolio had
an average balance and yield of $528 million and 0.88% in
2016 compared with $687 million and 0.59% in 2015. The
cash and cash equivalent portfolio had an average balance
and yield of $454 million and 0.18% in 2016 compared to
an average balance and yield of $307 million and 0.03%
in 2015.
Commitment and Prepayment FeesCommitment and prepayment fees amounted to $928
thousand in 2016 compared to $2.3 million in 2015. It is
PEFCO’s policy to permit borrowers to prepay loans only
if the borrower makes PEFCO whole for the economic loss
incurred as a result of such payment. In 2016, there were
prepayment gains of $766 thousand from 6 borrowers
compared to prepayment gains of $1.7 million from 4
borrowers in 2015. Commitment and other fees amounted
to $162 thousand in 2016 compared to $593 thousand in
2015. The decrease was largely attributable to PEFCO’s
inability to originate large lending transactions as a result
of the delay Ex-Im Bank faced in operating under its
renewed charter.
Total Financing ExpenseTotal Financing Expense is comprised of interest on short-
term and long-term notes, amortization of debt issuance
costs, and commitment and other fees incurred.
For the year ended September 30, 2016, Total Financing
Expense increased to $88.9 million from $64.8 million
in 2015. The reason for the increase in Total Financing
Expense was primarily attributable to higher cost of funds
in 2016. Short-term interest rates (Commercial Paper)
are the basis for pricing the short-term notes issued by
PEFCO while long-term interest rates (Treasury Notes) are
the basis for pricing Long-term Notes issued by PEFCO.
The average balance and effective costs for Long-term
notes were $6,656 million and 1.10% in 2016 compared to
$6,593 million and 0.83% in 2015. The average balance and
effective cost of the Short-term Notes was $2,171 million
and 0.54% in 2016 compared to $2,175 million and 0.27%
in 2015.
PEFCO utilizes interest rate swap contracts to hedge
certain long-term notes and accounts for these contracts as
fair value hedges. The net interest income on the fair value
hedges of the long-term notes reported as an adjustment
to interest expense was $106.8 million in fiscal 2016 and
$139.0 million in fiscal 2015. From time to time, PEFCO
also uses interest rate swaps designated as cash flow
hedges on certain short-term notes; however, PEFCO had
no cash flow hedges in fiscal 2016 and 2015.
Amortization of debt issuance costs amounted to $3.8
million in both 2016 and 2015. Commitment and other
fees paid in 2016 and 2015 amounted to $4.2 million in
each year.
Net Financing Income PEFCO’s Net Financing Income was $7.8 million in 2016
compared to $13.5 million in 2015. Net margin amounted
to 18 basis points in 2016 (asset yield of 1.14% less interest
cost of 0.96%) compared to 23 basis points in 2015 (asset
yield of 0.92% less interest cost of 0.69%).
P E F C O A N N U A L R E P O R T 2 0 1 6
2 3
M A N A G E M E N T ’ S D I S C U S S I O N & A N A L Y S I S

Net Securities GainsIn 2016, net securities transactions, the result of sales on
investment securities available for sale, produced a net gain
of $2.1 million, compared to a net gain of $613 thousand
in 2015.
General and Administrative Expenses General and administrative expenses were $10.8 million
in 2016 and $10.7 million in 2015. A $0.3 million decrease
in Compensation and benefits was offset by higher
Administration and Professional fees.
Provision for Income TaxProvision for income tax amounted to a benefit of $0.3
million in 2016 as a result of the pre-tax operating loss of
$0.9 million. By comparison the Provision for income taxes
in 2015 amounted to $1.2 million on $3.4 million of Income
before income tax. PEFCO’s effective tax rate was (36.9%)
in 2016 and 34.1% in 2015.
Comprehensive income in 2016 amounted to a loss of
$(1.0) million compared to income of $3.1 million in 2015.
The Comprehensive loss for 2016 was attributable to a net
loss from operations of $(0.6 million), a negative adjustment
of $(0.2 million) from pension and post-retirement
valuations, an unrealized loss on investment securities
available for sale of $(1.5 million) and reclassification
adjustments for net securities gains realized in net income
of $1.4 million.
2015 compared to 2014PEFCO’s Net Income for 2015 was $2.2 million compared
to Net Income in 2014 of $6.6 million. The decrease in Net
Income was primarily the result of a decrease in Financing
Revenue of $3.4 million, an increase in Financing Expense
of $2.9 million, and a decrease in Net securities gain of $0.3
million. General and administrative expenses remained flat.
Total Financing RevenueTotal Financing Revenue is composed of interest income
on loans, investment securities available for sale, and cash
and cash equivalents, and also includes commitments and
other fees earned. In addition, any gains recognized on the
prepayment of a loan are reported as part of total financing
revenue. Interest income on loans is net of interest
expense on fair value hedges, as well as ineffectiveness
gains or losses related to fair value hedge relationships
on loans.
For the year ended September 30, 2015, Total Financing
Revenue decreased by $3.4 million to $78.3 million
from $81.7 million in 2014, and includes $0.6 million in
ineffectiveness losses on a portion of the Company’s
fair value hedge relationships. Excluding the hedge
ineffectiveness losses, the primary reason for the decrease
in Total Financing Revenue was attributable to declines in
interest on loans resulting from decreases in average loan
volume and portfolio yield. Average loan volume declined
by $152 million compared to 2014 and the average yield
decreased by 4 basis points. Interest on investments
decreased by $0.3 million to $4.0 million in fiscal year 2015
from $4.3 million in fiscal year 2014 due to a 7 basis points
decrease in net yield, partially offset by an increase in
average volume of $34 million. Interest on cash and cash
equivalents decreased slightly. Yield on cash and cash
equivalents remained flat year over year at 3 basis points
while average volume decreased to $307 million from $432
million in 2014.
The overall average balance and yield of the lending
portfolio was $7,223 million and 1.00% in 2015 (with and
without hedge ineffectiveness losses) compared with
$7,375 million and 1.04% in 2014 (inclusive of hedge
ineffectiveness losses, 1.05% without). PEFCO utilizes
interest rate swap contracts to hedge certain fixed-rate
loans and accounts for these as fair value hedges. The net
interest expenses on these fair value hedges reported as
an adjustment of interest income on fixed-rate loans was
$123.3 million in 2015 and $122.8 million in 2014.
The available for sale investments securities portfolio had
an average balance and yield of $687 million and 0.59% in
2015 compared with $653 million and 0.66% in 2014.
Commitment and Prepayment FeesCommitment and prepayment fees amounted to $2.3
million in 2015 compared with $614 thousand in 2014. It is
PEFCO’s policy to permit borrowers to prepay loans only
if the borrower makes PEFCO whole for the economic loss
incurred as a result of such payment. In 2015, there was
a prepayment gain of $1.7 million from four borrowers.
In 2014, there was no gain from prepayment of loans.
Commitment and other fees in 2015 amounted to $593
thousand compared to $614 thousand in 2014.
P E F C O A N N U A L R E P O R T 2 0 1 6
2 4
M A N A G E M E N T ’ S D I S C U S S I O N & A N A L Y S I S

Total Financing ExpenseTotal Financing Expense is comprised of interest on short-
term and long-term notes, amortization of debt issuance
costs, and commitment and other fees incurred.
For the year ended September 30, 2015, Total Financing
Expense increased to $64.8 million from $61.9 million in
2014. The primary reason for the increase in Total Financing
Expense was attributable to higher average borrowings in
2015 at higher cost of funds compared to 2014. Short-term
interest rates (Commercial Paper) are the basis for pricing
the short-term notes issued by PEFCO while long-term
interest rates (Treasury Notes) are the basis for pricing the
Long-term Notes issued by PEFCO. The average balance
and effective cost for Long- term Notes was $6,593 million
and 0.83% in 2015 compared to $6,322 million and 0.78% in
2014. The average balance and effective cost of the Short-
term Notes was $2,175 million and 0.27% in 2015 compared
to $2,191 million and 0.38% in 2014.
PEFCO utilizes interest rate swap contracts to hedge
certain long-term notes and accounts for these contracts
as fair value hedges. From time to time, PEFCO also uses
interest rate swaps designated as cash flow hedges on
certain short-term notes. The net interest income on the
fair value hedges of the long-term notes reported as an
adjustment to interest expense was $139.0 million in 2015
and $141.1 million in 2014. The net interest rate expense
on interest rate swaps designated as cash flow hedges was
$2.9 million in 2014 and was reported as an adjustment to
the interest expense on the short-term notes.
In 2015, amortization of debt issuance costs amounted to
$3.8 million, an increase of $0.3 million from $3.5 million
in 2014. The increase was attributable to the issuances of
Series MM and NN.
Commitment and other fees paid in 2015 amounted to $4.2
million compared to $3.9 million in 2014.
Net Financing Income PEFCO’s Net Financing Income was $13.5 million in 2015
compared to $19.8 million in 2014. Net margin amounted
to 23 basis points in 2015 (asset yield of 0.92% less cost of
0.69%) compared to 28 basis points in 2014 (asset yield of
0.96% less cost of 0.68%).
Net Securities GainsIn 2015, net securities transactions, the result of sales on
investment securities available for sale, produced a net gain
of $613 thousand, compared to a net gain of $952 thousand
in 2014.
General and Administrative Expenses General and administrative expenses were $10.7 million in
2015, flat in comparison to 2014. A $0.2 million increase
in professional fees was offset by savings of $0.1 million
in both Compensation and benefits and Administration
expenses.
Provision for Income TaxProvision for income tax amounted to $1.2 million in 2015
compared to $3.4 million in 2014 reflecting the decrease of
$6.6 million in income before income taxes to $3.4 million in
2015 from $10.0 million in 2014. PEFCO’s effective tax rate
was 34.1% in 2015 and 34.2% in 2014.
Comprehensive income decreased to $3.1 million, net
of tax, in 2015 compared to $7.5 million, net of tax, in 2014,
largely due to a decrease in net income of $4.4 million,
a decrease in unrealized losses on AFS securities of $1.6
million, partially offset by a reduction of $2.2 million on
cash flow hedge gains, an increase in Pension and post-
retirement benefits adjustment of $0.8 million, and a $0.2
million decrease in reclassification adjustments for net
securities gains included in net income.
P E F C O A N N U A L R E P O R T 2 0 1 6
2 5
M A N A G E M E N T ’ S D I S C U S S I O N & A N A L Y S I S

Liquidity and Capital ResourcesThe principal source of capital during the year were funds
generated from the net issuance of PEFCO’s Short-term
notes. PEFCO did not issue any Long-term Secured Notes in
fiscal 2016.
As of September 30, 2016, PEFCO has approximately $8.5
billion of total obligations, of which approximately $2.1
billion (25%) were short-term and $6.4 billion (75%) were
long-term.
The long-term debt, which includes portions due within
one year, has amounts maturing of $850 million in 2017,
$1,000 million in 2018, $1,000 million in 2019, $725 million
in 2020 and $2,550 million in 2022 and thereafter.
During the fiscal year ended September 30, 2016, PEFCO
issued no additional common shares. PEFCO had total
Shareowners’ Equity of $147.6 million, total capitalization
(calculated as the sum of total debt and total Shareowners’
Equity) of $8.6 billion and a total debt to capitalization ratio
of 98.3%.
On May 4, 2016, PEFCO entered into a new 364 day $1.02
billion revolving credit facility and a new $256 million 3 year
facility. Combined with an existing $272 million credit facility
maturing in 2018, PEFCO’s facilities total $1.55 billion.
The credit agreements contain a number of covenants,
including a negative pledge covenant and a covenant that
PEFCO will comply with its contractual commitments with
Ex-Im Bank. As of September 30, 2016, there were no
amounts outstanding under these credit facilities.
P E F C O A N N U A L R E P O R T 2 0 1 6
2 6
M A N A G E M E N T ’ S D I S C U S S I O N & A N A L Y S I S

We have audited the accompanying financial statements
of Private Export Funding Corporation (the “Company”),
which comprise of the statement of financial condition
as of September 30, 2016, and the related statements
of operations, comprehensive income, changes in
shareowners’ equity, and cash flows for the year then
ended, and the related notes to the financial statements.
We also have audited the Company’s internal control over
financial reporting as of September 30, 2016, based on
the criteria established in the Internal Control – Integrated
Framework (2013) issued by the Committee of Sponsoring
Organizations of the Treadway Commission.
Management’s Responsibility for the Financial Statements and Internal Control over Financial ReportingManagement is responsible for the preparation and fair
presentation of these financial statements in accordance
with accounting principles generally accepted in the
United States of America; this includes the design,
implementation, and maintenance of effective internal
control over financial reporting relevant to the preparation
and fair presentation of financial statements that are free
from material misstatement, whether due to fraud or error.
Management is also responsible for its assessment of the
effectiveness of internal control over financial reporting,
included in the accompanying Management’s Report on
Internal Control over Financial Reporting.
Auditor’s ResponsibilityOur responsibility is to express an opinion on these
financial statements and an opinion on the Company’s
internal control over financial reporting based on our
audits. We conducted our audits in accordance with
auditing standards generally accepted in the United States
of America. Those standards require that we plan and
perform the audits to obtain reasonable assurance about
whether the financial statements are free from material
misstatement and whether effective internal control over
financial reporting was maintained in all material respects.
An audit of financial statements involves performing
procedures to obtain audit evidence about the amounts
and disclosures in the financial statements. The procedures
selected depend on the auditor’s judgment, including
the assessment of the risks of material misstatement of
the financial statements, whether due to fraud or error.
In making those risk assessments, the auditor considers
internal controls relevant to the entity’s preparation and fair
presentation of the financial statements in order to design
audit procedures that are appropriate in the circumstances.
An audit of financial statements also includes evaluating
the appropriateness of accounting policies used and
the reasonableness of significant accounting estimates
made by management, as well as evaluating the overall
presentation of the financial statements.
An audit of internal control over financial reporting involves
performing procedures to obtain audit evidence about
whether a material weakness exists. The procedures
selected depend on the auditor’s judgment, including the
assessment of the risks that a material weakness exists.
An audit of internal control over financial reporting also
involves obtaining an understanding of internal control over
financial reporting and testing and evaluating the design
and operating effectiveness of internal control over financial
reporting based on the assessed risk.
We believe that the audit evidence we have obtained
is sufficient and appropriate to provide a basis for our
audit opinions.
Definition and Inherent Limitations of Internal Control over Financial ReportingAn entity’s internal control over financial reporting is a
process effected by those charged with governance,
management, and other personnel, designed to provide
reasonable assurance regarding the preparation of reliable
financial statements in accordance with accounting
principles generally accepted in the United States of
America. An entity’s internal control over financial
reporting includes those policies and procedures that (1)
pertain to the maintenance of records that, in reasonable
detail, accurately and fairly reflect the transactions
and dispositions of the assets of the entity; (2) provide
reasonable assurance that transactions are recorded as
necessary to permit preparation of financial statements
in accordance with accounting principles generally
accepted in the United States of America, and that receipts
To the Board of Directors and Shareowners of Private Export Funding Corporation:
P E F C O A N N U A L R E P O R T 2 0 1 6
2 7
I N D E P E N D E N T A U D I T O R ’ S R E P O R T

and expenditures of the entity are being made only in
accordance with authorizations of management and those
charged with governance; and (3) provide reasonable
assurance regarding prevention, or timely detection and
correction, of unauthorized acquisition, use, or disposition
of the entity’s assets that could have a material effect on the
financial statements.
Because of its inherent limitations, internal control over
financial reporting may not prevent, or detect and correct,
misstatements. Also, projections of any assessment of
effectiveness to future periods are subject to the risk that
controls may become inadequate because of changes
in conditions, or that the degree of compliance with the
policies or procedures may deteriorate.
OpinionsIn our opinion, the financial statements referred to above
present fairly, in all material respects, the financial position
of Private Export Funding Corporation as of September
30, 2016, and the results of its operations and its cash flows
for the year then ended in accordance with accounting
principles generally accepted in the United States of
America. Also, in our opinion, the Company maintained,
in all material respects, effective internal control over
financial reporting as of September 30, 2016, based on the
criteria established in the Internal Control — Integrated
Framework (2013) issued by the Committee of Sponsoring
Organizations of the Treadway Commission.
Predecessor Auditor’s Opinion on 2015 and 2014 Financial StatementsThe financial statements of the Company as of and for the
years ended September 30, 2015 and 2014 were audited
by other auditors whose report, dated November 25, 2015
expressed an unmodified opinion on those statements.
January 5, 2017
New York, New York
P E F C O A N N U A L R E P O R T 2 0 1 6
2 8
I N D E P E N D E N T A U D I T O R ’ S R E P O R T

STATEMENTS OF FINANCIAL CONDITION
ASSETS (In thousands, except share amounts) September 30, 2016 September 30, 2015
Cash and cash equivalents $ 712,337 $ 1,094,345
Investment securities available for sale 782,362 228,028
Interest and fees receivable 39,611 51,003
Export loans guaranteed or insured by Ex-Im Bank 6,939,197 7,824,681
Loans insured by OPIC 89,587 128,841
Total lending 7,028,784 7,953,522
Other assets and deferred charges 106,299 90,541
Total Assets $ 8,669,393 $ 9,417,439
LIABILITIES AND SHAREOWNERS’ EQUITY
Liabilities
Short-term notes $ 2,088,674 $ 2,179,281
Interest payable 33,804 42,336
Accrued expenses and other liabilities 15,982 32,337
Long-term Secured Notes 6,383,332 7,014,912
Total Liabilities 8,521,792 9,268,866
Shareowners’ Equity
Common stock-no par value; authorized 40,000 shares; outstanding 17,786 shares
at September 30, 2016 and September 30, 2015 38,950 38,950
Retained earnings 110,317 110,912
Accumulated other comprehensive loss (1,666) (1,289)
Total Shareowners’ Equity 147,601 148,573
Total Liabilities and Shareowners’ Equity $ 8,669,393 $ 9,417,439
See Notes to Financial Statements
P E F C O A N N U A L R E P O R T 2 0 1 6
2 9
S T A T E M E N T S O F F I N A N C I A L C O N D I T I O N

STATEMENTS OF OPERATIONS
Year Ended September 30,
FINANCING REVENUE (In thousands, except per share amounts) 2016 2015 2014
Interest $ 95,737 $ 75,995 $ 81,084
Commitment and prepayment fees 928 2,335 614
Total Financing Revenue 96,665 78,330 81,698
FINANCING EXPENSE
Interest (84,706) (60,610) (58,013)
Commitment and other fees (4,167) (4,214) (3,898)
Total Financing Expense (88,873) (64,824) (61,911)
Net Financing Income 7,792 13,506 19,787
Net securities gain 2,074 613 952
General and administrative expenses (10,808) (10,710) (10,700)
(Loss) income before income tax (942) 3,409 10,039
Provision for income tax 347 (1,163) (3,434)
Net (Loss) Income $ (595) $ 2,246 $ 6,605
NET (LOSS) INCOME PER SHARE
Net (Loss) Income $ (33.46) $ 126.28 $ 371.37
See Notes to Financial Statements
P E F C O A N N U A L R E P O R T 2 0 1 6
3 0
S T A T E M E N T S O F O P E R A T I O N S
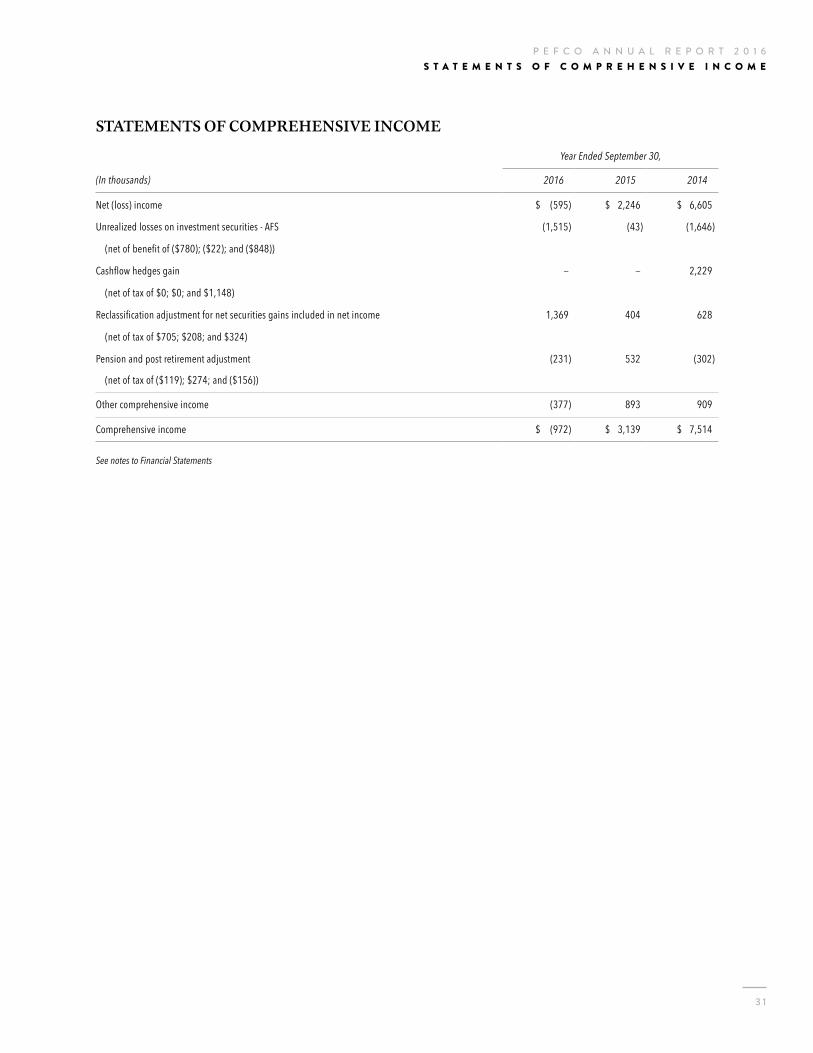
STATEMENTS OF COMPREHENSIVE INCOME
Year Ended September 30,
(In thousands) 2016 2015 2014
Net (loss) income $ (595) $ 2,246 $ 6,605
Unrealized losses on investment securities - AFS (1,515) (43) (1,646)
(net of benefit of ($780); ($22); and ($848))
Cashflow hedges gain — — 2,229
(net of tax of $0; $0; and $1,148)
Reclassification adjustment for net securities gains included in net income 1,369 404 628
(net of tax of $705; $208; and $324)
Pension and post retirement adjustment (231) 532 (302)
(net of tax of ($119); $274; and ($156))
Other comprehensive income (377) 893 909
Comprehensive income $ (972) $ 3,139 $ 7,514
See notes to Financial Statements
P E F C O A N N U A L R E P O R T 2 0 1 6
3 1
S T A T E M E N T S O F C O M P R E H E N S I V E I N C O M E

STATEMENTS OF CHANGES IN SHAREOWNERS’ EQUITY
(In thousands, except share and per share amounts)Common
StockRetained Earnings
Accumulated Other
Comprehensive Loss
Total Shareowners’
Equity
Balances at September 30, 2013 $ 38,950 $ 102,790 $ (3,091) $ 138,649
Comprehensive income:
Net income 6,605 6,605
Other comprehensive income 909 909
Dividend declared ($29 per share) (516) (516)
Balances at September 30, 2014 $ 38,950 $ 108,879 $ (2,182) $ 145,647
Comprehensive income:
Net income 2,246 2,246
Other comprehensive income 893 893
Dividend declared ($12 per share) (213) (213)
Balances at September 30, 2015 $ 38,950 $ 110,912 $ (1,289) $ 148,573
Comprehensive income:
Net (loss) (595) (595)
Other comprehensive (loss) (377) (377)
Balances at September 30, 2016 $ 38,950 $ 110,317 $ (1,666) $ 147,601
See Notes to Financial Statements
P E F C O A N N U A L R E P O R T 2 0 1 6
3 2
S T A T E M E N T S O F C H A N G E S I N S H A R E O W N E R S ’ E Q U I T Y
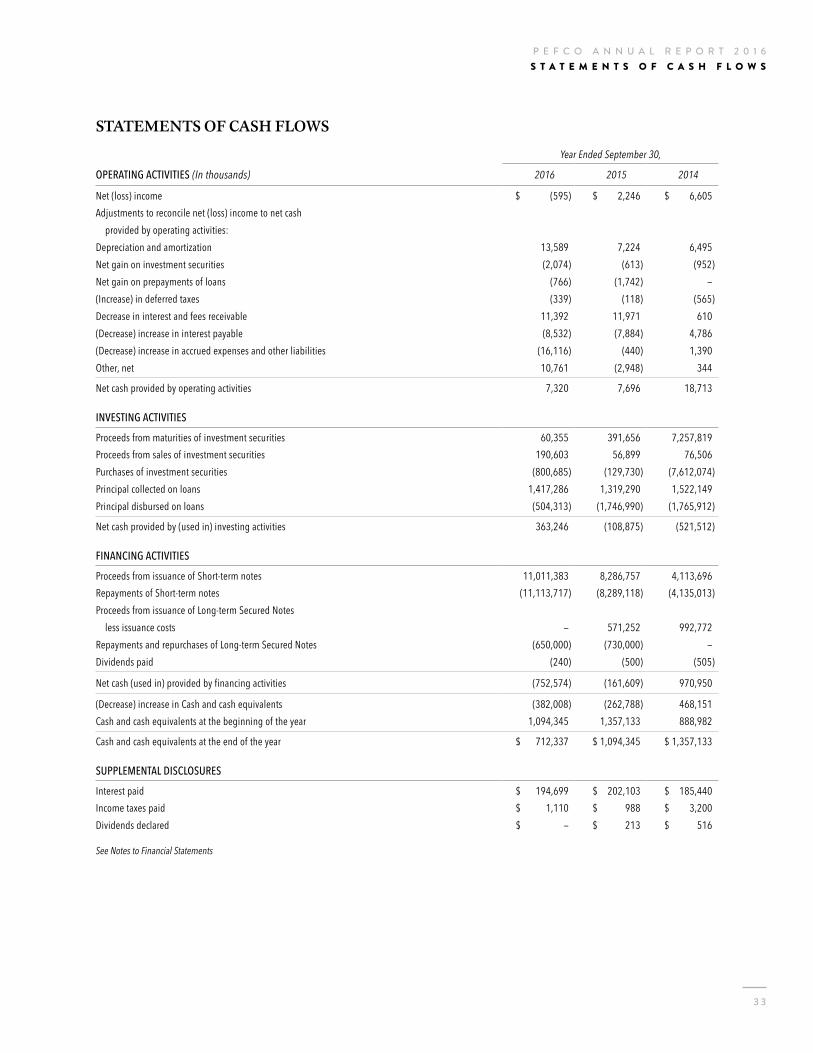
STATEMENTS OF CASH FLOWS
Year Ended September 30,
OPERATING ACTIVITIES (In thousands) 2016 2015 2014
Net (loss) income $ (595) $ 2,246 $ 6,605Adjustments to reconcile net (loss) income to net cash provided by operating activities:Depreciation and amortization 13,589 7,224 6,495 Net gain on investment securities (2,074) (613) (952)Net gain on prepayments of loans (766) (1,742) —(Increase) in deferred taxes (339) (118) (565)Decrease in interest and fees receivable 11,392 11,971 610(Decrease) increase in interest payable (8,532) (7,884) 4,786(Decrease) increase in accrued expenses and other liabilities (16,116) (440) 1,390Other, net 10,761 (2,948) 344
Net cash provided by operating activities 7,320 7,696 18,713
INVESTING ACTIVITIES
Proceeds from maturities of investment securities 60,355 391,656 7,257,819 Proceeds from sales of investment securities 190,603 56,899 76,506 Purchases of investment securities (800,685) (129,730) (7,612,074)Principal collected on loans 1,417,286 1,319,290 1,522,149 Principal disbursed on loans (504,313) (1,746,990) (1,765,912)
Net cash provided by (used in) investing activities 363,246 (108,875) (521,512)
FINANCING ACTIVITIES
Proceeds from issuance of Short-term notes 11,011,383 8,286,757 4,113,696 Repayments of Short-term notes (11,113,717) (8,289,118) (4,135,013)Proceeds from issuance of Long-term Secured Notes less issuance costs — 571,252 992,772 Repayments and repurchases of Long-term Secured Notes (650,000) (730,000) —Dividends paid (240) (500) (505)
Net cash (used in) provided by financing activities (752,574) (161,609) 970,950
(Decrease) increase in Cash and cash equivalents (382,008) (262,788) 468,151Cash and cash equivalents at the beginning of the year 1,094,345 1,357,133 888,982
Cash and cash equivalents at the end of the year $ 712,337 $ 1,094,345 $ 1,357,133
SUPPLEMENTAL DISCLOSURES
Interest paid $ 194,699 $ 202,103 $ 185,440 Income taxes paid $ 1,110 $ 988 $ 3,200 Dividends declared $ — $ 213 $ 516
See Notes to Financial Statements
P E F C O A N N U A L R E P O R T 2 0 1 6
3 3
S T A T E M E N T S O F C A S H F L O W S

Since the reauthorization, Ex-Im has not had the requisite
number of directors appointed by Congress to form
the necessary quorum to approve loans greater than
$10 million. Under a continuing resolution to be
presented to Congress in 2017, Ex-Im hopes to resume
normal business operations under a reduced quorum.
If the corporate existence of Ex-Im shall terminate or have
been terminated, under the provisions of the Export-Import
Bank Act of 1945, as amended, such a termination of the
corporate existence of Ex-Im would have no effect on Ex-
Im’s guarantee of principal and interest on the Guaranteed
Importer Notes, and no effect on Ex-Im’s guarantee of
interest on the outstanding Secured Notes.
3. SUMMARY OF SIGNIFICANT ACCOUNTING POLICIES
Basis of PresentationThe accompanying financial statements include, in
the opinion of management, all material and recurring
adjustments considered necessary for a fair presentation in
conformity with accounting principles generally accepted in
the United States of America (“U.S. GAAP”).
Use of EstimatesThe preparation of financial statements in conformity with
U.S. GAAP requires Management to make estimates and
assumptions that affect the reported amount of assets and
liabilities and disclosure of contingent assets and liabilities
at the date of the financial statements and the reported
amounts of revenue and expenses during the period.
Actual results could differ from those estimates.
Cash and Cash EquivalentsCash and cash equivalents consist of deposits held at
banks and highly liquid money market account balances.
Substantially all PEFCO’s cash and cash equivalents
are held by four financial institutions that Management
believes are of high credit quality. At September 30, 2016
and September 30, 2015, approximately 82% and 56%,
respectively, of the cash and cash equivalents were held
in money market funds invested in U.S. Treasuries and
repurchase agreements in respect of such securities.
1. ORGANIZATIONPrivate Export Funding Corporation (“PEFCO”) was
incorporated on April 9, 1970 under Delaware law and is
principally engaged in making U.S. dollar loans to foreign
importers to finance purchases of goods and services of
United States manufacture or origin. PEFCO’s shareowners
include most of the major commercial banks involved in
financing U.S. exports, industrial companies involved in
exporting U.S. products and services, and financial
services companies.
PEFCO was established with the support of the United
States Department of the Treasury and the Export-Import
Bank of the United States (Ex-Im) to assist in the financing
of U.S. exports through the mobilization of private capital
as a supplement to the financing already available through
Ex-Im, commercial banks and other lending institutions.
Ex-Im has cooperated in the operation of PEFCO through
various agreements.
2. AGREEMENTS WITH EX-IM BANKPEFCO has agreements with Ex-Im which provide that
Ex-Im will:
1. guarantee the due and punctual payment of principal
and interest on all export loans made by PEFCO; and
2. guarantee the due and punctual payment of interest
on PEFCO’s long-term Secured Notes in return for a
fee paid by PEFCO.
Under its agreements with PEFCO, Ex-Im retains a broad
measure of supervision over PEFCO’s major financial
management decisions. The approval of Ex-Im is required
on the terms of PEFCO’s individual loan commitments
and on the terms of PEFCO’s long-term debt issues.
Surplus funds may be invested only in Ex-Im-approved
types of assets. Ex-Im is entitled to represen tation at all
meetings of PEFCO’s Board of Directors and Advisory
Board. PEFCO furnishes Ex-Im with full information as to
budgets, financial condition, and operating results.
Over the years, Ex-Im’s statutory authority to exercise its
functions has been limited to specified periods, which have
been extended by Congressional action from time to time.
The Export-Import Bank Reform and Reauthorization Act
of 2015 (PL 114-94) extended Ex-Im’s corporate existence
through September 30, 2019.
P E F C O A N N U A L R E P O R T 2 0 1 6N O T E S T O F I N A N C I A L S T A T E M E N T S
3 4
Investment SecuritiesInvestment securities that may be sold in response to
changes in market interest rates, needs for liquidity,
changes in funding sources and terms or other factors are
classified as securities available for sale. The securities are
carried at fair value with unrealized gains and losses, net
of income taxes, reported as a component of accumulated
other comprehensive income (loss).
The classification is determined at the time each security
is acquired. At each reporting date, the appropriateness
of the classification is reassessed and the securities are
assessed for other than temporary impairment.
Interest income on investment securities, including
amortization of premiums and accretion of discounts, is
recognized when earned using methods that approximate
the interest method. Security transactions are accounted
for as of the date these securities are purchased or sold
(trade date). Realized gains and losses are reported on a
first-in, first-out basis.
Loans, Interest and FeesLoans are reported at their principal amounts outstanding.
Interest income is recognized when earned using the
interest method. Fees are received from the undisbursed
balances of loan commitments. Fee income is recognized
over the period the service is provided. A borrower may
cancel all or any portion of an unused fixed-rate loan
commitment or prepay a fixed-rate loan by paying PEFCO
a fee equal to the present value of the reinvestment loss, if
any, incurred by PEFCO. Cancellation and prepayment fees
are recorded as income by PEFCO upon receipt.
Other Assets and Deferred ChargesDebt issuance costs incurred in connection with the issuance
of long-term debt are deferred and amortized to interest
expense on a straight-line basis over the life of each issue.
Equipment and leasehold improvements are carried at
cost less accumulated depreciation and amortization.
Depreciation and amortization are computed using the
straight-line method over the estimated useful life of the
owned asset and, for leasehold improvements, over the
estimated useful life of the improvement or the lease term,
whichever is shorter.
Derivative Financial InstrumentsIn connection with PEFCO’s asset/liability management
process, the purpose of which is to manage and control
the sensitivity of PEFCO’s earnings to changes in market
interest rates, PEFCO may enter into derivative financial
instruments including interest rate swap contracts that are
designated as cash flow or fair value hedges of specific
assets or groups of similar assets or similar liabilities and
anticipated debt issuance transactions. Interest rate
swaps are transactions in which two parties agree to
exchange, at specified intervals, interest payment streams
calculated on an agreed-upon notional amount with at least
one stream based on a specified floating-rate index.
The credit risk inherent in interest rate swaps arises from
the potential inability of counterparties to meet the terms
of their contracts.
Derivative financial instruments are recorded on the
statement of financial condition as either an asset or
liability measured at fair value. If the derivative is
designated as a fair value hedge, the changes in fair
value of the derivative and hedged item are recognized
in earnings. If the derivative is designated as a cash flow
hedge, changes in the fair value of the derivative are
recorded in other comprehensive income (loss) and are
recognized in the income statement when the hedged item
affects earnings. Interest expense on fair value hedges of
fixed-rate loans is reported net of interest income on loans.
Interest income on fair value hedges of Long-term Secured
Notes is reported net of interest expense on Long-term
Secured Notes.
PEFCO formally documents all relationships between
hedging instruments and hedged items. Also, PEFCO
formally assesses whether the derivatives used in hedging
transactions have been highly effective in offsetting
changes in the fair value or cash flows of hedged items
and whether those derivatives may be expected to remain
highly effective in future periods.
Allowance for Loan LossesSince all loans made by PEFCO are guaranteed or
insured as to the due and punctual payment of principal
and interest by Ex-Im Bank or other U.S. government
institutions, such as the Overseas Private Investment
Corporation (“OPIC”), whose obligations are backed by
the full faith and credit of the United States, PEFCO relies
upon this U.S. government support and does not make
evaluation of credit risks, appraisals of economic conditions
in foreign countries, or reviews of other factors in making
its loans. In addition, insured loans are supported by
guarantees from the respective lenders. Accordingly,
PEFCO does not presently maintain an allowance for
loan losses.
P E F C O A N N U A L R E P O R T 2 0 1 6N O T E S T O F I N A N C I A L S T A T E M E N T S
3 5

Fair Value MeasurementPEFCO reports fair value measurements for specialized
classes of assets and liabilities. In measuring fair value,
PEFCO utilizes fair value hierarchy that prioritizes the inputs
to valuation techniques used to measure fair value into three
broad levels. The highest priority is given to quoted prices
in active markets and the lowest priority to unobservable
inputs. Additional disclosure requirements are required for
the lowest priority level. At PEFCO, fair value measurement
is calculated using prices from data providers and dealers.
Dividends and Distribution to ShareownersDividends and distribution to shareowners are recorded on
the ex-dividend date.
Income TaxesIncome taxes are recorded based on the provisions of
enacted tax laws, including the tax rates in effect for current
and future years. Net deferred tax assets are recognized
to the extent that it is more likely than not that these future
benefits will be realized.
A tax position is recognized as a benefit only if it is “more
likely than not” that the tax position would be sustained in
a tax examination, with a tax examination being presumed
to occur. The amount recognized is the largest amount of
tax benefit that is greater than 50% likely of being realized
on examination. For tax positions not meeting the “more
likely than not” test, no tax benefit is recorded.
Recently Issued Accounting PronouncementsThe Private Company Council (PCC), a new body formed
to improve the process of setting accounting standards
for private companies, and the Financial Accounting
Standards Board (FASB) mutually agree on a set of criteria
to decide whether and when alternatives within U.S. GAAP
are warranted for private companies. The PCC reviews
and proposes alternatives within U.S. GAAP to address the
needs of users of private company financial statements.
The PCC also serves as the primary advisory body to
the FASB on the appropriate treatment for items under
consideration on the FASB’s agenda.
In January 2016, the FASB issued ASU 2016-01 – Financial
Instruments – Overall (Subtopic 825-10): Recognition and
Measurement of Financial Assets and Financial Liabilities.
Among other provisions, the amendments in this update
eliminate the requirement to disclose the fair value of
financial instruments measured at amortized cost for private
companies, require separate presentation of financial
assets and financial liabilities by measurement category
and form of financial asset on the balance sheet or the
accompanying notes to the financial statements, and
requires evaluation of the need for a valuation allowance on
a deferred tax asset related to available-for-sale securities
in combination with the entity’s other deferred tax assets.
For private companies, the amendments in this ASU are
effective for financial statements issued for annual periods
beginning after December 15, 2018, and interim periods
within fiscal years beginning after December 15, 2019.
Private companies may adopt the amendments in this
update early for fiscal years beginning after December 15,
2017, including interim periods within those fiscal years.
This guidance is not expected to have a material impact on
PEFCO’s financial statements.
In February 2016, the FASB issued ASU 2016-02 – Leases
(Topic 842), the purpose of which is to increase transparency
and comparability among organizations by recognizing
lease assets and lease liabilities on the balance sheet and
disclosing key information about leasing arrangements.
For lessees under an operating lease, the lessee is required
to recognize a right-of-use asset and a lease liability, initially
measured at the present value of the lease payments, in the
statement of financial condition; recognize a single lease
cost, calculated so that the cost of the lease is allocated
over the lease term on a generally straight-line basis; and
classify all cash payments within operating activities in the
statement of cash flows. For private companies, the ASU
is effective for fiscal years beginning after December 15,
2019, and interim periods within fiscal years beginning
after December 15, 2020. Early application is permitted.
This guidance is not expected to have a material impact
on PEFCO’s financial statements.
In March 2016, the FASB issued ASU 2016-03 – Intangibles-
Goodwill and Other (Topic 350), Business Combinations
(Topic 805), Consolidation (Topic 810) and Derivatives
and Hedging (Topic 815), Effective Date and Transition
Guidance, A Consensus of the Private Company Council.
The amendments in this ASU make the previous guidance
in ASU 2014-02, 2014-03, 2014-07, and 2014-18 effective
immediately by removing their effective dates. This
guidance did not have a material impact on PEFCO’s
financial statements.
P E F C O A N N U A L R E P O R T 2 0 1 6N O T E S T O F I N A N C I A L S T A T E M E N T S
3 6

In March 2016, the FASB issued ASU 2016-05 – Derivatives
and Hedging (Topic 815): Effect of Derivative Contract
Novations on Existing Hedge Accounting Relationships.
The amendments in the ASU clarify that a change in the
counterparty to a derivative instrument that has been
designated as the hedging instrument under Topic 815
does not, in and of itself, require de-designation of
that hedging relationship provided that all other hedge
accounting criteria continue to be met. For private
companies, the ASU is effective for financial statements
issued for fiscal years beginning after December 15, 2017
and interim periods within fiscal years beginning after
December 15, 2018. This guidance is not expected to have
a material impact on PEFCO’s financial statements.
In March 2016, the FASB issued ASU 2016-06 – Derivatives
and Hedging (Topic 815): Contingent Put and Call Options
in Debt Instruments. GAAP provides specific guidance for
assessing whether call (put) options that can accelerate
the repayment of principal on a debt instrument meet
the clearly and closely related criterion utilizing a four-
step decision sequence. The amendments in this ASU are
to clarify the requirements of existing GAAP to resolve
diversity in practice resulting from different interpretations
of the intent of the four-step decision sequence process.
For private companies, the ASU is effective for financial
statements beginning after December 15, 2017, and interim
periods within fiscal years beginning after December 15,
2018. This ASU is not expected to have a material impact
on PEFCO’s financial statements.
The FASB issued in June 2016 ASU 2016-13 – Financial
Instruments – Credit Losses (Topic 326): Measurement of
Credit Losses on Financial Instruments. The objective of
this ASU is to provide financial statement users with more
decision-useful information about the expected credit
losses on financial instruments and other commitments
to extend credit held by a reporting entity. To do this, the
incurred loss impairment methodology in current GAAP
will be replaced with a methodology that reflects expected
credit losses and requires consideration of a broader range
of reasonable and supportable information to inform credit
loss estimates. The FASB does not specify a method for
measuring expected credit losses and allows an entity to
apply methods that reasonably reflect its expectations of
the credit loss estimate. For private companies, the ASU
will be effective for fiscal years beginning after December
15, 2020, and interim periods within fiscal years beginning
after December 15, 2021. Adoption of this ASU is not
expected to have a material impact on PEFCO.
In August 2016, the FASB issued ASU 2016-15 – Statement
of Cash Flows (Topic 230): Classification of Certain Cash
Receipts and Cash Payments. The purpose of the ASU
is to reduce diversity in practice regarding eight specific
cash flow issues. The amendments are effective for private
companies for fiscal years beginning after December 15,
2018, and interim periods within fiscal years beginning after
December 15, 2019. Adoption of this ASU is not expected
to have a material impact on PEFCO.
In January 2015, FASB issued ASU No. 2015-01 – Income
Statement – Extraordinary and Unusual Items (Subtopic
225-20): Simplifying Income Statement Presentation by
Eliminating the Concept of Extraordinary Items as part of
its initiative to reduce complexity in accounting standards.
This ASU eliminates the concept of extraordinary items
from U.S. GAAP, and concludes that existing presentation
and disclosure guidance for items that are unusual in nature
will be expanded to include items that are both unusual in
nature and infrequently occurring. This update is effective
for fiscal years beginning after December 15, 2015, for
both public business entities and all other entities. A
reporting entity may apply the changes prospectively or
retrospectively. Early adoption is permitted. Adoption of
this guidance is not expected to have a material impact
on PEFCO.
P E F C O A N N U A L R E P O R T 2 0 1 6N O T E S T O F I N A N C I A L S T A T E M E N T S
3 7

4. INVESTMENT SECURITIES
In August 2015, FASB issued ASU 2015-14 – Revenue
from Contracts with Customers (Topic 606) which deferred
by one year the effective date of ASU 2014-09 of the
same title. The purpose of the ASU is to provide a
comprehensive, industry-neutral revenue recognition model
intended to increase financial statement comparability
across companies and industries, and significantly reduce
the complexity inherent in today’s revenue recognition
guidance. This ASU affects any entity that enters into
contracts to transfer goods or services, or enters into
contracts for the transfer of nonfinancial assets unless those
contracts are within the scope of other standards (e.g.,
leases, insurance contracts, financial instruments). ASU
2015-15 defers the effective date of ASU 2014-09 for private
companies to annual reporting periods beginning after
December 15, 2018, and interim reporting periods within
annual reporting periods beginning after December 15,
2019. Earlier adoption is permitted for an annual reporting
period beginning after December 15, 2016. Management
is continuing to assess the effect of this ASU on PEFCO.
In April 2015, FASB issued ASU No. 2015-03 – Interest –
Imputation of Interest (Subtopic 835-30): Simplifying the
Presentation of Debt Issuance Costs which requires debt
issuance costs related to a recognized debt liability be
presented in the balance sheet as a direct reduction from
the carrying amount of that debt liability, consistent with
debt discounts. For private companies, the amendments
in this ASU are effective for financial statements issued for
fiscal years beginning after December 15, 2015, and interim
periods within fiscal years beginning after December 15,
2016. Application is prospective and applicable disclosures
for a change in accounting principle are required. Early
adoption is permitted for financial statements that have
not been previously issued. Application is prospective.
Adoption of this guidance is not expected to have a
material impact on PEFCO.
In August 2015, FASB issue ASU No. 2015-15, – Interest
– Imputation of Interest (Subtopic 835-30): Presentation
and Subsequent Measurement of Debt Issuance Costs
Associated with Line-of-Credit Arrangements. As ASU
No. 2015-03 does not address presentation or subsequent
measurement of debt issuance costs related to line-of-
credit arrangements, ASU 2015-15 adds a paragraph from
the SEC Staff announcement at the June 18, 2015 Emerging
Issues Task Force meeting in which the SEC announced
no objection to an entity deferring and presenting debt
issuance costs as an asset and subsequently amortizing
the deferred debt issuance costs ratably over the term
of the line-of-credit arrangement, regardless of whether
there are any outstanding borrowings on the line-of-credit
arrangement. This amendment to ASU 2015-03 is not
expected to have a material impact on PEFCO.
September 30, 2016
Available for Sale (in thousands)Amortized
Cost
Gross Unrealized
Gains
Gross Unrealized
LossesFair
Value (a)AverageYield (b)
U.S. Treasury Securities Maturity in one year or less $ 509,928 $ 117 $ 11 $ 510,034 0.41% Maturity after one year through five years 75,378 125 11 75,492 0.91%U.S. Guaranteed Securities (c)
Maturity in one year or less 27,827 6 53 27,780 0.99% Maturity after one year through five years 52,525 308 65 52,768 1.66% Maturity after five years through ten years 50,974 95 354 50,715 2.33% Maturity after ten years 65,404 376 207 65,573 2.15%
Total Available for Sale Securities $ 782,036 $ 1,027 $ 701 $ 782,362 0.83%
P E F C O A N N U A L R E P O R T 2 0 1 6N O T E S T O F I N A N C I A L S T A T E M E N T S
3 8

in 2015 amounted to $613 thousand (gross gains of $624
thousand and gross losses of $11 thousand). Net gains
from available for sale securities sold in 2014 amounted to
$952 thousand (gross gains of $1.2 million and gross losses
of $278 thousand).
Cash proceeds from the sales of available for sale securities
during 2016, 2015, and 2014 were $190.6 million, $56.9
million, and $76.5 million, respectively. Net gains from
available for sale securities sold in 2016 amounted to $2.1
million (gross gains of $2.1 million and gross losses of $42
thousand). Net gains from available for sale securities sold
These investment securities are U.S. Guaranteed Securities
backed by the full faith and credit of the U.S. government.
The unrealized losses on these investments resulted from
the movement in the yield curve and are not credit related.
PEFCO believes that it is more likely than not that all
amounts due under the contractual terms of the investment
will be collected.
September 30, 2015(In thousands)
Less than 12 months
12 months or more
Fair Value
Unrealized Losses
Fair Value
Unrealized Losses
U.S. Guaranteed Securities $ 57,676 $ 241 $ 36,237 $ 546
Total temporarily impaired securities $ 57,676 $ 241 $ 36,237 $ 546
September 30, 2016(In thousands)
Less than 12 months
12 months or more
Fair Value
Unrealized Losses
Fair Value
Unrealized Losses
U.S. Guaranteed Securities $ 141,361 $ 168 $ 38,398 $ 533
Total temporarily impaired securities $ 141,361 $ 168 $ 38,398 $ 533
The following table provides the gross unrealized losses and fair value aggregated by investment category and length of time the individual securities have been in a continuous unrealized loss position.
(a) The fair value of PEFCO’s portfolio of investment securities is based on independent dealer quotations.(b) The average yield is based on effective rates on carrying values at the end of the year.(c) These securities are explicitly guaranteed by the U.S. and include securities issued by the Government National Mortgage Association, the Overseas Private Investment Corporation, and the Small Business Association.
September 30, 2015
Available for Sale (in thousands)Amortized
Cost
Gross Unrealized
Gains
Gross Unrealized
LossesFair
Value (a)AverageYield (b)
U.S. Guaranteed Securities (c)
Maturity in one year or less $ 32,986 $ 73 $ 2 $ 33,057 0.69% Maturity after one year through five years 79,715 510 170 80,055 1.48% Maturity after five years through ten years 80,203 338 450 80,091 1.96% Maturity after ten years 34,448 54 165 34,337 1.69%Equity Securities 127 361 — 488 —
Total Available for Sale Securities $ 227,479 $ 1,336 $ 787 $ 228,028 1.57%
P E F C O A N N U A L R E P O R T 2 0 1 6N O T E S T O F I N A N C I A L S T A T E M E N T S
3 9

5. LENDING PROGRAMS
(In thousands) Outstanding Loans Undisbursed Commitments
Export loans guaranteed or insured by Ex-Im Bank Amount Average Rate Amount
Direct & Secondary Long-term Loan Programs Fixed-rate $ 4,596,748(b) 3.06% $ — (b)
Floating-rate 2,069,770(a) — (a)
Short-term & Medium-term Loan Programs Fixed-rate 35,895 2.83% 15,730(b)
Floating-rate 73,427(a) 20,097(a)
$ 6,775,840 $ 35,827Loans insured by OPIC Long-term Floating-rate 30,000(a) (c)
Medium-term Fixed-rate 2,379(c) 5.78% Medium-term Floating-rate 57,208(a) (c) 8,243(a) (c)
$ 89,587 $ 8,243
Total $ 6,865,427 $ 44,070
(a) The base interest rate is the London Interbank Offered Rate (“LIBOR”).(b) The interest rate will be determined upon pricing (Direct and Secondary) / disbursement (Short and Medium-term).(c) These transactions are unconditionally guaranteed by the sovereign governments involved and are fully insured by OPIC against the non-honoring of such sovereign guarantees.
(In thousands) Outstanding Loans Undisbursed Commitments
Export loans guaranteed or insured by Ex-Im Bank Amount Average Rate Amount
Direct & Secondary Long-term Loan Programs Fixed-rate $ 5,406,234(b) 3.14% $ — (b)
Floating-rate 2,063,003(a) 168,922(a)
Short-term & Medium-term Loan Programs Fixed-rate 42,995 2.94% 24,402(b)
Floating-rate 134,650(a) 90,353(a)
$ 7,646,882 $ 283,677Loans insured by OPIC Long-term Floating-rate 45,000(a) (c)
Medium-term Fixed-rate 3,246(c) 5.78% Medium-term Floating-rate 80,595(a) (c) 15,565(a) (c)
$ 128,841 $ 15,565
Total $ 7,775,723 $ 299,242
(a) The base interest rate is the London Interbank Offered Rate (“LIBOR”).(b) The interest rate will be determined upon pricing (Direct and Secondary) / disbursement (Short and Medium-term).(c) These transactions are unconditionally guaranteed by the sovereign governments involved and are fully insured by OPIC against the non-honoring of such sovereign guarantees.
Loans outstanding at September 30, 2016, and related undisbursed commitments are classified as follows:
Loans outstanding at September 30, 2015, and related undisbursed commitments are classified as follows:
P E F C O A N N U A L R E P O R T 2 0 1 6N O T E S T O F I N A N C I A L S T A T E M E N T S
4 0

Under the liquidity support program, PEFCO supports both
medium and long-term U.S. agency-guaranteed financing
facilities by providing liquidity support during the waiting
period prior to payment by the agency under its guarantee
and by funding interim notes until securitization of the
agency- guaranteed debt is effected. PEFCO’s liquidity
support advance, if any, will be repaid and is secured by the
agency’s guarantee and, in certain instances, by deposits
held by a trustee. PEFCO supported no transactions as of
September 30, 2016 and September 30, 2015.
6. SHORT-TERM NOTESAt September 30, 2016 and 2015, PEFCO’s Short-term
notes consisted of commercial paper in the amount of $2.1
billion and $2.2 billion, respectively. Commercial paper is
generally issued in amounts not less than $100 thousand
and with maturities of 270 days or less.
Short-term notes averaged approximately $2.2 billion in
2016 and 2015. The average interest rate was 0.54% in 2016
and 0.27% in 2015.
PEFCO has three syndicated revolving credit facilities in
place with 15 banks, of which 12 are shareowners, totaling
$1.55 billion: a 364-day facility for $1.02 billion, a three-year
$272 million facility expiring in 2018, and a three-year $256
million facility expiring in 2019. At September 30, 2016, there
were no amounts outstanding under any facility.
Outstanding loans are scheduled for repayment at September 30, 2016 as follows (in thousands):
2017 $ 1,065,123
2018 1,042,798
2019 988,065
2020 922,453
2021 811,280
2022 and thereafter 2,035,708
Total before Fair Value Hedge Adjustment
and Unamortized Discount $ 6,865,427
Fair Value Hedge Adjustment 169,953
Unamortized Discount (6,596)
Total Carrying Value $ 7,028,784
Outstanding loans are scheduled for repayment at September 30, 2015 as follows (in thousands):
2016 $ 1,120,372
2017 1,039,290
2018 1,027,087
2019 988,852
2020 879,357
2021 and thereafter 2,720,765
Total before Fair Value Hedge Adjustment
and Unamortized Discount $ 7,775,723
Fair Value Hedge Adjustment 184,456
Unamortized Discount (6,657)
Total Carrying Value $ 7,953,522
P E F C O A N N U A L R E P O R T 2 0 1 6N O T E S T O F I N A N C I A L S T A T E M E N T S
4 1

7. LONG-TERM SECURED NOTESSecured Notes typically have original maturities of five
years or longer and are sold through underwriters. Lead
underwriters are often also shareowners of PEFCO. The
principal of all Secured Notes is fully backed by collateral
assets held in a trust arrangement residing on the books of
PEFCO. Collateral assets include U.S. Treasury Securities
or other obligations unconditionally guaranteed or fully
insured by the United States or agencies of the United
States, and foreign importer notes supported directly by
export loan guarantees by Ex-Im under the 1971 Guarantee
Agreement. The securities and notes are assigned to,
and held by, The Bank of New York Mellon (a shareowner
of PEFCO), as Trustee. The collateral includes scheduled
maturities which ensure that, before the date on which
payment of principal of each Secured Note is due, the
Trustee will have cash from maturing collateral sufficient to
pay the principal of the Secured Notes. Payment of interest
on the Secured Notes is fully guaranteed by Ex-Im in return
for which PEFCO pays to Ex-Im a semi-annual fee expensed
ratably over the year.
PEFCO did not issue any Secured Notes in 2016 and
issued $575 million of Secured Notes in 2015. The average
principal balance of Long-term Secured Notes was
approximately $6,656 million in 2016 and $6,593 million
in 2015. The average interest cost for the year ended
September 30, 2016 was 2.78% compared to 2.93% for
the year ended September 30, 2015. A summary of the
Secured Note maturities as of September 30, 2016 and
September 30, 2015 appears below.
As noted above, the principal cash flows arising from the
collateral pool backing each Secured Note series must
mature before the due date when the Secured Note
principal is due. The principal cash flows are segregated
between designated installments (pledged in the trust
against existing Secured Note issuances) and free
installments (pledged in the Trust arrangement but not
designated currently against any existing Secured Note
issuances). Designated installments in excess of a Secured
Note principal redemption are available to back the next
scheduled Secured Note redemption. Free installments
are available collateral for pledging against future Secured
Note issuances, or transferring out of the trust if held as
current cash.
The pledged collateral backing the Secured Notes
at September 30, 2016 consists of $5,796 million in
foreign importer notes (export loans) backed by the
1971 Guarantee and $400 million in U.S. Government
guaranteed securities. Total pledged assets including cash
are $6,360 million against the balance of Secured Notes
outstanding of $6,125 million. For designated installments
at September 30, 2016, the amount of principal installments
in excess of Secured Note principal redemption amounted
to $16 million. For free installments at September 30, 2016,
principal installments available after May 4, 2025 amount to
$220 million.
Remaining Maturities of Long-term Secured Notes at September 30, 2016 are as follows (in thousands):
2017 $ 850,000
2018 1,000,000
2019 1,000,000
2020 725,000
2021 —
2022 and thereafter 2,550,000
Total Outstanding Principal Amount $ 6,125,000
Fair Value Hedge Adjustment 253,367
Unamortized Premium 11,352
Unamortized Discount (6,387)
Total Carrying Value $ 6,383,332
Remaining Maturities of Long-term Secured Notes at September 30, 2015 are as follows (in thousands):
2016 $ 650,000
2017 850,000
2018 1,000,000
2019 1,000,000
2020 725,000
2021 and thereafter 2,550,000
Total Outstanding Principal Amount $ 6,775,000
Fair Value Hedge Adjustment 232,678
Unamortized Premium 15,297
Unamortized Discount (8,063)
Total Carrying Value $ 7,014,912
P E F C O A N N U A L R E P O R T 2 0 1 6N O T E S T O F I N A N C I A L S T A T E M E N T S
4 2

Long-term Secured Notes outstanding as of September 30, 2016 (in thousands):
Issue Designation
Original Principal Amount
Principal Amount
Coupon Rate
Effective Rate (a)(b)
Maturity Schedule
Designated Collateral
InstallmentsAs a % of Principal
Principal Due Within
One Year
Series W $ 100,000 $ 100,000 5.00% 5.01% Dec-16 $ 648,087 648% $ 100,000Series FF 500,000 500,000 1.38% 1.24% Feb-17 703,469 141% 500,000Series X 250,000 250,000 5.45% 5.47% Sep-17 704,095 282% 250,000Series CC 500,000 500,000 2.25% 2.10% Dec-17 680,571 136% —Series JJ 500,000 500,000 1.88% 1.91% Jul-18 687,301 137% —Series Z 500,000 500,000 4.38% 4.25% Mar-19 761,682 152% —Series HH 500,000 500,000 1.45% 1.47% Aug-19 639,351 128% —Series LL 400,000 400,000 2.25% 2.29% Mar-20 602,624 151% —Series MM 325,000 325,000 2.30% 2.35% Sep-20 606,386 187% —Series BB 500,000 500,000 4.30% 4.23% Dec-21 1,172,168 234% —Series EE 500,000 500,000 2.80% 2.71% May-22 918,513 184% —Series II 400,000 400,000 2.05% 2.07% Nov-22 695,143 174% —Series KK 500,000 500,000 3.55% 3.51% Jan-24 790,264 158% —Series GG 400,000 400,000 2.45% 2.48% Jul-24 450,703 113% —Series NN 250,000 250,000 3.25% 3.26% Jun-25 265,714 106% —
$ 6,125,000 $ 6,125,000 2.79% 2.76% $ 850,000
(a) Forward gains and losses and original issue discounts and premiums are reflected in the effective interest rate.(b) Weighted average
Long-term Secured Notes outstanding as of September 30, 2015 (in thousands):
Issue Designation
Original Principal Amount
Principal Amount
Coupon Rate
Effective Rate (a)(b)
Maturity Schedule
Designated Collateral
InstallmentsAs a % of Principal
Principal Due Within
One Year
Series U $ 350,000 $ 350,000 4.95% 4.60% Nov-15 $ 462,507 132% $ 350,000Series DD 300,000 300,000 2.13% 2.15% Jul-16 689,501 230% 300,000Series W 100,000 100,000 5.00% 5.01% Dec-16 778,806 779% —Series FF 500,000 500,000 1.38% 1.24% Feb-17 835,555 167% —Series X 250,000 250,000 5.45% 5.47% Sep-17 842,929 337% —Series CC 500,000 500,000 2.25% 2.10% Dec-17 825,576 165% —Series JJ 500,000 500,000 1.88% 1.91% Jul-18 839,153 168% —Series Z 500,000 500,000 4.38% 4.25% Mar-19 920,052 184% —Series HH 500,000 500,000 1.45% 1.47% Aug-19 798,417 160% —Series LL 400,000 400,000 2.25% 2.29% Mar-20 735,797 188% —Series MM 325,000 325,000 2.30% 2.35% Sep-20 749,655 231% —Series BB 500,000 500,000 4.30% 4.23% Dec-21 1,297,499 259% —Series EE 500,000 500,000 2.80% 2.71% May-22 1,039,926 208% —Series II 400,000 400,000 2.05% 2.07% Nov-22 807,931 202% —Series KK 500,000 500,000 3.55% 3.51% Jan-24 876,519 175% —Series GG 400,000 400,000 2.45% 2.48% Jul-24 520,617 130% —Series NN 250,000 250,000 3.25% 3.26% Jun-25 262,515 105% —
$ 6,775,000 $ 6,775,000 2.88% 2.83% $ 650,000
(a) Original issue discounts and premiums are reflected in the effective interest rate.(b) Weighted average
P E F C O A N N U A L R E P O R T 2 0 1 6N O T E S T O F I N A N C I A L S T A T E M E N T S
4 3

8. SHAREOWNERS’ EQUITYCommon stock outstanding amounted to $39.0 million at
September 30, 2016 and September 30, 2015, and shares
issued and outstanding amounted to 17,786 at each
period end.
Net (loss) income per share was $(33.46) in fiscal 2016,
$126.28 in fiscal 2015 and $371.37 in fiscal 2014. Weighted
average shares outstanding amounted to 17,786 for 2016,
2015 and 2014.
Under an agreement with Ex-Im Bank effective December
16, 2010, PEFCO has approval to declare or pay dividends
of up to 50% of annual net income, subject to the following:
(i) the shareowners’ equity of PEFCO, after giving effect to
such dividend, is maintained at a minimum of $60 million
(excluding the impact on shareowners’ equity of market
value accounting for investment securities and for cash
flow hedges); (ii) PEFCO maintains, after giving effect to
such dividend, a leverage ratio of guaranteed assets to
shareowners’ equity not in excess of 75 to 1; and (iii) PEFCO
maintains an AAA rating from a major rating agency on all
secured debt issued.
The Board of Directors voted to declare a $12 dividend per
share for the fiscal year ended September 30, 2015, and a
$29 dividend per share in the fiscal year ended September
30, 2014. There was no dividend declared in the fiscal year
ended September 30, 2016.
The Company has not recorded any uncertain tax positions
as of September 30, 2016 and 2015. The Company does
not expect its uncertain tax position balance to change
significantly in the next 12 months. The Company is no
longer subject to examinations by taxing authorities for all
fiscal years prior to the one ended September 30, 2013.
would be realized in the future, no valuation allowance
was required as of September 30, 2016 and 2015. This
determination was made based upon the evidence of prior
year earnings as well as expected future earnings.
9. INCOME TAXES
Included in other assets and deferred charges at September
30, 2016 is a net deferred tax asset of $3,014 thousand
($2,565 thousand in 2015). PEFCO determined that, as
it was more likely than not that such deferred tax asset
Currently, there are no examinations in progress and the
Company has not been notified of any future examination
by applicable taxing authorities.
There are no significant matters affecting the comparability
of the income tax information presented above.
The following table is an analysis of the deferred tax assets/liabilities for the years ended September 30:
2016 2015
(In thousands) Deferred Asset (Liability) Deferred Asset (Liability)
Total deferred assets $ 3,395 $ 3,110
Total deferred liabilities (381) (545)
Net deferred assets $ 3,014 $ 2,565
The provision for income taxes is as follows for the years ended September 30:
(In thousands) 2016 2015 2014
Federal-current $ (127) $ 1,555 $ 3,844
Federal-deferred (220) (392) (410)
$ (347) $ 1,163 $ 3,434
A comparison of the U.S. Federal statutory tax rate to the effective income tax rate is as follows for the years ended September 30,
2016 2015 2014
Tax at statutory rate 34.0% 34.0% 34.0%
Effective income tax rate 36.9% 34.1% 34.2%
P E F C O A N N U A L R E P O R T 2 0 1 6N O T E S T O F I N A N C I A L S T A T E M E N T S
4 4

10. EMPLOYEE BENEFIT PLANSPEFCO has a funded, noncontributory qualified defined
benefit pension plan covering all full-time employees
and an unfunded, noncontributory, nonqualified pension
plan which provides defined pension benefits to certain
employees. Pension benefits are based primarily upon the
participants’ compensation and years of credited service.
The following table sets forth changes in benefit obligation, plan assets, funded status and net periodic benefit cost of each plan:
Qualified Plan Nonqualified Plan
(In thousands) 2016 2015 2016 2015
Change in Benefit Obligation
Benefit obligation at beginning of year $ 11,332 $ 9,999 $ 5,483 $ 4,920
Service cost 766 715 — 173
Interest cost 464 353 218 169
Actuarial loss 824 389 583 527
Benefits paid (151) (124) (372) (306)
Benefit obligation at end of year $ 13,235 $ 11,332 $ 5,912 $ 5,483
Change in Plan Assets
Fair value of plan assets at beginning of year $ 9,684 $ 9,338 $ — $ —
Actual return on plan assets 1,055 (30) — —
Employer contributions 525 500 372 306
Benefits paid (151) (124) (372) (306)
Fair value of plan assets at end of year $ 11,113 $ 9,684 $ — $ —
Funded status at end of year (a) $ 2,122 $ 1,648 $ 5,912 $ 5,483
(a) These amounts were recognized as liabilities in the Consolidated Statements of Financial Condition as of September 30, 2016 and 2015.
Amounts Recognized in Accumulated Other Comprehensive Income
Net loss $ 2,564 $ 2,414 $ 2,245 $ 1,729
Prior service cost — (3) (3) (186)
$ 2,564 $ 2,411 $ 2,242 $ 1,543
P E F C O A N N U A L R E P O R T 2 0 1 6N O T E S T O F I N A N C I A L S T A T E M E N T S
4 5

The net periodic pension cost for 2016, 2015 and 2014 in
the table below reflects the actuarial-determined expense.
Discount rate assumptions used for pension plan
accounting reflect prevailing rates available on high-
quality, fixed –income debt instruments with maturities that
match the benefit obligation. For each pension plan, the
weighted average discount rates used in the measurement
of the benefit obligation were 3.47% in 2016, 4.12% in 2015
and 3.55% in 2014 and the weighted average rate of pay
increase was 4.00% in 2016, 2015 and 2014. The weighted
average discount rates used to determine the net periodic
pension costs were 4.12% in 2016, 3.55% in 2015 and 4.25%
in 2014 for both plans. The expected long-term rate of
return on assets for the qualified plan was 5.00% in 2016,
2015 and 2014.
The assets of the qualified plan are currently invested in a
balanced fund. The asset allocation of the balanced fund
consists of approximately 70% in equity securities and
30% in debt securities. At September 30, 2016 and 2015,
the majority of plan assets were invested in Level 1 asset
classes with the remainder in Level 2 asset classes. The
funding objectives of the pension plan are to achieve and
maintain plan assets adequate to cover the accumulated
benefit obligation and to provide competitive investment
returns and reasonable risk levels when measured against
appropriate benchmarks.
PEFCO also provides healthcare and life insurance benefits
to eligible retired employees. Healthcare is contributory;
life insurance is noncontributory. All postretirement plans
are funded on a pay-as-you-go basis.
The Net periodic benefit cost and other amounts recognized in Other Comprehensive Income (“OCI”) follow:
Qualified Plan Nonqualified Plan
(In thousands) 2016 2015 2014 2016 2015 2014
Components of net periodic pension cost
Service cost $ 766 $ 715 $ 568 $ — $ 173 $ 141
Interest cost 464 353 354 218 169 185
Expected return on plan assets (491) (477) (415) — — —
Amortization of prior service cost (3) (4) (4) 3 5 5
Amortization of net losses 111 50 22 68 41 24
Net periodic pension cost $ 847 $ 637 $ 525 $ 289 $ 388 $ 355
Other Changes in Amounts Recognized in OCI(1)
Net loss $ 261 $ 896 $ 502 $ 583 $ 527 $ 250
Amortization of (gain) (111) (50) (22) (68) (41) (24)
Amortization of prior service cost 3 4 4 (3) (5) (5)
Total Recognized in OCI $ 153 $ 850 $ 484 $ 512 $ 481 $ 221
(1) Before taxes at PEFCO’s effective tax rate of approximately 34%.
P E F C O A N N U A L R E P O R T 2 0 1 6N O T E S T O F I N A N C I A L S T A T E M E N T S
4 6

The following table sets forth changes in Benefit obligation, Funded status and Net periodic benefit cost of the postretirement plans:
(In thousands) 2016 2015
Change in benefit obligation
Benefit obligation at beginning of year $ 2,029 $ 3,785
Service cost 148 277
Interest cost 88 163
Plan participants’ contributions 30 38
Actuarial (gain) (482) (2,158)
Benefits paid (56) (76)
Benefit obligation at end of year $ 1,757 $ 2,029
Change in plan assets
Fair value of plan assets at beginning of year $ — $ —
Employer contribution 26 38
Plan participants’ contributions 30 38
Benefits paid (56) (76)
Fair value of plan assets at end of year — —
Funded status at end of year (a) $ 1,757 $ 2,029
(a) These amounts were recognized as liabilities in the Consolidated Statements of Financial Condition at September 30, 2016 and 2015.
Amounts Recognized in Accumulated Other Comprehensive Income
Net (gain) $ (1,878) $ (1,515)
Prior service (credit) (77) (124)
$ (1,955) $ (1,639)
The Net periodic benefit cost and other amounts recognized in Other Comprehensive Income (“OCI”) follow:
(In thousands) 2016 2015 2014
Components of periodic postretirement benefit cost
Service cost $ 148 $ 277 $ 320
Interest cost 88 163 175
Amortization of prior service (credit) (48) (47) (47)
Amortization of net gains/(losses) (119) 26 54
Net periodic postretirement benefit cost $ 69 $ 419 $ 502
Other Changes in Amounts Recognized in OCI(1)
Net (gain) $ (482) $ (2,158) $ (241)
Amortization of prior service credit 48 47 47
Amortization of actuarial gain/(loss) 119 (26) (54)
Total Recognized in OCI $ (315) $ (2,137) $ (248)
(1) Before taxes at PEFCO’s effective tax rate of approximately 34%.
P E F C O A N N U A L R E P O R T 2 0 1 6N O T E S T O F I N A N C I A L S T A T E M E N T S
4 7
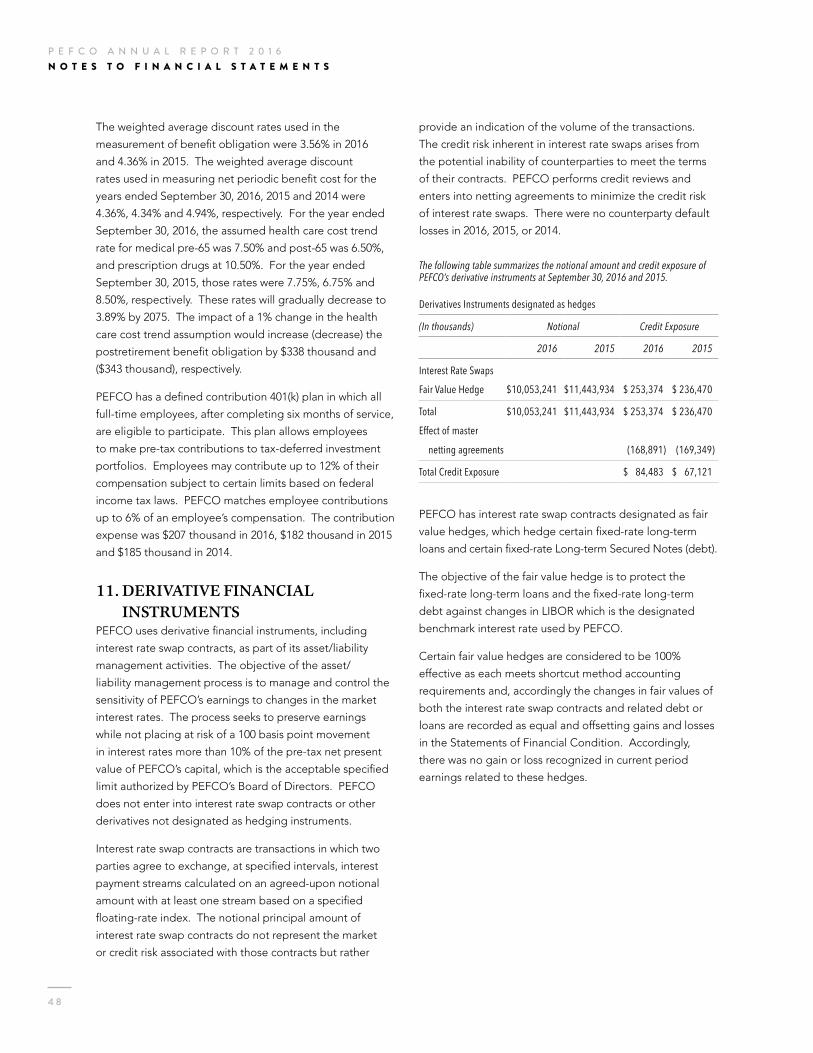
The weighted average discount rates used in the
measurement of benefit obligation were 3.56% in 2016
and 4.36% in 2015. The weighted average discount
rates used in measuring net periodic benefit cost for the
years ended September 30, 2016, 2015 and 2014 were
4.36%, 4.34% and 4.94%, respectively. For the year ended
September 30, 2016, the assumed health care cost trend
rate for medical pre-65 was 7.50% and post-65 was 6.50%,
and prescription drugs at 10.50%. For the year ended
September 30, 2015, those rates were 7.75%, 6.75% and
8.50%, respectively. These rates will gradually decrease to
3.89% by 2075. The impact of a 1% change in the health
care cost trend assumption would increase (decrease) the
postretirement benefit obligation by $338 thousand and
($343 thousand), respectively.
PEFCO has a defined contribution 401(k) plan in which all
full-time employees, after completing six months of service,
are eligible to participate. This plan allows employees
to make pre-tax contributions to tax-deferred investment
portfolios. Employees may contribute up to 12% of their
compensation subject to certain limits based on federal
income tax laws. PEFCO matches employee contributions
up to 6% of an employee’s compensation. The contribution
expense was $207 thousand in 2016, $182 thousand in 2015
and $185 thousand in 2014.
11. DERIVATIVE FINANCIAL INSTRUMENTS
PEFCO uses derivative financial instruments, including
interest rate swap contracts, as part of its asset/liability
management activities. The objective of the asset/
liability management process is to manage and control the
sensitivity of PEFCO’s earnings to changes in the market
interest rates. The process seeks to preserve earnings
while not placing at risk of a 100 basis point movement
in interest rates more than 10% of the pre-tax net present
value of PEFCO’s capital, which is the acceptable specified
limit authorized by PEFCO’s Board of Directors. PEFCO
does not enter into interest rate swap contracts or other
derivatives not designated as hedging instruments.
Interest rate swap contracts are transactions in which two
parties agree to exchange, at specified intervals, interest
payment streams calculated on an agreed-upon notional
amount with at least one stream based on a specified
floating-rate index. The notional principal amount of
interest rate swap contracts do not represent the market
or credit risk associated with those contracts but rather
provide an indication of the volume of the transactions.
The credit risk inherent in interest rate swaps arises from
the potential inability of counterparties to meet the terms
of their contracts. PEFCO performs credit reviews and
enters into netting agreements to minimize the credit risk
of interest rate swaps. There were no counterparty default
losses in 2016, 2015, or 2014.
PEFCO has interest rate swap contracts designated as fair
value hedges, which hedge certain fixed-rate long-term
loans and certain fixed-rate Long-term Secured Notes (debt).
The objective of the fair value hedge is to protect the
fixed-rate long-term loans and the fixed-rate long-term
debt against changes in LIBOR which is the designated
benchmark interest rate used by PEFCO.
Certain fair value hedges are considered to be 100%
effective as each meets shortcut method accounting
requirements and, accordingly the changes in fair values of
both the interest rate swap contracts and related debt or
loans are recorded as equal and offsetting gains and losses
in the Statements of Financial Condition. Accordingly,
there was no gain or loss recognized in current period
earnings related to these hedges.
Derivatives Instruments designated as hedges
(In thousands) Notional Credit Exposure
2016 2015 2016 2015
Interest Rate Swaps
Fair Value Hedge $10,053,241 $11,443,934 $ 253,374 $ 236,470
Total $10,053,241 $11,443,934 $ 253,374 $ 236,470
Effect of master
netting agreements (168,891) (169,349)
Total Credit Exposure $ 84,483 $ 67,121
The following table summarizes the notional amount and credit exposure of PEFCO’s derivative instruments at September 30, 2016 and 2015.
P E F C O A N N U A L R E P O R T 2 0 1 6N O T E S T O F I N A N C I A L S T A T E M E N T S
4 8

Certain fair value hedges do not meet shortcut accounting
requirements and accordingly, the extent to which these
instruments are effective at achieving offsetting changes
in fair value must be assessed at least quarterly. Any
ineffectiveness must be recorded in current period earnings.
From time to time, PEFCO has interest rate swap contracts
designated as cash flow hedges, which offset the variability
in cash flows arising from the rollover of short-term notes
(liabilities). The cash flow hedges are considered to be
highly effective and accordingly, the changes in the cash
flows of the interest rate swap contracts have been, and are
expected to continue to be, highly effective at offsetting
the changes in the cash flows of the short-term liabilities.
Any ineffectiveness must be recorded in the current period
earnings. The gains and losses deemed to be effective
are recorded in accumulated other comprehensive income
(loss), net of applicable income taxes. PEFCO had no
interest rate swap contracts outstanding designated as
cash flow hedges for the years ended September 30, 2016
and 2015.
The following table presents the effect of PEFCO’s derivative instruments in cash flow hedging relationships on the Statements of Operations:
Loss (Gain) Recognized in Other Comprehensive
Income (OCI) on Derivatives, net of tax (Effective Portion)
Loss (Gain) Reclassified from OCI into
Total Financing Expense
(In thousands) 2016 2015 2014 2016 2015 2014
Interest Rate Swaps $ — $ — $ (2,229) $ — $ — $ —
The following table presents the effect of PEFCO’s derivative instruments on the Statements of Financial Condition:
Asset Derivatives Fair Value (a) Liability Derivatives Fair Value (b)
Derivatives designated as hedges (in thousands) 2016 2015 2016 2015
Interest Rate Swaps (c) $ 253,374 $ 236,470 $ 168,891 $ 186,587
Total $ 253,374 $ 236,470 $ 168,891 $ 186,587Effect of master netting agreements (168,891) (169,349) (168,891) (169,349)
Total reported on the Consolidated Statementsof Financial Condition $ 84,483 $ 67,121 $ — $ 17,238
(a) Reported as “Other assets and deferred charges” on the Statements of Financial Condition(b) Reported as “Accrued expenses and other liabilities” on the Statements of Financial Condition(c) Fair Values are on a gross basis, before consideration of master netting agreements as required by ASC 815-10 (d) As of September 30, 2016, PEFCO had deposited margin of approximately $20.7 million related to 184 cleared transactions with a portfolio market value of
$59.0 million, compared to initial margin requirement of $18.9 million, resulting in excess margin of approximately $60.8 million. The aggregate notional principal on the cleared swaps amounted to $10.1 billion at September 30, 2016. PEFCO received/paid no cash collateral in connection with uncleared derivative transactions in 2016 and 2015.
Ineffectiveness (in thousands) Year ended September 30,
Interest Rate Swaps 2016 2015 2014
Fair Value Hedge $ (592) $ (621) $ (429)
Cash Flow Hedge — — 123
Total $ (592) $ (621) $ (306)
Ineffectiveness related to derivatives and hedging relationships was recorded in net financing revenue as follows:
P E F C O A N N U A L R E P O R T 2 0 1 6N O T E S T O F I N A N C I A L S T A T E M E N T S
4 9

12. FAIR VALUE MEASUREMENTSPEFCO is required to report fair value measurements for
specialized classes of assets and liabilities and utilizes a
three-level valuation hierarchy established under U.S. GAAP
for disclosure of fair value measurements.
The valuation hierarchy is based on the transparency of
inputs to the valuation of an asset or liability as of the
measurement date.
The three-level hierarchy for fair value measurement is
defined as follows:
1. Valuations based on unadjusted quoted prices in
active markets for identical assets or liabilities that
PEFCO has the ability to access. Since valuations
are based on quoted prices that are readily and
regularly available in an active market, valuation of
these products does not entail a significant degree
of judgment. U.S. Treasury securities and equity
securities are included in Level 1.
2. Level 2 – Valuations based on one or more quoted
prices in markets that are not active or for which all
significant inputs are observable, either directly or
indirectly. Level 2 securities consist of U.S. Guaranteed
Securities and interest rate swaps.
3. Level 3 – Valuations based on inputs that are
unobservable and significant to the overall fair
value measurement.
September 30, 2016 (in thousands)
Assets Measured at Fair Value on a Recurring Basis
Quoted Prices in Active
Market (Level 1)
Prices w/Other Observable
Inputs (Level 2)
Prices w/Significant Unobservable
Inputs (Level 3) Netting (a) Total
Investment securities available for sale $ 585,526 $ 196,836 $ — $ — $ 782,362
Interest rate swaps — 253,374 — (168,891) 84,483
Total Assets at Fair Value $ 585,526 $ 450,210 $ — $ (168,891) $ 866,845
Liabilities Measured at Fair Value on a Recurring BasisInterest rate swaps $ — $ 168,891 $ — $ (168,891) $ —
Total Liabilities at Fair Value $ — $ 168,891 $ — $ (168,891) $ —
September 30, 2015 (in thousands)
Assets Measured at Fair Value on a Recurring Basis
Quoted Prices in Active
Market (Level 1)
Prices w/Other Observable
Inputs (Level 2)
Prices w/Significant Unobservable
Inputs (Level 3) Netting (a) Total
Investment securities available for sale $ 488 $ 227,540 $ — $ — $ 228,028
Interest rate swaps — 236,470 — (169,349) 67,121
Total Assets at Fair Value $ 488 $ 464,010 $ — $ (169,349) $ 295,149
Liabilities Measured at Fair Value on a Recurring BasisInterest rate swaps $ — $ 186,587 $ — $ (169,349) $ 17,238
Total Liabilities at Fair Value $ — $ 186,587 $ — $ (169,349) $ 17,238
(a) PEFCO has elected to net unrealized gains (receivables) and unrealized losses (payables) when a legally enforceable master netting agreement exists.
P E F C O A N N U A L R E P O R T 2 0 1 6N O T E S T O F I N A N C I A L S T A T E M E N T S
5 0

Investment securities - The fair value of investment
securities available for sale are recorded at fair value on the
balance sheet. The fair value is generally determined using
market prices provided by data providers (level 1) or dealer
quotations (level 2).
Interest rate swaps - The fair values were based on model
valuations (level 2) using market-based inputs. The fair
value generally reflects the estimated amounts that PEFCO
would receive or pay to replace the contracts at the
reporting date.
PEFCO did not have any assets or liabilities that were
measured at fair value on a recurring basis using significant
unobservable inputs (Level 3) during the years ended
September 30, 2016 and 2015. PEFCO did not have any
assets or liabilities that were measured at fair value on a
non-recurring basis during the years ended September 30,
2016 and 2015.
There were no transfers between Level 1 and Level 2 during
the years ended September 30, 2016 and 2015.
13. RELATED PARTY TRANSACTIONSCertain shareowners (or their affiliates) have provided and
presently provide a variety of commercial banking services
to PEFCO. PEFCO paid $2.0 million in underwriting fees
related to the issuance of Long-term Secured Notes in
2015 and $3.7 million in 2014. No Long-term Secured
Notes were issued in 2016. Fees paid for liquidity back-up
lines were $2.1 million in 2016, $2.4 million in 2015, and
$2.4 million in 2014. In 2016, PEFCO also paid $0.6 million
for other commercial banking services compared to $0.7
million in 2015 and 2014. During 2016, PEFCO purchased
loans in the secondary market from shareowners amounting
to $268.2 million compared with $390.3 million in 2015.
All transactions with related parties were conducted at
arms length.
(In thousands) September 30, 2016 September 30, 2015
Receivable, net $ 38,758 $ 24,071
Payable, net — $ (11,916)
PEFCO has derivative contracts with certain shareholders broken out as follows:
P E F C O A N N U A L R E P O R T 2 0 1 6N O T E S T O F I N A N C I A L S T A T E M E N T S
5 1

15. OPERATING LEASEPEFCO has executed as lessee an operating lease for the
rental of office space through fiscal 2020. Rent holidays
and rent escalation clauses are recognized on a straight-
line basis over the lease term. Leasehold improvements
incentives are recorded as leasehold improvements and
amortized over the shorter of their economic lives or the
term of the lease. For the years ended September 30,
2016, 2015 and 2014, PEFCO recorded lease expense
related to these agreements of $642 thousand, $640
thousand and $615 thousand, respectively, which is
included in the accompanying Statements of Operations in
Administration expenses.
Future minimum lease payments under the lease as of September 30, 2016 are as follows (in thousands)
14. GENERAL AND ADMINISTRATIVE EXPENSESThe breakdown of the General and Administrative Expenses are as follows:
2017 $ 634
2018 634
2019 634
2020 95
Total $ 1,997
Year Ended September 30,
(In thousands) 2016 2015 2014
Compensation and benefits $ 6,315 $ 6,603 $ 6,680
Administration 2,985 2,790 2,905
Professional fees 1,508 1,317 1,115
Total $ 10,808 $ 10,710 $ 10,700
P E F C O A N N U A L R E P O R T 2 0 1 6N O T E S T O F I N A N C I A L S T A T E M E N T S
5 2
TO THE BOARD OF DIRECTORS AND SHAREOWNERS OF PRIVATE EXPORT FUNDING CORPORATIONPrivate Export Funding Corporation (“PEFCO”) maintains
a system of internal control over financial reporting which
is designed to provide reasonable assurance regarding the
preparation of reliable published financial statements. The
system contains self-monitoring mechanisms, and actions
are taken to correct deficiencies as they are identified.
Even an effective internal control system, no matter how
well designed, has inherent limitations – including the
possibility of the circumvention or overriding of controls
– and therefore can provide only reasonable assurance
with respect to financial statement preparation. Further,
because of changes in con ditions, internal control system
effectiveness may vary over time.
PEFCO’s management assessed its internal control over
financial reporting as of September 30, 2016, in relation to
criteria for effective internal control based on criteria
established in Internal Control-Integrated Framework (2013)
issued by the Committee of Sponsor ing Organizations
of the Treadway Commission. Based on this assessment,
PEFCO believes that, as of September 30, 2016, its system
of internal control over financial reporting was effective.
Timothy C. Dunne
PRESIDENT & CHIEF EXECUTIVE OFFICER
January 5, 2017
Robert T. O’Neill
VICE PRESIDENT & CONTROLLER
January 5, 2017
P E F C O A N N U A L R E P O R T 2 0 1 6
5 3
M A N A G E M E N T ’ S R E P O R T O N I N T E R N A L C O N T R O L O V E R F I N A N C I A L R E P O R T I N G

In thousands, except per share amounts Year ended September 30,
Loan Commitments 2016 2015 2014 2013 2012
Commitments for year $ 292,000 $ 1,995,000 $ 1,562,000 $ 1,927,000 $ 2,154,000
Commitments, cumulative from inception 36,111,000
Selected Assets
Cash and investment securities $ 1,494,699 $ 1,322,373 $ 1,900,779 $ 1,151,099 $ 877,946
Export loans guaranteed or insured by Ex-Im Bank 6,939,197 7,824,681 7,301,740 7,080,129 7,217,526
Loans insured by OPIC 89,587 128,841 158,484 190,302 234,284
Selected Liabilities
Short-term notes $ 2,088,674 $ 2,179,281 $ 2,175,814 $ 2,191,479 $ 2,194,408
Long-term Secured Notes 6,383,332 7,014,912 7,074,619 6,105,908 6,067,586
Other Financial Data
Net (loss) income $ (595) $ 2,246 $ 6,605 $ 6,828 $ 6,286
Net (loss) income per share (33.46) 126.28 371.37 388.29 385.74
Dividends — 213 516 516 506
Average shareowners’ equity 147,917 147,104 143,257 133,867 114,854
Return on average shareowners’ equity (0.40%) 1.53% 4.61% 5.10% 5.47%
P E F C O A N N U A L R E P O R T 2 0 1 6
5 4
F I V E - Y E A R F I N A N C I A L D A T A

INDEPENDENT AUDIT FEESPEFCO currently utilizes the services of Deloitte & Touche
LLP (PricewaterhouseCoopers LLP in 2015) for audit, other
audit-related services and tax services. PEFCO’s Audit
Committee is responsible for the pre-approval of all audit
and permitted audit-related and tax services performed by
the independent auditors. The fees incurred in 2016 and
2015 were as follows:
Service 2016 2015
Audit $ 393,500 $ 365,466
Audit-related
Secured Note issuances — 13,333
Substitutions of collateral 22,500 10,000
Audit-related 22,500 23,333Tax 70,000 126,500
Total $ 486,000 $ 515,299
P E F C O A N N U A L R E P O R T 2 0 1 6
5 5
I N D E P E N D E N T A U D I T F E E S

Samir PandiriExecutive Vice President and CEOAsset ServicingBNY MELLON
Directors
Richard S. Aldrich, Jr. (1) (4)
Retired PartnerSKADDEN, ARPS, SLATE, MEAGHER & FLOM, LLP
Mary K. Bush (3) (5)
ChairmanBUSH INTERNATIONAL, LLC
David A. Dohnalek (2) (5)
Senior Vice President Finance and TreasurerTHE BOEING COMPANY
Andrew J. O’BrienHead of Global Loan Capital StrategyJ.P. MORGAN
(1) Member of the Executive Committee
(2) Member of the Audit Committee
(3) Member of the Nominating and Governance Committee
(4) Member of the Compensation and Management Development Committee
(5) Member of the Risk Policy Committee
(6) Mr. Dunne is an ex-officio member of the Audit Committee and Compensation and Management Development Committee
John A. McAdams (2) (3)
CEOEXWORKS CAPITAL, LLC
Benjamin M. Friedman (1) (5)
William Joseph Maier Professor of Political EconomyHARVARD UNIVERSITY
William R. Rhodes (1) (4)
PresidentWILLIAM R. RHODES GLOBAL ADVISORS, INC.
Rita M. Rodriguez (2) (5)
Former Ex-Im Bank DirectorPaul Simpson (2) (5)
Global Head of Equity Asset ServicesBANK OF AMERICA MERRILL LYNCH
Francesco Vanni d’Archirafi (3) (4)
Chief Executive OfficerCITI HOLDINGS
Timothy C. Dunne (1) (3) (5) (6)
Chairman, President & Chief Executive OfficerPEFCO
P E F C O A N N U A L R E P O R T 2 0 1 6
5 6
B O A R D O F D I R E C T O R S
The Advisory Board provides feedback to Management
on loan policy, lending rate policy, scope of activities,
relationships with borrowers, commercial banks, other
co-lenders, Ex-Im Bank and on such other matters as
Terina GolfinosManaging DirectorING Capital LLC
Kristi KimSenior DirectorBoeing Capital Corporation
John KingSenior Vice PresidentTextron Financial
Phillips LeeManaging DirectorSociete General
Jeff CainManaging DirectorSiemens Financial Services
Carla CamposDirectorHSBC Securities (USA), Inc.
Valerie ColvillePrincipalCC Solutions
Piers ConstableDirectorDeutsche Bank AG
Raj DaryananiDirectorBNP Paribas
Louis DouadyManaging DirectorNatixis
Bruce DrossmanSenior Vice PresidentGeneral Electric
Valentino GalloManaging DirectorCiticorp Global Markets
Patrick GangExecutive DirectorJP Morgan Chase Bank
Tim GaulInternational Export Finance ManagerCaterpillar Financial
Tom McCaffreyManaging DirectorWells Fargo Bank
John NebloHead of Export FinanceInvestec USA Holdings
Brian PelanManager – Customer FinanceSikorsky Aircraft Corporation
Jeffrey WindlandVice President & Asst. TreasurerOrbital Science Corp.
Advisory Board
Management may request. Their guidance and strong
support contribute greatly to the success of PEFCO and are
highly appreciated. We are also appreciative of the active
participation of Ex-Im Bank.
P E F C O A N N U A L R E P O R T 2 0 1 6
5 7
A D V I S O R Y B O A R D

Vincent J. HermanVice President
Officers
Ann Marie MilanoVice President & Secretary
Timothy C. DunneChairman, President & Chief Executive Officer
Robert T. O’NeillVice President & Controller
Gordon L. HoughSenior Vice President
Francoise M. RenierisAssistant Vice President
Melinda A. ScottAssistant Vice President
David T. AttisaniAssistant Vice President
Rajgopalan NandkumarSenior Vice President & Treasurer
P E F C O A N N U A L R E P O R T 2 0 1 6
5 8
O F F I C E R S

PEFCO’s stock is owned by 26 commercial banks, one
financial services company, and six industrial companies.
In the case of the commercial banks, the shares are
owned directly or through an affiliate. Ownership and
transferability of the common stock of PEFCO are
restricted to “Qualified Investors”. As defined in the
By-laws, a “Qualified Investor” is a financial institution or
a corporation engaged in producing or exporting United
States products or services. Under PEFCO’s By-laws, no
shareowner may own more than 18% of the outstanding
shares. The following is a list of shareowners as of
September 30, 2016:
Commercial Banks Number of Shares
Bank of America 1,924
The Bank of Miami, N.A. 280
The Bank of New York Mellon 702
Bank of the West 79
Brown Brothers Harriman & Co. 38
Citibank, N.A. 1,507
Citizens Financial Group, Inc. 1,549
Deutsche Bank 1,066
HSBC USA Inc. 441
ING Capital LLC 267
Investec Investments Ltd. 108
JPMorgan Chase & Co. 2,937
Key Bank 165
MUFG Union Bank N.A. 93
Natixis 738
Paribas North America, Inc. 367
PNC Bank Corp. 503
Regions Bank 20
Silicon Valley Bancshares 42
Société Générale 100
Standard Chartered Bank 300
Sterling National Bank & Trust Company 39
UBS AG 137
UPS Capital Business Credit 431
U.S. Bank N.A. 500
Wells Fargo & Company 816
Financial Services Companies Number of Shares
Assured Guaranty Corp. 212
Industrial Companies Number of Shares
ABB, Inc. 80
The Boeing Company 1,425
General Electric Company 567
KBR, Inc. 113
Textron Inc. 40United Technologies Corporation 200
Total 17,786
P E F C O A N N U A L R E P O R T 2 0 1 6
5 9
P E F C O S H A R E O W N E R S
Private Export Funding Corporation280 Park Avenue, New York, NY 10017
Telephone: (212) 916-0300
Facsimile: (212) 286-0304
Internetwww.pefco.com
Common StockPEFCO is its own transfer agent and registrar for
its common stock, and accordingly, all transfers of stock
must be coordinated through PEFCO.
For inquiries, contact:
Ann Marie Milano, Vice President & Secretary
(212) 916-0314
Financial Information About PEFCO, Contact:Robert T. O’Neill
Vice President & Controller
(212) 916-0333
Long-term Secured NotesThe Bank of New York Mellon is trustee, registrar, transfer
agent and paying agent for all outstanding issues of
PEFCO’s Secured Notes.
Short-term NotesBank of America, National Association, is the issuing and
paying agent for PEFCO’s commercial paper.
For inquiries regarding Long-term and Short-term Notes, Contact:Raj Nandkumar
Senior Vice President & Treasurer
(212) 916-0334
For Specific Inquiries Concerning PEFCO’s Lending Programs, Contact:Gordon L. Hough
Senior Vice President
(212) 916-0332
Vincent J. Herman
Vice President
(212) 916-0327
Independent AuditorsDeloitte & Touche LLP
30 Rockefeller Plaza
New York, NY 10112
Legal CounselShearman & Sterling LLP
599 Lexington Avenue
New York, NY 10022
Annual Meeting4:30 p.m., Thursday December 1, 2016
280 Park Avenue, 4th Floor
New York, NY 10017
To Contact Any of the Board of Directors Please Mail Correspondence to:PEFCO
Attention (Board Member)
Office of the Secretary
280 Park Avenue, 4th Floor
New York, NY 10017
P E F C O A N N U A L R E P O R T 2 0 1 6
6 0
A D D I T I O N A L I N F O R M A T I O N


P R I V A T E E X P O R T F U N D I N G C O R P O R A T I O N 2 8 0 P A R K A V E N U E , N E W Y O R K , N Y 1 0 0 1 7W W W . P E F C O . C O M