supporting online material for -...
TRANSCRIPT

www.sciencemag.org/cgi/content/full/333/6050/1750/DC1
Supporting Online Material for
Productivity Is a Poor Predictor of Plant Species Richness
Peter B. Adler,* Eric W. Seabloom, Elizabeth T. Borer, Helmut Hillebrand, Yann Hautier, Andy Hector, W. Stanley Harpole, Lydia R. O’Halloran, James B. Grace, T.
Michael Anderson, Jonathan D. Bakker, Lori A. Biederman, Cynthia S. Brown, Yvonne M. Buckley, Laura B. Calabrese, Cheng-Jin Chu, Elsa E. Cleland, Scott L. Collins,
Kathryn L. Cottingham, Michael J. Crawley, Ellen I. Damschen, Kendi F. Davies, Nicole M. DeCrappeo, Philip A. Fay, Jennifer Firn, Paul Frater, Eve I. Gasarch, Daniel S.
Gruner, Nicole Hagenah, Janneke Hille Ris Lambers, Hope Humphries, Virginia L. Jin, Adam D. Kay, Kevin P. Kirkman, Julia A. Klein, Johannes M. H. Knops, Kimberly J. La Pierre, John G. Lambrinos, Wei Li, Andrew S. MacDougall, Rebecca L. McCulley, Brett A. Melbourne, Charles E. Mitchell, Joslin L. Moore, John W. Morgan, Brent Mortensen,
John L. Orrock, Suzanne M. Prober, David A. Pyke, Anita C. Risch, Martin Schuetz, Melinda D. Smith, Carly J. Stevens, Lauren L. Sullivan, Gang Wang, Peter D. Wragg,
Justin P. Wright, Louie H. Yang
*To whom correspondence should be addressed. E-mail: [email protected]
Published 23 September 2011, Science 333, 1750 (2011)
DOI: 10.1126/science.1204498
This PDF file includes:
Materials and Methods Figs. S1 to S3 Tables S1 to S3 Full Reference List
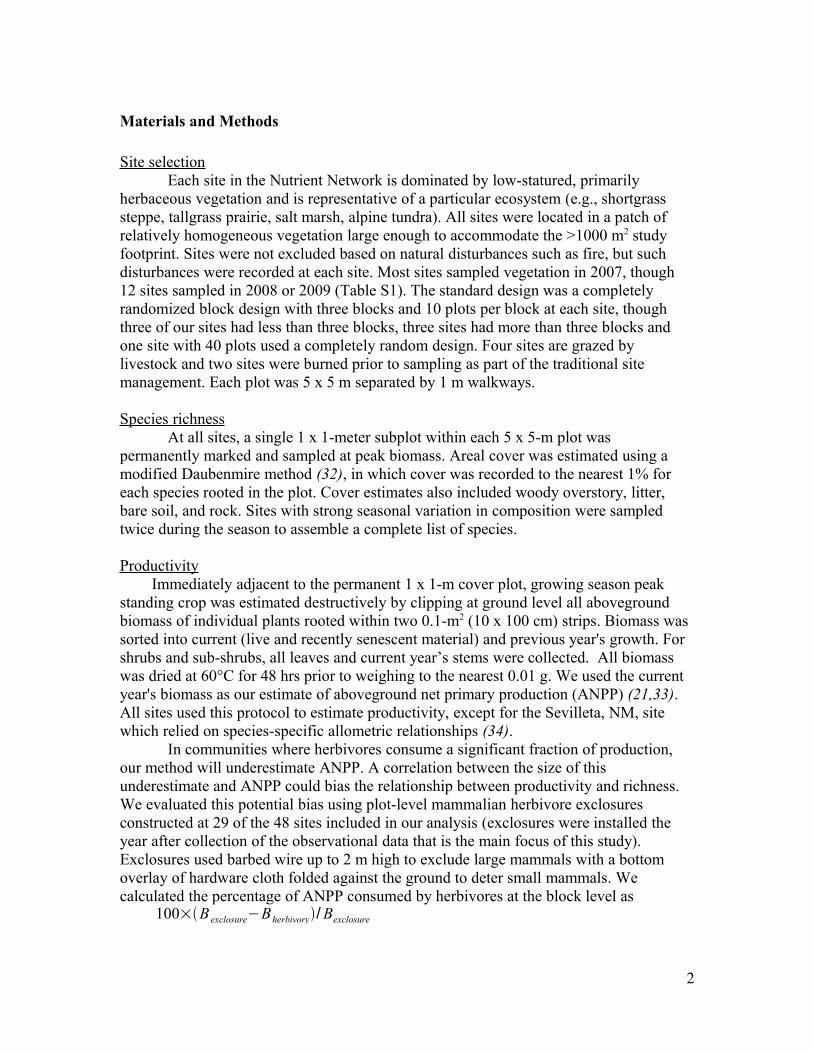
Materials and Methods
Site selectionEach site in the Nutrient Network is dominated by low-statured, primarily
herbaceous vegetation and is representative of a particular ecosystem (e.g., shortgrass steppe, tallgrass prairie, salt marsh, alpine tundra). All sites were located in a patch of relatively homogeneous vegetation large enough to accommodate the >1000 m2 study footprint. Sites were not excluded based on natural disturbances such as fire, but such disturbances were recorded at each site. Most sites sampled vegetation in 2007, though 12 sites sampled in 2008 or 2009 (Table S1). The standard design was a completely randomized block design with three blocks and 10 plots per block at each site, though three of our sites had less than three blocks, three sites had more than three blocks and one site with 40 plots used a completely random design. Four sites are grazed by livestock and two sites were burned prior to sampling as part of the traditional site management. Each plot was 5 x 5 m separated by 1 m walkways.
Species richnessAt all sites, a single 1 x 1-meter subplot within each 5 x 5-m plot was
permanently marked and sampled at peak biomass. Areal cover was estimated using a modified Daubenmire method (32), in which cover was recorded to the nearest 1% for each species rooted in the plot. Cover estimates also included woody overstory, litter, bare soil, and rock. Sites with strong seasonal variation in composition were sampled twice during the season to assemble a complete list of species.
ProductivityImmediately adjacent to the permanent 1 x 1-m cover plot, growing season peak
standing crop was estimated destructively by clipping at ground level all aboveground biomass of individual plants rooted within two 0.1-m2 (10 x 100 cm) strips. Biomass was sorted into current (live and recently senescent material) and previous year's growth. For shrubs and sub-shrubs, all leaves and current year’s stems were collected. All biomass was dried at 60°C for 48 hrs prior to weighing to the nearest 0.01 g. We used the current year's biomass as our estimate of aboveground net primary production (ANPP) (21,33). All sites used this protocol to estimate productivity, except for the Sevilleta, NM, site which relied on species-specific allometric relationships (34).
In communities where herbivores consume a significant fraction of production, our method will underestimate ANPP. A correlation between the size of this underestimate and ANPP could bias the relationship between productivity and richness. We evaluated this potential bias using plot-level mammalian herbivore exclosures constructed at 29 of the 48 sites included in our analysis (exclosures were installed the year after collection of the observational data that is the main focus of this study). Exclosures used barbed wire up to 2 m high to exclude large mammals with a bottom overlay of hardware cloth folded against the ground to deter small mammals. We calculated the percentage of ANPP consumed by herbivores at the block level as
100×B exclosure−Bherbivory/Bexclosure
2

where Bexclosure and Bherbivory are live biomass inside and outside of exclosures, respectively. We then averaged this measure of consumption across blocks within each site. We set negative values of consumption, reflecting higher average biomass outside the exclosures, equal to zero. Percent consumption was less than 20% for all but four sites (two of which had only one exclosure) and was uncorrelated with ANPP (Figure S1).
Statistical analysisIn preliminary analyses, we noticed potential outlier data points. We evaluated
and removed these outliers using a two-step procedure. First, we flagged data points with values of Cook's distance (a measure of influence) greater than 1 in the within-site quadratic regressions. Second, we tested whether removal of these data points altered the hypothesis tests of the within-site regressions (as described below). We removed four data points (from four sites) that changed the outcome of a hypothesis test as follows: one concave-down pattern became positive linear, one nonsignificant became concave-down, one linear became nonsignificant, and one concave-up became nonsignificant. All of our final analyses were conducted after removal of the outliers.
To explore the relationship between productivity and species richness among plots within each site, we first fit a model in which species richness was a linear and quadratic function of live biomass. If the quadratic term was not significant at the α=0.1 level, we dropped the quadratic term and fit a model containing only the linear term. If the linear term was not significant at α=0.1, we classified the relationship as nonsignificant. This approach, which is consistent with previous meta-analyses (13,14), emphasizes hypothesis testing of the quadratic term rather than overall model fit. Nevertheless, we found that the results were consistent with an information-theoretic approach using Akaike's Information Criteria (not shown). We chose the liberal α=0.1 level of significance because we wanted our conclusions about the lack of a general pattern to be conservative.
Our response variable, counts of species richness, is not strictly normally-distributed (Gaussian). Therefore, we first fit Poisson regressions in a generalized-linear model framework. After finding that the data for almost all the sites were under-dispersed (deviance/df <<1), we then refit all the models with both Gaussian and quasipoisson approaches. These two approaches led to almost identical patterns in the frequency of nonsignificant, linear, and quadratic models. Given that the choice of error distribution did not affect our conclusions, we chose to focus on the results from the Gaussian models, consistent with previous work on PRR's (14), but we do describe the quasipoisson results in the main text.
To describe the regional and global scale across-site relationships between productivity and species richness, we regressed the mean number of species m-2 on the mean biomass production m-2 at each site. We then repeated the hypothesis tests of the quadratic and linear terms as in the within-site analysis described above. We repeated these regressions for subsets of sites with different management histories. We did not conduct additional Poisson regressions for these site-averaged data because they met the assumptions of normality better than the individual plot data.
We performed quantile regressions to test for relationships between maximum richness and productivity at the within-site and global scales. We used the rq() function
3

of the quantreg package in R v.2.10.0. Although we only report results for the 0.95 quantile, we also tested the 0.7, 0.8 and 0.9 quantiles. We performed hypothesis tests using the bootstrap option with 10000 replications.
4

Fig. S1.No correlation between consumption and aboveground net primary production (ANPP) estimated in exclosures at 29 sites. Consumption (%) is estimated as 100*(biomass in exclosures – biomass in open plots)/(biomass in exclosures). The red symbols indicate sites where consumption was negative (higher biomass outside the exclosures than inside); we set these values to zero.
5

Fig. S2Within-site productivity-species richness relationships. Regression lines (black) are shown only for models with significant (P<0.1) linear or quadratic terms. Dashed red lines show quadratic regressions (0.95 quantile) with significant (P<0.1) linear or quadratic terms. Titles refer to the Code column in Table S1.
6

Fig. S3The relationship between mean productivity and maximum richness (filled circles) at each site. Vertical lines indicate the difference between mean and maximum richness at each site.
7

Table S1Additional information on the 48 study sites.Site Code Year Habitat Nation Lat.1 Lon.2 m.a.s.l.3 PPT4 Winter low5 Summer high6
amcamp.us 1 2007 MESIC GRASSLAND USA 48.47 -123.01 41 672 2.0 21.5azi.cn 2 2007 ALPINE GRASSLAND China 33.58 101.53 3500 620 -13.0 32.0barta.us 3 2007 MIXEDGRASS PRAIRIE USA 42.24 -99.65 767 568 -13.1 29.9bldr.us 4 2008 SHORTGRASS PRAIRIE USA 39.97 -105.23 1633 482 -6.0 29.5bnch.us 5 2007 MONTANE MEADOW USA 44.28 -121.97 1500 2160 -1.3 30.2bogong.au 6 2006 ALPINE GRASSLAND Australia -36.87 147.25 1760 1217 -3 17.4bttr.us 7 2007 MONTANE MEADOW USA 44.28 -121.96 1500 2160 -1.3 30.2burrawan.au 8 2008 SEMIARID GRASSLAND Australia -27.73 151.14 425 600 4.7 33.5cbgb.us 9 2009 TALLGRASS PRAIRIE USA 41.79 -93.43 275 891 -11.8 30.4cdcr.us 10 2007 TALLGRASS PRAIRIE USA 45.40 -93.20 270 800 -16.8 26.9cdpt.us 11 2007 SHORTGRASS PRAIRIE USA 41.20 -101.63 965 470 -9.4 32.1cowi.ca 12 2007 SAVANNA Canada 48.46 -123.38 50 1039 -1.1 23.3derr.au 13 2007 SEMIARID GRASSLAND Australia -37.81 144.79 38 544 4.9 25.6fnly.us 14 2007 MESIC GRASSLAND USA 44.41 -123.28 68 1200 0.9 27.3frue.sw 15 2008 PASTURE Switzerland 47.37 8.55 995 1102 -8.6 26.9gilb.za 16 2009 MESIC GRASSLAND South Africa -29.28 30.29 1748 867 3.0 28.0glac.us 17 2007 MESIC GRASSLAND USA 46.87 -123.03 33 1300 0.6 25.3hall.us 18 2007 TALLGRASS PRAIRIE USA 36.96 -86.73 194 1282 -4.1 31.6hart.us 19 2007 SHRUB STEPPE USA 42.72 -119.50 1508 305 -5.7 30.0hast.us 20 2007 ANNUAL GRASSLAND USA 36.20 -121.55 750 550 6.3 20.1hnvr.us 21 2007 OLD FIELD USA 43.42 -72.14 271 919 -13.5 27.4hopl.us 22 2007 ANNUAL GRASSLAND USA 39.01 -123.06 416.67 940 2.8 32.6
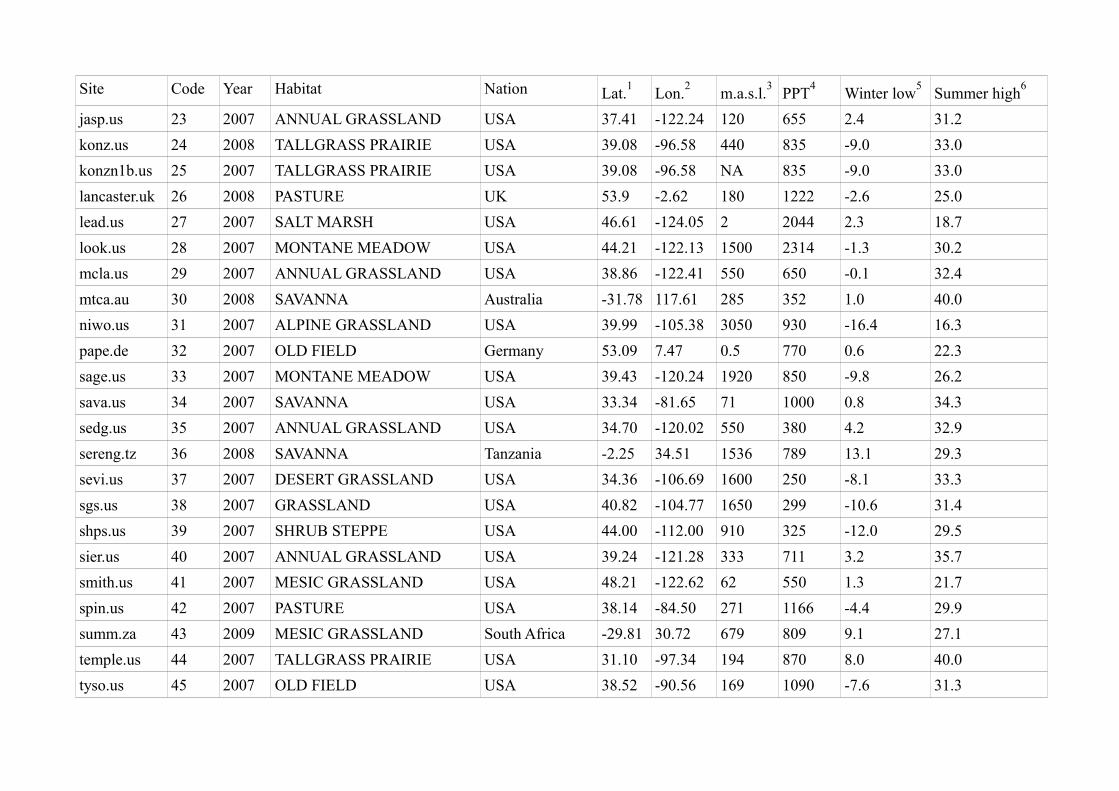
Site Code Year Habitat Nation Lat.1 Lon.2 m.a.s.l.3 PPT4 Winter low5 Summer high6
jasp.us 23 2007 ANNUAL GRASSLAND USA 37.41 -122.24 120 655 2.4 31.2konz.us 24 2008 TALLGRASS PRAIRIE USA 39.08 -96.58 440 835 -9.0 33.0konzn1b.us 25 2007 TALLGRASS PRAIRIE USA 39.08 -96.58 NA 835 -9.0 33.0lancaster.uk 26 2008 PASTURE UK 53.9 -2.62 180 1222 -2.6 25.0lead.us 27 2007 SALT MARSH USA 46.61 -124.05 2 2044 2.3 18.7look.us 28 2007 MONTANE MEADOW USA 44.21 -122.13 1500 2314 -1.3 30.2mcla.us 29 2007 ANNUAL GRASSLAND USA 38.86 -122.41 550 650 -0.1 32.4mtca.au 30 2008 SAVANNA Australia -31.78 117.61 285 352 1.0 40.0niwo.us 31 2007 ALPINE GRASSLAND USA 39.99 -105.38 3050 930 -16.4 16.3pape.de 32 2007 OLD FIELD Germany 53.09 7.47 0.5 770 0.6 22.3sage.us 33 2007 MONTANE MEADOW USA 39.43 -120.24 1920 850 -9.8 26.2sava.us 34 2007 SAVANNA USA 33.34 -81.65 71 1000 0.8 34.3sedg.us 35 2007 ANNUAL GRASSLAND USA 34.70 -120.02 550 380 4.2 32.9sereng.tz 36 2008 SAVANNA Tanzania -2.25 34.51 1536 789 13.1 29.3sevi.us 37 2007 DESERT GRASSLAND USA 34.36 -106.69 1600 250 -8.1 33.3sgs.us 38 2007 GRASSLAND USA 40.82 -104.77 1650 299 -10.6 31.4shps.us 39 2007 SHRUB STEPPE USA 44.00 -112.00 910 325 -12.0 29.5sier.us 40 2007 ANNUAL GRASSLAND USA 39.24 -121.28 333 711 3.2 35.7smith.us 41 2007 MESIC GRASSLAND USA 48.21 -122.62 62 550 1.3 21.7spin.us 42 2007 PASTURE USA 38.14 -84.50 271 1166 -4.4 29.9summ.za 43 2009 MESIC GRASSLAND South Africa -29.81 30.72 679 809 9.1 27.1temple.us 44 2007 TALLGRASS PRAIRIE USA 31.10 -97.34 194 870 8.0 40.0tyso.us 45 2007 OLD FIELD USA 38.52 -90.56 169 1090 -7.6 31.3

Site Code Year Habitat Nation Lat.1 Lon.2 m.a.s.l.3 PPT4 Winter low5 Summer high6
ukul.za 46 2009 MESIC GRASSLAND South Africa -29.67 30.40 842.5 838 8.8 26.4unc.us 47 2007 OLD FIELD USA 35.91 -79.06 141 1210 -2.6 31.7valm.sw 48 2008 ALPINE GRASSLAND Switzerland 46.63 10.37 2320 950 -15.7 17.0
1Latitude2Longitude3meters above sea level4mean annual precipitation (mm)5Mean minimum temperature in January (northern hemisphere) or July (southern hemisphere)6Mean maximum temperature in July (northern hemisphere) or January (southern hemisphere)

Table S2. Statistical results for quadratic regressions at the within-site level.
Site Mean live biomass
Mean species richness
Linear term Quadratic termcoefficient t P coefficient t P
amcamp.us 441 12.8 -0.0041 -1.34 0.191 0.00002 0.96 0.345azi.cn 369 35.3 0.0249 1.64 0.112 0.00028 1.12 0.274barta.us 206 11.8 -0.0034 -0.74 0.466 0.00005 0.98 0.333bldr.us 167 9.6 0.0028 0.44 0.667 0.00013 1.59 0.131bnch.us 142 9.4 0.0129 1.72 0.096 -0.00019 -1.49 0.148bogong.au 416 17.4 -0.0079 -2.20 0.036 -0.00002 -1.04 0.307bttr.us 231 13.9 -0.0051 -0.61 0.547 0.00007 1.06 0.299burrawan.au 272 12.5 -0.0025 -1.27 0.213 0.00001 0.86 0.399cbgb.us 247 8.0 -0.0017 -0.65 0.518 0.00000 -0.33 0.740cdcr.us 201 10.1 -0.0196 -4.82 0.000 0.00004 1.36 0.179cdpt.us 116 12.1 0.0198 4.39 0.000 -0.00002 -0.43 0.668cowi.ca 469 4.4 -0.0043 -2.28 0.031 0.00000 0.33 0.741derr.au 123 6.5 0.0145 2.59 0.015 -0.00006 -0.89 0.381fnly.us 258 21.6 -0.0135 -0.88 0.390 0.00011 0.70 0.491frue.ch 617 14.2 -0.0007 -0.40 0.693 0.00000 -0.24 0.811gilb.za 281 27.5 0.0068 0.73 0.469 0.00001 0.10 0.924glac.us 165 6.7 0.0039 0.53 0.602 -0.00001 -0.11 0.910hall.us 441 7.8 -0.0003 -0.30 0.766 0.00000 0.87 0.393hart.us 176 11.4 0.0011 0.34 0.736 0.00000 0.33 0.745hast.us 163 7.7 -0.0177 -4.75 0.000 0.00005 2.31 0.029hnvr.us 442 10.4 -0.0007 -0.17 0.863 0.00002 0.82 0.417hopl.us 150 19.1 -0.0197 -1.27 0.216 -0.00007 -0.26 0.796jasp.us 304 14.3 0.0001 0.01 0.994 -0.00020 -1.89 0.070konz.us 332 16.0 0.0005 0.08 0.937 0.00002 0.53 0.603konzn1b.us 266 30.4 -0.0484 -2.54 0.034 0.00021 0.63 0.551lancaster.uk 156 7.0 -0.0040 -0.73 0.474 -0.00008 -0.54 0.596lead.us 467 4.4 0.0051 2.86 0.008 0.00000 -0.37 0.714look.us 98 7.7 -0.0005 -0.09 0.925 0.00004 1.15 0.259mcla.us 318 3.3 -0.0026 -1.04 0.308 0.00002 1.79 0.084mtca.au 104 14.4 -0.0089 -0.78 0.441 0.00036 1.74 0.090niwo.us 113 17.8 0.0441 1.64 0.120 -0.00043 -0.64 0.531pape.de 918 3.7 -0.0003 -0.36 0.729 0.00000 -1.70 0.133sage.us 121 10.9 0.0169 1.90 0.068 0.00011 0.59 0.558

Site Mean live biomass
Mean species richness
Linear term Quadratic termcoefficient T P coefficient T P
sava.us 58 13.5 -0.0029 -0.08 0.938 -0.00003 -0.02 0.982sedg.us 197 6.2 -0.0101 -2.06 0.049 0.00002 0.26 0.800sereng.tz 308 12.6 -0.0048 -1.54 0.135 0.00000 -0.05 0.960sevi.us 89 8.4 -0.0153 -1.25 0.220 0.00031 1.17 0.249sgs.us 130 5.9 -0.0057 -0.84 0.407 0.00011 0.96 0.347shps.us 99 15.2 0.0051 0.83 0.411 -0.00003 -0.31 0.759sier.us 181 7.8 -0.0050 -0.76 0.454 -0.00011 -1.26 0.219smith.us 393 21.5 -0.0066 -1.01 0.319 0.00011 1.66 0.109spin.us 468 7.0 0.0004 0.24 0.811 -0.00001 -0.96 0.345summ.za 313 31.4 0.0024 0.37 0.711 0.00008 1.02 0.318temple.us 317 24.3 0.0059 1.11 0.276 0.00004 0.93 0.364tyso.us 441 11.9 0.0040 0.90 0.371 -0.00002 -0.62 0.542ukul.za 469 22.1 -0.0014 -0.44 0.663 -0.00001 -0.86 0.399unc.us 304 10.2 -0.0024 -0.87 0.392 0.00001 0.28 0.779valm.ch 322 25.2 0.0010 0.20 0.845 -0.00004 -1.14 0.265

References and Notes 1. J. P. Grime, Competitive exclusion in herbaceous vegetation. Nature 242, 344 (1973).
doi:10.1038/242344a0
2. M. M. Al-Mufti, C. L. Sydes, S. B. Furness, J. P. Grime, S. R. Band, A quantitative analysis of shoot phenology and dominance in herbaceous vegetation. J. Ecol. 65, 759 (1977). doi:10.2307/2259378
3. M. Huston, A general hypothesis of species diversity. Am. Nat. 113, 81 (1979). doi:10.1086/283366
4. M. A. Huston, Biological Diversity: The Coexistence of Species on Changing Landscapes (Cambridge Univ. Press, Cambridge, 1994).
5. J. B. Grace et al., Does species diversity limit productivity in natural grassland communities? Ecol. Lett. 10, 680 (2007). doi:10.1111/j.1461-0248.2007.01058.x Medline
6. M. L. Rosenzweig, Z. Abramsky, in Species Diversity in Ecological Communities (Univ. of Chicago Press, Chicago, 1993), pp. 52–65.
7. M. Kondoh, Unifying the relationships of species richness to productivity and disturbance. Proc. Biol. Sci. 268, 269 (2001). doi:10.1098/rspb.2000.1384 Medline
8. D. Tilman, Resource Competition and Community Structure (Princeton Univ. Press, Princeton, NJ, 1982).
9. D. E. Goldberg, T. E. Miller, Effects of different resource additions of species diversity in an annual plant community. Ecology 71, 213 (1990). doi:10.2307/1940261
10. D. Tilman, S. Pacala, in Species Diversity in Ecological Communities (Univ. of Chicago Press, Chicago, 1993), pp. 13–25.
11. M. Zobel, M. Pärtel, What determines the relationship between plant diversity and habitat productivity? Glob. Ecol. Biogeogr. 17, 679 (2008). doi:10.1111/j.1466-8238.2008.00400.x
12. P. A. Abrams, Monotonic or unimodal diversity-productivity gradients: What does competition theory predict? Ecology 76, 2019 (1995). doi:10.2307/1941677
13. R. Waide et al., The relationship between productivity and species richness. Annu. Rev. Ecol. Syst. 30, 257 (1999). doi:10.1146/annurev.ecolsys.30.1.257
14. G. Mittelbach et al., What is the observed relationship between species richness and productivity? Ecology 82, 2381 (2001). doi:10.1890/0012-9658(2001)082[2381:WITORB]2.0.CO;2
15. L. N. Gillman, S. D. Wright, The influence of productivity on the species richness of plants: A critical assessment. Ecology 87, 1234 (2006). doi:10.1890/0012-9658(2006)87[1234:TIOPOT]2.0.CO;2 Medline
16. R. J. Whittaker, E. Heegaard, What is the observed relationship between species richness and productivity? Comment. Ecology 84, 3384 (2003). doi:10.1890/02-3128

17. R. J. Whittaker, Meta-analyses and mega-mistakes: Calling time on meta-analysis of the species richness-productivity relationship. Ecology 91, 2522 (2010). doi:10.1890/08-0968.1 Medline
18. S. M. Scheiner et al., Species richness, species-area curves, and Simpson's paradox. Evol. Ecol. Res. 2, 791 (2000).
19. N. Gotelli, R. Colwell, Quantifying biodiversity: Procedures and pitfalls in the measurement and comparison of species richness. Ecol. Lett. 4, 379 (2001). doi:10.1046/j.1461-0248.2001.00230.x
20. Materials and methods are available as supporting material on Science Online.
21. M. Oesterheld, S. J. McNaughton, in Methods in Ecosystem Science, O. E. Sala, R. B. Jackson, H. A. Mooney, R. W. Howarth, Eds. (Springer, New York, 2000), pp. 151–157.
22. J. Grace, H. Jutila, The relationship between species density and community biomass in grazed and ungrazed coastal meadows. Oikos 85, 398 (1999). doi:10.2307/3546689
23. M. Huston, Local processes and regional patterns: Appropriate scales for understanding variation in the diversity of plants and animals. Oikos 86, 393 (1999). doi:10.2307/3546645
24. W. Ma et al., Environmental factors covary with plant diversity-productivity relationships among Chinese grassland sites. Glob. Ecol. Biogeogr. 19, 233 (2010). doi:10.1111/j.1466-8238.2009.00508.x
25. B. J. Cardinale, D. M. Bennett, C. E. Nelson, K. Gross, Does productivity drive diversity or vice versa? A test of the multivariate productivity-diversity hypothesis in streams. Ecology 90, 1227 (2009). doi:10.1890/08-1038.1 Medline
26. B. J. Cardinale, H. Hillebrand, W. S. Harpole, K. Gross, R. Ptacnik, Separating the influence of resource ‘availability’ from resource ‘imbalance’ on productivity-diversity relationships. Ecol. Lett. 12, 475 (2009). doi:10.1111/j.1461-0248.2009.01317.x Medline
27. W. S. Harpole, D. Tilman, Grassland species loss resulting from reduced niche dimension. Nature 446, 791 (2007). doi:10.1038/nature05684 Medline
28. J. M. Chase, M. A. Leibold, Spatial scale dictates the productivity-biodiversity relationship. Nature 416, 427 (2002). doi:10.1038/416427a Medline
29. T. Fukami, P. J. Morin, Productivity-biodiversity relationships depend on the history of community assembly. Nature 424, 423 (2003). doi:10.1038/nature01785 Medline
30. J. M. Chase, Stochastic community assembly causes higher biodiversity in more productive environments. Science 328, 1388 (2010); 10.1126/science.1187820. doi:10.1126/science.1187820 Medline
31. D. Hooper et al., Effects of biodiversity on ecosystem functioning: A consensus of current knowledge. Ecol. Monogr. 75, 3 (2005). doi:10.1890/04-0922
32. R. F. Daubenmire, A canopy-cover method of vegetational analysis. Northwest Sci. 33, 43 (1959).

33. W. K. Lauenroth, H. W. Hunt, D. M. Swift, J. S. Singh, Estimating aboveground net primary production in grasslands: A simulation approach. Ecol. Modell. 33, 297 (1986). doi:10.1016/0304-3800(86)90045-1
34. E. H. Muldavin, D. I. Moore, S. L. Collins, K. R. Wetherill, D. C. Lightfoot, Aboveground net primary production dynamics in a northern Chihuahuan Desert ecosystem. Oecologia 155, 123 (2008). doi:10.1007/s00442-007-0880-2 Medline