supporting information - pnas · supporting information cong et al. 10.1073/pnas.0812681106 ... 5...
TRANSCRIPT
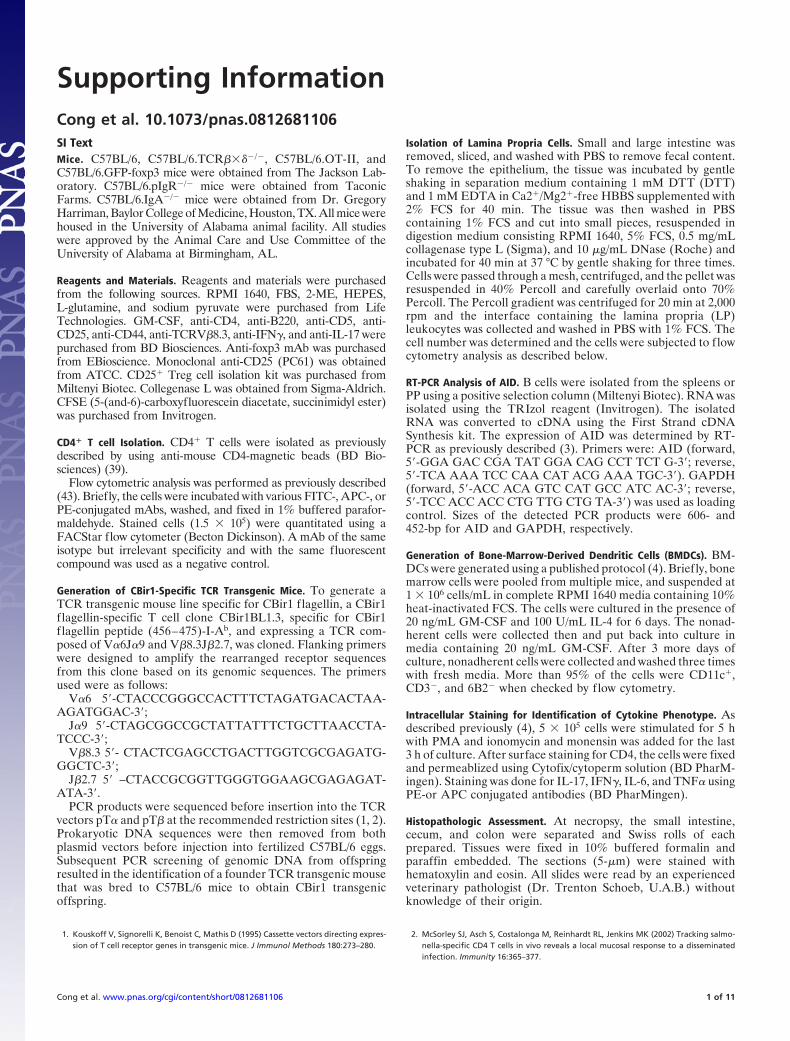
Supporting InformationCong et al. 10.1073/pnas.0812681106SI TextMice. C57BL/6, C57BL/6.TCR����/�, C57BL/6.OT-II, andC57BL/6.GFP-foxp3 mice were obtained from The Jackson Lab-oratory. C57BL/6.pIgR�/� mice were obtained from TaconicFarms. C57BL/6.IgA�/� mice were obtained from Dr. GregoryHarriman, Baylor College of Medicine, Houston, TX. All mice werehoused in the University of Alabama animal facility. All studieswere approved by the Animal Care and Use Committee of theUniversity of Alabama at Birmingham, AL.
Reagents and Materials. Reagents and materials were purchasedfrom the following sources. RPMI 1640, FBS, 2-ME, HEPES,L-glutamine, and sodium pyruvate were purchased from LifeTechnologies. GM-CSF, anti-CD4, anti-B220, anti-CD5, anti-CD25, anti-CD44, anti-TCRV�8.3, anti-IFN�, and anti-IL-17 werepurchased from BD Biosciences. Anti-foxp3 mAb was purchasedfrom EBioscience. Monoclonal anti-CD25 (PC61) was obtainedfrom ATCC. CD25� Treg cell isolation kit was purchased fromMiltenyi Biotec. Collegenase L was obtained from Sigma-Aldrich.CFSE (5-(and-6)-carboxyfluorescein diacetate, succinimidyl ester)was purchased from Invitrogen.
CD4� T cell Isolation. CD4� T cells were isolated as previouslydescribed by using anti-mouse CD4-magnetic beads (BD Bio-sciences) (39).
Flow cytometric analysis was performed as previously described(43). Briefly, the cells were incubated with various FITC-, APC-, orPE-conjugated mAbs, washed, and fixed in 1% buffered parafor-maldehyde. Stained cells (1.5 � 105) were quantitated using aFACStar flow cytometer (Becton Dickinson). A mAb of the sameisotype but irrelevant specificity and with the same fluorescentcompound was used as a negative control.
Generation of CBir1-Specific TCR Transgenic Mice. To generate aTCR transgenic mouse line specific for CBir1 flagellin, a CBir1flagellin-specific T cell clone CBir1BL1.3, specific for CBir1flagellin peptide (456–475)-I-Ab, and expressing a TCR com-posed of V�6J�9 and V�8.3J�2.7, was cloned. Flanking primerswere designed to amplify the rearranged receptor sequencesfrom this clone based on its genomic sequences. The primersused were as follows:
V�6 5�-CTACCCGGGCCACTTTCTAGATGACACTAA-AGATGGAC-3�;
J�9 5�-CTAGCGGCCGCTATTATTTCTGCTTAACCTA-TCCC-3�;
V�8.3 5�- CTACTCGAGCCTGACTTGGTCGCGAGATG-GGCTC-3�;
J�2.7 5� –CTACCGCGGTTGGGTGGAAGCGAGAGAT-ATA-3�.
PCR products were sequenced before insertion into the TCRvectors pT� and pT� at the recommended restriction sites (1, 2).Prokaryotic DNA sequences were then removed from bothplasmid vectors before injection into fertilized C57BL/6 eggs.Subsequent PCR screening of genomic DNA from offspringresulted in the identification of a founder TCR transgenic mousethat was bred to C57BL/6 mice to obtain CBir1 transgenicoffspring.
Isolation of Lamina Propria Cells. Small and large intestine wasremoved, sliced, and washed with PBS to remove fecal content.To remove the epithelium, the tissue was incubated by gentleshaking in separation medium containing 1 mM DTT (DTT)and 1 mM EDTA in Ca2�/Mg2�-free HBBS supplemented with2% FCS for 40 min. The tissue was then washed in PBScontaining 1% FCS and cut into small pieces, resuspended indigestion medium consisting RPMI 1640, 5% FCS, 0.5 mg/mLcollagenase type L (Sigma), and 10 �g/mL DNase (Roche) andincubated for 40 min at 37 °C by gentle shaking for three times.Cells were passed through a mesh, centrifuged, and the pellet wasresuspended in 40% Percoll and carefully overlaid onto 70%Percoll. The Percoll gradient was centrifuged for 20 min at 2,000rpm and the interface containing the lamina propria (LP)leukocytes was collected and washed in PBS with 1% FCS. Thecell number was determined and the cells were subjected to flowcytometry analysis as described below.
RT-PCR Analysis of AID. B cells were isolated from the spleens orPP using a positive selection column (Miltenyi Biotec). RNA wasisolated using the TRIzol reagent (Invitrogen). The isolatedRNA was converted to cDNA using the First Strand cDNASynthesis kit. The expression of AID was determined by RT-PCR as previously described (3). Primers were: AID (forward,5�-GGA GAC CGA TAT GGA CAG CCT TCT G-3�; reverse,5�-TCA AAA TCC CAA CAT ACG AAA TGC-3�). GAPDH(forward, 5�-ACC ACA GTC CAT GCC ATC AC-3�; reverse,5�-TCC ACC ACC CTG TTG CTG TA-3�) was used as loadingcontrol. Sizes of the detected PCR products were 606- and452-bp for AID and GAPDH, respectively.
Generation of Bone-Marrow-Derived Dendritic Cells (BMDCs). BM-DCs were generated using a published protocol (4). Briefly, bonemarrow cells were pooled from multiple mice, and suspended at1 � 106 cells/mL in complete RPMI 1640 media containing 10%heat-inactivated FCS. The cells were cultured in the presence of20 ng/mL GM-CSF and 100 U/mL IL-4 for 6 days. The nonad-herent cells were collected then and put back into culture inmedia containing 20 ng/mL GM-CSF. After 3 more days ofculture, nonadherent cells were collected and washed three timeswith fresh media. More than 95% of the cells were CD11c�,CD3�, and 6B2� when checked by flow cytometry.
Intracellular Staining for Identification of Cytokine Phenotype. Asdescribed previously (4), 5 � 105 cells were stimulated for 5 hwith PMA and ionomycin and monensin was added for the last3 h of culture. After surface staining for CD4, the cells were fixedand permeablized using Cytofix/cytoperm solution (BD PharM-ingen). Staining was done for IL-17, IFN�, IL-6, and TNF� usingPE-or APC conjugated antibodies (BD PharMingen).
Histopathologic Assessment. At necropsy, the small intestine,cecum, and colon were separated and Swiss rolls of eachprepared. Tissues were fixed in 10% buffered formalin andparaffin embedded. The sections (5-�m) were stained withhematoxylin and eosin. All slides were read by an experiencedveterinary pathologist (Dr. Trenton Schoeb, U.A.B.) withoutknowledge of their origin.
1. Kouskoff V, Signorelli K, Benoist C, Mathis D (1995) Cassette vectors directing expres-sion of T cell receptor genes in transgenic mice. J Immunol Methods 180:273–280.
2. McSorley SJ, Asch S, Costalonga M, Reinhardt RL, Jenkins MK (2002) Tracking salmo-nella-specific CD4 T cells in vivo reveals a local mucosal response to a disseminatedinfection. Immunity 16:365–377.
Cong et al. www.pnas.org/cgi/content/short/0812681106 1 of 11

3. Hsu HC, et al. (2007) Overexpression of activation-induced cytidine deaminase in B cellsis associated with production of highly pathogenic autoantibodies. J Immunol178:5357–5365.
4. Konrad A, Cong Y, Duck W, Borlaza R, Elson CO (2006) Tight mucosal compartmenta-tion of the murine immune response to antigens of the enteric microbiota. Gastroen-terology 130:2050–2059.
Cong et al. www.pnas.org/cgi/content/short/0812681106 2 of 11
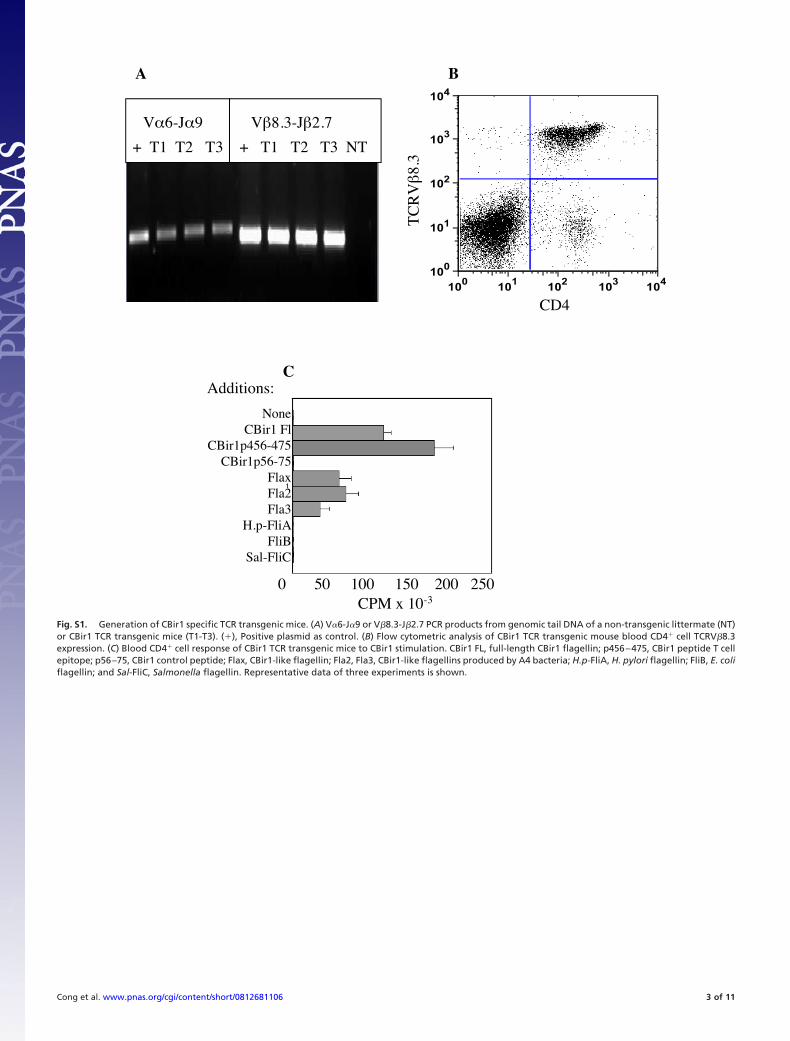
Fig. S1. Generation of CBir1 specific TCR transgenic mice. (A) V�6-J�9 or V�8.3-J�2.7 PCR products from genomic tail DNA of a non-transgenic littermate (NT)or CBir1 TCR transgenic mice (T1-T3). (�), Positive plasmid as control. (B) Flow cytometric analysis of CBir1 TCR transgenic mouse blood CD4� cell TCRV�8.3expression. (C) Blood CD4� cell response of CBir1 TCR transgenic mice to CBir1 stimulation. CBir1 FL, full-length CBir1 flagellin; p456–475, CBir1 peptide T cellepitope; p56–75, CBir1 control peptide; Flax, CBir1-like flagellin; Fla2, Fla3, CBir1-like flagellins produced by A4 bacteria; H.p-FliA, H. pylori flagellin; FliB, E. coliflagellin; and Sal-FliC, Salmonella flagellin. Representative data of three experiments is shown.
Cong et al. www.pnas.org/cgi/content/short/0812681106 3 of 11
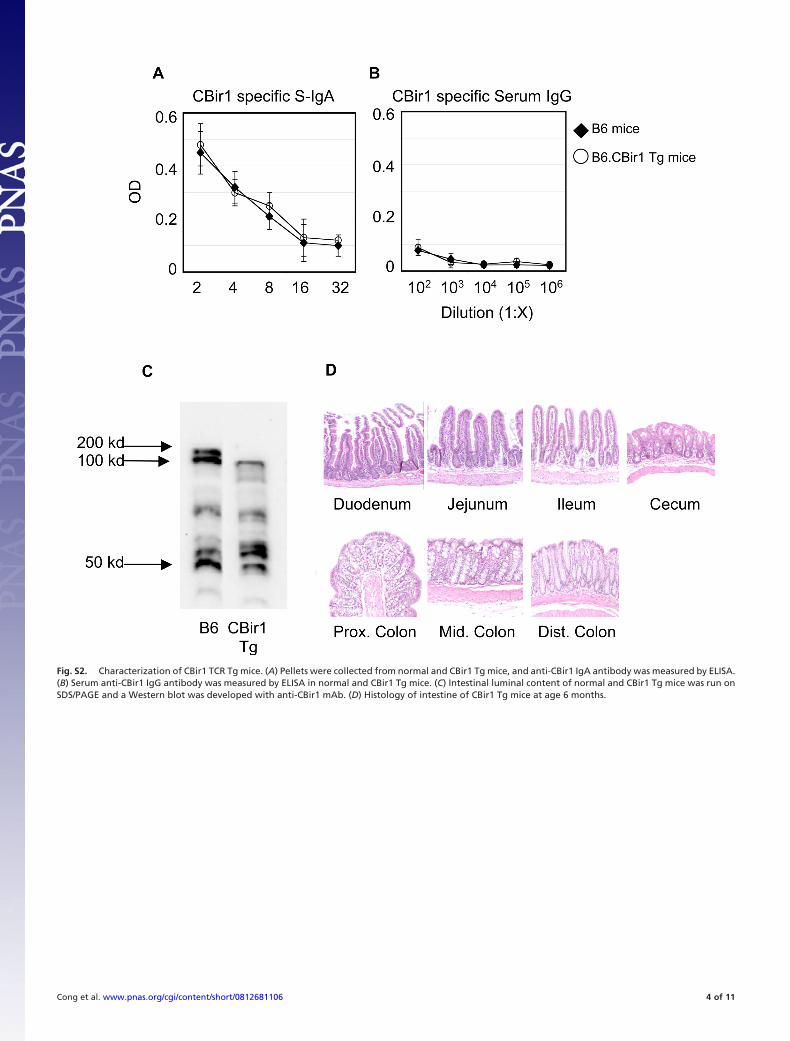
Fig. S2. Characterization of CBir1 TCR Tg mice. (A) Pellets were collected from normal and CBir1 Tg mice, and anti-CBir1 IgA antibody was measured by ELISA.(B) Serum anti-CBir1 IgG antibody was measured by ELISA in normal and CBir1 Tg mice. (C) Intestinal luminal content of normal and CBir1 Tg mice was run onSDS/PAGE and a Western blot was developed with anti-CBir1 mAb. (D) Histology of intestine of CBir1 Tg mice at age 6 months.
Cong et al. www.pnas.org/cgi/content/short/0812681106 4 of 11

Fig. S3. Adoptively transferred CBir1 Tg T cells in B6 mice gavaged with CBir1 flagellin are not anergic. CFSE-labeled CD4� T cells from CBir1 Tg mice weretransferred into wild-type B6 mice, and the recipient mice were gavaged with CBir1 next day. Splenic CD4� T cells were re-isolated 72 h later and re-stimulatedwith CBir1p456–475 (T cell epitope peptide) or CBir1p56–75 (control peptide) for 2 days. CFSE-CBir1 Tg T cells re-isolated from CBir1-gavaged B6 recipient miceproliferated to CBir1p456–475 stimulation (A) and produced IL-2, IFNg, and IL-10, but not IL-4 (B).
Cong et al. www.pnas.org/cgi/content/short/0812681106 5 of 11
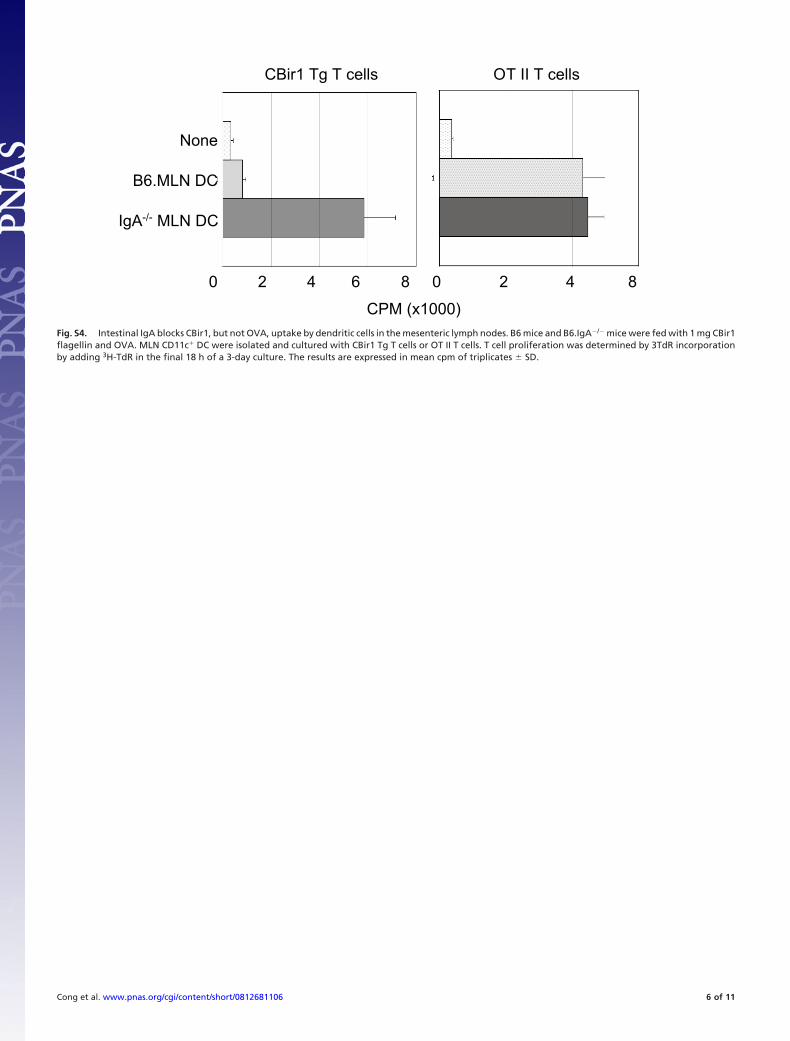
Fig. S4. Intestinal IgA blocks CBir1, but not OVA, uptake by dendritic cells in the mesenteric lymph nodes. B6 mice and B6.IgA�/� mice were fed with 1 mg CBir1flagellin and OVA. MLN CD11c� DC were isolated and cultured with CBir1 Tg T cells or OT II T cells. T cell proliferation was determined by 3TdR incorporationby adding 3H-TdR in the final 18 h of a 3-day culture. The results are expressed in mean cpm of triplicates � SD.
Cong et al. www.pnas.org/cgi/content/short/0812681106 6 of 11
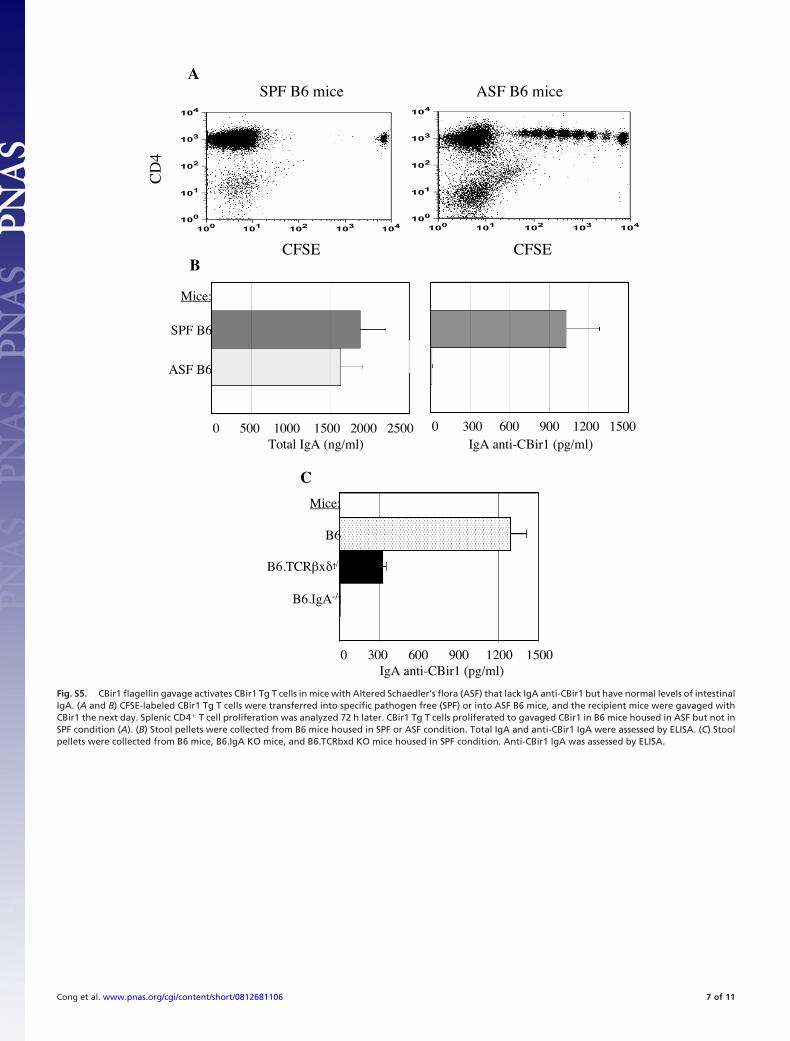
Fig. S5. CBir1 flagellin gavage activates CBir1 Tg T cells in mice with Altered Schaedler’s flora (ASF) that lack IgA anti-CBir1 but have normal levels of intestinalIgA. (A and B) CFSE-labeled CBir1 Tg T cells were transferred into specific pathogen free (SPF) or into ASF B6 mice, and the recipient mice were gavaged withCBir1 the next day. Splenic CD4� T cell proliferation was analyzed 72 h later. CBir1 Tg T cells proliferated to gavaged CBir1 in B6 mice housed in ASF but not inSPF condition (A). (B) Stool pellets were collected from B6 mice housed in SPF or ASF condition. Total IgA and anti-CBir1 IgA were assessed by ELISA. (C) Stoolpellets were collected from B6 mice, B6.IgA KO mice, and B6.TCRbxd KO mice housed in SPF condition. Anti-CBir1 IgA was assessed by ELISA.
Cong et al. www.pnas.org/cgi/content/short/0812681106 7 of 11

Fig. S6. Depletion of CD4�CD25� Treg cells decreased intestinal CD5� B2 cell IgA production. B6 mice were injected with 100 �g anti-CD25 mAb twice at days0 and 3, and LPL were isolated at days 5 and 7. CD5�IgA� B cells, but not CD5�IgA� B cells were decreased in LP of the mice treated with anti-CD25 but not controlmAb.
Cong et al. www.pnas.org/cgi/content/short/0812681106 8 of 11

Fig. S7. CD4�CD25� T cells regulate intestinal IgA production. (A) Adoptive transfer of CD4�CD25� Treg cells restored intestinal IgA in B6.TCR�x��/� mice.CD4�CD25� Treg cells (open circles) and CD4�CD25� T cells (closed circles) were transferred into B6.TCR����/� mice at 1 � 106 cells/mouse. The pellets werecollected at day 0, 4, 7, 14, and 21. Total IgA and anti-CBir1 IgA were assessed by ELISA. (B) Depletion of CD25 Treg cells decreased IgA restitution in IgA�/� mice.Splenic B cells from B6 mice were transferred into B6.IgA�/� mice, and the recipient mice were administered with control mAb or anti-CD25 mAb once a week.Pellets were collected weekly and anti-CBir1 IgA and total IgA were assessed by ELISA. *, P � 0.05.
Cong et al. www.pnas.org/cgi/content/short/0812681106 9 of 11

Fig. S8. Anti-CD25 mAb depletes CD25�Foxp3� T cells and induces IgA B cell apoptosis. B6 mice were injected with control mAb or anti-CD25 mAb at days 0and 3. (A) CD4 T cell expression of CD25 and Foxp3 was determined at day 5. (B) IgA B cell apoptosis was determined by staining with Annexin V at day 5. *, P �0.01 compared to control mAb treated group.
Cong et al. www.pnas.org/cgi/content/short/0812681106 10 of 11

Fig. S9. CBir1 Tg CD25� Treg cells preferentially induce IgA anti-CBir1 in vivo. CD25� Treg cells isolated from B6 mice or CBir1 Tg mice were transferred intoTCR����/� mice. The pellets were collected at different time points. Total and CBir1-specific IgA was measured by ELISA. *, P � 0.05.
Cong et al. www.pnas.org/cgi/content/short/0812681106 11 of 11