supporting information - royal society of chemistry · supporting information combining fluorogenic...
TRANSCRIPT

Supporting Information
Combining Fluorogenic ZnSalen and Myeloperoxidase (MPO) to
Detect Lysosomal Hydrogen Peroxide in Live Cells
Jing Jing1 and Jun-Long Zhang
*,1
1 Beijing National Laboratory for Molecular Sciences, State Key Laboratory of Rare Earth Materials
Chemistry and Applications, College of Chemistry and Molecular Engineering, Peking University,
Beijing, P.R. China
E-mail: [email protected]
Electronic Supplementary Material (ESI) for Chemical ScienceThis journal is © The Royal Society of Chemistry 2013

Content
1. Experimental methods ................................................................................................................... 3
1.1 General information ..................................................................................................................... 3
1.2 Generation of ROS ....................................................................................................................... 3
1.3 Kinetic assay.................................................................................................................................. 4
1.4 Cell culture .................................................................................................................................... 4
1.5 Cell imaging .................................................................................................................................. 4
1.6 Colocalization assay ...................................................................................................................... 4
1.7 Two photon confocal microscopy imaging ................................................................................. 5
2. Docking experiments ...................................................................................................................... 6
3. Supplementary table....................................................................................................................... 7
Table S1. Enzymic kinetic parameters. ............................................................................................. 7
4. Supplementary figures ................................................................................................................... 8
Figure S1. Fluorescence response of J-S to NaClO. ......................................................................... 8
Figure S2. The limit of detection for NaClO. ................................................................................... 9
Figure S3. Application of “MPO-J-S” to detect H2O2. .................................................................. 10
Figure S4. The limit of detection of “MPO-J-S” for H2O2. ........................................................... 11
Figure S5. Plotted Michaelis Menten curve. ................................................................................... 12
Figure S6. H2O2 detection in the presence of different halides. .................................................... 13
Figure S7. Confocal images of living HeLa cells loaded with J-S under different stimulants. .. 14
Figure S8. Two photon fluorescence confocal images .................................................................... 15
Electronic Supplementary Material (ESI) for Chemical ScienceThis journal is © The Royal Society of Chemistry 2013

1. Experimental methods
1.1 General information
All solvents and chemicals were purchased from Alfa Aesar or J&K and used as received without
further purification. Doubly distilled water was used for all experiments. Oxidases like
Myeloperoxidase (MPO, M6908-5UN, from human leukocytes), horse radish peroxidase (HRP),
catalase, lacase and lactoperoxidase (LPO) were purchased from SIGMA. Cellular imaging trackers
were purchased from Invitrogen (Life Technologies). The absorbance were obtained with an Agilent
8453 UV-vis spectrophotometer in 1cm path length quartz cells and the pH values were determined by
using a DELTA 320 PH dollar. Single-photon luminescence spectra were recorded using fluorescence
lifetime and steady state spectrophotometer (Edinburgh Instrument FLS920). Confocal fluorescent
images of living cells were performed using Nikon A1R-si Laser Scanning Confocal Microscope (Japan),
equipped with lasers of 405/488/543/638 nm.
1.2 Generation of ROS
Various ROS and RNS including H2O2, OCl-,
tBuOOH, O2
-,
·OH, ROO
·, and ONO2
- were prepared
according to the following methods.
OCl-:
0.25 μL of 8 M NaOCl (for a final stored concentration of 2 mM) was added to 1000 μL of 50 mM PBS
buffer at pH 7.4.
H2O2:
A 30% H2O2 solution was quantified by measuring the UV absorbance at 240 nm. 20 μL of 1 M H2O2
(for a final stored concentration of 20 mM) was added to 980 μL of 50mM PBS buffer at pH 7.4. 200
μL of 1 M H2O2 (for a final stored concentration of 200 mM) was added to 800 μL of 50mM PBS suffer
at pH 7.4. tBuOOH:
A 70% tBuOOH in H2O solution was diluted for a final concentration of 200 μM.
O2-:
0.03mg KO2 was dissolved in DMSO for a final concentration of 200 μM.
OH•:
2 mL PBS buffer at pH 7.4 was degassed for about 15 minutes by bubbling N2. Ammonium iron (II)
sulfate (10 mM) was added and the solution was degassed for 30 min by bubbling N2. 20 μL of 20 mM
H2O2 was added (for a final concentration of 200 μM).
tBuO•:
2 mL PBS buffer at pH 7.4 was degassed for about 15 minutes by bubbling N2. Ammonium iron (II)
sulfate (10 mM) was added and the solution was degassed for 30 min by bubbling N2. A 70% tBuOOH in
H2O solution was diluted and then added for a final concentration of 200 μM.
ONO2-:
Solutions of NaNO2 (0.6 M), H2O2 (0.6 M) acidified by HCl (0.7 M), and NaOH (0.6 M) were cooled
in an ice bath for 15-30 min. The NaNO2 solution (10 ml) was stirred rapidly in an ice bath, and to this
solution was added the acidified H2O2 solution (10 ml), followed in rapid succession by the NaOH
solution (10 ml). A yellow solution rapidly formed and decomposed to a colorless solution. Final
Electronic Supplementary Material (ESI) for Chemical ScienceThis journal is © The Royal Society of Chemistry 2013
product was generated by addition of the NaOH solution as quick as possible. The concentration of
ONO2- was determined by measuring the UV absorbance of the solution at 302 nm (ε=1.670*10
3 M
cm-l). The ONO2
- solutions were stored at -20°C before use.
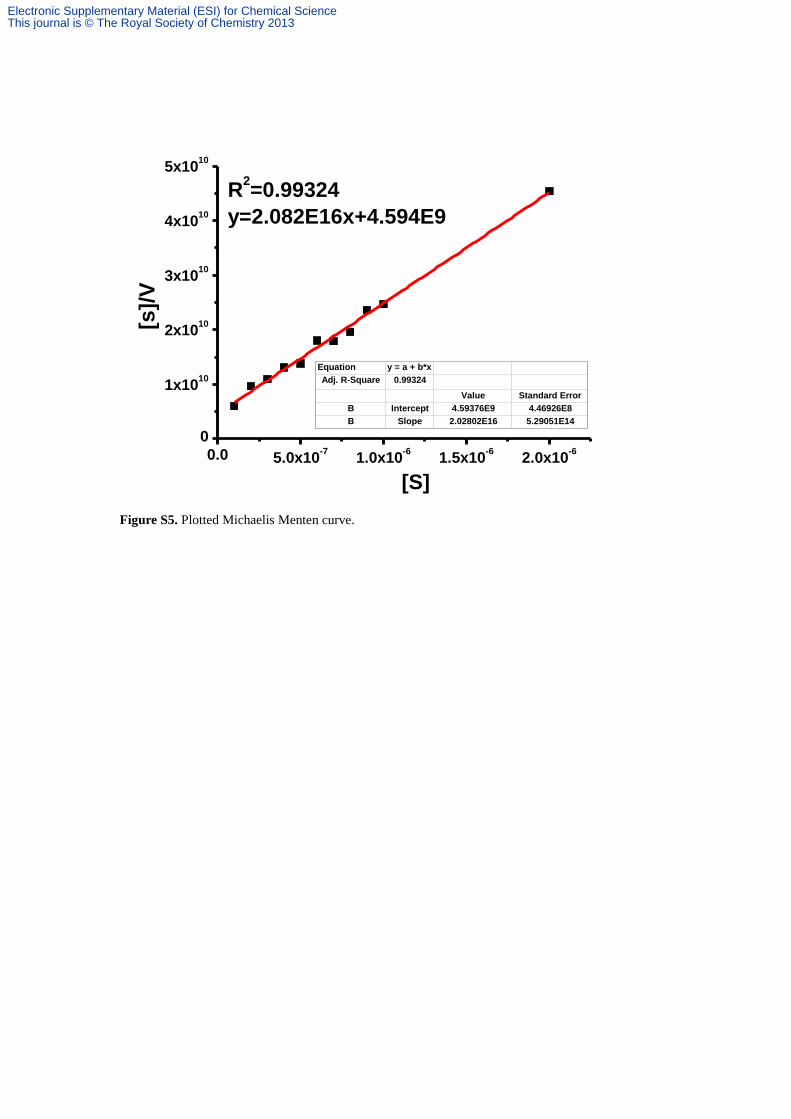
1.3 Kinetic assay
Reaction activities were measured at 25oC in 50 mM sodium phosphate buffer (pH 5.0). Steady-state
kinetic constants were obtained by measuring the initial velocity while varying the substrates
concentration. A Hanes plot of [s]/v versus [s] was used to estimate the Vmax and Km values for the
activation. The reaction rate was determined from the increase in the fluorescence at 610 nm. The 2 mL
final assay volume contained 1 nM MPO, 1 μM J-S and variable amounts of H2O2 (0.1 μM to 20 μM).
1μM of J-S and Various concentrations of H2O2 were dissolved in 2 mL total volume of 50 mM PBS
buffer, pH 5.0, containing 1% DMSO as co-solvent. MPO (0.01U) was added to the solution, and the
fluorescence intensity was recorded continuously as described above. Initial reaction velocity was
calculated plotted against H2O2 concentration, plotted against probe concentration, and fitted to a
Michaelie Menten curve (Figure S6). The kinetic parameters were calculated by use of the
Michaelis-Menten equation shown below:
1.4 Cell culture
All HeLa cells were incubated in complete medium (Dulbecco’s modified Eagle’s Medium,
supplemented with 10% fetal bovine serum (FBS) and 1% penicillin-streptomycin) at 37 °C in
atmosphere containing 5% CO2.
1.5 Cell imaging
For imaging, HeLa cells were grown in poly-D-lysine-coated dishes and incubated in 2mL of complete
medium for 24 h. Cells were washed with PBS, and stocked dyes (2 mM in DMSO, for a final
concentration of 5 μM) and MPO (0.01U/mL) were added to obtain a final concentration of 5 μM. The
treated cells were incubated for 24 hours in dark at 37 °C. Then A few minutes prior to confocal imaging
cells were washed twice with PBS. A confocal laser scanning microscope (A1R-si, Nikon, Japan) was
used to obtain images. Cells were imaged via the fluorescence mode with a 60× immersion lens with the
following parameters: laser power 50%, pinhole 1.0 A.U., excitation wavelength 543 nm, detector slit
552-617 nm, resolution 1024×1024, and a scan speed 0.5 frame per second. For endogenous H2O2
generation, HeLa cells were incubated with PMA (1 mg mL-1
) for an hour.
1.6 Colocalization assay
A stock solution of J-S in chromatographic grade, anhydrous DMSO was prepared as 2 mM. The
solution was diluted to a final concentration of 5 μM by complete growth medium. Stock solutions of
trackers were prepared as 1mM, and the stock solution was diluted to the working concentrations in
complete medium (Lyso Tracker: 75 nM, Mito Tracker: 100 nM, Calcein AM: 1 μM, Hoechst 33528: 1
μM). Transfection with LAMP2-EGFP, EHD1-EGFP, and FYVE-EGFP plasmids: Hela cells were
grown to about 80% confluency and then reseeded in 24-well plates; cells were transfected with 0.8 μg
plasmid, by using LipfectamineTM 2000 according to manufacturer’s instruction. HeLa cells were
placed onto 0.1 mM poly-D-lysine coated glasses in complete media and the cells were incubated for 24
Electronic Supplementary Material (ESI) for Chemical ScienceThis journal is © The Royal Society of Chemistry 2013

h. Then MPO (0.01 U/mL) and J-S (5 μM) were incubated for 24 hours. After incubation with 20 μM
H2O2 for half an hour, cells were washed with PBS buffer twice before confocal experiments. Images
were taken under conditions as follows: 60× immersion lens with a resolution of 1024×1024 and a speed
of 0.5 frame per second, 543 nm excitation wavelength and 552 to 617 nm detector slit, 80% laser power
for J-S, and 50% laser power for LysoTracker (ex: 488 nm, em: 505-560 nm), MitoTracker (ex: 488 nm,
em: 505-560 nm), Calcein AM (ex: 488 nm, em: 505-560 nm), Hoechst 33528 (ex: 405nm, em: 425-460
nm) and EGFP-LAMP2, EHD1-EGFP, and FYVE-EGFP (ex: 488 nm, em: 505-560 nm). Differential
interference contrast (DIC) and fluorescent images were processed and analyzed using ImageJ. The
Pearson’s correlation coefficient, overlap coefficient, ICA plot and ICQ values were calculated by
ImageJ with colocalisation analysis plugins.
1.7 Two photon confocal microscopy imaging
Two photon fluorescence microscopy images were performed on a modified Olympus Fluoview
FV1000MPE microscope system equipped with an excitation light laser provided by a modelocked Ti:
sapphire laser, (Mai Tai, Spectra-Physics Inc., USA). The microscopy settings were as follows: 60×
immersion water objective, a resolution of 512×512, 840 nm excitation wavelength and 570 to 620 nm
detector slit. HeLa were treated with MPO-J-S for 12 h and then H2O2 for 30 min, and washed with
prewarmed PBS buffer before imaging. The quantified fluorescence intensities were calculated by
ImageJ, as well as the reported standard deviations.
Electronic Supplementary Material (ESI) for Chemical ScienceThis journal is © The Royal Society of Chemistry 2013

2. Docking experiments
Preparation of receptor and ligand:
The coordinates deposited in the Protein Data Bank (PDB code: 1CXP) was used as the target structure to
endeavor the docking studies. All the X-ray water molecules in the catalytic site of MPO have been
removed, and all hydrogens were added. The whole structure was energy minimized by AutoDockTools
version 1.5.4 during docking. Ligand J-S and J-SO was optimized by Gaussian 09 package, with
DFT/B3LYP method. Basis set of atoms C, H, O, N, and S was 6-31G (d). Basis set of atom Zn was
LANL2DZ. Then the final protein and ligand structure were used for docking experiment directly.
Molecular docking:
For docking compound J-S and J-SO into MPO, the program AutoDock version 4.2 was used. Only one
monomer was considered in our docking. The grids for MPO had dimensions of 28 Ǻ ×32 Ǻ ×26 Ǻ, with
the grid spacing of 0.375 Ǻ. The grid box contained most part of the monomer, involving the catalytic
site of MPO. As J-S and J-SO was a rigid molecular, both ligand and protein were considered rigid part
during the docking program. Lamarckian genetic algorithm was used for calculation with 100 runs to
give 100 individuals. The number of individuals in population was set as 150, maximum number of
energy evaluations was 2500000, and maximum of generations was 27000. All other parameters were
used as default values. The results rms tolerance was 2.0 Ǻ.
Electronic Supplementary Material (ESI) for Chemical ScienceThis journal is © The Royal Society of Chemistry 2013

3. Supplementary table
Table S1. Enzymic kinetic parameters.
[NaCl]/ mM [H2O2]/ μM k/min-1
[V]/*10-9
Mmin-1
50 0.1 9.28 9.28
0.2 14.10 14.10
0.3 18.91 18.91
0.4 21.02 21.02
0.5 22.45 22.45
0.6 24.57 24.57
0.7 25.16 25.16
0.8 26.93 26.93
0.9 30.55 30.55
1.0 31.73 31.73
Vmax 3.6 * 10
-8
Mmin-1
Km 0.29 μM
kcat 36 min-1
kcat/Km 2.06 M-1
min-1
Electronic Supplementary Material (ESI) for Chemical ScienceThis journal is © The Royal Society of Chemistry 2013

4. Supplementary figures
550 600 650 700 750
0.0
2.0x10⁴
4.0x10⁴
6.0x10⁴
8.0x10⁴
Inte
nsit
y
Wavelength (nm)
0 min
1 min
2 min
5 min
10 min
(A)
0 2 4 6 8 10
0.0
2.0x10⁴
4.0x10⁴
6.0x10⁴
8.0x10⁴
Inte
nsit
y
Time (min)
1min
(B)
Figure S1. Fluorescence response of J-S to NaClO. (A) Fluorescence spectra of J-S (final concentration:
10 μM) reacting with NaOCl (20μM). (B) Fluorescence intensity (Ex: 380 nm, Em:610 nm) plotted
against the reaction time.
Electronic Supplementary Material (ESI) for Chemical ScienceThis journal is © The Royal Society of Chemistry 2013
0uM
0.1uM
0.2uM
0.3uM
0.4uM
0.5uM
0.6uM
0.7uM
0.8uM
1uM
550 600 650 700
0
1x10⁴
2x10⁴
3x10⁴
4x10⁴
Inte
nsit
y
Wavelength(nm)
(A)
0.0 0.2 0.4 0.6 0.8 1.0
0
1x10⁴
2x10⁴
3x10⁴
4x10⁴
Y=42408X+431
Inte
ns
ity
[ClO-]
R2=0.992
(B)
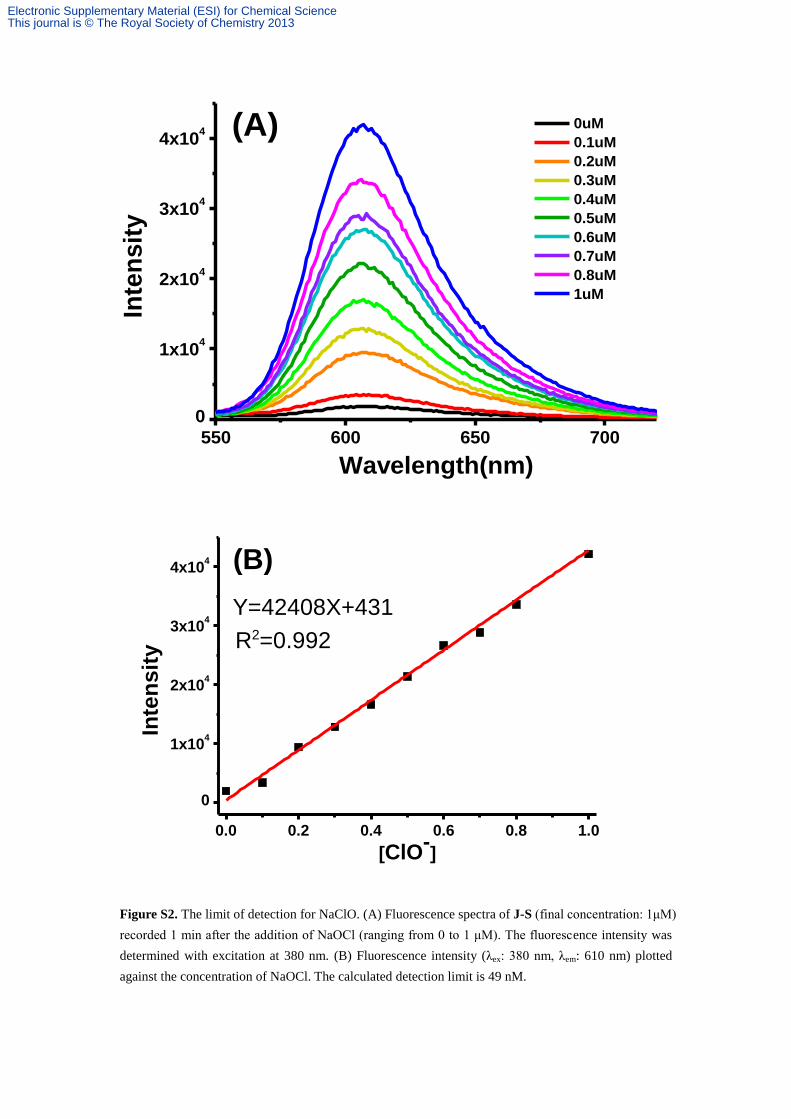
Figure S2. The limit of detection for NaClO. (A) Fluorescence spectra of J-S (final concentration: 1μM)
recorded 1 min after the addition of NaOCl (ranging from 0 to 1 μM). The fluorescence intensity was
determined with excitation at 380 nm. (B) Fluorescence intensity (λex: 380 nm, λem: 610 nm) plotted
against the concentration of NaOCl. The calculated detection limit is 49 nM.
Electronic Supplementary Material (ESI) for Chemical ScienceThis journal is © The Royal Society of Chemistry 2013

550 600 650 700
0.0
5.0x10⁴
1.0x10⁵
1.5x10⁵
2.0x10⁵
Inte
nsit
y
Wavelength(nm)
0min
5 min
10 min
15 min
20 min
25 min
30 min
0 5 10 15 20 25 30
0.0
5.0x10⁴
1.0x10⁵
1.5x10⁵
2.0x10⁵
Inte
ns
ity
Time (min)
MPO/ H2O/Cl
-
MPO/ H2O
2
MPO/Cl-
Figure S3. Application of “MPO-J-S” to detect H2O2. Data shown are for 10 μM for J-S, 0.01 U/mL for
MPO, 150 mM for Cl-, and 20 μM for H2O2 in PBS buffer pH 5.0 at 37
oC. (A) Fluorescence changes of
“MPO-J-S” with the addition of H2O2 within 30 minutes. (B) Time course of fluorescence intensity at
610 nm in the presence or absence of H2O2 or Cl- (λex: 380 nm, λex: 610 nm).
Electronic Supplementary Material (ESI) for Chemical ScienceThis journal is © The Royal Society of Chemistry 2013

0 M
0.1 M
0.2 M
0.3 M
0.4 M
0.5 M
0.6 M
0.7 M
0.8 M
0.9 M
550 600 650 700
0
1x10⁴
2x10⁴
3x10⁴
4x10⁴
5x10⁴
6x10⁴
7x10⁴
Inte
ns
ity
Wavelength (nm)
0.2 0.4 0.6 0.8 1.01x10
4
2x10⁴
3x10⁴
4x10⁴
5x10⁴
6x10⁴
7x10⁴
8x10⁴
Inte
nsit
y
[H2O
2](M)
R2=0.99823
Y=62428X+5059
R2=0.998
Figure S4. The limit of detection of “MPO-J-S” for H2O2. (A) Fluorescence spectra of J-S (final
concentration: 10 μM) in recorded 30 min after the addition of H2O2 (ranging from 0 to 1μM). The
fluorescence spectra were recorded with excitation at 380 nm. (B) Fluorescence intensity (λex: 380nm, λex:
610 nm) plotted against the concentration of H2O2.
Electronic Supplementary Material (ESI) for Chemical ScienceThis journal is © The Royal Society of Chemistry 2013
0.0 5.0x10⁻⁷
1.0x10⁻⁶
1.5x10⁻⁶
2.0x10⁻⁶
0
1x10¹⁰
2x10¹⁰
3x10¹⁰
4x10¹⁰
5x10¹⁰
R2=0.99324
y=2.082E16x+4.594E9
[s]/
V
[S]
Equation y = a + b*x
Adj. R-Square 0.99324
Value Standard Error
B Intercept 4.59376E9 4.46926E8
B Slope 2.02802E16 5.29051E14
Figure S5. Plotted Michaelis Menten curve.
Electronic Supplementary Material (ESI) for Chemical ScienceThis journal is © The Royal Society of Chemistry 2013

0 5 10 15 20 25 30
0.0
2.0x10⁴
4.0x10⁴
6.0x10⁴
8.0x10⁴
MPO/H2O
2/Cl
-
MPO/H2O
2/Br
-
MPO/H2O
2/I
-
MPO/H2O
2/F
-Inte
nsit
y
Time (min)
Figure S6. H2O2 detection in the presence of different halides. H2O2 was added to a solution of J-S (10
μM)/ MPO (0.01 U/mL) in the presence of different halide ions (150 mM), including Cl-, Br
-, I
-, F
-. (λex:
380 nm, λem: 610 nm) at pH 5.0.
Electronic Supplementary Material (ESI) for Chemical ScienceThis journal is © The Royal Society of Chemistry 2013

Figure S7. Confocal images of living HeLa cells loaded with J-S under different stimulants. HeLa cells
were treated with J-S (5 μM) and MPO (0.01 U/mL) for 12 hours at 37 oC, and then incubated with 20
μM H2O2 for 30 minutes (i) or 20 μM NaClO for 30 minutes (ii). Cells treated with J-S (5 μM) for 12
hours at 37 oC, and then incubated with 20 μM H2O2 for 30 minutes (iii) or 20 μM NaClO for 30
minutes (iv). Scale bar: 10 μm.
Electronic Supplementary Material (ESI) for Chemical ScienceThis journal is © The Royal Society of Chemistry 2013

0
2
4
6
8
10
12
14
Inte
nsit
y
753 times
76 times
Control H2O
2MPO+ H
2O
2PMA
Figure S8. Two photon fluorescence confocal images of living HeLa cells loaded with J-S under
different stimulants. HeLa cells were loaded with (i) J-S (5 μM) for 24 hours and then 20 μM H2O2
for 30 minutes; (ii) J-S (5 μM) and MPO (0.01 U/mL) for 24 hours; (iii) J-S (5 μM) and MPO (0.01
U/mL) for 24 hours were treated with 20 μM H2O2 for 30 minutes.(iv) J-S (5 μM) and MPO (0.01
U/mL) for 24 hours were treated with 1 μM PMA for an hour; (a) Fluorescence images; (b) merged
images of (a) and DIC. Detection channel: λex= 840nm, λem=570-620nm. Laser power: 10 mW. Scale
bar: 10 μm.
Electronic Supplementary Material (ESI) for Chemical ScienceThis journal is © The Royal Society of Chemistry 2013