supporting information - royal society of … information ... the gel is crushed by pestle in...
TRANSCRIPT

Supporting Information
Multiple GO-SELEX for Efficient Screening of Flexible Aptamers
Van-Thuan Nguyen§, Young Seop Kwon§,Jae HoonKimand Man Bock Gu*
School of Life Sciences and Biotechnology Department, Korea University Institution
Anam-dong, Seongbuk-Gu, Seoul 136-713, Rep. of Korea
Fax: (+)82-2-9286050
E-mail: [email protected]
§ These authors contributed equally.
[] This research was supported by Advanced Production Technology Development Program, Ministry of Agriculture, Food
and Rural Affairs and the National Research Foundation of Korea (NRF) grant funded by the Korean government (MEST)
(No. 2012R1A2A2A01011056).
Electronic Supplementary Material (ESI) for ChemComm.This journal is © The Royal Society of Chemistry 2014

Table of Contents 1. Synthesis of graphene oxide
2. Multi GO-SELEX using 56-RL
2.1 ssDNA Amplification by PCR
2.2 PAGE gel Separation
2.3 Cloning and sequencing
3. Dose-dependent test by colorimetric assay
4. The affinity binding assay by Isothermal Titration Colorimetric (ITC)
5. The binding affinity of flexible multi-target aptamers with a mixture of target.
6. Circular dichroism (CD) studies.
7. References
1. Materials and methods
All chemicals were purchased from Sigma-Aldrich Chemicals, Korea. All the oligonucleotides were
purchased from Genotech, Korea. The PCR purification kits were obtained from the Qiagen. Ultrapure water
(18 M Ω/cm) was obtained from a Milli-Q purification system (Millipore). AuNPs were synthesized according
to previously reported protocol.1 UV/vis spectrophotometer (Ultraspec 6300 pro) was used to characterize the
absorption of AuNPs. The concentration of AuNPs was estimated by Beer-Lamberlaw using extinction
coefficient, 2.43x10⁸M-1
cm-1
at 520nm
1. Synthesis of graphene oxide
Graphene oxide (GO) was prepared from natural graphite (FP 99.95 % pure, GraphitKropfmühl AG) by
modified Hummers method.2, 3
Briefly, A graphite powder (1 g) was added to sulfuric acid (98%, 150 mL), and
then potassium permanganate (99.0%, 2.5 g) as an oxidizing agent was gradually added to the graphite solution.
Then, the mixture was cooled in an ice bath and diluted with deionized water (200 mL). After stirring for ~2
hours, hydrogen peroxide (100 mL) was added to the reaction solution. The mixture was then filtrated with a
glass filter and washed several times with hydrochloric acid (10%). After this washing process, the remaining
solvent was evaporated under vacuum at room temperature for 12 hours.
2. Multi GO-SELEX using 56-RL
To prepare the denatured ssDNA,the 2ul of 100uM of 56mer ssDNA's random library is added into 98ul of 1x
binding buffer (BB) and the mixture is heated for 15 min at 95 C and then cooling down goes on for 5 min in
ice. After the 200 ul of counter targets (mixed withMeOH:BB=1:1) and the denatured ssDNA library are gently
mixed, the mixture is incubated 30 min at RT by rotating it. Then, the 100ul of GO solution (5mg/ml), 2xBB
(100ul), 1xBB (500ul) are added in the tube and it is incubated for 2 hr, RT, rotator. (Total volume 1ml, GO
0.5mg/ml, 10% MeOH). After that, the mixture is centrifuged at 14,680rpm for 10 min and then the 800ul of
supernatant is removed. The ssDNA binding to GO is washed 2 times with 1xBB. Three main targets and 1XBB
700ul are added in amount of 33.3 ul of 6uM stock (200pmoles/each), then the mixture is incubated for 2 hr at
RT by rotator. The reaction solution proceeds to centrifuge at 14,680rpm for 10 min. After supernatant are
Collected (2 separate tube, 400ul), the centrifugation process is repeated to remove remaining GO (2X). Finally,

ethanol precipitation process is conducted by adding Glycogen 3ul (5mg/ml) + NaOAc 100ul (3M) +
Isopropanol (same volume as solution), then the solution is incubated for 2 hours at -20oC refrigerator.
Figure S1. Percent recovery of target-bounded ssDNA library from pool random library ssDNA
2.1. ssDNA Amplification by PCR
The mixture of 1ul of 10uM of forward primer and reverse primer was added into the PCR tube which is
contained in amount of 25ul of taq polymerase previously. After the 21ul of distilled water in each tube is
added, the DNA which was obtained by the Multi-GO SELEX process is mixed finally. The PCR processing
condition is that total cyclesare 30 and order of each ofthe cyclesis the 94'C/5min, 94'C/30sec, 53'C/30sec,
72'C/30sec,72'C/10min. When the cycles are finished, the PCR tubes should be kept in 4'C, refrigerator. For
separation, the 5 volume of PB buffer which is purchased from QIAGENis added to 1 volume of PCR and
mixed. To bind DNA, the sample is applied to the MiniElute column and proceeds to centrifuge for 1 min. The
flow-through is discarded and the 750ul of PE buffer (wash buffer) is added to the column and proceeds to
centrifuge for 1min.
Again, flow-through is Discarded and Centrifugation in additional 1 min at max speed. The column is placed in
EP tube, to elute DNA. After 40ul of EB buffer is added, the tube is incubated 1min and centrifuged for 1 min.
2.2 PAGE gel Separation
The 40ul of 20% APS(ammonium persulfate) and the 10ul of TEMED(Tetramethylethylenediamine) is mixed in
20ml tube (mixed well by swirling, being careful to avoid aeration). The solution is drawn into the slit by 1ml
pipet. When the gel solution hardens(approximately 40min), the residue of gel in the well is washed with the
running water by needle again. Then, 1x TBE buffer is poured into bath and inside the gel setting
equipment.After the DNA sample is mixed with the 5X loading buffer for confirmation during gel loading time,
the sample is treated (95 'C 15 min and 4 'C 30 sec) in Thermo Bath and ice box. When the treatment is finished,
the sample is loaded in amount of 20 ul in each well. Gel running is gone down for 30 minutes at 200V and 30-
1hr at 150V until the yellow band is released out of page gel
Crush and soak method
The gel is cut precisely which we obtain (upper, yellow part). The cut gel 2 pieces are placed in one EP-tube.
The gel is crushed by pestle in EP-tube and soaked with 1ml of the excision buffer. The EP- tube is incubated
for overnight at 37'C with rotating in high speed. After centrifugation of the EP-tube for 10min at 13,000rpm,
supernatant is removed as much as possible. Additional 500ul of excision buff and soak are contained.
The above centrifugation is repeated as all samplesare in the form of pool. The pool is filtered by 0.22um
diameter filter. The Ethanol precipitation is progressed again.
4.4
43.
63.
29. 27.5 32.
81.171.5 72.
0.
25.
50.
75.
100.
M_R1 M_R3 R4_Tebuc R5_Mefen R5_Inaben
Recovery
(%
)
SELEX Round
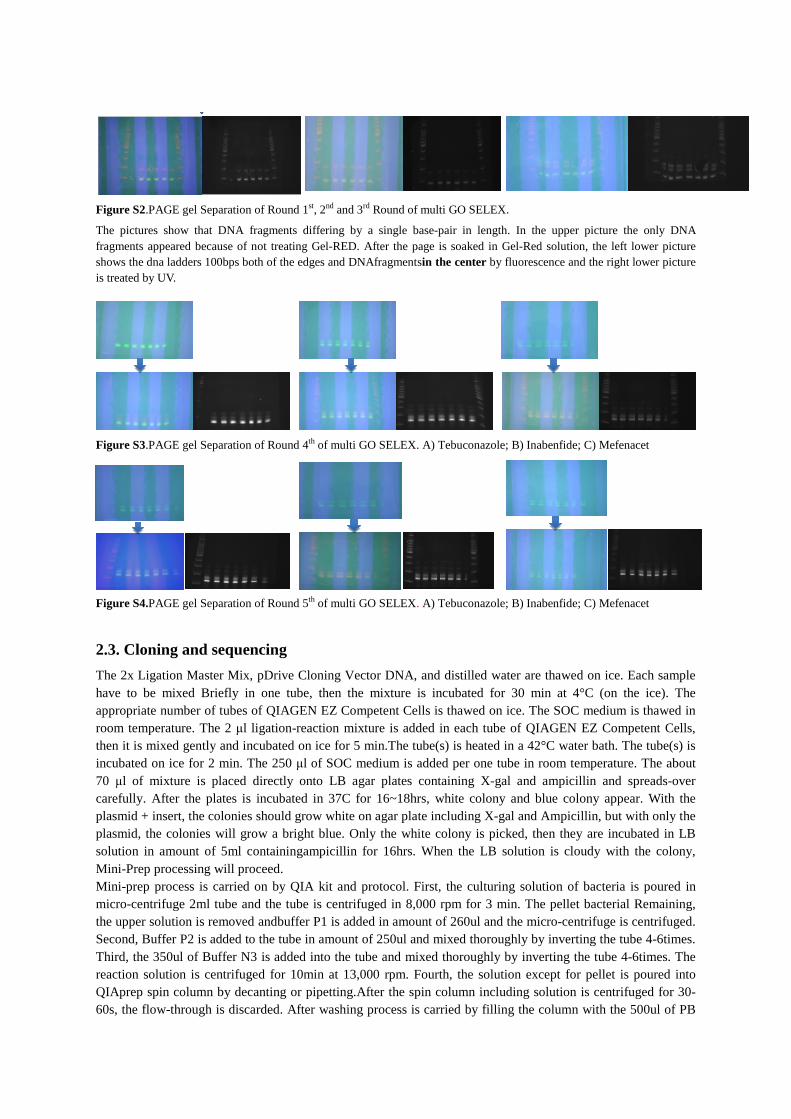
Figure S2.PAGE gel Separation of Round 1st, 2nd and 3rd Round of multi GO SELEX.
The pictures show that DNA fragments differing by a single base-pair in length. In the upper picture the only DNA
fragments appeared because of not treating Gel-RED. After the page is soaked in Gel-Red solution, the left lower picture
shows the dna ladders 100bps both of the edges and DNAfragmentsin the center by fluorescence and the right lower picture
is treated by UV.
Figure S3.PAGE gel Separation of Round 4th of multi GO SELEX. A) Tebuconazole; B) Inabenfide; C) Mefenacet
Figure S4.PAGE gel Separation of Round 5th of multi GO SELEX. A) Tebuconazole; B) Inabenfide; C) Mefenacet
2.3. Cloning and sequencing
The 2x Ligation Master Mix, pDrive Cloning Vector DNA, and distilled water are thawed on ice. Each sample
have to be mixed Briefly in one tube, then the mixture is incubated for 30 min at 4°C (on the ice). The
appropriate number of tubes of QIAGEN EZ Competent Cells is thawed on ice. The SOC medium is thawed in
room temperature. The 2 μl ligation-reaction mixture is added in each tube of QIAGEN EZ Competent Cells,
then it is mixed gently and incubated on ice for 5 min.The tube(s) is heated in a 42°C water bath. The tube(s) is
incubated on ice for 2 min. The 250 μl of SOC medium is added per one tube in room temperature. The about
70 μl of mixture is placed directly onto LB agar plates containing X-gal and ampicillin and spreads-over
carefully. After the plates is incubated in 37C for 16~18hrs, white colony and blue colony appear. With the
plasmid + insert, the colonies should grow white on agar plate including X-gal and Ampicillin, but with only the
plasmid, the colonies will grow a bright blue. Only the white colony is picked, then they are incubated in LB
solution in amount of 5ml containingampicillin for 16hrs. When the LB solution is cloudy with the colony,
Mini-Prep processing will proceed.
Mini-prep process is carried on by QIA kit and protocol. First, the culturing solution of bacteria is poured in
micro-centrifuge 2ml tube and the tube is centrifuged in 8,000 rpm for 3 min. The pellet bacterial Remaining,
the upper solution is removed andbuffer P1 is added in amount of 260ul and the micro-centrifuge is centrifuged.
Second, Buffer P2 is added to the tube in amount of 250ul and mixed thoroughly by inverting the tube 4-6times.
Third, the 350ul of Buffer N3 is added into the tube and mixed thoroughly by inverting the tube 4-6times. The
reaction solution is centrifuged for 10min at 13,000 rpm. Fourth, the solution except for pellet is poured into
QIAprep spin column by decanting or pipetting.After the spin column including solution is centrifuged for 30-
60s, the flow-through is discarded. After washing process is carried by filling the column with the 500ul of PB
A
)
B
)
C
)
buffer, the column is centrifuged for 30-60s and the flow- through is discarded. Fifth, the QIAprep spin column
is washed with 750ul of PE buffer and centrifuged for 30-60s.After the flow-through is discarded, the spin
column is centrifuged for an additional 1 min to remove residual PE buffer. The QIAprep column is placed in a
clean 1.5ml micro-centrifuge tube. Finally, to elute DNA, the EB buffer(10mM Tris-HCl, PH 8.5) is added to
the center of QIAprep spin column. After the column is left for 3min, the column is centrifuged for 1min.The
purified DNA is in the micro-centrifuge and sends for sequencing analysis.
Aptamer Sequences ΔG
T1 CGTACGGAATTCGCTAGCAGCGTCCACGAGTGTGGTGTGGATCCGAGCTCCACGTG -2.35
T2 CGTACGGAATTCGCTAGCCCCCCGGCAGGCCACGGCTTGGGTTGGTCCCACTGCGCGTGGATCCGAG
CTCCACGTG -2.5
T3 CGTACGGAATTCGCTAGCACGTTGACGCTGGTGCCCGGTTGTGGTGCGAGTGTTGTGTGGATCCGAG
CTCCACGTG -7.03
T4 CGTACGGAATTCGCTAGCACGTTGACGCTGGTGCCCGGTTGTGGTGGAGTGTTGTGTGGATCCGAGC
TCCACGTG -12.8
T10 CGTACGGAATTCGCTAGCGAGTCATGTACCGTCCCTGTGGATCCGAGCTCCACGTG -5.69
T3-N CGTACGGAATTCGCTAGCGTGTCAATAATGGTCCTCTGGGATCCGAGCTCCACGTG -3.46
T1-N CGTACGGAATTCGCTAGCACGTTGACGCTGGTGCCCGGTTGTGGGCGAGTGTTGTGTGGATCCGAGC
TCCACGTG -9.21
i13 CGTACGGAATTCGCTAGCACGTTGACGCTGGTGCCCGGTTGTGGGTGCGAGTGTTGTGTGGATCCGA
GCTCCACGTG -9.83
i18 CGTACGGAATTCGCTAGCACGTTGACGCTGGTGCCCGGTTGTGGTGCGGGTGTTGTGTGGATCCGAG
CTCCACGTG -8.41
i11 CGTACGGAATTCGCTAGCACGTTGACGCTGGTGCCCGGTTTGGTGCGAGTGTTGTGTGGATCCGAGC
TCCACGTG -7.22
Table S1.The Sequences of aptamer by Multi-GO-SELEX and their Gibbs free energy.
3.Dose-dependent test by colorimetric assay
Specificity Test: A mixture of 360 ul of 2.2 nMAuNPs with 20 ul of 1 uM of candidate aptamer was shaken
mildly for 30 min at room temperature. Then, 20 ul of 100 uM of each target (tebuconazole, mefenacet,
inabenfide , caproamide, pecyncuron, butachor, ibuprofen, dox, Oxytetracyline, tetracyline and diclofenac) in
binding buffer (100 mMNaCl, 20 mMTris-HCl, 2 mM MgCl2, 5 mMKCl, and 1 mM CaCl2) was added and
further incubated for 30 min under the same condition. After adding 44 ulNaCl (1M) gradually into incubated
samples, color and spectra changes were observed by naked eye and UV/vis spectrophotometer (Ultraspec 6300
pro, Amersham Biosciences). Buffer was used as control.

Figure S5.Specificity test by colorimetric assay. The images of specific interaction of various pesticides and
small molecules with (a) Aptamer T1; b) The normalized 650/520 ratio of AuNP in colorimetric assay with
tebuconazole, mefenacet, inabenfide , caproamide, pecyncuron, butachor, ibuprofen, dox, Oxytetracyline,
tetracyline and diclofenac
Figure S6.Specificity test by colorimetric assay. The images of specific interaction of various pesticides and
small molecules with (a) Aptamer i11; b) The normalized 650/520 ratio of AuNP in colorimetric assay with
tebuconazole, mefenacet, inabenfide ,caproamide, pecyncuron, butachor, ibuprofen, dox, Oxytetracyline,
tetracyline and diclofenac.
0
0.1
0.2
0.3
0.4
0.5
0.6
0.7
0.8
0.9
Tubeconazole Mefenacet Inabenfide Pencycuron Caproamide Butachor NC
65
0/5
20
Rat
io
Ibuprofen Dox TET DiclofenacOxytetra NCTebu Mefen Inab Capro ButaPency
A)
B)

Figure S7.Specificity test by colorimetric assay. The images of specific interaction of various pesticides and
small molecules with (a) Aptamer T2; b) The normalized 650/520 ratio of AuNP in colorimetric assay with
tebuconazole, mefenacet, inabenfide , caproamide, pecyncuron, butachor, ibuprofen, dox, Oxytetracyline,
tetracyline and diclofenac.
Figure S8.Specificity test by colorimetric assay.The images of specific interaction of various pesticides and
small molecules with (a) Aptamer T3; b) The normalized 650/520 ratio of AuNP in colorimetric assay with
tebuconazole, mefenacet, inabenfide , caproamide, pecyncuron, butachor, ibuprofen, dox, Oxytetracyline,
tetracyline and diclofenac.
B)
A)
Tebucon
Mefen
Inaben
Capro
Buta
Pency
Ibuprofen Dox TET Diclofen Oxytet NC
A)
B)
Tebucon Mefen
Inaben
Capro
Buta
Pency
Ibuprofen Dox TET Diclofen Oxytet NC
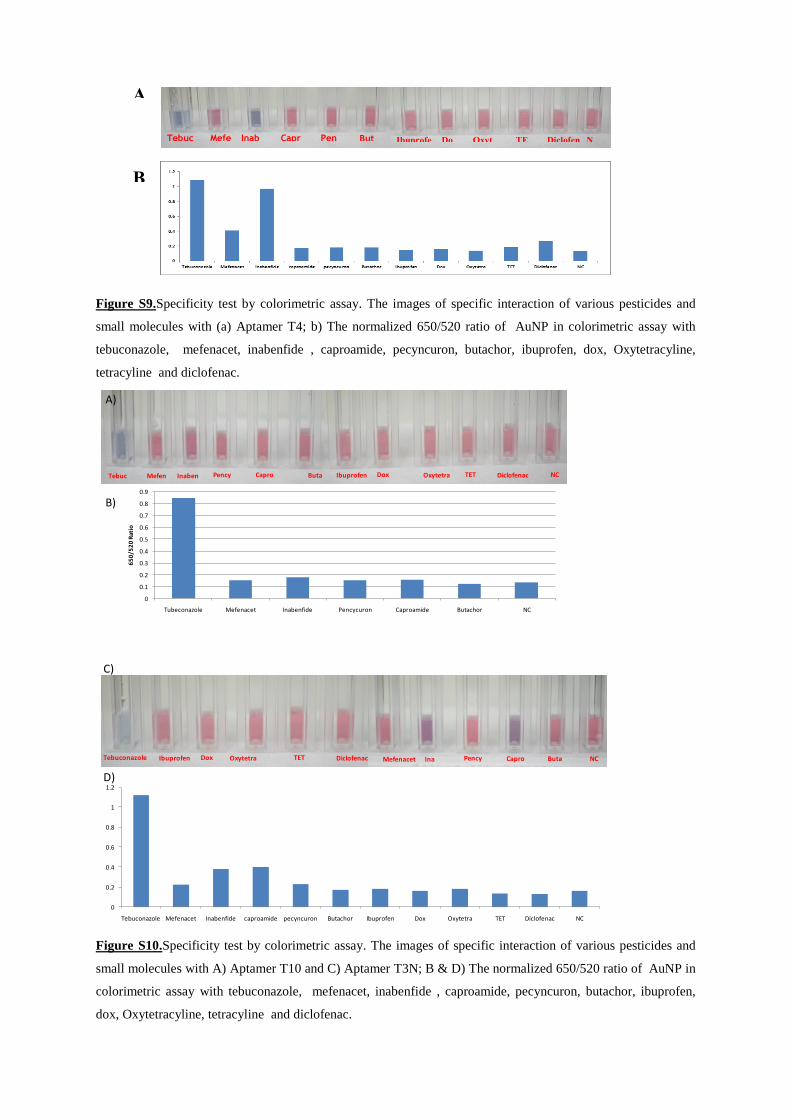
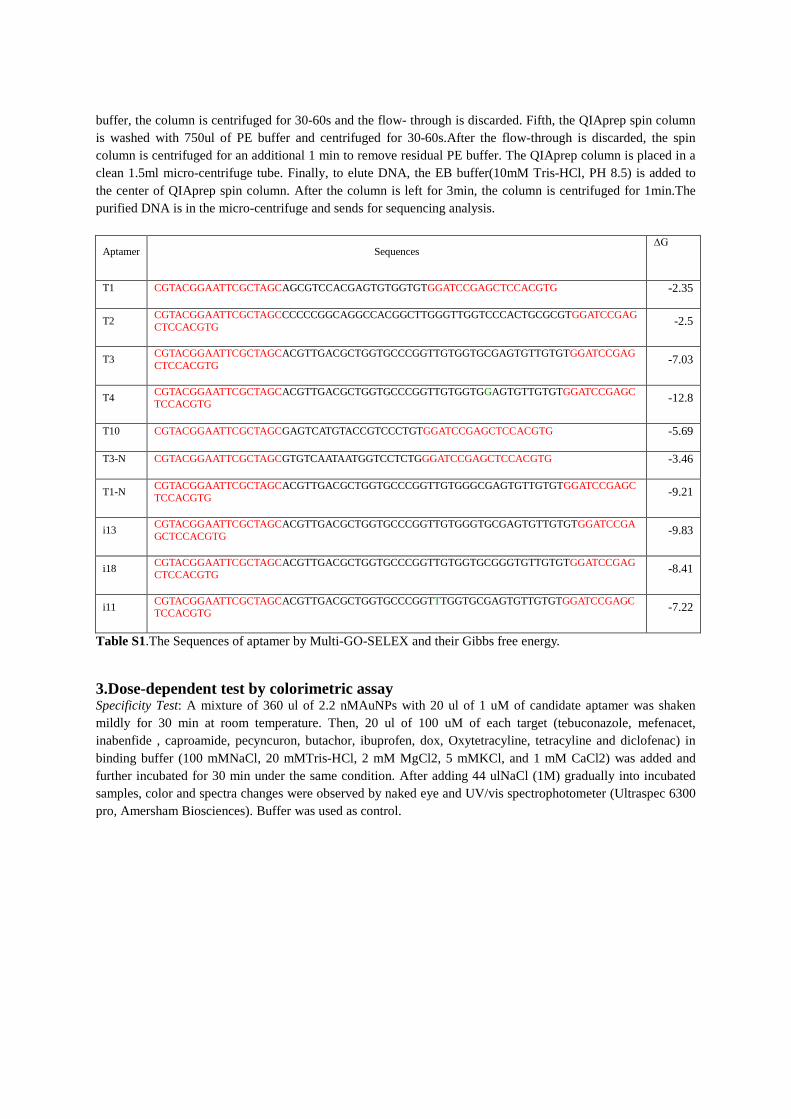
Figure S9.Specificity test by colorimetric assay. The images of specific interaction of various pesticides and
small molecules with (a) Aptamer T4; b) The normalized 650/520 ratio of AuNP in colorimetric assay with
tebuconazole, mefenacet, inabenfide , caproamide, pecyncuron, butachor, ibuprofen, dox, Oxytetracyline,
tetracyline and diclofenac.
Figure S10.Specificity test by colorimetric assay. The images of specific interaction of various pesticides and
small molecules with A) Aptamer T10 and C) Aptamer T3N; B & D) The normalized 650/520 ratio of AuNP in
colorimetric assay with tebuconazole, mefenacet, inabenfide , caproamide, pecyncuron, butachor, ibuprofen,
dox, Oxytetracyline, tetracyline and diclofenac.
0
0.1
0.2
0.3
0.4
0.5
0.6
0.7
0.8
0.9
Tubeconazole Mefenacet Inabenfide Pencycuron Caproamide Butachor NC
65
0/5
20
Rat
io
Tebuc Mefen Inaben Capro ButaPency Ibuprofen Dox TET DiclofenacOxytetra NC
A)
B)
Tebuconazole Ibuprofen Dox TET DiclofenacOxytetra Mefenacet Ina Capro ButaPency NC
C)
D)
0
0.2
0.4
0.6
0.8
1
1.2
Tebuconazole Mefenacet Inabenfide caproamide pecyncuron Butachor Ibuprofen Dox Oxytetra TET Diclofenac NC
A
)
B
)
Tebucon
Mefen
Inaben
Capro
Buta
Pency
Ibuprofe
n Do
x TE
T Diclofen Oxyt
et N
C
Sensitivity test: Dose-dependent experiment of aptamer for three main target tebuconazole, mefenacet,
inabenfide: A mixture of 360 ul of 2.2 nMAuNPs with 20 ul of 1 uM of aptamer was shaken mildly for 30min at
RT. Then, 20ul of 0, 0.625, 1, 2.5, 5, 10, 25, and 50 nM of main target in binding buffer (100 mMNaCl, 20
mMTris-HCl, 2mM MgCl2, 5 mMKCl, and 1 mM CaCl2) was added and further incubated for 30min under the
same condition. After adding 44ulNaCl (1M) gradually into incubated samples, color and spectra changes were
observed by naked eye or UV/vis spectrophotometer (Ultraspec 6300 pro, Amersham Biosciences). Buffer was
used as control.
Figure S11.Sensitivity testby colorimetric assay of T1.a) The images of specific interaction of Tebuconazole
molecules with Aptamer T1.b) Graph of detection of Tebuconazoleby T1aptamer based on absorbance ratio of
650/530nm.
25uM 10uM 5uM 2uM 1uM 0.5uM NC0.25
00.20.40.60.8
11.21.4
0 10 20 30
650
/52
0 R
ati
o
Tuberconazole Concentration (uM)
The Sensitivity of aptamer T1
A) B)
50uM 25uM 10uM 5uM 2.5uM 1.25uM NC0.625uM
a)
d)
b)
c)
e)
0
0.2
0.4
0.6
0.8
1
1.2
1.4
1.6
0 20 40 60
A6
50
/52
0 r
ati
o
Target concentration (uM)
Tebuconazole
Inabenfide
Mefenacet
0
0.2
0.4
0.6
0.8
1
1.2
1.4
0 1 2 3
50uM 25uM 10uM 5uM 2.5uM 1.25uM NC0.625uM
50uM 25uM 10uM 5uM 2.5uM 1.25uM NC0.625uM
0
0.2
0.4
0.6
0.8
1
1.2
1.4
0 10 20 30
65
0/5
20
Rat
io
Tuberconazole Concentration (uM)
0
0.2
0.4
0.6
0.8
1
1.2
1.4
1.6
0 20 40 60
65
0/5
20
Rat
io
Inabenfide concentration (uM)
0
0.2
0.4
0.6
0.8
1
1.2
1.4
0 20 40 60
65
0/5
20
Rat
io
Mefenacet concentration (uM)
D) E) F)

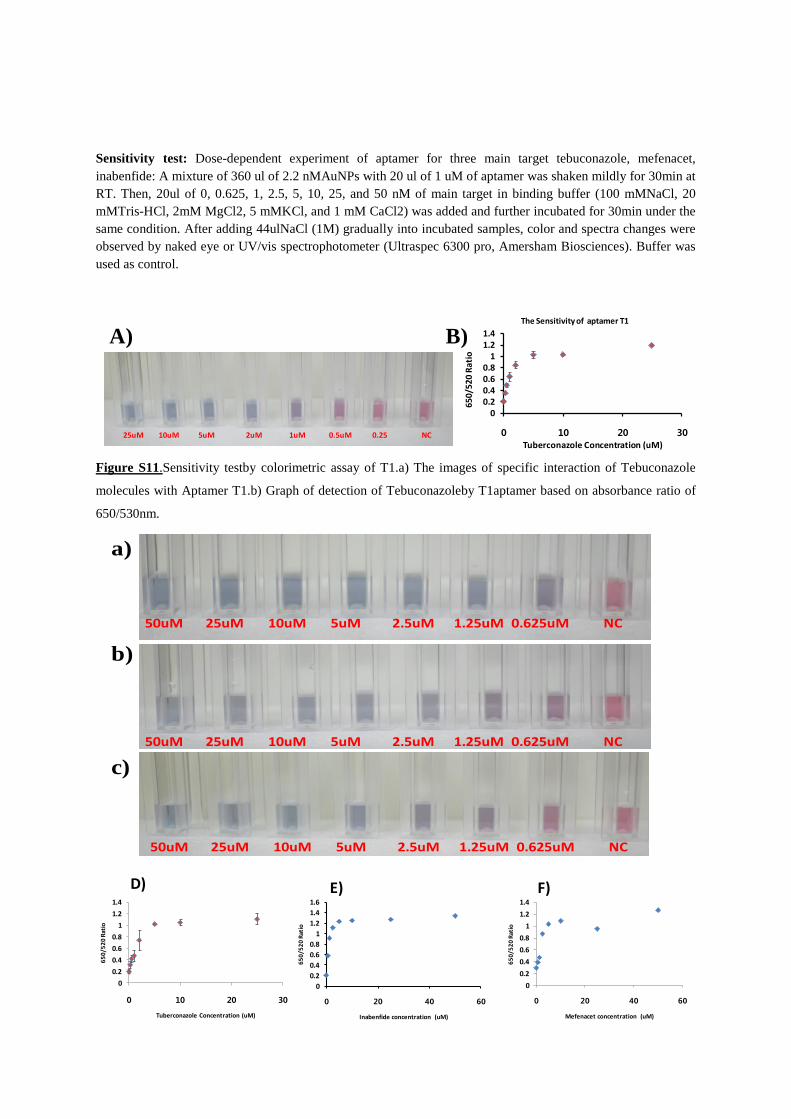
Figure S12.Sensitivity testby colorimetric assay of T2.a,b&c) The images of specific interaction of
Tebuconazole, Inabenfide and Mefenacet with Aptamer T1. D, E&F) Graph of detection of Tebuconazole by
T1 aptamer based on absorbance ratio of 650/530nm.
Figure S13.Sensitivity test by colorimetric assay of T3.A&B) The images of specific interaction of
Tebuconazole and Inabenfide with Aptamer T3. C&D) Graph of detection of Tebuconazole by T3 aptamer
based on absorbance ratio of 650/530nm.
A)
B)
0
0.2
0.4
0.6
0.8
1
1.2
0 10 20 30
65
0/5
20
Rat
io
Tuberconazole Concentration (uM)
0
0.2
0.4
0.6
0.8
1
1.2
1.4
0 20 40 60
65
0/5
20
Rat
io
Inabenfide concentration (uM)
C) D)
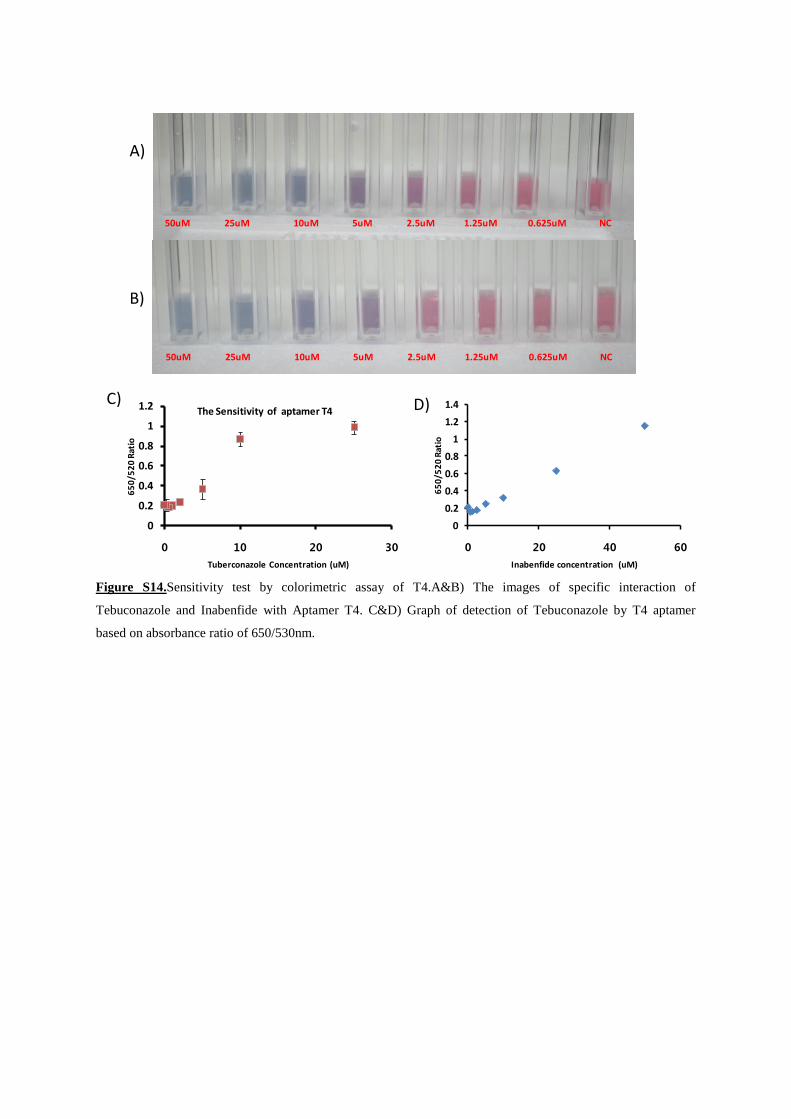
Figure S14.Sensitivity test by colorimetric assay of T4.A&B) The images of specific interaction of
Tebuconazole and Inabenfide with Aptamer T4. C&D) Graph of detection of Tebuconazole by T4 aptamer
based on absorbance ratio of 650/530nm.
50uM 25uM 10uM 5uM 2.5uM 1.25uM NC0.625uM
50uM 25uM 10uM 5uM 2.5uM 1.25uM NC0.625uM
0
0.2
0.4
0.6
0.8
1
1.2
0 10 20 30
65
0/5
20
Rat
io
Tuberconazole Concentration (uM)
The Sensitivity of aptamer T4
0
0.2
0.4
0.6
0.8
1
1.2
1.4
0 20 40 60
65
0/5
20
Rat
io
Inabenfide concentration (uM)
A)
B)
C) D)

Figure S15.Sensitivity test by colorimetric assay of T10. a) The images of specific interaction of Tebuconazole
molecules with Aptamer T10. b) Graph of detection of Tebuconazole by T10 aptamer based on absorbance ratio
of 650/530nm.
Figure S16.Sensitivity test by colorimetric assay of T3-N. a) The images of specific interaction of
Tebuconazole molecules with Aptamer T3-N. b) Graph of detection of Tebuconazole by T3-N aptamer based on
absorbance ratio of 650/530nm.
0
0.2
0.4
0.6
0.8
1
1.2
1.4
0 10 20 30
65
0/5
20
Rat
io
Tuberconazole Concentration (uM)
25uM 10uM 5uM 2uM 1uM 0.5uM NC0.25uM
A)
B)
0
0.2
0.4
0.6
0.8
1
1.2
1.4
1.6
0 5 10 15 20 25 30
65
0/5
20
Rat
io
Tuberconazole Concentration (uM)
25uM 10uM 5uM 2uM 1uM 0.5uM NC0.25uM
A)
B)
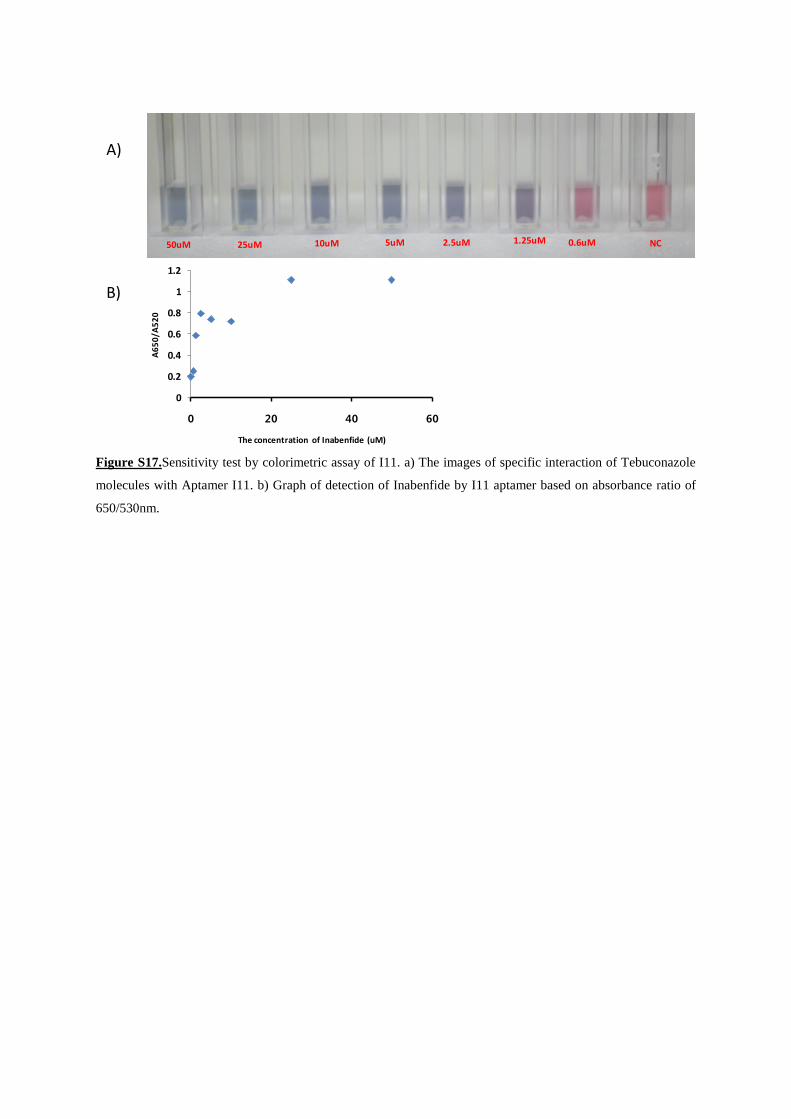
Figure S17.Sensitivity test by colorimetric assay of I11. a) The images of specific interaction of Tebuconazole
molecules with Aptamer I11. b) Graph of detection of Inabenfide by I11 aptamer based on absorbance ratio of
650/530nm.
0
0.2
0.4
0.6
0.8
1
1.2
0 20 40 60
A6
50
/A5
20
The concentration of Inabenfide (uM)
25uM 10uM 5uM 2.5uM 1.25uM 0.6uM NC50uM
A)
B)
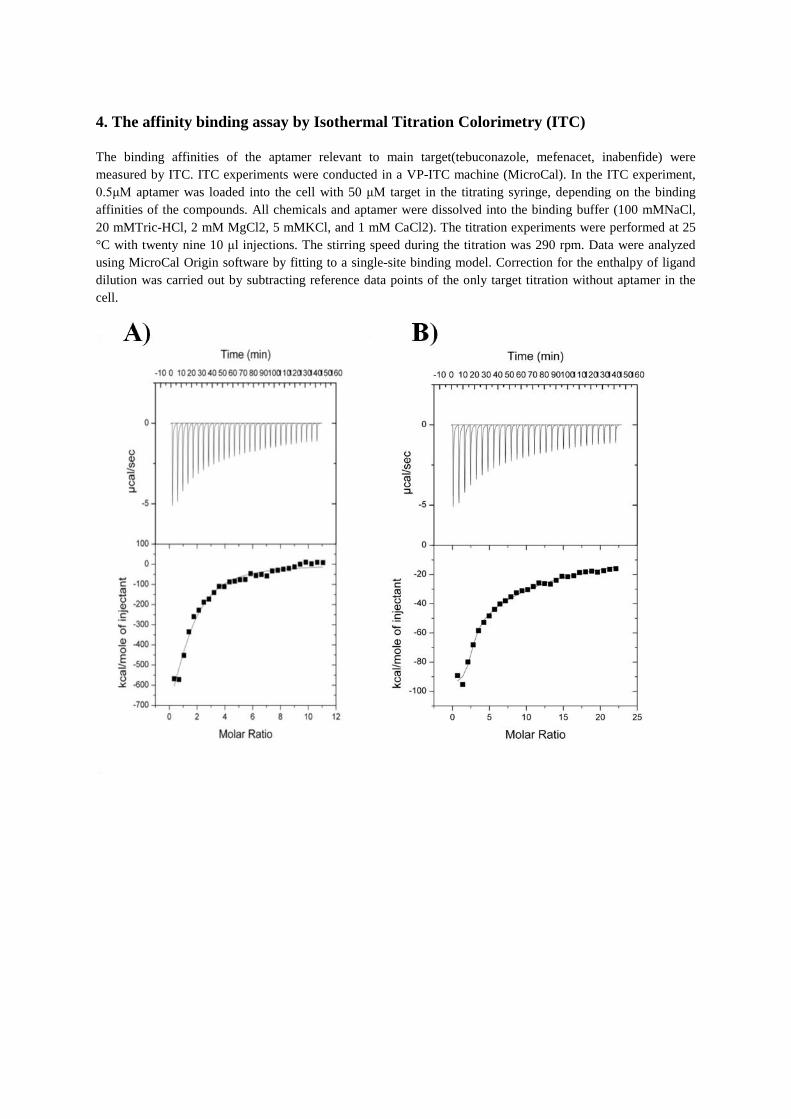
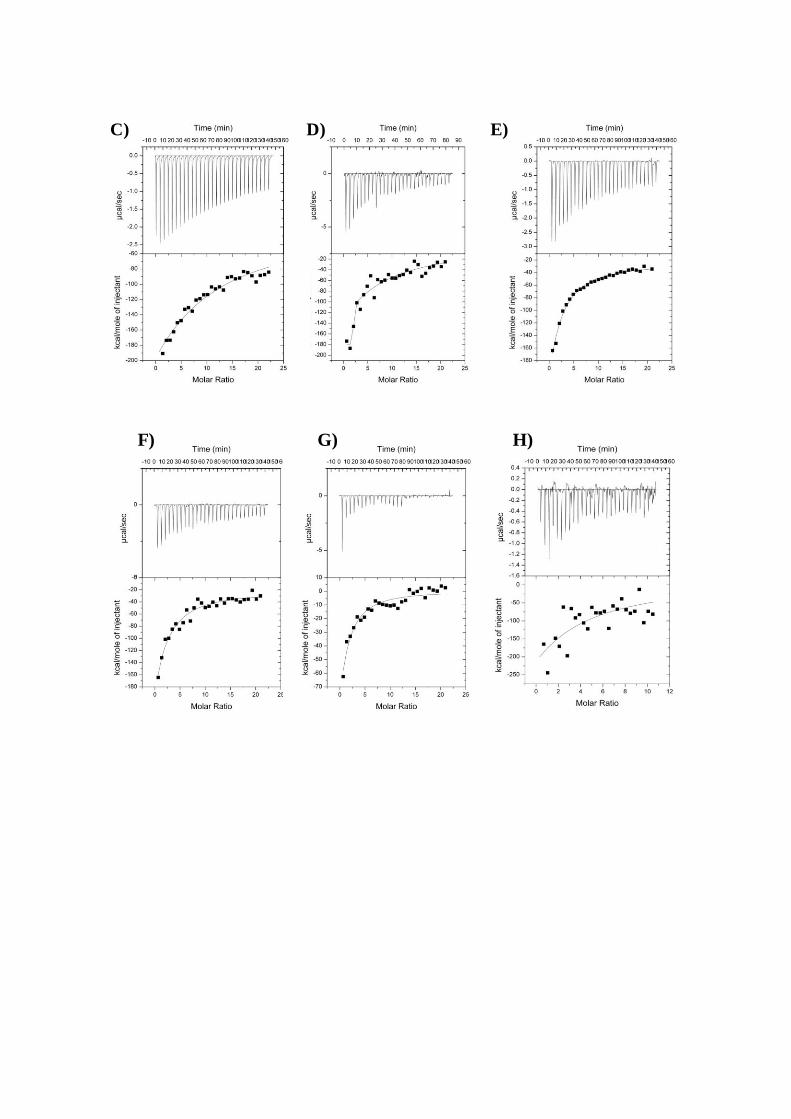
4. The affinity binding assay by Isothermal Titration Colorimetry (ITC)
The binding affinities of the aptamer relevant to main target(tebuconazole, mefenacet, inabenfide) were
measured by ITC. ITC experiments were conducted in a VP-ITC machine (MicroCal). In the ITC experiment,
0.5μM aptamer was loaded into the cell with 50 μM target in the titrating syringe, depending on the binding
affinities of the compounds. All chemicals and aptamer were dissolved into the binding buffer (100 mMNaCl,
20 mMTric-HCl, 2 mM MgCl2, 5 mMKCl, and 1 mM CaCl2). The titration experiments were performed at 25
°C with twenty nine 10 μl injections. The stirring speed during the titration was 290 rpm. Data were analyzed
using MicroCal Origin software by fitting to a single-site binding model. Correction for the enthalpy of ligand
dilution was carried out by subtracting reference data points of the only target titration without aptamer in the
cell.
D)C) E)
F) G) H)

Figure S18.The affinity binding assay by Isothermal Titration Colorimetry (ITC). A) Affinnity of T1 with
Tebuconazole; C, E& F) Affinnity of T2 with Mefennacet, Inabenfide and Tebuconazole; B&D) Affinnity of T3
with Tebuconazole andInabenfide ; G, H) Affinnity of T4 with Tebuconazole, Inabenfide; I) Affinnity of T10
with Tebuconazole; J) Affinnity of i11 with Inabenfide; K) Affinnity of T3-N with Tebuconazole; L) Affinnity
of T1N with Tebuconazole; M) Affinnity of i13 with Inabenfide; N) Affinnity of i18 with Inabenfide.

5. The binding affinity of flexible multi-target aptamers with a mixture of target.
For Flexible T2: A mixture of 360 ul of 2.2 nMAuNPs with 20 ul of 1 uM of aptamer T2 was shaken
mildly for 30min at RT. Then, 20ul of the mixture of Tebuconazole, mefenacet and Inabenfide with ratio 1:0:0;
1:1:0; 1:0:1; 0:1:1; 1:1:10 in binding buffer (100 mMNaCl, 20 mMTris-HCl, 2mM MgCl2, 5 mMKCl, and 1
mM CaCl2) was added and further incubated for 30min under the same condition. The concentration of
Tebuconazole is fixed at 500nM. After adding 20ul NaCl (1M) gradually into incubated samples, color and
spectra changes were observed by naked eye or UV/vis spectrophotometer (Ultraspec 6300 pro, Amersham
Biosciences). Buffer was used as control.
For Flexible T3: A mixture of 360 ul of 2.2 nMAuNPs with 20 ul of 1 uM of aptamer T3 was shaken
mildly for 30min at RT. Then, 20ul of the mixture of Tebuconazole and Inabenfide with ratio 1:0; 1:1/3; 1:1;
1:3, respectively, in binding buffer (100 mMNaCl, 20 mMTris-HCl, 2mM MgCl2, 5 mMKCl, and 1 mM
CaCl2) was added and further incubated for 30min under the same condition. The concentration of
Tebuconazole is fixed at 500nM. After adding 20ul NaCl (1M) gradually into incubated samples, color and
spectra changes were observed by naked eye or UV/vis spectrophotometer (Ultraspec 6300 pro, Amersham
Biosciences). Buffer was used as control.
Figure S19.The binding affinity of flexible multi-target aptamers with a mixture of target. A) The scheme of AuNP
colorimetric assay. B& C) The image and graph of the binding affinity of Flexible aptamers T3 with mixture of
Tebuconazole and Inabenfide with ratio 1:0; 1:1/3; 1:1; 1:3, respectively. D&E) The image and graph of the binding affinity
of Flexible aptamers T2 with mixture of Tebuconazole, mefenacetand Inabenfide with ratio 1:0:0; 1:1:0; 1:0:1; 0:1:1; 1:1:1.
The concentration of Tebuconazole is fixed at 500nM. A-Tebuconazole, B-Inabenfide, C-Mefenacet.

Figure S20.The binding affinity of flexible multi-target aptamers with a mixture of target. A) The scheme of AuNP
colorimetric assay. B& C) The image and graph of the binding affinity of Flexible aptamers T3 with mixture of
Tebuconazole and Inabenfide with ratio 1:0; 1:1/3; 1:1; 1:3, respectively. D&E) The image and graph of the binding affinity
of Flexible aptamers T2 with mixture of Tebuconazole, mefenacetand Inabenfide with ratio 1:0:0; 1:1:0; 1:1:1. The
concentration of Tebuconazole is fixed at 500nM. A-Tebuconazole, B-Inabenfide, C-Mefenacet.
Scrambled DNA control
Figure S21.The specificity test by colorimetric assay. A) DNA sequences for T2 and T2 scrambled No. 30 (T2S-No30). B)
The images of specific interaction of various pesticides and small molecules with the T2Scrambled No. 30.C) The

normalized 650/520 ratio of AuNP-based colorimetric assay for the T2 Scrambled No. 30(T2S-No30)with tebuconazole,
mefenacet, inabenfide , caproamide, pecyncuron, butachor, ibuprofen, dox, Oxytetracyline, tetracyline and diclofenac.
6. Circular dichroismstudies.
The conformational changes of theaptamer T2upon binding of different small molecule targets were
investigated using CD measurements. The experiments were carried out using solutions of 1μM aptamer T2 and
2μM of different small molecule targets within a quartzcuvettewith 1 cm path lengthin an optical chamber.
Figure S22. Circular dichroism data of the flexible aptamer T2 for different small molecule targets, including
Tebuconazole(T), Inabenfide(I), and Mefenacet(M).

7. References
1. J. Liu and Y. Lu, Nat. Protoc., 2006, 1, 246-252.
2.W. S.Hummers and R. E. Offeman, Journal of the American Chemical Society, 1958, 80, 6, 1339.
3. D. C. Marcano, D. VKosynkin, et al., ACS Nano, 2010,4 (8): 4806–4814.