supporting information - pnas · 2012-06-28 · supporting information geyfman et al....
TRANSCRIPT
Supporting InformationGeyfman et al. 10.1073/pnas.1209592109SI Materials and MethodsMouse Models. The K14Cre mouse was generated as described inref. 1. Bmal1 germline-knockout mice were generated as de-scribed in ref. 2. The Bmal1 floxed mouse was generated asdescribed in ref. 3.
Measurement of Reactive Oxygen Species. Seven control Bmal1−/+
and three Bmal1−/− samples were used for each time point. Totalskin samples were excised and immediately snap frozen in liquidnitrogen. Frozen skin was pulverized with a mortar and pestle,and the powder was placed in ice-cold PBS buffer containingprotease inhibitors (Roche). Lysates were spun at 10,600 × g at4 °C for 20 min. Supernatants were collected, and protein con-centration was measured using Bradford reagent. Homogenatesdiluted to 100 μg of protein in PBS with protease inhibitors wereused in each test. Each biological replicate was measured intriplicate. 5-(and-6)-carboxy-2’,7’-dichlorodihydrofluorescein di-acetate (DCFDA) (Anaspec) was dissolved in absolute ethanolat 12.5 mM concentration and stored at −80 °C. Immediatelybefore the reaction the stock DCFDA was dissolved 1:100 in 1×PBS containing protease inhibitors and then was dissolved fur-ther 1:5 in the diluted homogenate samples. Homogenate/DCFDA mixtures were vortexed and placed in black flat-bot-tomed 96-well plates and incubated in the dark at 37 °C for30 min. Readings were made using a DTX 800 Multimode De-tector plate reader (Beckman Coulter) at the excitation wave-length of 485 nm and emission of 535 nm.
Immunohistochemistry.For BrdU staining, skin was excised, placedimmediately in neutral buffered 10% (vol/vol) formalin, and fixedovernight at 4 °C. Sections were placed in 80% (vol/vol) ethanolbefore being embedded in paraffin. Sections were cut at 7-μmthickness and placed on charged slides. After deparaffinizationin xylene and rehydration in increasingly dilute ethanol solutions[100%, 95%, 80%, 50%, 30% (vol/vol), diH2O, 1× PBS], sectionswere placed in prewarmed 1M HCL solution at 37 °C for 1 h.Sections were washed five times for 5 min washing each in 1×PBS. All subsequent postincubation washes were for 5 min, re-peated three times. After blocking in 3% (vol/vol) H2O2 for 15min, sections were blocked with a serum-free block (Dako) for30 min at room temperature and were incubated with anti-BrdU(Ab6326; Abcam) overnight at 4 °C. Sections then were in-cubated for 45 min at room temperature with anti-rat bio-tinylated antibody (Vector Labs) at 1:300 dilution followed byincubation in streptavidin-HRP reagent (ABC reagent) preparedper the manufacturer’s protocol (Vector Labs). Signal was de-veloped in 3,3′ Diaminobenzidine chromogen until sufficientsignal was observed (Dako). The duration of the chromogendevelopment reaction was exactly the same for all slides. Phos-pho-histone H3 (Ser10) (06–570; Millipore) staining was per-formed identically to the BrdU staining except no 1M-HCLincubation step was used. Instead, a retrieval step was addedwith incubation in 10 mM sodium citrate (pH 6) at 96 °C for 20min following the deparaffinization and rehydration steps.Phospho-(Ser139) γ-H2AX staining (9718; Cell Signaling Tech-nologies) was performed as described for phospho-histone H3with the exception of antigen retrieval, which was performed bypreheating a solution of 1 mM EDTA in 10 mM Tris (pH 9) to96 °C and incubating slides for 20 min. The slides then weretaken off of the heat block and allowed to stay at room tem-perature in a solution of 1 mM EDTA in10 mM Tris (pH 9) for
30 min. All other steps were identical to the phospho-histone H3(Ser10) protocol described above and in ref. 4.
Cell Counts, Statistics, and Heatmaps. BrdU-positive cells werecounted using ImageJ software. All cell counts were done blindlywithout a priori knowledge of sampling time and genotype. Forevery biological replicate from epidermis, 500 cells in threenonadjacent sections were counted (1,500–2,000 cells total). Forupper follicle, secondary hair germ, and matrix, three non-adjacent sections per biological replicate were counted with atleast 10 follicles in each (total 30–40 follicles). Three to fourbiological replicates were used for each genotype per time point.The percentage of positive cells was calculated by dividing thenumber of positive cells by the total cell number. Mean and SEwere calculated using biological replicate data. P values werecalculated using Student’s t test. ANOVA calculations wereperformed as described previously (5). The sinusoidal wave-fit-ting P value was determined as for the microarray data de-scribed below. Heatmaps of microarray gene-expression datawere generated as described previously (4). In short, the ex-pression values were log2 transformed, mean centered, and hi-erarchically clustered.
Circadian Gene Discovery. Hypothesis tests. We adapted two meth-ods for identifying circadian genes, each of which captures oneperspective of circadian periodicity. One method is based onsinusoidal curve fitting. The second uses an ANOVA test. Wethen combined the tests’ individual P values using the minimummethod (6) and generated a single list of candidate circadiangenes by applying a threshold of P = 0.005 to the unifiedP values.Sinusoid curve fitting. Let xiðtÞ be the log expression level of i thgene at time point t; we preprocess the data to have zero meanand unit variance. Our first approach assumes that xiðtÞ is sam-pled from a sinusoidal curve with additive Gaussian noise, thatis, xi
�t�¼ ai sin
�1T tþ bi
�þ ci þ ni�t�, where θi ¼ ½ai; bi; ci� are the
parameters of the i th gene, niðtÞ is standard Gaussian noise, andT is a period, fixed to be 24 h. The null and alternative hy-potheses are:
H0 : ai ¼ 0 vs: H1 : ai ≠ 0;
where a rejection of the null hypothesis H0 identifies a circadiangene. To compute the P values, we estimate the minimumsquared error ei for each gene i by solving a nonlinear leastsquares fit:
ei ¼ minaibici
Xt
����xiðtÞ− ai sin�1Ttþ bi
�− ci
����2
We then simulate a large set of random samples from the nullhypothesis, that is, xðtÞ ¼ nðtÞ ∼ Nð0; 1Þ, and estimate the P valueof the i th gene by counting how frequently random samplesunder the null hypothesis achieve a squared error less than ei.ANOVA test. The sinusoidal fit provides an efficient way of iden-tifying circadian genes with sine-shaped curves. However, non-sinusoidal circadian genes also may be common, as shown in ref.7, and could be missed by sinusoid fitting. We address thisproblem by also applying an ANOVA test. For each 0 ≤ t<T, letXt ¼ fxðtþ kTÞ : k ¼ 0; 1;⋯g be a grouping of measurementsfrom the same phase t in different periods. For circadian geneswith period length T, the values inside each group Xt should be
Geyfman et al. www.pnas.org/cgi/content/short/1209592109 1 of 8

very close, but different groups should not. We take an ANOVAtest using the groups Xt with null hypothesis H0, indicating allgroups t that share the same mean, versus the alternative of in-dividual means for each group. Again, rejection of H0 indicatesa likely circadian gene. The P values are computed by an Fstatistic equal to the ratio of the averaged variance within groupsand the variance of the group means.In practice, we find that the periodic oscillations in our data for
a portion of genes (15–20% of ANOVA-defined circadian probesets) deviate from the theoretical circadian 24-h period, insteadappearing to have slightly longer or shorter periods (e.g., T = 20
or T = 28), possibly because of individual variation when threebiological replicates were pooled for the microarray study (8).This observation prompted us to perform additional ANOVAtests using periods adjacent to the circadian period, T = 20 andT = 28.All four sets of P values (three ANOVA and one sinusoid) are
combined into a single P value by taking their minimum values(6). To get a final list of circadian genes, we apply a threshold of0.005 on the combined P value; note that this list is equivalent tothe union of the lists separately produced by each test using thesame threshold.
1. Andl T, et al. (2004) Epithelial Bmpr1a regulates differentiation and proliferation inpostnatal hair follicles and is essential for tooth development.Development 131:2257–2268.
2. Bunger MK, et al. (2000) Mop3 is an essential component of the master circadianpacemaker in mammals. Cell 103:1009–1017.
3. Marcheva B, et al. (2010) Disruption of the clock components CLOCK and BMAL1 leadsto hypoinsulinaemia and diabetes. Nature 466:627–631.
4. Lin KK, et al. (2009) Circadian clock genes contribute to the regulation of hair folliclecycling. PLoS Genet 5:e1000573.
5. Bhandari A, Salmans ML, Gordon W, Andersen B (2011) Transcriptional regulation ofepidermal barrier formation. Methods Mol Biol 763:51–71.
6. Tippett HC (1952) The Methods of Statistics (Williams and Norgate, New York), p 395.7. Chudova D, Ihler A, Lin KK, Andersen B, Smyth P (2009) Bayesian detection of non-
sinusoidal periodic patterns in circadian expression data. Bioinformatics 25:3114–3120.
8. Liu Q, Lin KK, Andersen B, Smyth P, Ihler A (2010) Estimating replicate time shifts usingGaussian process regression. Bioinformatics 26:770–776.
Geyfman et al. www.pnas.org/cgi/content/short/1209592109 2 of 8

68
101214161820
wit
h T
elo
gen
Skin
936 80 353
N b f Ci di N b f Ci di
A9426 487 529
B C
0246
Who
le B
rain
Pref
rona
lH
ypot
hala
mus
SCN
Live
rKi
dney
Aorta
Sk. M
uscl
eAd
rena
lBr
own
Whi
teBo
neAt
rium
Vent
ricle
% C
om
mo
n
Number of Circadian
Genes In Telogen
Skin
Number of Circadian
Genes in Anagen
Skin
Number of Circadian
Genes In 14 Tissues
Number of Circadian
Genes in Telogen
Skin
HexoseMetabolic ProcessGen. Of Precursor Metabol And Energy
545 probesets ZT22
GO Categories of Genes UP >1.5 fold;
p-value <0.05 in Bmal1 KO Telogen Skin
Cell Surface Recept. Linked Signal Transd.G-Protein Coupled Receptor Protein Sign. Path.
GO Categories of Genes UP >1.5 fold;
p-value <0.05 in Bmal1 KO Telogen Skin
ZT10265 probesets
ED
Hexose Catabolic Process Alcohol Catabolic Process
Fatty Acid Metabolic Process Energy Deriv. By Oxidation Of Org. Comp.
Lipid Biosynthetic Process Cofactor Metabolic Process
Cellular Carbohydrate Catabolic ProcessCarbohydrate Catabolic Process
Monosaccharide Metabol. Proc.Glucose Metabolic Process
Oxidation Reduction HexoseMetabolic Process
Cellular Polysacch. Metabolic Process Energy Reserve Metabolic Process
Circadian Rhythm Cellular Glucan Metabolic Process
Glucan Metabolic Process Glycogen Metabolic Process
Reg. Of Multicellular Organism Growth Regulation Of Growth
Positive Reg. Of Growth Rhythmic Process
Cell Surface Recept. Linked Signal Transd.
Terpenoid Metabolic Process Ion Homeostasis
Retinoid Metabolic Process Diterpenoid Metabolic Process
Electron Transport Chain Chemical Homeostasis
Cellular Carbohydrate Biosynth. Process Homeostatic Process
Monosaccharide Catabolic Process Secondary Metabolic Process
Glucose Catabolic Process 0 1 2 3 4 5 6 7 8 9 10-log10 (p-value)
GO Categories of Genes DOWN >1.5 fold;
p-value <0.01 in Bmal1 KO Telogen Skin
193 probesets
Rhythmic Process
0 1 2 3 4 5 6 7 8 9
Nitrogen Compound Biosynth.Process Glycolysis
-log10 (p-value)
GO Categories of Genes DOWN >1.5 fold;
p-value <0 05 in Bmal1 KO Telogen Skin
0 1 2 3 4 5
Extracellular Structure Org.Muscle Cell Dev.
Regulation Of Cell Adhesion Response To Toxin Circadian Rhythm Rhythmic Process
-log10 (p-value)
Nitric Oxide Med Signal TransductionResponse To Cytokine Stimulus
Locomotory Behavior Response To Bacterium
Cell Surface Rec. Linked Signal Transd.G-Protein Coupled Rec. Protein Sign. Path.
571 probesets
p value <0.05 in Bmal1 KO Telogen Skin
0
100
200
300
400
m n e c
Circadian
Affected by Bmal KO
20%29% 12% 6% 86%
F
Circadian genes affected in Bmal1 KO
0 10 20 30 40 50
Nitric Oxide Med. Signal Transduction
-log10 (p-value)
Met
abol
ism
Tran
scrip
tion
Prol
ifera
tion
Cel
l Cyc
le
Ryt
hmic
proc
ess
Fig. S1. The circadian transcriptome and genes affected by Bmal1 deletion. (A) Quantification of the overlap between circadian genes in telogen and anagenskin. (B) Quantification of the fraction of common circadian genes between telogen and other circadian transcriptomes. (C) Quantification of the overlapbetween the telogen transcriptome and circadian transcripts found in at least one of 14 circadian transcriptomes. (D and E) Significantly affected GO categoriesin the differentially expressed up- and down-regulated genes in Bmal1−/− skin at Zeitgeber time (ZT) 22 and ZT10. (F) Percentage of telogen skin circadiangenes in the indicated biological functional categories affected in the Bmal1−/− mice.
Geyfman et al. www.pnas.org/cgi/content/short/1209592109 3 of 8

1500
2000
2500
1500
2000
2500
3000Bmal1
Telogen
A B
0
500
1000
0
500
1000
35004000 Per1
160018002000 Per2
2000
2500 Per3
Anagen
Per1 Per2 Per3C D E
0500
10001500200025003000
0200400600800
1000120014001600
0
500
1000
1500
2000
300400500600700800
80010001200140016001800
pres
sion
Val
ue F H
0100200300
0200400600
10000
12000 Nr1d1
3000
3500 Nr1d2
Raw
Exp
Nr1d1 Nr1d2
G
I J
1000
1500
2000
2500Hlf
0
2000
4000
6000
8000
10000
0
500
1000
1500
2000
2500
3000
0
500
1000
3000
4000
5000
6000
7000
1000
1500
2000
2500 Wee1
1500
2000
2500
3000 TefDbp
Tef Wee1L MK
0
1000
2000
3000
0
500
1000
0
500
1000
Zeitgeber time (ZT)
2 6 10 14 18 22 2 6 10 14 18 22 2 2 6 10 14 18 22 2 6 10 14 18 22 22 6 10 14 18 22 2 6 10 14 18 22 2
)TZ(emitrebegtieZ)TZ(emitrebegtieZ
Cry2
Clock
Cry1
Fig. S2. Circadian core genes and clock target genes in telogen and anagen microarrays. (A–M) Microarray expression values for core clock and clock targetgenes in telogen and anagen skin.
Geyfman et al. www.pnas.org/cgi/content/short/1209592109 4 of 8
Cellular Protein Metabolic Process
IReg of Nucleic Acid Metabolic Process
Circadian RhythmTranscription
Protein Metabolic ProcessProtein Modification Process
Phosphate Metabolic ProcessPost-Translational Protein Modification
Catabolic ProcessPhosphorylation
Cellular Protein Metabolic Process
Cellular Macromolecule Biosynth ProcessReg. of Metabolic Process
Nitrogen Compound Metabolic Process
0.0 2.0 4.0 6.0Reg. of Macromolecule Metabolic Process
Reg. of Nitrogen Compound MetabolicReg of Nucleic Acid Metabolic Process
-log10 (p-value)
Post-Translational Protein ModificationPositive Regulation of Gene Expression
Regulation of Nitrogen CompoundRegulation of Transcription
Regulation of RNA Metabolic ProcessAlcohol Metabolic Process
TranscriptionRegulation of Primary Metabolic Process
Nucleic Acid Metabolic ProcesCellular Macromolecule Biosynth. Process
II
C b h d M b li PCellular Ketone Metabolic Process
Gene ExpressionRNA Metabolic Process
Nitrogen Compound Metabolic ProcessNitrogen Compound Metabolic Process
Protein FoldingProtein Metabolic Process
0.0 2.0 4.0 6.0 8.0-log10 (p-value)
III
0.0 2.0 4.0 6.0 8.0 10.0 12.0tRNA Aminoacylation For Protein Translation
tRNA Metabolic ProcessncRNA Metabolic Process
Organic Acid Metabolic ProcessCarboxylic Acid Metabolic Process
Oxoacid Metabolic ProcessCarbohydrate Metabolic Process
-log10 (p-value)Zeitgeber time (ZT)
2 6 10 14 18 22 2 6 10 14 18 22 2
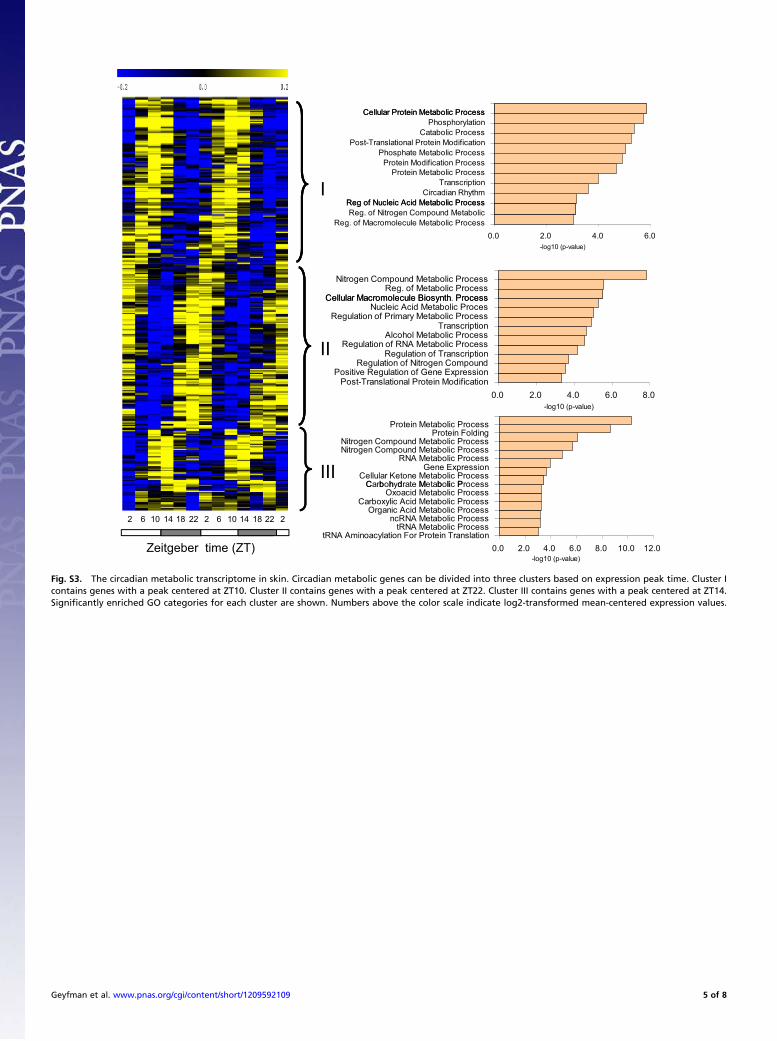
Fig. S3. The circadian metabolic transcriptome in skin. Circadian metabolic genes can be divided into three clusters based on expression peak time. Cluster Icontains genes with a peak centered at ZT10. Cluster II contains genes with a peak centered at ZT22. Cluster III contains genes with a peak centered at ZT14.Significantly enriched GO categories for each cluster are shown. Numbers above the color scale indicate log2-transformed mean-centered expression values.
Geyfman et al. www.pnas.org/cgi/content/short/1209592109 5 of 8

s
EpidermisA1 2
1.4
%M
itotic
Fig
ures
0.2
0.4
0.60.8
1
1.2
7 13 19 1 7 13 19
B
0
4
6
8
ZT11
PH
3 P
ositi
veSHG
0
2
ZT23
% P
3 7 11 15 19 23 3 7 11 15
6
8
10
ZT7
3 P
ositi
ve
MatrixC
0
2
4
ZT19
% P
H3
3 7 11 15 19 23 3 7 11 15
Zeitgeber time (ZT)
Fig. S4. Time-of-day–dependent variation in mitosis. (A) Circadian variation of mitosis in the mouse interfollicular epidermis measured at postnatal day 45(telogen) using colchicine treatment. The data were analyzed by ANOVA and sinusoidal wave fitting [F(7,19) = 6.7; P = 0.0006; sine-fit P = 3 × 10⁻⁶]. (B)Circadian variation in mitosis in the secondary hair germ (SHG) measured with phospho-histone H3 (Ser10) immunostaining at P23 (early anagen) [F(9,20) = 6.0;P = 0.20719; sine-fit P = 4.9 × 10⁻⁵]. (C) Circadian variation of mitosis in the matrix measured with phospho-histone H3 (Ser10) immunostaining at P27 (lateanagen) [F(9,20) = 5.9; P = 0.0005; sine-fit P = 2.23 × 10⁻²]. Error bars represent SEM for three or four independent biological replicates. The light/dark cycles areindicated below time-course panels.
Geyfman et al. www.pnas.org/cgi/content/short/1209592109 6 of 8

**
Epidermis
ZT10
Upper FollicleA
**
*
**
Bm
al1 -
/+
ZT22
*** *
B
* *****ZT10
Bm
a
** * * *
* * * * * * * ****
ZT22
l1
-/-
*
Fig. S5. Immunohistochemistry of BrdU-labeled Bmal1−/+ (A) and Bmal1−/− (B) interfollicular epidermis and upper follicles at ZT10 and ZT22. Positive cells areindicated by red asterisks.
Bmal1-/-Bmal1-/+
10
12
ress
ion
ZT22A B
Bmal1 fl/fl; K14 CreBmal1 fl/+; K14 Cre
B l1 fl/fl B l1 fl/fl0
2
4
6
8
10
SkinLiver
lativ
e B
mal
1 E
xpr
Epidermis Upper FollicleBmal1 fl/+; K14Cre Bmal1 fl/+; K14Cre
Bmal1 fl/fl; K14 Cre -
Bmal1 fl/fl; K14 Cre +R
e
Bmal1 fl/fl; K14Cre Bmal1 fl/fl; K14CreC D
ZT10
ZT22ZT22
Fig. S6. The influence of epidermally deleted Bmal1 on the hair growth cycle and time-of-day–dependent variation in S-phase. (A) Bmal1 mRNA concen-tration in the epidermis and liver collected at ZT22 from Bmal1fl/fl;K14Cre (Bmal1fl/fl;K14Cre+) and Bmal1fl/fl mice lacking the K14Cre allele (Bmal1fl/fl;K14Cre−).K14 Cre-mediated deletion of Bmal1 is effective and specific. (B) Representative histology images of Bmal1+/− (germline heterozygous control), Bmal1 −/−
(germline deletion), Bmal1fl/fl;K14Cre (epidermal-specific deletion), and Bmal1fl/+;K14Cre (epidermal-specific control) mice collected at P24. (C and D) Repre-sentative images from BrdU-labeled Bmal1fl/+;K14Cre and Bmal1 fl/fl;K14Cre epidermis (C) and upper follicles (D) at ZT10 and ZT22.
Geyfman et al. www.pnas.org/cgi/content/short/1209592109 7 of 8
CPDs 64PsA C H2AX
5
10
15
20
2
4
6
8
2
4
6
8
ho-H
2AX
Posi
tive
CPDs 64Ps
mal
ized
Fol
d
mal
ized
Fol
d
H2AXp < 0.05
0
5
0
2
0
2
% P
hosp
h
Zeitgeber time (ZT) Zeitgeber time (ZT) Zeitgeber time (ZT)
Nor
m
Nor
m
2 8 14 20 2 8 14 20 8 20
ZT8
Bmal1 -/+ Bmal1 -/-D
ZT20
B
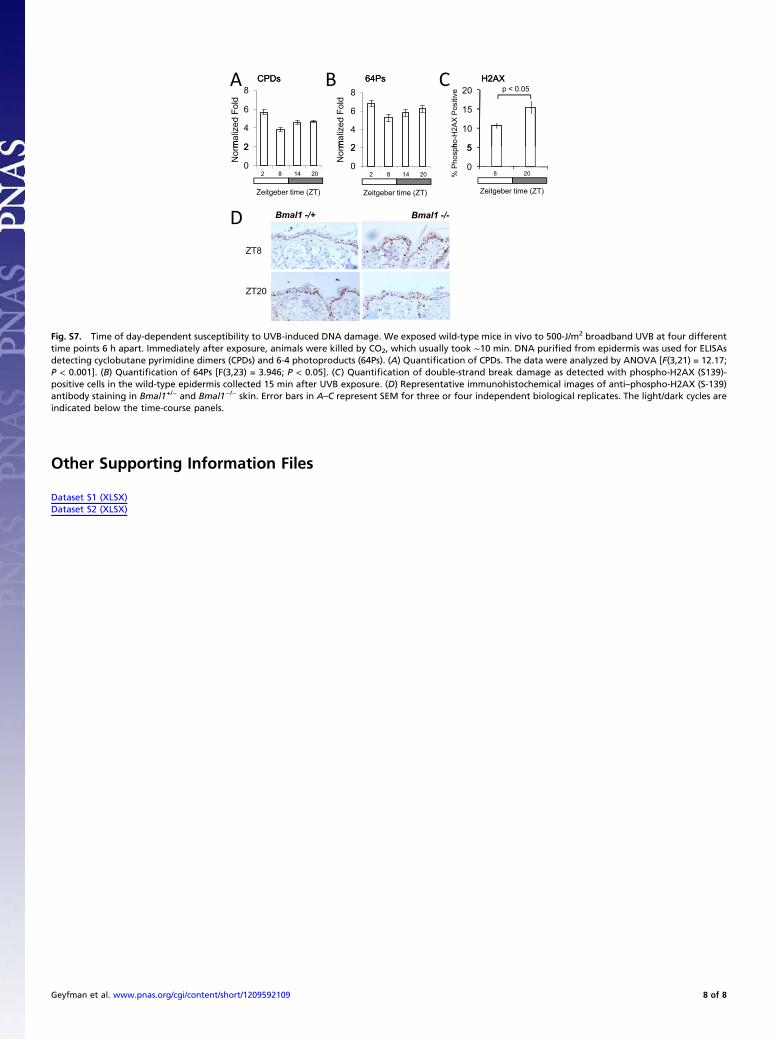
Fig. S7. Time of day-dependent susceptibility to UVB-induced DNA damage. We exposed wild-type mice in vivo to 500-J/m2 broadband UVB at four differenttime points 6 h apart. Immediately after exposure, animals were killed by CO2, which usually took ∼10 min. DNA purified from epidermis was used for ELISAsdetecting cyclobutane pyrimidine dimers (CPDs) and 6-4 photoproducts (64Ps). (A) Quantification of CPDs. The data were analyzed by ANOVA [F(3,21) = 12.17;P < 0.001]. (B) Quantification of 64Ps [F(3,23) = 3.946; P < 0.05]. (C) Quantification of double-strand break damage as detected with phospho-H2AX (S139)-positive cells in the wild-type epidermis collected 15 min after UVB exposure. (D) Representative immunohistochemical images of anti–phospho-H2AX (S-139)antibody staining in Bmal1+/− and Bmal1−/− skin. Error bars in A–C represent SEM for three or four independent biological replicates. The light/dark cycles areindicated below the time-course panels.
Other Supporting Information Files
Dataset S1 (XLSX)Dataset S2 (XLSX)
Geyfman et al. www.pnas.org/cgi/content/short/1209592109 8 of 8