supporting information kinase reveals a mutant specific
TRANSCRIPT

1
Supporting information
Conformational landscape of Epidermal growth factor receptor
kinase reveals a mutant specific allosteric pocket
Srinivasaraghavan Kannan1*, Gireedhar Venkatachalam2, Hong Hwa Lim2, Uttam Surana2,
Chandra Verma1,3,4*
1Bioinformatics Institute (BII), A*STAR, 30 Biopolis Street, 07-01 matrix, Singapore 138671
2Institute of Molecular and Cell biology (IMCB), A*STAR, 61 Biopolis Drive, 06-01
Proteos, Singapore 138673
3School of Biological Sciences, Nanyang Technological University, 60 Nanyang Drive,
Singapore 637551, Singapore
4Department of Biological Sciences, National University of Singapore, 14 Science Drive 4,
Singapore 117543, Singapore
*Corresponding authors: Srinivasaraghavan Kannan, Bioinformatics Institute (A*STAR),
30, Biopolis Street, 07-01 Matrix, Singapore 138671, Singapore, E-mail: [email protected]
star.edu.sg; Tel: +65 6478 8353; Fax: +65 6478 9048. Chandra S. Verma, Bioinformatics
Institute (A*STAR), 30, Biopolis Street, 07-01 Matrix, Singapore 138671, Singapore, E-mail:
[email protected]; Tel: +65 6478 8273; Fax: +65 6478 9048.
Electronic Supplementary Material (ESI) for Chemical Science.This journal is © The Royal Society of Chemistry 2018

2
Methods
Computational methods
MD simulations and analyses were carried out with the pmemd.cuda module of the program
Amber14 [1]. The partial charges and force field parameters for each inhibitor were
generated using the Antechamber module in Amber. All atom versions of the Amber03 force
field (ff03) [2] and the general Amber force field (GAFF) [3] were used for the protein and
the inhibitors respectively. The Xleap module was used to prepare the system for the MD
simulations. All the simulation systems were neutralized with appropriate numbers of
counter ions. Each neutralized system was solvated in an octahedral box with TIP3P [4]
water molecules, leaving at least 10Å between the solute atoms and the borders of the box.
All MD simulations were carried out in explicit solvent at 300K. During the simulations, the
long-range electrostatic interactions were treated with the particle mesh Ewald [5] method
using a real space cut off distance of 9Å. The Settle [6] algorithm was used to constrain bond
vibrations involving hydrogen atoms, which allowed a time step of 2fs during the
simulations.
The models of the complexes of EAI045 (with EGFRL858R and EGFRL861Q) were generated as
follows: MD simulations of the apo forms of EGFRL858R and EGFRL861Q were carried out and
the sampled conformations were subject to RMSD-based clustering. Representatives of the
top 10 clusters of each protein were then taken and EAI045 was docked to each chosen
conformation. From these docked complexes, we chose a model from the EAI045 -
EGFRL858R states and a model from the EAI045 - EGFRL861Q states in which the bound
EAI045 adopted a conformation similar (closest rmsd was ~0.8 Å) to its binding mode seen
in the published co-crystal structure of EAI001 complexed with the EGFRT790M/V948R (PDB
code 5d41) and subsequently subjected these two chosen models to MD simulations.

3
For each system, the solvent molecules and counter ions were initially relaxed using energy
minimization with restraints on the protein and inhibitor atoms. This was followed by
unrestrained energy minimization to remove any steric clashes. Subsequently the system was
gradually heated from 0 to 300 K using MD simulations with positional restraints (force
constant: 50 kcal mol-1 Å-2) on protein and inhibitor atoms over a period of 0.25 ns allowing
water molecules and ions to move freely. During an additional 0.25 ns, the positional
restraints were gradually reduced followed by a 2 ns unrestrained MD simulation to
equilibrate all the atoms. Finally, each system was subject to production simulations and the
details are listed in Table S2.
Analysis of the MD simulations was carried out by examining several properties. Root mean
square deviation (RMSD) of the sampled conformations against the starting structure and
average atomic fluctuations (Root mean square fluctuations or RMSF) over all sampled
conformations during the stable parts of the production phases of the MD simulations were
calculated using the ptraj module in Amber. Solvent Accessible Surface Area (SASA) was
computed using NACCESS [7]. Volume of the allosteric pocket was calculated using the
trj_cavity program [8]. Evolution of the secondary structures was calculated using the dssp
program [9]. In the case of EGFRWT (inactive), EGFRL858R (inactive), EGFRT790M (inactive)
EGFRL858R/T790M and EGFRL861Q, analysis was carried out over the 1 µs simulation trajectory,
for the other systems, either the 100ns or the 250ns production simulations were used. Three
parameters: 1. backbone dihedrals of residues that form the short α-helix; 2. volume of the
allosteric pocket; 3. rmsd of the short α-helix), were used for constructing the Free Energy
Surfaces (FES). The backbone dihedrals values were calculated for each of the 7 amino acids
that make up the short α-helix and averaged for each conformation sampled during the 1 µs
MD simulations. RMSD (with respect to the starting folded α-helical conformation) of

4
residues from 857 to 863 that form the short α-helix was calculated for all the conformations
sampled during the 1 µs MD simulations. The allosteric pocket was defined by residues that
are within 6 Å of the EAI045 inhibitor binding site in the crystal structure 5D41.pdb and the
volume of the pocket was calculated using the program trj_cavity [8] from the conformations
sampled during the 1 µs MD simulations of the respective systems. Simulation trajectories
were visualized using VMD [10] and figures were generated using PyMOL [11].
Energy Calculations
The binding free energies of complexes EAI045 - EGFRL858R and EAI045 – EGFRL861Q were
calculated using the MMPBSA (Molecular Mechanics Poisson–Boltzmann Surface Area)
methodology [12] implemented in AMBER 14 [1]. 250 conformations from the last 500 ns
of the MD simulations of each EAI045 - EGFRL858R and EAI045 – EGFRL861Q complex were
taken and water molecules and counterions removed. Binding free energies (ΔGbind) were
calculated for each conformation using:
ΔGbind = Gcomplex − (Greceptor + Gligand) (1)
where
ΔGbind = ΔGMM + ΔGsol − TΔS (2)
ΔGMM is the change in the molecular mechanics energy upon complexation in the gas phase,
ΔGsol is the change in solvation free energy and TΔS is the change of conformational entropy
associated with ligand binding. The molecular mechanics free energy (ΔGMM) is further split
into Van der Waals (ΔGvdw) and electrostatic (ΔGele) energies:
ΔGMM = ΔGele + ΔGvdw (3)

5
The solvation free energy ΔGsol arises from polar (electrostatic) solvation free energy (ΔGPB)
and nonpolar solvation free energy (ΔGSA) as in eq 4:
ΔGsol = ΔGPB + ΔGSA (4)
ΔGPB is computed by solving the linearized Poisson – Boltzmann (PB) equation using Parse
radii and a solvent probe radius of 1.4 Ǻ. In these calculations, the dielectric constant was set
to 1.0 for the interior of the solutes and 80.0 for the solvent. ΔGSA was determined using a
solvent accessible surface area (SASA)–dependent term as in eq 5:
ΔGSA = γ × SASA + β (5)
where γ is the surface tension proportionality constant and was set to 0.00542 kcal/(mol·Å−2),
and β is the offset value, which was 0.92 kcal/mol here.
The entropy term (−TΔS) was not computed, therefore the binding free energy calculated
here corresponds to only the enthalpic contribution.
Experimental Methods
In vitro binding assay was performed using KINOMEscanTM at the company DiscoverX.
Briefly, the assay uses DNA-tagged kinase, immobilized ligand, and a test compound to
quantitate the ability of a compound to compete with an immobilized ligand. Kinases
required for the study were prepared in an E.coli BL21 strain or HEK293 cells and were
further tagged with DNA for qPCR detection. EGFRWT, EGFRL858R, EGFR19del and
EGFRL861Q kinases were chosen for this study. Streptavidin-coated magnetic beads were
treated with biotinylated kinase specific ligands for 30 min at RT to generate affinity resins
for kinase assays. The compound EAI045 was bought from Selleck (catalog number -
S8242). Binding reactions were assembled by combining kinases, liganded affinity beads,

6
and test compounds in 1x binding buffer (20% SeaBlock, 0.17x PBS, 0.05% Tween 20, 6
mM DTT). Test compounds were prepared as 111X stocks in 100% DMSO. Kds were
determined using an 11-point 3-fold compound dilution series with three DMSO control
points.All compounds for Kd measurements are distributed by acoustic transfer (non-contact
dispensing) in 100% DMSO. The compounds were then diluted directly into the assays such
that the final concentration of DMSO was 0.9%. All reactions were performed in
polypropylene 384-well plates. Each well contained a final volume of 0.02 ml. The assay
plates were incubated at RT with shaking for 1 hour and the affinity beads were washed with
wash buffer (1x PBS, 0.05% Tween 20). The beads were then re-suspended in elution buffer
(1x PBS, 0.05% Tween 20, 0.5 μM non-biotinylated affinity ligand) and incubated at RT with
shaking for 30 min. The kinase concentration in the eluates was measured by qPCR.
1. Case, D. et al. Amber 14. University of California, San Francisco.
2. Ponder, J.W., Case, D.A. Force fields for protein simulations. Adv. Prot. Chem. 2003, 66,
27-85.
3. Wang, J., Wolf, R.M., Caldwell, J.W., Kollman, P.A., Case, D.A. Development and
testing of a general amber force field. J. Comput. Chem. 2004, 25, 1157–1174
4. Jorgensen, W.L., Chandrasekhar, J., Madura, J.D., Impey, R.W., Klein, M.L.
Comparison of simple potential functions for simulating liquid water. J. Chem. Phys.
1983, 79, 926–935.
5. Darden, T., York, D., Pedersen, L. Particle mesh Ewald: An N_log(N) method for Ewald
sums in large systems. J. Chem. Phys. 1993, 98, 10089–10092.
6. Miyamoto, S., Kollman, P.A. Settle: An analytical version of the SHAKE and RATTLE
algorithm for rigid water models. J. Comput. Chem. 1992, 13, 952–962.
7. Hubbard, S., Thornton, J. NACCESS, Computer Program. 1993, Department of
Biochemistry Molecular Biology, University College London
8. Paramo, T., East, A., Garzon, D., Ulmschneider, M. B., Bond, P. J. Efficient
Characterization of Protein Cavities within Molecular Simulation Trajectories: trj_cavity
J. Chem. Theory Comput. 2014, 10, 2151– 2164

7
9. Touw, W.G., etl al. A series of PDB related databases for everyday needs. Nucleic Acids
Research. 2015, 43, D364-D368
10. Humphrey, W., Dalke, A., Schulten, K. VMD—visual molecular dynamics. J. Mol.
Graph. 1996, 14, 33–38.
11. De Lano, W. The PyMOL molecular graphics system. 2002, San Carlos CA, USA: De
Lano Scientific.
12. Miller, Bill R.; McGee, T. Dwight; Swails, Jason M.; Homeyer, Nadine; Gohlke, Holger;
Roitberg, Adrian E. MMPBSA.py: An Efficient Program for End-State Free Energy
Calculations. J. Chem. Theory Comput. 2012, 8, 3314–3321.
Table S1: Details of the systems studied here. If the crystal structure was used then its PDB
code is given, else if a homology based model was constructed, then it is represented as
Model
System Active form Inactive form
EGFRWT 2ITX13 2GS716
EGFRL858R 2ITV13 Model
EGFRT790M 2JIT14 4I2417
EGFRL858R/T790M 5EDP15 Model
EGFRL681Q Model Model
EGFR19del Model Model
EGFRL858R + SNPs - Model
EGFRWT + SNPs - Model
13 Yun CH, Boggon TJ, Li Y, Woo MS, Greulich H, Meyerson M et al. Structures of Lung
Cancer-Derived EGFR Mutants and Inhibitor Complexes: Mechanism of Activation and
Insights into Differential Inhibitor Sensitivity. Cancer Cell 2007; 11(3), 217-227.
14 Yun CH et al, The T790M Mutation in Egfr Kinase Causes Drug Resistance by
Increasing the Affinity for ATP. Proc.Natl.Acad.Sci.USA, 2008 105: 2070
15 Hanan EJ, et al. 4-Aminoindazolyl-dihydrofuro[3,4-d]pyrimidines as non-covalent
inhibitors of mutant epidermal growth factor receptor tyrosine kinase.
Bioorg.Med.Chem.Lett. 2016, 26: 534-539.

8
16 Zhang X, Gureasko J, Shen K, Cole PA, Kuriyan J. An Allosteric Mechanism for
Activation of the Kinase Domain of Epidermal Growth Factor Receptor. Cell, 2006, 125,
1137-1149.
17 Gajiwala KS et al. Insights into the Aberrant Activity of Mutant EGFR Kinase Domain
and Drug Recognition. Structure, 2013, 21: 209-219.
Table S2: Simulations details of all the systems. The simulation timescale refers to the length
of the production simulations. The No of simulations refers to the number of simulations,
where each simulation was propagated with a different set of initial velocities.
S.no System Conformation Apo/complex Simulation
timescale
No of
simulations
1 EGFRWT Active Apo 100 ns 3
2 EGFRWT Inactive Apo 1 µs 2
3 EGFRL858R Active Apo 100 ns 3
4 EGFRL858R Inactive Apo 1 µs, 4 µs 2, 1
5 EGFRT790M Active Apo 100 ns 3
6 EGFRT790M Inactive Apo 1 µs, 4 µs 2, 1
6 EGFRL858R/T790M Active Apo 100 ns 3
7 EGFRL858R/T790M Inactive Apo 1 µs, 4 µs 2, 1
8 EGFRL681Q Active Apo 100 ns 3
9 EGFRL681Q Inactive Apo 1 µs 2
10 EGFRL858R Inactive Complex 100ns 3
11 EGFRL858R/T790M Inactive Complex 100ns 3
12 EGFRL861Q Inactive Complex 100ns 3
13 EGFR19del Active Apo 250ns 3
14 EGFR19del Inactive Apo 250ns 3
15 EGFRWT+SNPs Inactive Apo 250ns 3
16 EGFRL858R+SNPs Inactive Apo 250ns 3

9
Figure S1: (A) Overview of the structure of EGFRWT kinase in its active form (B) and
inactive form (C) with the Glycine rich P-loop (brown), αC – helix (yellow), hinge region
(red), DFG motif (blue) and activation loop including the short α-helix in the inactive form
(orange) highlighted. The catalytically important salt bridge (Lys745 – Glu762) interaction is
highlighted (magenta, dashed lines) in the active form of kinase (B). Colouring of the kinase
structure is the same as in Figure1.

10
Figure S2: (A) Structure of the EGFRWT kinase in its inactive form with Leu858, Leu861
and Leu862 highlighted as sticks. Colouring of the kinase structure is the same as in Figure1.

11
Figure S3: Distributions of volumes of the allosteric pockets calculated from the
conformations sampled during the MD simulations of EGFRWT (black) EGFRL858R (red)
EGFRL858R-EAI045 (green) EGFRdel19 (blue) in the active (dashed lines) and inactive
(continuous lines) conformations.

12
Figure S4: (A) Root Mean Squared Deviation (RMSD) as a function of time, averaged over
all non-hydrogen atoms for each conformation sampled during the 1s MD simulations of
EGFRWT (black), EGFRL858R (red), EGFRL861Q (cyan), EGFRL858R\T790M (orange) and
EGFRT790M (blue); (B) Root Mean Squared Fluctuations (RMSF) of the non-hydrogen atoms
averaged over all the conformations sampled during the 1s MD simulations of EGFRWT
(black) and EGFRL858R (red); (C, D) Cartoon representations of (C) EGFRWT (D) EGFRL858R
kinase domains coloured according to the flexibility (RMSF) with blue to red corresponding
to low to high flexibility (4Å).

13
Figure S5: (A) Secondary structure evolution (blue: α-helix, yellow: β-strand, gray: 310-
helix, green: turn, white: coil) of the short α helix (y-axis) during the MD simulations of
EGFRT790M.

14
Figure S6: (A) Secondary structure evolution (blue: α-helix, yellow: β-strand, gray: 310-
helix, green: turn, white: coil) of the short α helix (y-axis) during the MD simulations of
EGFRT790M/V948R. Crystal structure (B) and MD snapshot (C) of the EGFRT790M/V948R kinase
with αC – helix (Orange), short α-helix (magenta) and Leu858 shown as sticks.

15
Figure S7: Calculated MMPBSA binding free energies (ΔG) for the complexes of EAI045
with EGFRL858R (black) and EGFRL681Q (red). The van der Waals (vdW) and Electrostatics
(EEL) contributions are shown for both systems.

16
Figure S8: Residue conservation at position 858 (number corresponds to the EGFRWT kinase)
across the human kinome. (Top) distribution of all amino acids based on chemical property
(Bottom) distributions of individual amino acids based on chemical property.
17
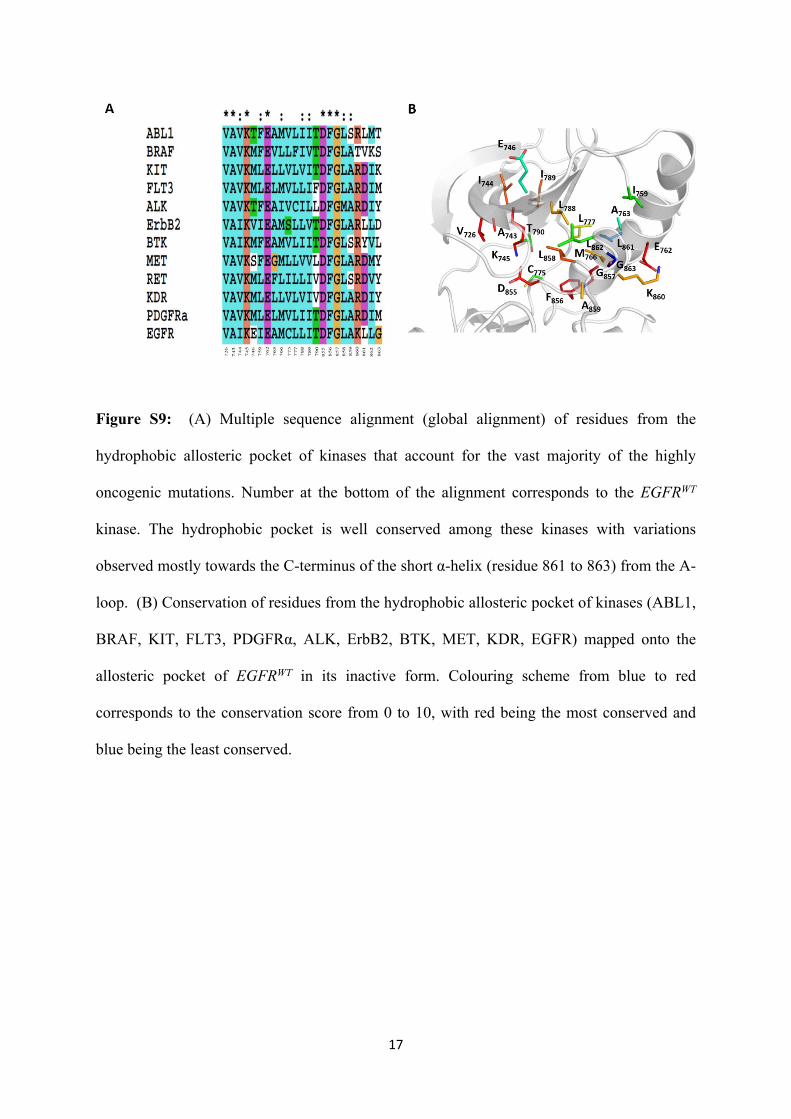
Figure S9: (A) Multiple sequence alignment (global alignment) of residues from the
hydrophobic allosteric pocket of kinases that account for the vast majority of the highly
oncogenic mutations. Number at the bottom of the alignment corresponds to the EGFRWT
kinase. The hydrophobic pocket is well conserved among these kinases with variations
observed mostly towards the C-terminus of the short α-helix (residue 861 to 863) from the A-
loop. (B) Conservation of residues from the hydrophobic allosteric pocket of kinases (ABL1,
BRAF, KIT, FLT3, PDGFRα, ALK, ErbB2, BTK, MET, KDR, EGFR) mapped onto the
allosteric pocket of EGFRWT in its inactive form. Colouring scheme from blue to red
corresponds to the conservation score from 0 to 10, with red being the most conserved and
blue being the least conserved.