supporting information for - royal society of chemistry information for synthesis of amphiphilic...
TRANSCRIPT
Supporting Information for
Synthesis of Amphiphilic Reduced Graphene Oxide with Enhanced
Charge Injection Capacity for Electrical Stimulation of Neural Cells
Qi Zhanga,b, Jun Xuc, Qin Songc, Ning Lic, Zhaolei Zhanga, Kunyang Lia, Yuyang Duc,
Liqiong Wuc, Mingliang Tangc, Liwei Liuc, Guosheng Cheng*c and Jian Liu*a
aJiangsu Key Laboratory for Carbon-Based Functional Materials and Devices, Institute of
Functional Nano and Soft Materials (FUNSOM), Collaborative Innovation Center of
Suzhou Nano Science and Technology,Soochow University, Suzhou, Jiangsu 215123,
China. E-mail:[email protected]
bState Key Laboratory of Molecular Engineering of Polymers, Fudan University,
Shanghai 200433, China.
cSuzhou Institute of Nano-Tech and Nano-Bionics, Chinese Academy of Sciences, 398
Ruoshui Road, Suzhou Industrial Park, Jiangsu 215123, China. E-mail:
Electronic Supplementary Material (ESI) for Journal of Materials Chemistry B.This journal is © The Royal Society of Chemistry 2014

1. Activation of mPEG 5k
Materials Methoxy poly(ethylene glycol) 5,000 (mPEG 5k) and hexane-1,6-diisocyanate
(HMDI, Mw 168.19 g/mol) were purchased from Sigma-Aldrich. All the reagents were
used as received.
Preparation of A-mPEG 5k In a 50 mL flask equipped with a reflux condenser and a
nitrogen gas bubbler, 5 g of mPEG 5k (1 mmol) was dissolved in 10 mL of CHCl3,
followed by addition of 20 mL (120 mmol, 120 times molar excess) of HMDI. The
mixture was heated under reflux for 48 h. The HMDI-activated mPEG 5k (A-mPEG 5k)
was precipitated in 200 mL of hexane. The precipitate was washed with a further 10 mL
of hexane, redissolved in 20 mL of CHCl3, and precipitated in 150 mL of hexane again.
This reprecipitation and washing steps were repeated six times and dried at reduced
pressure. 4.2 g of white solid was obtained with an 84.7% yield. The reaction routine was
shown as Fig. S1.1-3
Fig. S1. Activation of mPEG 5k with HMDI
1H NMR (CDCl3) of A-mPEG 5k: δ = 1.32 (m, OCN(CH2)3CH2-, 2H), 1.35 (m,
OCN(CH2)2CH2-, 2H), 1.48 (m, OCN(CH2)4CH2-, 2H), 1.59 (m, OCNCH2CH2-, 2H),
3.14 (t, OCN(CH2)5CH2-, 2H), 3.28 (t, OCNCH2-, 2H), 3.37 (s, -OCH3, 3H), 3.65 (s, -
OCH2CH2O-, 450H), 3.81 (m, -NHC(O)OCH2CH2O-, 2H), 4.19 (t, -NHC(O)OCH2-, 2H)
ppm.

2. Preparation of reduced graphene oxides
mPEG-rGO obtained at 60 °C The anhydrous graphene oxide (GO) foams (10 mg)
were added into a 25-mL round-bottom flask equipped with a magnetic stir bar, followed
by addition of 10 mL anhydrous DMF. The flask was then sonicated for 30 min under
nitrogen. The A-mPEG 5k (0.5 g) was next loaded and the mixture was heated at 60 °C
for 12-24 h. The product was centrifugated, washed with DMF and ethanol for six times.
The as-prepared mPEG-rGO-60 °C can stably disperse in polar solvents such as water,
N,N-dimethylformamide (DMF), ethanol, acetone and tetrahydrofuran (THF).
mPEG-rGO obtained at 80 °C The anhydrous GO foams (10 mg) were added into a 25-
mL round-bottom flask, followed by addition of 10 mL anhydrous DMF. The flask was
then sonicated for 30 min under nitrogen, followed by addition of A-mPEG 5k (0.5 g).
The mixture was heated at 80 °C for 6-12 h. The product was centrifugated, washed with
DMF and ethanol for six times. The as-prepared mPEG-rGO-80 °C can form stable
dispersion in various solvents such as water, DMF, acetone and THF.
The control of mPEG-rGO The anhydrous GO foams (10 mg) were added into a 25-mL
round-bottom flask, followed by addition of 10 mL anhydrous DMF. The flask was then
sonicated for 30 min under nitrogen, followed by addition of mPEG 5k (0.5 g, Sigma-
Aldrich). The mixture was heated at 160 °C for 1-5 h. The product was centrifugated,
washed with DMF and ethanol for six times.
rGON2H4 The homogeneous GO dispersion (1.2 mg/mL, 4 ml) was mixed with 10 ml of
water, 10 µl of hydrazine solution (35 wt% in water, Aldrich) and 100 µl of ammonia
solution (28 wt% in water) in a 25 mL round-bottom flask. The weight ratio of hydrazine
to GO was around 1:1.4. After being sonicated for 30 minutes, the vial was put in a water
bath (~95 °C) for 1 h. The product was centrifugated and washed with water for six times.
4
Graphene film transferring The rGO solutions were filtered to form films using a
cellulose ester membrane with 0.25 µm pores. The as-prepared filtered membranes were
wetted with ultrapure water and pressed against the clean solid substrate (e.g. Au-coated
tissue culture polystyrene, TCPS). The filtered films were attached to the substrates under
a 2 kg weight for 12 h. After that, the weight was removed and the rGO was adhered to
the substrates. The substrates containing transferred films were rinsed with ethanol and
dried by blowing with nitrogen.
3. Fourier transform infrared spectroscopy
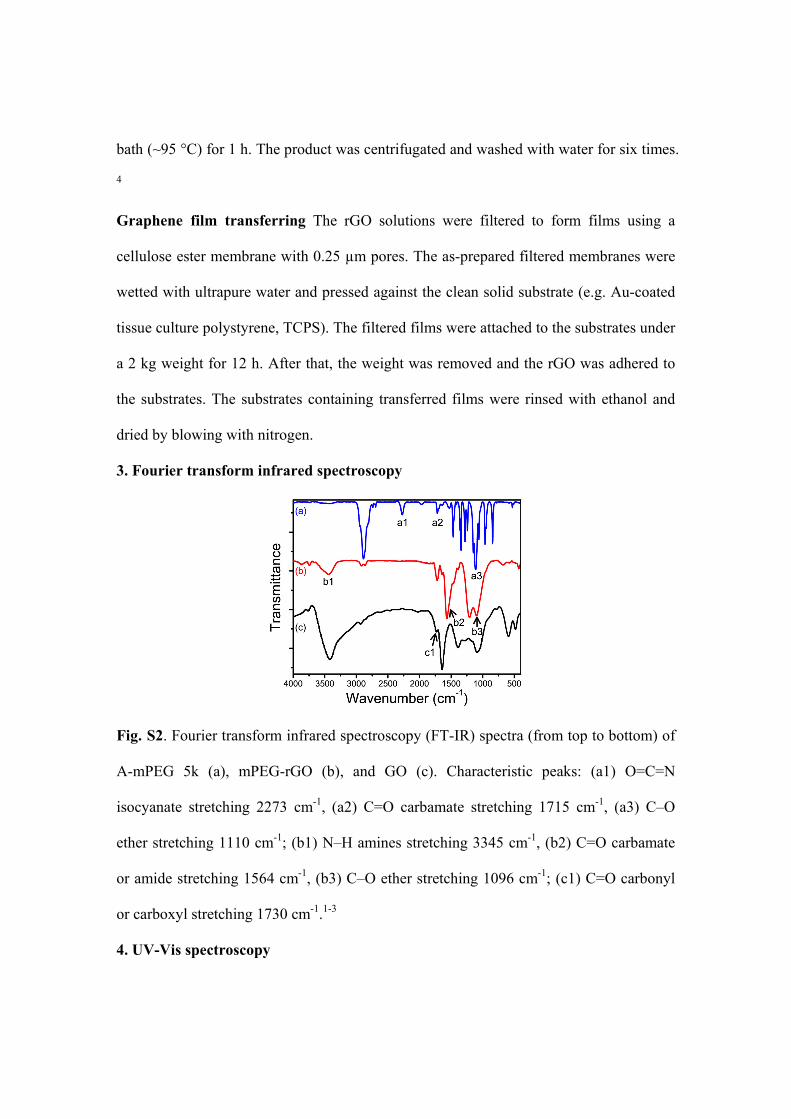
Fig. S2. Fourier transform infrared spectroscopy (FT-IR) spectra (from top to bottom) of
A-mPEG 5k (a), mPEG-rGO (b), and GO (c). Characteristic peaks: (a1) O=C=N
isocyanate stretching 2273 cm-1, (a2) C=O carbamate stretching 1715 cm-1, (a3) C–O
ether stretching 1110 cm-1; (b1) N–H amines stretching 3345 cm-1, (b2) C=O carbamate
or amide stretching 1564 cm-1, (b3) C–O ether stretching 1096 cm-1; (c1) C=O carbonyl
or carboxyl stretching 1730 cm-1.1-3
4. UV-Vis spectroscopy
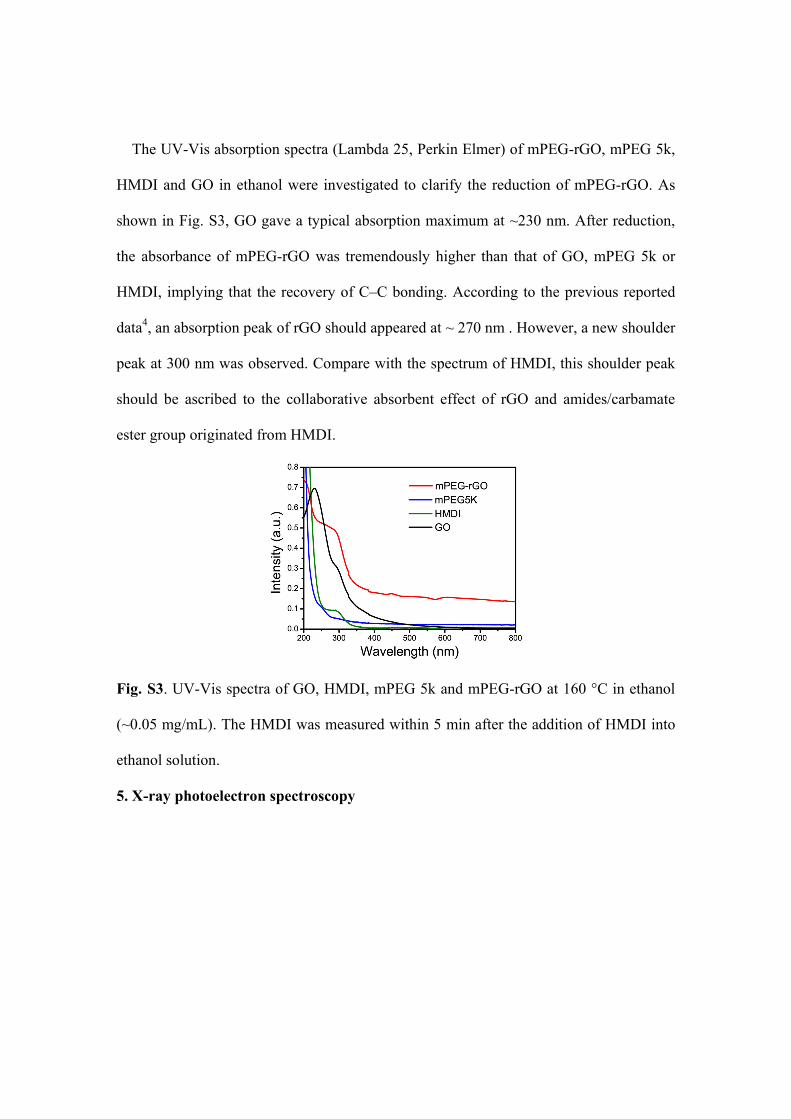
The UV-Vis absorption spectra (Lambda 25, Perkin Elmer) of mPEG-rGO, mPEG 5k,
HMDI and GO in ethanol were investigated to clarify the reduction of mPEG-rGO. As
shown in Fig. S3, GO gave a typical absorption maximum at ~230 nm. After reduction,
the absorbance of mPEG-rGO was tremendously higher than that of GO, mPEG 5k or
HMDI, implying that the recovery of C–C bonding. According to the previous reported
data4, an absorption peak of rGO should appeared at ~ 270 nm . However, a new shoulder
peak at 300 nm was observed. Compare with the spectrum of HMDI, this shoulder peak
should be ascribed to the collaborative absorbent effect of rGO and amides/carbamate
ester group originated from HMDI.
Fig. S3. UV-Vis spectra of GO, HMDI, mPEG 5k and mPEG-rGO at 160 °C in ethanol
(~0.05 mg/mL). The HMDI was measured within 5 min after the addition of HMDI into
ethanol solution.
5. X-ray photoelectron spectroscopy
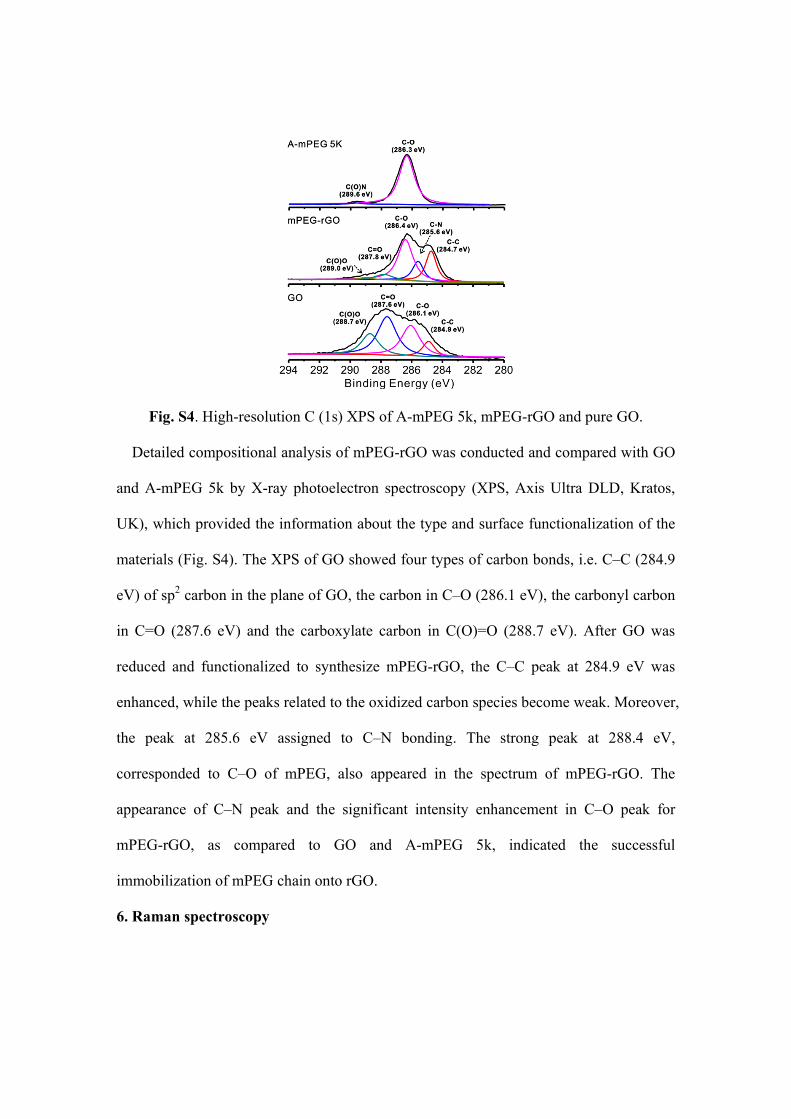
Fig. S4. High-resolution C (1s) XPS of A-mPEG 5k, mPEG-rGO and pure GO.
Detailed compositional analysis of mPEG-rGO was conducted and compared with GO
and A-mPEG 5k by X-ray photoelectron spectroscopy (XPS, Axis Ultra DLD, Kratos,
UK), which provided the information about the type and surface functionalization of the
materials (Fig. S4). The XPS of GO showed four types of carbon bonds, i.e. C–C (284.9
eV) of sp2 carbon in the plane of GO, the carbon in C–O (286.1 eV), the carbonyl carbon
in C=O (287.6 eV) and the carboxylate carbon in C(O)=O (288.7 eV). After GO was
reduced and functionalized to synthesize mPEG-rGO, the C–C peak at 284.9 eV was
enhanced, while the peaks related to the oxidized carbon species become weak. Moreover,
the peak at 285.6 eV assigned to C–N bonding. The strong peak at 288.4 eV,
corresponded to C–O of mPEG, also appeared in the spectrum of mPEG-rGO. The
appearance of C–N peak and the significant intensity enhancement in C–O peak for
mPEG-rGO, as compared to GO and A-mPEG 5k, indicated the successful
immobilization of mPEG chain onto rGO.
6. Raman spectroscopy

Fig. S5. Raman spectra of GO (black), mPEG-rGO obtained at 60 °C (bule) and mPEG-
rGO obtained at 160 °C (red).
The structural change during reduction and functionalization was also investigated by
Raman spectroscopy (lamRAM HR800, HORIBA, France). Fig. S5 presents the micro-
Raman spectra of GO, mPEG-rGO obtained at 60 °C and 160 °C. Compared with GO
and mPEG-rGO obtained at 60 °C, the ID/IG ratio of mPEG-rGO increased notably,
indicating a decrease in the sp2 cluster size perhaps caused by the defects, vacancies, or
distortions of the sp2 domains. Additionally, the relative intensity of the 2D (~2700 cm-1)
and S3 (~2930 cm cm-1) peaks of mPEG-rGO obtained at 160 °C become obscure,
showing the graphitization was distorted due to the bonding of mPEG chains.5
7. Thermogravimetric analysis
The reduction and functionalization of mPEG-rGO were further verified by
thermogravimetric analysis (TGA, TG/DTA 6200, Seiko). In Fig. S6, GO had a major
weight loss of ~40% in the temperature range from 100 to 500 ºC, which was mainly
attributed to the loss of oxygen-containing functional groups such as COOH and OH
groups. In contrast, A-mPEG 5k presented a totally different pyrolysis process. Near 97%
of weight loss occurred at 250-450 °C. Almost no residue was observed in the pyrolysis

products. Compared with GO, the mPEG-rGO obtained at 80 °C started to decomposition
at higher temperature, and the mPEG-rGO obtained at 160 °C exhibited a much higher
decomposition temperature. The mPEG-rGO obtained at 80 °C loses ~70% weight in the
temperature range of 250-450 °C, while mPEG-rGO obtained at 160 °C loses ~20%
weight, which was higher than that of the control or rGON2H4. It’s well known that the
removal of oxygen-containing functional groups results in much increased thermal
stability and reduction quality of carbon plane6. Hence, the change of weight loss was
ascribed to the amount of mPEG chains on graphene surface. Since the functionalization
and reduction were the competition reaction, a lower amount of mPEG was attached onto
the mPEG-rGO at 160 °C for it contained lower amount of functional groups. Based on
the TGA data and the yield of mPEG-rGO (~120%), it was estimated that mPEG-rGO
comprises 20-50 wt% of mPEG chains.
Fig. S6. Normalized weight of rGON2H4, the control, mPEG-rGO obtained at 160 °C &
80 °C, GO and A-mPEG 5K as a function of annealing temperature with a heating rate of
5 °C/min. The measurement was performed under a nitrogen flow (50 cm3/min) on
sample sizes from 2 to 3 mg, and the weight loss was detected in a Pt crucible from room
temperature to 800 °C.
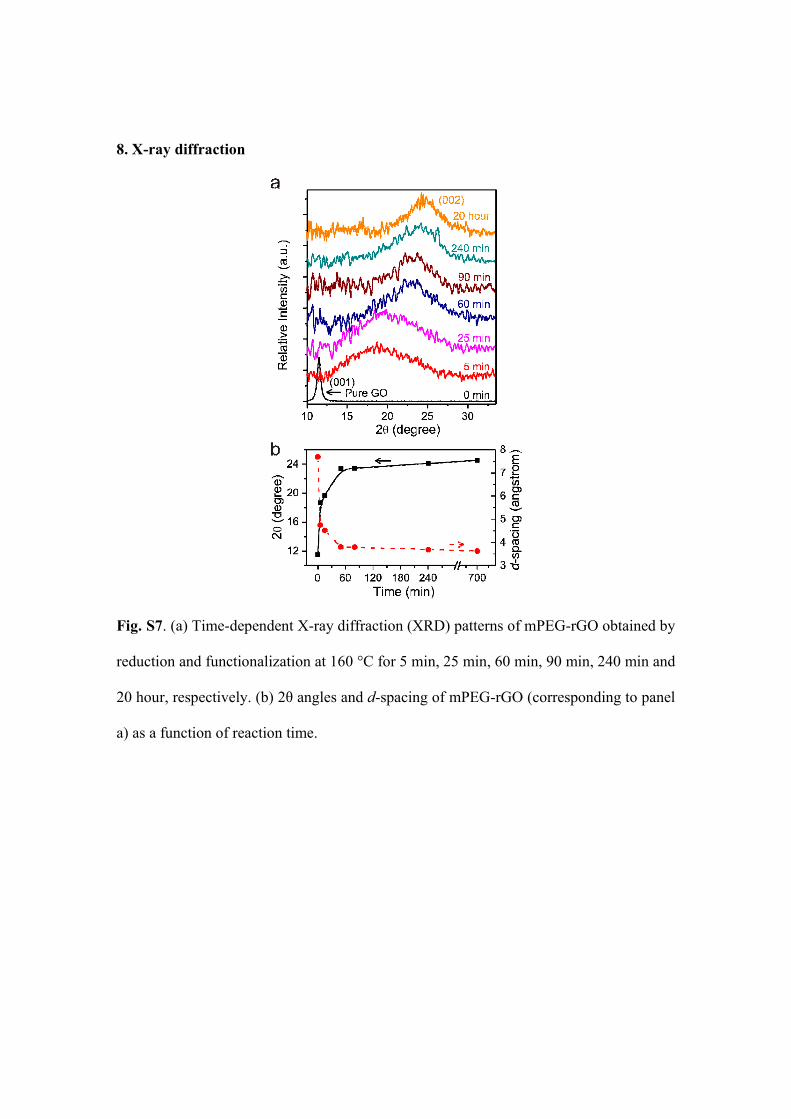
8. X-ray diffraction
Fig. S7. (a) Time-dependent X-ray diffraction (XRD) patterns of mPEG-rGO obtained by
reduction and functionalization at 160 °C for 5 min, 25 min, 60 min, 90 min, 240 min and
20 hour, respectively. (b) 2θ angles and d-spacing of mPEG-rGO (corresponding to panel
a) as a function of reaction time.

Fig. S8. XRD patterns of mPEG-rGO at 160 °C and control
9. Cell viability assay
Fig. S9. Scanning electron microscopy (SEM, Quanta 400 FEG, FEI, USA) images of
bare mPEG-rGO (a), and PC12 cells adhered on mPEG-rGO after 1 day culture (b&c).
The insets illustrate the zoom-in view of white rectangular area. The white arrows point
to the wrinkles of the mPEG-rGO film. For imaging, cells were fixed by 2.5%
glutaraldehyde in pH 7.4 phosphate buffer, followed by post-fixation in 1% osmium
tetroxide and by progressive dehydration in ethanol.
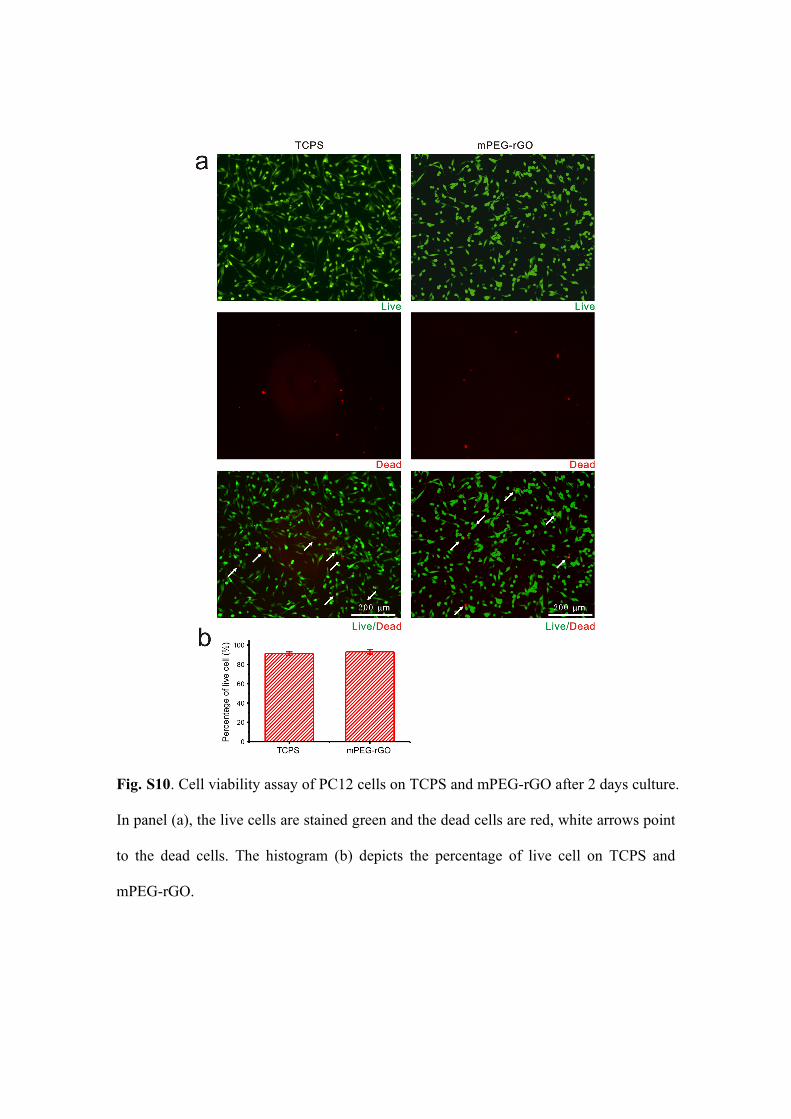
Fig. S10. Cell viability assay of PC12 cells on TCPS and mPEG-rGO after 2 days culture.
In panel (a), the live cells are stained green and the dead cells are red, white arrows point
to the dead cells. The histogram (b) depicts the percentage of live cell on TCPS and
mPEG-rGO.
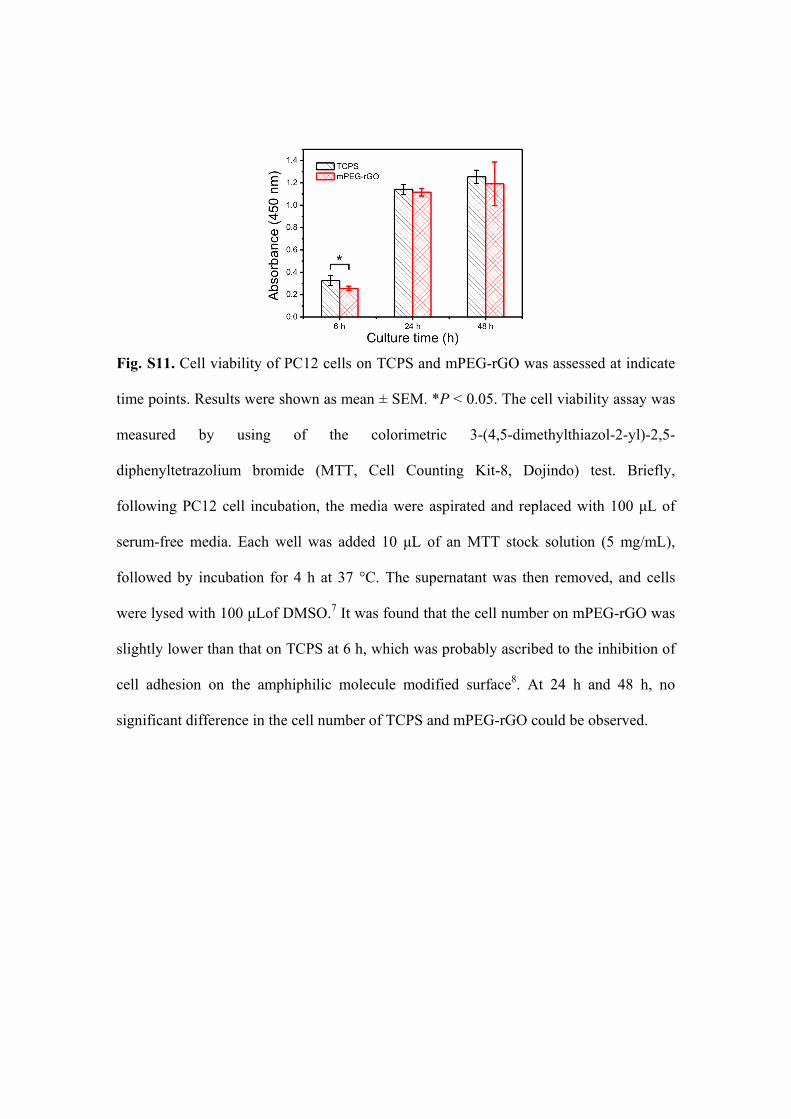
Fig. S11. Cell viability of PC12 cells on TCPS and mPEG-rGO was assessed at indicate
time points. Results were shown as mean ± SEM. *P < 0.05. The cell viability assay was
measured by using of the colorimetric 3-(4,5-dimethylthiazol-2-yl)-2,5-
diphenyltetrazolium bromide (MTT, Cell Counting Kit-8, Dojindo) test. Briefly,
following PC12 cell incubation, the media were aspirated and replaced with 100 μL of
serum-free media. Each well was added 10 μL of an MTT stock solution (5 mg/mL),
followed by incubation for 4 h at 37 °C. The supernatant was then removed, and cells
were lysed with 100 μLof DMSO.7 It was found that the cell number on mPEG-rGO was
slightly lower than that on TCPS at 6 h, which was probably ascribed to the inhibition of
cell adhesion on the amphiphilic molecule modified surface8. At 24 h and 48 h, no
significant difference in the cell number of TCPS and mPEG-rGO could be observed.
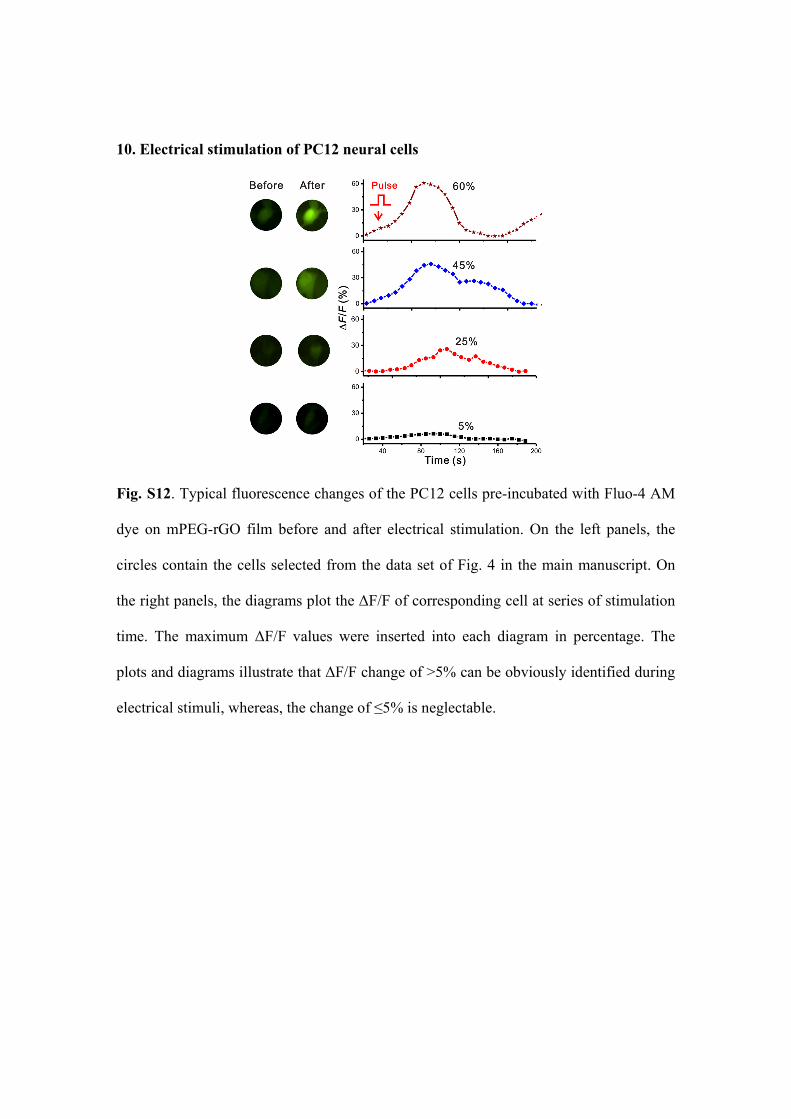
10. Electrical stimulation of PC12 neural cells
Fig. S12. Typical fluorescence changes of the PC12 cells pre-incubated with Fluo-4 AM
dye on mPEG-rGO film before and after electrical stimulation. On the left panels, the
circles contain the cells selected from the data set of Fig. 4 in the main manuscript. On
the right panels, the diagrams plot the ΔF/F of corresponding cell at series of stimulation
time. The maximum ΔF/F values were inserted into each diagram in percentage. The
plots and diagrams illustrate that ΔF/F change of >5% can be obviously identified during
electrical stimuli, whereas, the change of ≤5% is neglectable.
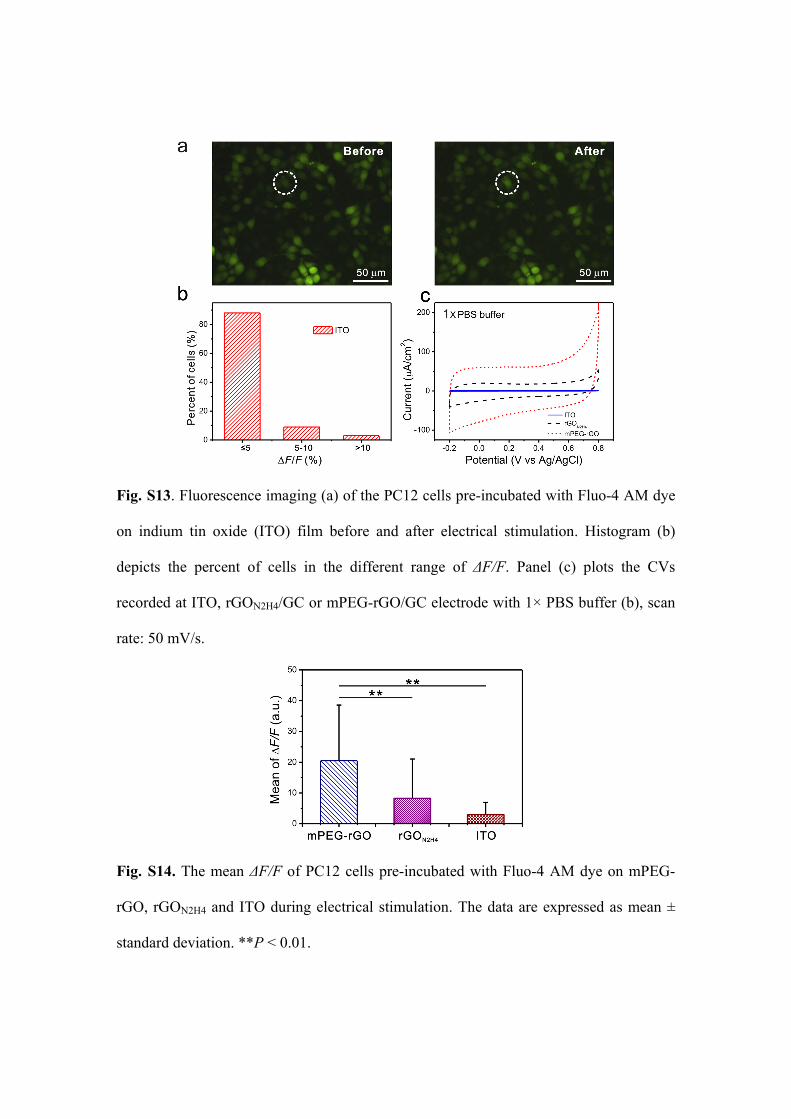
Fig. S13. Fluorescence imaging (a) of the PC12 cells pre-incubated with Fluo-4 AM dye
on indium tin oxide (ITO) film before and after electrical stimulation. Histogram (b)
depicts the percent of cells in the different range of ΔF/F. Panel (c) plots the CVs
recorded at ITO, rGON2H4/GC or mPEG-rGO/GC electrode with 1× PBS buffer (b), scan
rate: 50 mV/s.
Fig. S14. The mean ΔF/F of PC12 cells pre-incubated with Fluo-4 AM dye on mPEG-
rGO, rGON2H4 and ITO during electrical stimulation. The data are expressed as mean ±
standard deviation. **P < 0.01.
Reference
1 M. Glodde, S. R. Sirsi and G. J. Lutz, Biomacromolecules, 2005, 7, 347-356. 2 X. Zhang, S.-R. Pan, H.-M. Hu, G.-F. Wu, M. Feng, W. Zhang and X. Luo, J.
Biomed. Mater. Res., 2008, 84A, 795-804. 3 H. Petersen, P. M. Fechner, D. Fischer and T. Kissel, Macromolecules, 2002, 35,
6867-6874. 4 D. Li, M. B. Muller, S. Gilje, R. B. Kaner and G. G. Wallace, Nat. Nanotechnol.,
2008, 3, 101-105. 5 I. K. Moon, J. Lee, R. S. Ruoff and H. Lee, Nat. Commun., 2010, 1, 73. 6 H.-K. Jeong, Y. P. Lee, M. H. Jin, E. S. Kim, J. J. Bae and Y. H. Lee, Chem. Phys.
Lett., 2009, 470, 255-258. 7 Y. Zhang, S. F. Ali, E. Dervishi, Y. Xu, Z. Li, D. Casciano and A. S. Biris, ACS
Nano, 2010, 4, 3181-3186. 8 S. Park, N. Mohanty, J. W. Suk, A. Nagaraja, J. An, R. D. Piner, W. Cai, D. R.
Dreyer, V. Berry and R. S. Ruoff, Adv. Mater., 2010, 22, 1736-1740.