support under portland cement concrete...
TRANSCRIPT

NATION A L COOPER AT I V E HI G H W Ay RESEARCH 'PROGRAM
Support Under Portland Cement Concrete Pavements
is Transportation Research Board
National Research Council

TRANSPORTATION RESEARCH BOARD EXECUTIVE COMMITTEE 1995
OFFICERS Chair: Lillian C. Liburdi, Director, Port Authority, 77ie Port Authority of New York and New Jersey Vice Chair: James W VAN Loben Sets, Director, California Department of Transportation
Executive Director: Robert E. Skinner, Jr., Transportation Research Board
UPMURRS
EDWARD H. ARNOLD, Chair and President, Arnold Industries, Lebanon, PA SHARON D. BANKS, General Manager, AC Transit, Oakland, CA
BRIAN J. L. BERRY, Lloyd Viel Berkner Regental Professor & Chair, Bruton Center for Development Studies, University of Texas at Dallas
DWIGHT M. BOWER, Director, Idaho Department of Transportation JOHN E. BREEN, The Nasser I Al-Rashid Chair in Civil Engineering, The University of Texas at Austin DAVID BURWELL, President, Rails-ro-Trails Conservancy A. RAY CHAMBERLAIN, Vice President, Freight Policy, American Trucking Associations, Inc. (Past Chair, 1993) RAY W. CLOUGH, Nishkian Professor of Structural Engineering, Emeritus, University of California, Berkeley JAMES N. DENN, Commissioner, Minnesota Department of Transportation JAMES C. DELONG, Director ofAviation, Denver International Airport, Denver, Colorado DENNIS J. FITZGERALD, Executive Director, Capital District Transportation Authority, Albany, NY JAMES A. HAGEN, Chairman of the Board and CEO, CONRAIL DELON HAMPTON, Chairman & CEO, Delon Hampton & Associates
LESTER A. HOEL, Hamilton Professor, Civil Engineering, University of Virginia DON C. KELLY, Secretary and Commissioner of Highways, Transportation Cabinet, Kentucky ROBERT KOCHANOWSKI, Executive Director, Southwestern Pennsylvania Regional Planning Commission JAMES L. LAMMIE, President & CEO, Parsons Brinckerhoff, Inc. CHARLES P. O'LEARY, JR.; Commissioner, New Hampshire Department of Transportation JUDIt W. P. PATIN, Secretary, Louisiana Department of Transportation and Development
CRAIG E. PHILIP, President, Ingram Barge Co., Nashville, IN DARREL RENSINK, Director, Iowa Department of Transportatio JOSEPH M. SUSSMAN, JR East Professor, Civil and Environmental Engineering, MIT MARTIN WACHS~, Director, Institute of Transportation Studies, Univ'e'rsity of' California DAVID N. WORMLEY, Dean of Engineering, Pennsylvania State University HOWARD YERUSALIM, Secretary of Transportation, Pennsylvania Department of Transportation
MIKE ACOTT, President, National Asphalt Pavement Association (ex officio)
ROY A. ALLEN, Vice President, Research and Test Department, Association ofAmerican Railroads (ex officio)
ANDREW H. CARD, JR., President and CEO, American Automobile Manufacturers Association THOMAS J. DONOHUE, President and CEO, American Trucking Associations (ex officio)
FRANCIS B. FRANCOIS, Executive Director, American Association of State Highway and Transportation Officials (ex officio) JACK R. GILSTRAP, Executive Vice President, American Public Transit Association (ex officio) ALBERT J. HERBERGER, Maritime Administrator, U.S. Department of Transportation (ex officio) DAVID R. HINSON, Federal Aviation Administrator, U.S. Department of Transportation (ex officio) GORDON J. LINTON, Federal Transit Administrator, US. Department of Transportation (ex officio) RICARDO MARTINEZ, Federal Railroad Administrator, U.S. Department of Transportation (ex officio) JOLENE M. MOLITORIS, Federal Railroad Administrator, US. Department of Transportation (ex officio)
DAVE SHARMA, Research and Special Programs Administrator, US. Department of Transportation (ex officio) RODNEY E. SLATER, Federal Highway Administrator, US. Department of Transportation (ex officio) ARTHUR E. WILLIAMS, Chief of Engineers and Commande~r,_U.S. Army Corps of Engineers (ex officio)
NATIONAL COOPERATIVE HIGHWAY RESEARdH PROGRAM
Transportation Research Board Executive Committee Subconuninee for NCHR
LILLIAN C. LD3URDI, Port Authority qf New York and New Jersey (Chair) FRANCIS B. FRANCOIS, American Association of State Highway and
Transportation Officials
LESTER A. HOEL, University of Virginia
ROBERT E. SKINNER, JR., Transportation Research Board RODNEY E. SLATER, Federal Highway Administration JOSEPH M. SUSSMAN, Massachusetts Institute of Technology JAMES W. VAN LOBEN SELS, California Department of Transportation
Field of Design Area of Pavements Project Panel CI-3 THOMAS M. HEARNE, JR., North Carolina Department of Transportation (Chair) EDMUND J. OBERC, Maryland State Highway Administration LARRY 1. BUTTLER, Texas Department of Transportation SHAD M. SARGAND, Ohio University PAUL T. FOXWORTHY, Louisiana Stale University CLINTON E. SOLBERG, American Concrete Pavement Association MAX G. GROGG, Federal Highway Administration WEI-SHIH YANG, New York StateDepartment of Transporation JAMES M. HOOVER, Iowa State University (Prof. Emeritus) RAMON BONAQUIST, FHWA Liaison Representative BRIAN R. McWATERS, Iowa Department of Transportation G.P. JAYAPRAKASH, TRB Liaison Representative
Program S
ROBERT J. REILLY, Director, Cooperative Research Programs FRANK R. McCULLAGH, Senior Program Officer
CRAWFORD F. JENCKS, Manager, NCHRP KENNETH S. OPIELA, Senior Program Officer
LLOYD R.-CROWTHER, Senior Program Qjficer SCOTT A. SABOL, Senior Program Officer
B. RAY DERR, Senior Program Officer EILEEN P. DELANEY, Editor
AMIR N. HANNA, Senior Program Officer KAMI CABRAL, Editorial Assistant

NATIONAL COOPERATIVE HIGHWAY RESEARCH PROGRAM
Report 372
Support Under Portland Cement Concrete Pavements
MICHAEL 1. DARTER, KATHLEEN T. HALL, and CHEN-MING KUO
Department of Civil Engineering University of Illinois at Urbana-Champaign
Pavement Design, Management, and Performance
Research Sponsored by the American Association of State Highway and Transportation Officials in Cooperation with the
Federal Highway Administration
TRANSPORTATION RESEARCH BOARD NATIONAL RESEARCH COUNCIL
NATIONAL ACADEMY PRESS Washington, D.C. 1995

NATIONAL COOPERATIVE HIGHWAY RESEARCH PROGRAM
Systematic, well-designed research provides the most effective
approach to the solution of many problems facing highway admin-
istrators and engineers. Often, highway problems are of local inter-
est and can best be studied by highway departments individually
or in cooperation with their state universities and others. However,
the accelerating growth of highway transportation develops in-
creasingly complex problems of wide interest to highway authori-
ties. These problems are best studied through a coordinated pro-
gram of cooperative research.
In recognition of these needs, the highway administrators of
the American Association of State Highway and Transportation
Officials initiated in 1962 ' an objective national highway research
program employing modem scientific techniques. This program is
supported on a continuing basis by funds from participating member
states of the Association and it receives the full cooperation and
support of the Federal Highway Administration, United States De-
partment of Transportation. The Transportation Research Board of the National Research
Council was requested by the Association to administer the research
program because of the Board's recognized objectivity and under-
standing of modem research practices. The Board is uniquely suited
for this purpose as it maintains an extensive committee structure
from which authorities on any highway transportation subject may be drawn; it possesses avenues of communications and cooperation
with federal, state and local governmental agencies, universities,
and industry; its relationship to the National Research Council
is an insurance of objectivity; it maintains a full-time research
correlation staff of specialists in highway transportation matters to
bring the findings of research directly to those who are in a position
to use them.
The program is developed on the basis of research needs identi-
fied by chief administrators of the highway and transportation
departments and by comirlittees of AASHTO. Each year, specific
areas of research needs to be included in the program are proposed
to the National Research Council and the Board by the American
Association of State Highway and Transportation Officials. Re-
search projects to fulfill these needs are defined by the Board,
and qualified research agencies are selected from those that have
submitted proposals. Administration and surveillance of research
contracts are the responsibilities of the National Research Council
and the Transportation Research Board.
Ile needs for highway research are many, and the National
Cooperative Highway Research Program can make significant con-
tributions to the solution of highway transportation problems of
mutual concern to many responsible groups. The program, how-
ever, is intended to complement rather than to substitute for or
duplicate other highway research programs.
Note: The Transportation Research Board, the National Research Council, the Federal Highway Administration, the American Association of State Highway and Transportation Officials, and the individual states participating in the National Cooperative Highway Research Program do not endorse products or manufac-turers. Trade or manufacturers names appear herein solely because they are considered essential to the object of this report.
NCHRP REPORT 372
Project 1-30 FY'93
ISSN 0077-5614
ISBN 0-309-05373-0
L. C. Catalog Card No. 95-60667
Price $21.00
ZJG)Kel~
The project that is the subject of this report was a part of the National Cooperative Highway Research Program conducted by the Transportation Research Board with the approval of the Governing Board of the National Research Council. Such approval reflects the Governing Board's judgment that the program concerned is of national importance and appropriate with respect to both the purposes and resources of the National Research Council.
The members of the technical cornm~ittee selected to monitor this project and to review this report were chosen for recognized scholarly competence and with due consideration for the balance of disciplines appropriate to the project. The opinions and conclusions expressed or implied are those of the research agency that performed the research, and, while they have been accepted as appropriate by the technical committee, they are not necessarily those of the Transportation Research Board, the National Research Council, the American Association of State Highway and Transportation officials, or the Federal Highway Administration, U.S. Department of Transportation.
Each report is reviewed and accepted for publication by the technical conuwttee according to procedures established and monitored by the Transportation Research Board Executive Committee and the Governing Board of the National Research Council.
Published reports of the
NATIONAL COOPERATIVE HIGHWAY RESEARCH PROGRAM
are available from:
Transportation Research Board
National Research Council
2101 Constitution Avenue, N.W.
Washington, D.C. 20418
Printed in the United States of America

FOREWORD This'report contains the findings of a study that was performed to provide guidance for consideration of structural support in the design of portland cement concrete pave-
BY Staff ments. The report provides a comprehensive description of the research, including an Transportation Research examination of support concepts and causes of loss of support, a review of related data
Board from numerous field studies, a description of a three-dimensional finite element model for the analysis of the effects of support on pavement response, and recommended revisions to the American Association of State Highway and Transportation Officials (AASHTO) Guidefor Design of Pavement Structures. The contents of this report will be of immediate interest to pavement engineers, researchers, and others concerned with the design, con-struction, and rehabilitation of concrete pavements.
There is no general agreement among pavement engineers on how to select values for the modulus of subgrade reaction and the loss of support due to erosion, curling, and warping for use in design of rigid pavements and rigid pavement overlays. A perceived lack of adequate guidance in the AASHTO Guide for Design of Pavement Structures has resulted in inconsistent design practices for concrete pavements. Therefore, guidelines are needed to ensure proper consideration of support in pavement design.
Under NCHRP Project 1-30, "Support Under Portland Cement Concrete Pavement," the University of Illinois at Urbana-Champaign was assigned the task of developing guidelines for improved consideration of support in rigid pavement design. To accomplish this objective, the researchers examined support concepts and causes of loss of support, reviewed related data from numerous field studies, adapted a three-dimensional finite element model to analyze the effects of support on pavement response to traffic and climatic conditions, and proposed guidelines for improving the consideration of support in the AASHTO design procedure for concrete pavements. This report documents the work performed under Project 1-30 and discusses the validation and the finite element model analysis performed in preparing the proposed guidelines.
The proposed guidelines, summarized in this report, represent comprehensive revi-sions to the following portions of the AASHTO Guide for Design of Pavement Structures: Section 3.2, "Rigid Pavement Design," and Section 3.3, "Rigid Pavement Joint Design," of Chapter 3, Highway Pavement Structural Design, of Part 11, Pavement Design Proce-dures for New Construction and Reconstruction; Appendix I, Rigid Pavement Design Example; and Appendix HH, Development of Effective Roadbed Soil Moduh. The revi-sions proposed by the University of Illinois research team will be considered by AASHTO's Joint Task Force on Pavements for inclusion in the AASHTO Guide dur-ing 1995.

1
5
8
39
43
47
50
50
50
50
50
50
50
50
CONTENTS
SUMMARY
CHAPTER ONE Introduction and Research Approach Problem Statement and Research Objective, 5 Scope of Study, 7 Research Approach, 7 Organization of Report, 7
CHAPTER Two Findings Evolution of the k-Value, 8 Backcalculation Field Results, 16 Recommendations for Determining k-Value, 21 3-D Finite Element Model of Concrete Pavement, 22 Loss of Support, 22 Improved Consideration of Support in AASHTO Methodology, 25
CHAPTER THREE Interpretation, Appraisal, and Application Improved Guidelines for Selection of Design k-Value, 39 Improved Support Consideration in AASHTO Design Methodology, 39 Improved Support Characterization for Mechanistic Design, 40
CHAPTER FOUR Conclusions and Suggested Research Conclusions, 43 Suggested Research, 46
REFERENCES
APPENDIX A Development of k-Value Concepts and Methods
APPENDIX B Methods for Estimating k-Value
APPENDIX c Loss-of-Support Concepts and Methods
APPENDIX D- Three-Dimensional Finite Element Model Development and Validation
APPENDIX E Improved Consideration of Support in Current AASHTO Methodology
APPENDIX F Proposed Revision to AASHTO Guide, Part H, Section 3.2, "Rigid Pavement Design," and Section 3.3, "Rigid Pavement Joint Design"
APPENDIX G Rigid Pavement Design Example (Proposed Revision To AASHTO Guide Appendix 1)
APPENDIX H Development of Effective Roadbed Soil k-Value (Proposed Revision to AASHTO Guide Appendix HH)

ACKNOWLEDGMENTS
This research was conducted under NCHRP Project 1-30 by the Civil Engineering Department of the University of Illinois at Urbana-Champaign, under subcontract to the Illinois Universities Transporation Research Consortium.
The authors extend their grateful appreciation to Professors Barry J. Dempsey, Samuel H. Carpenter, and Marshall R. Thompson of the Univer-sity of Illinois at Urbana-Champaign for their enthusiastic support and many helpful comments and suggestions.

SUPPORT UNDER PORTLAND CEMENT CONCRETE PAVEMENTS
SUMMARY The support that the base and embankment or roadbed subgrade provide to a Portland Cement Concrete pavement was found to have a significant effect on the performance of the pavement. The findings of this study relate to the appropriate k-value for design, the effect of support on performance, and improved consideration of support in the current empirical AASHTO design methodology and in mechanistic design.
The k-value, as measured on top of the finished embankment upon which the base and slab will eventually be constructed, is considered most appropriate for design. The concept of a composite "top-of-the-base" k-value is not valid (unrealistically high) and is not recommended for design. The k-v.alue test recommended is the "elastic" k-value as con-ducted extensively at the AASHO Road Test and before that at the Arlington Road Test. When the elastic k-value was used in a three-dimensional (3-D) finite element pavement model, the computed slab stresses were very close to those computed from strains mea-sured at the AASHO Road Test under creep speed loadings. An elastic k-value can be determined from test results obtained from standard plate bearing tests specified by ASTM, AASHTO, or Corps of Engineers.
Guidelines are provided for three categories of methods for deterrilining a k-value for use in concrete pavement design: 1) correlation methods (correlation of elastic k with soil types, properties, and tests); 2) deflection testing and backcalculation methods (which represents the most rapid, cost-effective, and reliable method to obtain an adequate sample size of k-values for pavement design); and 3) plate testing methods (ASTM, AASHTO, and Corps of Engineers nonrepetitive and repetitive plate loading test methods with recommended k-value calculation procedures).
Practical guidelines were developed for estimating the k-value for situations where the existing subgrade is a very poor soil and an embankment layer of improved soil is placed on top. Guidelines are also provided for increasing an estimated k-value (i.e., determined from soil property correlations) when there is a stiff layer (such as bedrock) close to the surface. Seasonal k-value support can be estimated through knowledge of the variation in moisture level and frost depth throughout the year.
Several major deficiencies related to concrete pavement support were found to exist in the current version of the AASHTO design procedure for concrete pavements. These deficiencies are summarized as follows.

P]
* Use of the gross k-value measured on top of the base. In this study, the elastic k-value measured on the subgrade was found to be the appropriate input for design. The gross k-value is unrealistically low for design.
9 Use of the lowest gross k-value measured in springtime instead of a seasonally adjusted k-value. The concept of a seasonally adjusted k-value —incorporated in the AASHTO design procedure in the 1986 Guide—is a meaningful way to consider the relative amounts of damage done in different seasons, but is incompatible with the spring-time gross k-value with which the current AASHTO design equation was derived. In this study, a seasonally adjusted k-value for the ' AASHO Road Test site was detem-dned for
use in deriving a proposed new rigid- pavement design equation. * Consideration of the base in terms of a composite k-value rather than a more
realistic consideration of the base's effect on slab stress and performance. In this study, the base layer was modelled as a structural I ayer of the pavement structure using a 3-D finite element model. The modulus of elasticity, thickness, and coefficient of friction of the base course are important inputs.
9 Use of a loss of support adjustment factor to reduce k. Substantial loss of support occurred at the AASHO site, which led to increased slab cracking and loss of serviceabil-ity; thus, the performance data already represent considerable loss of support. No addi-tional loss of support adjustments are included in the proposed revisions to the design procedure. However, transverse joint faulting (from erosion) is predicted and the joint design adjusted if necessary to prevent faulting.
* Use of Spangler's corner equation. This equation when used with dowelled joints did not model the critical stress and crack initiation location, and thus could not possibly provide accurate indications ' of the effect of slab support on cracking, especially when thermal curling and moisture warping are considered. The 3-D finite element model was used to compute critical stresses at the midslab location that considers slab thermal gradients, base stiffness and thickness, coefficient of friction, elastic k-value, slab modulus and strength, and joint spacing. Also, a design check for critical stress is provided for undowelled pavements at the joint (comer) loading position.
e No guidelines to design a pavement with undowelled joints. The J-factor in the current AASHTO design procedure only considers tensile stress that controls cracking, not faulting. In the proposed revisions, design checks are provided for undowelled joints for both joint faulting and slab cracking (comer/joint load position). A check is also provided for dowelled joints to ensure their adequacy.
0 No consideration of joint spacing other than that at the AASHO Road Test (15 ft [4.6 m]). Joint spacing is known to have a major effect on slab cracking and faulting. Slab support is a very important variable in the new procedure in the selection of joint spacing to minimize transverse cracking.
9 No representation of climates other than that of the Road Test site. Thus, other climates that result, for example, in different slab curling (temperature differential from top to bottom of slab) or warping (moisture gradient) cannot be considered in the current AASHTO procedure. This limitation alone has led to many pavement failures from premature cracking. In the proposed revision, temperature differentials were incorporated into the slab thickness design procedure: positive for the midslab location (i.e., warmer on top than bottom) and negative for the comer/joint loading position that are project site specific. Moisture gradients are considered through an equivalent negative tempera-ture gradient at the joint (comer) load position.
* No consideration of the effect of faulting on performance, because faulting of transverse joints did not occur at the Road Test, which demonstrates that even with extensive erosion and pumping, faulting can be controlled through properly sized dowel bars. Contrary to popular belief, the J-factor reflects the effect of load transfer on tensile

91
stress in the slab under comer loading; it does not reflect the effect of load transfer on faulting at the joint. Increasing slab thickness in an attempt to reduce faulting has been shown to be an exercise in futility. In the proposed revision to the design procedure, joint faulting is predicted for the selected design and then checked against the maximum allowable. If predicted faulting exceeds the allowable faulting, a redesign of the joint load transfer, base, subdrainage, or other features is required, not an increase in slab thickness.
These deficiencies were addressed in this study, and an improved methodology was developed for better consideration of slab support. Proposed revisions to the AASHTO design procedure for concrete pavements were developed. These revisions were necessary given the deficiencies in consideration of pavement support.
A 3-D finite element model for concrete pavements (3DPAVE) was developed in this study in order to analyze the many complex and interacting factors which influence the support provided to a concrete pavement. The 3-D model was validated by comparison with deflections and strains measured under traffic loadings and temperature differentials. In every comparison with measured field data, 3DPAVE's calculated responses were found to be in very good agreement with the measured responses.
"Loss of support" refers to any gap or void that may occur between the base and the slab, or between a stabilized base and the subgrade, causing increased deflection of the slab surface. There are three basic types of loss of support that a concrete slab exhibits over time.
* Erosion of the base or subgrade or both from beneath the slab, resulting in increased deflections (faulting) and stresses (cracking) in the slab.
* Settlement or consolidation of the base or subgrade or both, usually resulting in slab cracking in the vicinity of the settlement.
9 Temperature curling and moisture warping of the slab, resulting in increased deflec-tions and stresses in the slab. Permanent construction curling presents a potential for very serious loss of support and early failure of jointed concrete pavements.
Loss of support can have a major impact on slab deflections and stresses, and thus pavement life. Temperature curling and moisture warping can be reasonably considered in the design process. Loss of support from erosion of the base or subgrade cannot be predicted at the present time for any given design project. This is currently an obstacle to predicting pavement life as a function of progressive loss of support and increasing slab stresses in a mechanistic design procedure.
In the AASHTO empirical design methodology, the critical stress computed for a fully supported slab is calibrated to the performance of the concrete slabs with granular bases at the AASHO Road Test, which were initially fully supported when constructed but experienced substantial loss of support over time because of erosion. This is true of the existing AASHTO design equation, in which the critical stress is calculated from Spang-ler's comer equation. This is also true of the proposed revision to the design equation, in which the critical stress is calculated as a function not only of slab thickness, slab modulus, and subgrade k, but also of base thickness and modulus, slab/base friction, temperature and moisture gradients, and joint spacing.
One would expect that the performance of a pavement with a dense treated (erosion resistant) or open-graded base would be different than the performance of the same pavement with a dense graded (low permeability) granular base. The proposed revision to the AASHTO design procedure accounts for the effect of base type on performance in two ways: first, base modulus and friction coefficient are considered in the design equation for computing slab stress, and second, base type is a factor in predicting faulting.

4
Specification of adequate material properties to limit the potential for erosion is also recommended and guidelines are provided.
The degree of friction between the slab and base has a significant effect on the critical stress in the slab, especially for higher-strengt4 bases. Little is known at this time about the degrees of friction that various base types exhibit under wheel loads and how the friction between the slab and base may change over time. Tentative recommended friction coefficients are provided based on tests in which slabs were pushed over base surfaces.
In the proposed design procedure, the critical stress in the slab is computed from a closed form equation (to replace the Spangler equation) developed from the results of many 3-D finite element runs. The critical stress is a function of several ImporTant design variables.
Improved support is very important to performance as documented from several studies (reduced roughness, faulting, and cracking). However, greatly increasing support with a very stiff base and or very stiff embankment may not necessarily improve performance or cost-effectiveness of design. Under these conditions, it may be necessary to shorten the joint spacing to avoid premature transverse cracks in the slab. This determination is facilitated by the proposed design equation, which has joint spacing as an input to the stress calculation.
Analyses showed that two different loading positions could produce critical tensile stresses for a given pavement: midslab and joint. This is not a new finding as there have been some well-documented research efforts that have shown that both of these locations could be a critical condition under various design and climatic conditions.
Joint (comer) loading may be critical for undowelled or inadequately dowelled pave-ments, especially in combination with curling or warping. Some undowelled pavements that had substantial permanent construction curling have experienced many broken cor-ners, diagonal cracks, and even transverse cracks after just a few months or years. The critical load position for a given pavement geometry and design may be identified through finite element modelling and the stresses checked using mechanistic design procedures.

CHAPTER 1
INTRODUCTION AND RESEARCH APPROACH
PROBLEM STATEMENT AND RESEARCH OBJECTIVE
Support under concrete pavements plays a very important role in performance. Slab support depends upon several variables, including the following:
e Stiffness of underlying layers (resistance to deflection un-der load);
* Uniformity of support along the pavement over time and dlimate (including lack of localized settlements and heaves);
Friction between the slab and the base layer; Drainability of the pavement structure and subgrade;
.0 Erosion of the base or subgrade (causing loss of support over time at edges and comers); and
9 Temperature curling and moisture warping of the con-crete slab.
The support that a foundation (including the subgrade, em-bankment, and constructed base layers) provides to the concrete slab influences the magnitude of deflections and stresses in the slab induced by traffic loads and environmental forces. These critical stresses and deflections produce two of the major dis-tresses (slab cracking and joint faulting), which greatly affect concrete pavement performance. Another major distress, joint spalling, can be caused in part by concrete durability problems that depend in part on the degree of saturation of the concrete slab, which is affected by base and subgrade permeability.
In the American Association of State Highway and Transpor-tation Officials (AASHTO) Guidefor Design of Pavement Struc-tures - (hereafter referred to as the AASHTO Guide), and in all other accepted concrete pavement design procedures, the support a foundation provides a concrete pavement is characterized by a k-value, which represents a "dense liquid" (elastic springs) foundation. The AASHTO Guide also has a "loss of support" input that is intended to represent the potential for reduction of support at slab comers over the .design life of the pavement, and also an empirical factor for drainability of the base. It is very difficult to select appropriate values for these three inputs, which are truly representative of the support the concrete slab will experience over its design life, and which are truly representative of the effect of support on the performance of the concrete pavement.
Design Subgrade k-Value
The rigid pavement thickness design equation used in the AASHTO Guide was developed from the results of the American
Association of State Highway Officials (AASHO) Road Test, at which plate bearing tests were conducted to determine "elas-tic" k-values and "gross" k-values (computed from elastic plus substantial permanent deformation). The springtime gross k-value was,incorporated into the development of the AASHTO rigid pavement design equation. However, previous research and this study have shown that it is the elastic k-value that produces calculated values of slab stress and deflection that agree well with those measured in the field.
Conventional plate bearing tests were often conducted to de-terriiine subgrade k-values through the 1950s, and even up to the 1980s by some agencies, particularly for airfields. However, these tests are extremely expensive and time-consuming, and thus are rarely conducted today.
Other approaches exist for estimating k-values for design, including correlation with soil properties and other soil tests, and backcalculation from deflection testing on concrete pavements. These different approaches to selecting k-values frequently give different results. There is no general agreement among engineers as to which of these methods is most appropriate as well as most practical.
Since the 1960s, k-values intended to represent plate bearing test values estimated on top of the base have commonly been used in concrete pavement design. These "top-of-base" or "com-posite" k-values overestimate the support the slab actually expe-riences in the field. This is particularly true for treated base layers or existing concrete or asphalt pavement structures. The top-of-base k-value that the AASHTO design procedure and other current concrete pavement design procedures would assign to such a stiff base are totally unrealistic, as Figure I illustrates.
The composite k concept also does not realistically reflect the effect that a base layer has on stress in a concrete slab due to load, friction with base, -temperature, and moisture influences. A more realistic approach to characterizing concrete pavement support would assign elastic k-values to the subgrade or embank-ment and consider the base course as a structural layer.
Loss of Support
The loss of support (LOS) factor was introduced in the 1986 AASHTO Guide to attempt to account for reduced slab support due to base erosion. The LOS factor applies a drastic reduction to the composite k-value if the pavement being designed will be built on an erodible base. However, it is well-documented that the concrete pavements at the AASHO Road Test, which were built on dense graded granular bases, developed extensive pump-ing. Thus, the existing rigid pavement design equation already includes the effect of a significant amount of loss of support on

I
PCC 9 in, 4 M psi I
subgrade 15.6 ksi
PCC 9 in, 4 M psi
base 6 in, 50 ksi
subgrade 15.6 ksi
PCC 9 in, 4 M psi
base 6 in, 1.26 M psi
subgrade 15.6 ksi
1986 AASHTO Guide
k = 804 pci
k = 825 pci
k —_ 1400 pci
Backcalculated from BISAR deflections
k = 138 pci
k = 143 pci
k = 136 pd
Epcc = 3.76 M psi
Epcc = 3.98 M psi
Epcc = 7.28 M psi
Calculated by BISAR for 9000-pound load
PCC stress = 138 psi PCC stress = 128 psi PCC stress = 51 psi
1 in = 25.4 nun, 1 psi = 6.89 kPa, 1 psi/in - 0.27 Wa/ffwk. 1 Ibf - 4.45 N
Figure 1. Examples of subgrade and base effects on k-value and slab response.
slab stress and performance. One of the issues investigated in this study was whether the k-value reduction applied by the AASHTO Guide's LOS factor result in unnecessary increases in designed slab thicknesses for granular bases.
Influence of Support on Performance
The stresses and deflections that affect performance in a ' con-crete slab depend on several support factors, including the following:
Subgrade soil stiffness; Base type, stiffness, and thickness; Frictional resistance between the slab and base; Seasonal moisture levels in the subgrade and untreated
base; Seasonal freezing and thawing in the base and subgrade; Load transfer at joints and cracks (effects erosion); Erosion of base or subgrade material over time due to
traffic action, poor drainage, or foundation movement; and Temperature and moisture gradients in the slab.
All of these factors interact to influence the magnitude of stresses and deflections experienced in concrete slabs under traf-
fic loads and in response to environmental forces (temperature cycles, moisture cycles, and freeze-thaw cycles). Repeated stresses and deflections at critical slab edge and comer locations may produce transverse cracking, longitudinal cracking, comer breaks, and faulting. Concrete pavernent performance is mea-sured by these distresses (plus joint spalling), either directly (i.e., distress severity and quantity) or indirectly (i.e., roughness, which in concrete pavements is primarily. a function of cracking, faulting, and spalling).
Most of these support factors are either not considered at all or considered in an unrealistic manner in current concrete pavement design procedures. Improved methods for characteriz-ing concrete pavement support parameters and their effects on performance are needed to improve design.
Research Objectives
This study addressed the urgent need to produce practical guidelines for selection of appropriate k-values, consideration of loss of support over time, and consideration of other support factors for use in design of concrete pavements and overlays. NCHRP Project 1-30 had the following specific objectives: (1) to develop and recommend improved guidelines for the se-lection of k-values and (2) to identify and assess loss-of-support

values for use in the design of rigid pavements and pavement overlays.
SCOPE OF STUDY
This study addressed concrete pavement support characteriza-tion for two purposes: improvement of the guidelines for consid-eration of support parameters in the current AASHTO Guide design methodology and development of improved methods for characterizing support in a mechanistic design methodology.
Substantial efforts were expended in the development of im-proved methods for considering support for concrete pavements in the AASHTO Guide. The products of these efforts include detailed guidelines for selection of the design subgrade k-value, an equation for slab stress due to wheel loads and climatic influences with a realistic modelling of the base course, and a proposed revision to the AASHTO design equation, which is compatible with the k-value guidelines and incorporates the new slab stress equation.
The second focus of this study was development of improved methods for characterizing concrete pavement support in a mechanistic design methodology. Recommendations were de-veloped for characterizing support and considering the influence of support on slab stress and performance in mechanistic design.
RESEARCH APPROACH
The research objectives were accomplished through intensive examination of the support concepts, which have evolved over the last 100 years; use of available test data from many past field studies; development and extensive use of a 3-13 finite element model for multilayered jointed concrete pavement; anal-ysis of the effects of support on slab response to traffic loading and climatic influences; and analysis of the effects of support on concrete pavement performance.
Three categories of procedures for estimating the k-value were
documented and evaluated. These include (1) correlations with soil type, soil properties, and soil tests; (2) backcalculation from nondestructive deflection test measurements; and (3) plate bear-ing test methods. . A review was conducted of the causes of loss of support, including temperature curling, moisture warping, and erosion of supporting material. Recommendations were developed for consideration of the various aspects of loss of support in design. A detailed and through review of the AASHO Road Test
concrete pavement analyses was conducted, and many interest-ing discoveries made 'regarding the extension of the original rigid pavement equation. These discoveries led to the necessity of modifying the rigid pavement design equation to more realisti-cally account for the effects of the subgrade and base layers on pavement performance.
A 3-1) finite element model for investigating the effect of support on slab stress and deformation response was developed using the ABAQUS general-purpose finite element software package. The model was extensively tested and validated using measured strain and deflection data from the AASHO Road Test and other experimental studies. Based on these results, procedures for improved consideration of support in the current AASHTO methodology were developed. A framework and tools for considering support in a mechanis-
tic-empirical methodology were developed. This framework in-cludes the 3DPAVE model to realistically model stresses in the concrete slab for any type of loading, slab dimensions, thermal and moisture gradients, dowelled or undowelled joints, a treated or untreated base layer with a realistic friction coefficient be-tween the slab and base, the stiffness of the subgrade, and related design features such as joint spacing and load transfer.
ORGANIZATION OF REPORT
Chapters 2 through 4 discuss the findings, interpretation, and conclusions of this study. The report appendixes as submitted by the research agency are not published herein but are available for loan on request to the NCHRP (see page 50).

CHAPTER 2
FINDINGS
The key findings of this study are summarized in this chapter. These findings relate to the evolution of the k-value concept, recommended methods for determining k-value, the three-di-mensional finite element model used to characterize concrete pavements, methods for assessing support, and recommenda-tions for improved consideration of support in the AASHTO Guide and in mechanistic design.
EVOLUTION OF THE k-VALUE
A detailed review of the evolution of the k-value concept is provided in Appendix A. The main findings of this review are summarized in this section.
Introduction of Dense Liquid Support Model
The conceptual model of a plate supported by a "dense liquid" foundation is attributed to Winkler (1) in 1867, although it may have been suggested earlier. Such a foundation is assumed to deflect under an applied vertical force in direct proportion to the force, without shear transmission to adjacent areas of the foundation not under the loaded area. Applications of this con-cept to plates such as ice sheets and concrete slabs were proposed by Hertz (2) in 1884; Fbppl (3) in 1907; and Koch (4), Schleicher (5), and Westergaard (6) in 1925.
The dense liquid model represents one end of the spectrum of elastic soil response. At the other end of the spectrum is the elastic solid model, according to which a load applied to the surface of a foundation is assumed to produce a continuous and infinite deflection basin. The elastic response of real soils (i.e., unbound sands, silts, and clays) hes somewhere between these two extremes, as illustrated in Figure 2. The dense liquid model
Dense Liquid Model Real Soil
has traditionally been favored over the elastic solid model in concrete pavement analysis .. One reason for this is that the dense liquid model simplifies slab stress and deflection calculations. In the era of high-speed computers, this is a less significant concern than it was in the past. Another reason the dense liquid model is preferred for concrete pavement analysis is that, for slabs on natural soil subgrades or granular bases, the dense liquid model more accurately predicts slab responses at edges and comers.
In addition to elastic behavior, real soils exhibit irreversible and time-dependent behavior. The latter is a concern for concrete pavement design, particularly for cohesive saturated soils. The k-value of these soils may be substantially higher under rapid loading (e.g., moving vehicles or impulse loads) than under slow loading, because under rapid loading pore water pressures are not dissipated (7). However, the available concrete pavement performance models are based on k-values determined from static load tests, while the actual loads applied by traffic are usually dynamic, as are the loads applied by deflection testing devices used for evaluation of in-service pavements and foundations.
Under slow loading, primary consolidation occurs gradually as pore water pressures dissipate, until in most cases the defor-mation of the soil reaches some stable value (7). However, it is possible for soils to exhibit secondary (creep) deformation, if the magnitude of load exceeds the creep strength of the soil (7,8). In such a case the deformation may not reach a stable value, even in a load test which is allowed to continue for several hours. The consolidation and creep responses of soils to slow loading necessitate some standardization in soil load test meth-ods. For example, a typical load test procedure may specify that the test may be stopped when the rate of change of deformation has slowed to some given vidue.
Elastic Solid Model
.. ........ . .... ..............
Figure 2. Dense liquid and elastic solid extremes of elastic soil response.

Westergaard's Equations for a Slab on a Dense Liquid
In 1925, Westergaard presented equations for deflection of a concrete slab on a dense liquid foundation, for interior, edge, and comer loading conditions (6). Westergaard introduced the term "modulus of subgrade reaction" for the k-value, and also introduced the term "radius of relative stiffness," C to describe the stiffness of a concrete slab relative to that of the subgrade. Westergaard suggested that the subgrade k-value could be back-calculated from deflections of the slab surface rather than from load tests on the subgrade (6,9). Westergaard envisioned his equations as being useful for evaluating existing pavements in order to gain insight for design of new pavements. Westergaard did not, however, explicitly address determination of subg6de k-values for use in new design. Thus, he did not shed light on the problem of reconciling k-values from plate load tests with k-values backcalculated from pavement deflections.
Westergaard also identified some of the major concerns in characterizing s6grade support which still persist, namely: slab curling and warping, nominiformity of support, friction at the slab/foundation interface, and dynamic versus static loading, and encouraged further analysis of all of these influences. West-ergaard suggested that the dynamic loading response "may pos-sibly be expressed approximately in terms of an increased value of the modulus k" (9).
Arlington Road Tests
In the early 1930s, the Bureau of Public Roads conducted extensive field tests at the Arlington Experiment Farm in Vir-ginia to investigate several aspects of concrete pavement behav-ior. These investigations were documented in a series of reports by Teller and Sutherland (10, 11, 12,13,14). One of the objectives of these field tests was to verify Westergaard's equations. Among the many valuable findings of the Arlington tests are those concerning measurement of subgrade k-values, effects of seasonal moisture variation on k-values, effects of slab curling on comer k-values, and effect of subgrade "improvement" on k-values.
In order to verify Westergaard's equations with experimental results, it was necessary for the Arlington researchers to develop some way to determine the subgrade k-value. Rigid plate testing and full-size top of slab testing were employed to investigate necessary test procedures, which would produce compatible re-sults from the two methods. Several series of soil tests were run with a range of plate diameters and loads. Each load was applied and released several times in order to "reach a condition such that each succeeding application of a given load would produce the same vertical displacement of the bearing plate. This might be termed a state of approximate elastic equilibrium" (14).
Figure 3 is an example load-displacement plot for the repeti-tive loading procedure used in the Arlington tests. The k-value was determined by dividing the plate pressure at a given load level by the elastic deflection at equilibrium. The load-deflection tests clearly showed the effects of plate size and displacement magnitude on k. Teller and Sutherland concluded that plate tests for k should be conducted with rigid plates of fairly large diame-ter, and maximum displacements limited to the range which a concrete pavement might be expected to experience under traffic.
Deflection testing was also conducted on top of concrete slabs in the Arlington tests to experimentally verify the stresses and deflections predicted by Westergaard's equations. This was the first backcalculation of subgrade k-values and slab E-values from deflections measured on top of concrete slabs under interior, edge, and comer loading conditions. Radiuses of relative stiff-ness values were determined by matching slab deflection basin measurements to contours drawn by Westergaard (6) for deflec-tion versus distance from load. The k-values determined from repeated loads on a 30-in. (762-mm)-diameter plate at a deflec-tion at 0.05 in. [1.27 min] on the subgrade gave values that agreed well with those backcalculated from deflections induced by loads on top of concrete slabs (no base course existed on these slabs). The backcalculated concrete elastic moduli were also in good agreement with values obtained from lab tests on samples cut from the slabs.
The researchers also investigated the effect of seasonal mois-ture content on k-values measured by plate bearing tests. At each displacement magnitude, the lower moisture content in the summer corresponded to a significant increase in k-value.
Teller and Sutherland described some rather surprising results concerning plate load tests on modified subgrade. In one test area, the subgrade was modified by mixing several inches of sand with the silty subgrade. The k-value obtained from plate tests on the modified subgrade was 400 psi/in. [108 kPa/mm], whereas the k-value of the original subgrade had been about 280 psi/in. [76 kPa/mm] fcr summer conditions. After a con-crete slab was constructed on the modified subgrade, the k-value backcalculated from slab deflections was found to be 285 psi/ in. (77 kPa/nun), "considerably lower than that indicated by the bearing tests with the 36-in. (914-mm)-diameter rigid plate but essentially the same as that found for the original unmodified subgrade under similar summer conditions" (14). Teller and Sutherland concluded that when the load was applied over a large area (i.e., distributed by a concrete slab), "the influence of the strengthened upper layer on the load support offered by the subgrade as a whole tended to disappear."
Effect of Loads and Temperature on Total Slab Stress
A summary of the findings of the Arlington experiments was written by Kelley in 1939 (15). Kelley pointed out that the stresses produced in concrete slabs by the combined effects of wheel loads and temperature variation could be much greater than the stresses predicted by Westergaard's equations for wheel loads only, and that for short slabs (e.g., less than 17 ft [5.2 m] for k = 100 psi/in. [27 kPa/mm] and less than 13 ft [4 m] for k = 300 psi/in. [81 kPa/mm]), temperature curling stresses actually increase with increasing k-value.
These observations are reasonable if one considers that the stiffer the foundation is, the less a curled slab can settle into the foundation, thus the greater proportion of the slab area will be unsupported by the foundation, and thus the higher the slab stresses will be. Nonetheless, the idea of total slab stress increas-ing with k-value is somewhat difficult to accept if one is accus-tomed to thinking of k-value only in terms of its effect on stresses due to traffic loads.
Kelley felt that a default k-value of 100 psi/in. (27 kPa/mm) was a somewhat conservative value, which provided a tradeoff

1 in = 25.4 mm, 1 lb/ft2 = 47.85 Pa
6
0-
0 0
Cr
< w 0 4
z (L 0 cL 0. 3
0
z 2
0 x
0 k 0 .01 .02 .03 .04 .05 .06 .07 oa .09 .10 .11 .12 13 .14
DISPLACEMENT — INCHES
Figure3. Typical load-displacement data from Arlington plate tests (14).
~3

11
between load and curling stresses. If the actual k-value of a subgrade was higher than the assumed value, for example, the stress equations would overestimate the load stress and underes-timate the curling stress. However, consideration of curling stresses has not been a part of concrete pavement design practice in the 50 or more years after Kelley's recommendations were published, although curling stresses certainly have been signifi-cant to the performance of concrete pavements.
Corps of Engineers Field Studies
In the 1940s, the U.S. Army Corps of Engineers conducted load tests on subgrades and concrete slabs several airfields (16,17,18,19,20,21 ). One of the* objectives of the Wright Field slab tests was to develop a standard procedure for determining subgrade k-values (22). The k-values obtained from load tests on the subgrade with plates ranging from 12 to 72 in. (305 to 1829 mm) diameter were compared with k-values obtained from tests on top of slabs. The volumetric method of calculating k, which is explained in Appendix A, involves dividing the applied load by the volume of the deflection basin. The 30-in. (762-min) diameter plate consistently yielded subgrade k-values in close agreement with the volumetric k-values. The 30-in. (762-min) plate-bearing test became the Corps of Engineers' standard test method for k, and also became the basis for the American Society for Testing and Materials (ASTM) and AASHTO stan-dard test methods which were developed later.
In addition, an insightful comment on the effect of a base course was made by Sale: "The only exception to this pattern [plate k agreeing with volumetric k] is the high k-value obtained on moderate base course thicknesses which generally must be adjusted downward to match full-size slab performance" (22).
Correlation of k-Value and CBR and Soil Classification
In 1942, Middlebrooks and Bertram (23) published a paper summarizing many aspects of the Corps of Engineers' subgrade studies, including perhaps the first published correlation of k-value to California Bearing Ratio (CBR) and to the Unified and Public Roads (now AASHTO) soil classification groups, shown in Figure 4.
An important detail of the Corps of Engineers' k-value test method on which these correlations are based is the selection of 0.05 in. (1.27 mm) as the deflection at which k is defined. The Corps' plate-bearing test procedure does not involve repeated loading and unloading, as was done at the Arlington Road Test, so it is reasonable to ask whether the k-value obtained from the Corps' test procedure is an "elastic" k, or whether it includes both elastic and plastic deformation. It is a significant question because the correlation chart shown in Figure 4 formed the basis for similar k-value correlation charts and tables, which were later incorporated in the U. S. Army's design manuals (24,25) and the Portland Cement Association's design manuals for high-way and airport concrete pavements (26,27), and have been widely used ever since. Phillippe (19) and Middlebrooks and Bertram (23) state that the deflection value of 0.05 in. (1.27 mm) was selected because the results of many tests indicated that this deflection corresponded to k-values that agreed with
the k-values obtained from deflection testing on top of full-size slabs. If one presumes that k-values calculated from top of slab deflections represent elastic response of the subgrade, then one may conclude that the k-value obtained from the Corps' defini-tion (at a deflection of 0.05 in. [1.27 mm]) is the equivalent of an elastic k, and thus that the correlations shown in Figure 4 are correlations of CBR and soil classification to elastic k-values.
Effect of Base Layers on k
In the 1940s, numerous reports appeared in the literature con-cerning plate load tests on subgrades and on base layers (28,29,30). These and other studies of the time illustrate a devel-oping trend to consider base layers as an effective means of improving subgrade k values, and to consider this improvement as a funciion of base thickness and base material.
The Corps of Engineers also apparently changed its position on the effect of base layers on k-value during this time. As Ablvin describes in his report on the historical development of the Corps' pavement design procedures (31), airfield pavements were constructed directly on natural subgrades throughout the 1940s, but base materials came into use in the early 1950s to combat pumping. However, the Corps also began to attribute an improved k-value to the base. "Limited early experience," Ahl-vin states, "had been interpreted to indicate that subbase or base under rigid pavement had no structural advantage," a conclusion that is consistent with Sale's description of the results of the Wright Field Tests.
In the 1950s, however, the Corps modified its design practice to require plate bearing tests on top of bases. This led eventually to development of curves for top-of-base k-values. Ahlvin's his-torical review does not mention any attempts by the Corps to validate the base k-value curves by deflection testing on top of concrete pavements. Had this been attempted, the results ob-tained earlier at the Arlington and Wright field tests would have been reaffirmed and the erroneous concept of top-of-base k-value might not have been perpetuated.
ASTM Plate Bearing Test Methods
The first standard ASTM test methods for plate bearing tests on soils were published in 1952. Two tests, based largely on the Corps of Engineers' procedure, were published: D 1195, Repetitive Static Plate Load Test, and D 1196, Nonrepetitive Static Plate Load Test. These two tests have changed very little since they were originally published. Details of these and other plate bearing test procedures are provided in Appendix B. Inter-estingly, neither of the ASTM test methods give any guidance on calculation of the subgrade k-value from the load and deflec-tion data obtained. Calculation of k-value is covere * d in the Corps of Engineers' test method, and in the AASHTO test methods T221 and T222, which were not standardized until the 1960s.
AASHO Road Test
This major field test was conducted by the Highway Research Board in cooperation with AASHO between 1958 and 1960, near Ottawa, Illinois. The AASHO Road Test is documented in

C X 0 /7. all 0/-/7/' OIZOrInq I'F0110''dr, 0/ 0. /- /" 19itl?ell-01161-7
.1-or Compoclaol a,-7cl _56oAeol _~iqacl*177CO -3 4 S 6 76910 20 30 40 .50 60 'fo /00
OH .. J_ CL
CAI ML OL 0-5,67D CI_45511c-1C15r1OV
RUBL IC 1fOqO_5,qDAI1A115r1-j q T , 1O1V-Cjq5.5111C._7r1O1V
/00 150 200 .250 J-00 600
14,10clulu-5 11_y?er,59.1 . 1-71W-rlo.
('11'a lura /ed ffo ,,/ /,/-7 OCe)
I in = 25.4 mm, 1 psi/in = 0.27 kPa/mm
Figure 4. Correlation of k-value, CBR, and soil classification (23).
12
0
zo
30
great detail in a series of Highway Research Board reports and
many related documents. Detailed investigations of base and
subgrade properties and their variation throughout the seasons
were conducted at the road test (32). Plate load, CBR, moisture content, and density tests were made on the subbase and the
embankment.
Trends of increasing CBR and decreasing moisture content
were noticeable. Although no particular relationship between k and dry density was noted, k did show a tendency to decrease with increasing moisture content. A clearer trend of decreasing k with increasing percent saturation (which represents a combi-nation of dry density and moisture content) was evident. The
same was true for CBR versus percent saturation.
At the time of the Road Test, AASHO did not have standard test methods for plate bearing tests, and the test procedure used
did not conform to the ASTM or Corps of Engineers standards.
The procedure used was similar to that used at the Arlington
Test (an elastic k-value), and involved three cycles of loading
and unloading at each of three load levels, using a 30-in. (762-nun)-diameter plate. An average elastic k-value (kE) was deter-mined by dividing each of the individual loads by the elastic deformations they produced (not including any permanent defor-
mation). The kE is the value plotted in all graphs in the AASHO Road Test reports. In addition, a gross k-value (kG) was deter-mined for each load level by dividing the load by the total deformation produced, including permanent deformation; A schematic illustration of the load-deformation results obtained
from the plate tests is shown in Figure 5. The kE-values exceeded the corresponding kG-values by an
average ratio of 1.77. Although the kE was the main test shown in all figures and tables of the Road Test report, the' springtime
kG-value of the Road Test site was used to develop the concrete

13
Deflection (A)
"A M
Figure 5. Schematic illustration of AASHO Road Test plate load test results.
pavement design equation although no confirmation has been found in prior literature that gross k-values determined in the manner employed at the AASHO Road Test were commonly used in design.
On the contrary, the elastic k-value was fecornmended by the Bureau of Public Roads after the Arlington Tests, the elastic k-value test was conducted at the AASHO Road Test, and the k-values obtained from the Corps of Engineers test method repre-sent the elastic k-value. However, because the Corps of Engi-neers method for determining k-value is a nonrepetitive test, one might presume that the AASHO Road Test researchers felt that the gross k was more representative of the k obtained in a nonre-petitive test than the elastic k.
A k-value of 60 psi/in. (16 kPa/mm) was used to represent AASHO Road Test conditions in the development of the AASHO rigid pavement design equation (33). This value is equivalent to the mean springtime gross k-value from tests on top of the aggregate subbase. It was a conservative value picked to represent the Road Test conditions. The only more conserva-tive value would have been the springtime gross k-value of 49 psi/in. (13 kPa/mm) on top of the subgrade. Why the subbase kG was selected rather than the subgrade kc, is not documented.
In 1962, the Corps of Engineers conducted load tests on top of the existing slabs at the AASHO Road Test site and calculated volumetric k-values between 25 and 92 psi/in. (7 and 26 kPa/ mm) from the slab deflection basins (34,35,36).
Portland Cement Association
In the 1960s, the Portland Cement Association (PCA) con-ducted a series of laboratory experiments with full-sized concrete slabs. These experiments included plate load tests on prepared subgrade soils, untreated gravel, and crushed stone bases, cement-treated bases (CTB), and soil-cement pavements (37,38,39). The plate tests on top of the granular bases yielded slightly higher k-values than the subgrade plate tests, but the plate tests on the cement-treated bases yielded considerably higher k-values, which increased linearly with cement-treated base thickness. Subsequent load tests on concrete slabs constructed on the cement-treated bases showed a decrease in maximum edge and interior deflections with increasing base thickness. The PCA used these results to develop curves for top-of-base k-values for granular and cement-treated bases, which were incorporated in PCA's concrete pavement design proce-dures and published in 1966.
An intriguing aspect of the PCA's guidelines on effect of base layers on slab behavior is an alternate procedure offered for determining an adjusted e-value as a function of the concrete-to-base stiffness ratio (El /E2), the concrete-to-base thickness ratio (h l lh2), and the e calculated for the concrete slab and subgrade k alone. According to the PCA manual's recommenda-tion to increase k when a base is present, the radius of relative stiffness would decrease. The alternate procedure suggests that the opposite result, an increase in C, may be more realistic when a strong base is used (27). The PCA manual indicates that the two approaches to defining C (combining the base with the k versus combining the base with the slab), although diametrically opposed in concept, produce reasonably similar results for thin-ner pavements, weak bases, and small load sizes. However, the latter approach was considered more appropriate for thicker pavements, stiffer bases, and larger load sizes (i.e., multiwheel aircraft gear configurations).
The load tests run on concrete slabs in the PCA experiments showed decreases in deflection with increasing thickness of ce-ment-treated base, which was interpreted as being the result of an increase in the k-value. These experimental results would then appear to be contrary to the statements quoted above con-cerning the effect of the base on increasing C. However, the PCA studies did not report that any k-values were backcalculated from the slab deflections to deter * mine whether the top-of-base k-values were confirmed. This was done for this study using the deflection data reported by PCA. The k-values backcalculated from the slab deflections are much closer to those obtained from plate tests on the subgrade than to those obtained from plate tests on the CTB. This does not mean, however that a cement-treated base has no effect on stresses in the concrete slab. A cement-treated base may significantly reduce stress at the bottom of the concrete slab, especially if normal frictional resistance exists between the slab and base.
1972 AASHTO Interim Guide
In the evolution of the AASHTO rigid pavement design meth-odology following the AASHO Road Test, a series of modifica-tions was made to the process of selecting a k-value for design. The 1972 AASHTO Interim Guide specified the use of the sub-grade gross k-value (measured on top of the aggregate subbase)

14
in the main section of the manual (40). An alternate procedure to deternime the design k-value, termed a composite. k-value on top of the subbase, was also given. According to this procedure, the subbase stiffness and the modulus of subgrade reaction are used in a nomograph, developed using elastic layer theory, to determine the composite k-value on top of the subbase. This seems to be a discrepancy, because the AASHO Road Test's top of granular subbase k-value (kG = 60 psi/in. [16 kPa/mm]) was already incorporated in the rigid pavement design equation.
The 1972 Guide suggested that an adjustment to the k-value might be warranted to reflect loss of support. This too appears to be a discrepancy, because loss ot'support was already incorpo-rated into the AASHTO model: the rigid pavement design equa-tion was developed from the performance data for the AASHO Road Test's concrete pavement sections with granular bases, and these pavements experienced substantial pumping and loss of support beneath the slabs (32).
Correlation of k to Soil Type and Degree of Saturation
The concrete pavement design procedure developed in the 1977 Zero-Maintenance study (41,42) recommended that a soil's k-value in various seasons.be determined from its AASHTO classification and the degree of saturation in the upper 1 to 5 ft (0.3 to 1.5 in) of soil. The k-values were obtained using correla-tions between resilient modulus, static elastic modulus, and de-gree of saturation developed from an extensive field and labora-tory study of Illinois soils (43).
1986 AASHTO Guide k-Value Methods
Five modifications to the 1972 Interim Guide's k-value guide-lines were introduced in the 1986 version of the AASHTO Guide (44). Each of these modifications has been examined in great detail in this study (see Appendix A), and the following conclu-sions reached:
Equation for k-value for an unprotected subgrade: The equation (k = MR119.4, where laboratory resilient modulus MR is assumed in the Guide to be equal to the in-place elastic modu-lus E of the subgrade), developed from elastic layer simulation of plate testing on an elastic half-space, produces unrealistically high k-values.
Nomograph for composite (top-of-base) k: This nomo-graph; also developed from elastic layer simulation of plate tests on base/subgrade combinations, produces unrealistically high k-values.
Adjustment to k for rigid foundation within 10 ft (3 m) depth: The basis for this nomograph is not documented, al-though it is presumed to have been developed using elastic layer simulation in a manner similar to the development of the composite k nomograph. Analyses have been conducted to re-place this nomograph with one that would adjust k not only for a rigid layer beneath the subgrade but also for significant thicknesses of improved embankment material (e.g., more than I ft [0.3 m] placed above the subgrade).
Seasonal adjustment procedure for k: The AASHTO Guide provides a method for determining a design k-value which
represents the range of k-values expected in various seasons, weighted with respect to the relative damage done to the pave-ment in those seasons. The relative damage is calculated using the AASHTO rigid pavement design equation. This damage-weighted seasonal adjustment seems reasonable in concept, ex-cept that it suggests that relative damage is sensitive to slab thickness, and close examination of the nomograph and equa-tions reveals that thickness has little or no effect. An inconsis-tency of the seasonal adjustment procedure is that the design equation itself is not calibrated to a seasonal average k for the AASHO Road Test site, but rather the springtime lowest of the year kG value.
Loss of support adjustment to the k-value: This nomo-graph, developed using discrete element analysis of various sizes of voids under a concrete pavement joint, produces dramatic reductions in k-value for erodible bases. This loss of support adjustment is a major discrepancy in the design procedure, as mentioned before, because the performance prediction model is based on the AASHO Road Test pavements, which had granular bases and experienced substantial loss of support.
Development of k-Value Backcalculation Methods
The concept of characterizing a deflection basin by its maxi-mum deflection and its AREA (cross-sectional area computed from deflections at 0, 12, 24, and 36 in. [0, 305, 610, and 914 mm], normalized to the maximum deflection) was proposed by Hoffman and Thompson in 1981 for flexible pavements (45). This concept was subsequently applied to backcalculation of PCC slab elastic modulus values and subgrade k-values for many airport and highway projects (46). The ILLI-SLAB finite ele-ment program was used to compute a matrix of maximum deflec-tions and AREA solutions by varying the k-value and E for a given slab thickness and slab size. A family of curves was then plotted against AREA and do axes. Individual midslab deflection basins (AREA and do) measured with a Falling Weight Deflecto-meter (FWD) could then be plotted on the matrix, and the slab E and foundation k-value interpolated. In 1985, Foxworthy adapted this backcalculation scheme to a computerized solu-tion (47).
The k-values obtained from the FWD were typically about twice as high as the static k-values, which would be expected for the same soils in standard plate bearing tests. Foxworthy's research included FWD deflection testing at several U.S. Air Force bases, and comparison of the backcalculation results ob-tained with results of plate load tests and laboratory tests of concrete samples. Foxworthy observed that k-values backcalcu-lated from deflections exceeded k-values from plate load tests by a mean ratio of 2.7 (ranging from 1.6 to 4.4).
Further investigation of the AREA concept by Barenberg and Petros (48) and by Ioannides (49) produced a forward solution procedure to replace the iterative and graphical procedures used previously. This solution is based on the fact that a unique relationship exists between AREA, defined for a given load radius and sensor arrangement, and the dense liquid radius of relative stiffness (ek) of the pavement system, in which the subgrade is characterized by a k-value. In 1989, Ioarmides, Barenberg, and Lary (50) demonstrated the application of this closed-form approach with the ILLI-BACK program, which was developed to permit rapid analysis of deflection basins. This

1 in = 25.4 mm, 1 mil = Z5.4 Am, Maximum deflection, do, mils 1 pound = 4.45 N, 1 psi/in 0.27 kPa/mm
26 100 k=~O PCI
............. ............. ............. ............. ............ ............. 24 . ......... . .......... .... .... .............. . ........... ............. .............
P = 9000 Pd.unds 22 . ......... ............. ............ ............. ........................... ...... ............. ............. ............. .............. ............ .............
a = 5;:9 inchbs 20 ........ ...........
............. ... ..... ............. ............. ............ ............. .......................... .............
.......... .............
18 . ........... ............. ............. ............. . ........................ .......... .......... ............. ............. ...... .........
150
16 . ........... ............. ... ....... ............. .......... .. * ............. ............. ........... . ............. ............. ............................ .............
14 . ........... ............. .......... ...... .............
.............. ......... ...... ...... ...... .............
200 12 . ......... ............ .... ...... ............. . .......... ............. . .......... ............ ...... ........... ............. ............ .............
10 . ...........
.............
.......... ............ ............. ............. ... ........ ............. ............ ...........
300 . ............. .... ....... * ...... .... ......... .............
. ..........
8 . ......... . : ......... ........... ............. ............................ .............
6 . ................... ....... ................ ...... . ........... .......... ........... . ............ ............. ... ................. ............... ...... .......
500
4 ............... .................... ................ ............... ....... . ......... .
........ .......... .............. ................. ......... .............
: 1000 2 . ......... ............... ............ ............. ............. ..........
......
0' 1 1 1 1 1 1 1 1 1
23 24 25 26 27 28 29 30 31 32- 33 34 35 36
Deflection basin AREA, inches
Figure6 Backcalculated k-value determination from do and AREA (52).
15
solution method is much faster than the graphical methods used
before, but it does have a drawback: the solution for k is based
on Westergaard's equations for deflection of an infinite slab.
The deflection of an actual highway pavement slab (12 ft (3.7
in] wide, perhaps only 15 ft [4.6 m] long) may be quite different
from that predicted from theory for infinite slabs. Also, as with
the ILLI-SLAB solution, the k-values backcalculated from FWD
data are higher than static k-values. The backcalcul'ated concrete
modulus will also be higher than the actual concrete modulus if
a treated base is present.
Nomographs and equations for backcalculation of concrete
elastic moduli and subgrade k-values (Figure 6) and concrete E
values (Figure 7) for concrete or composite pavements were
developed by Hall (51) and incorporated into the 1993 AASHTO
Guide (52). This solution method is also based on deflection of
an infinite slab. For composite (asphalt concrete [AC]-overlaid
PCQ pavements, an adjustment must be applied to the do, the
deflection under the load plate, to account for compression in
the AC layer. The equations, which may be used in a spread-
sheet, permit rapid determination of subgrade k- and slab E
values. The 1993 Guide recommended that the dynamic load
backcalculated k-value be divided by two to estimate a static
elastic k-value for use in design. This backcalculation method
is described more fully in Appendix B.
In 1993, Crovetti developed equations for backcalculation of
foundation k-values from interior, edge, and comer deflection
measurements, and correction of infinite slab solutions for finite
slab size effects (53). Crovetti demonstrated that Westergaard's
equations for interior, edge, and comer deflection could be repre-
sented by quadratic functions of load radius divided by radius
of relative stiffness (ale), and that and k-values could be calcu-
lated for these locations by an iterative process. In this study, a
method was developed to rearrange these equations to solve
for C and k directly without iteration. Crovetti also developed
algorithms for correction of backcalculated e and k-values for
a single finite (square or rectangular) slab, and for finite slabs
with partial joint load transfer. These corrections were devel-
oped with the ILLI-SLAB finite element program. These and
other recent developments in k-value backcalculation (including
equations for use with the Strategic Highway Research Program
(SHRP) Long-Term Pavement Performance (LTPP) deflection
data and equations for use with any sensor positions) are de-
scribed in Appendix B.
The Iowa DOT has developed a procedure for determining
springtime static k-values from Road Rater deflection data (54).
The procedure was developed over several years by correlating Road Rater deflections on concrete pavements of known sub-
grade types to k-values obtained from static plate load test data
and other correlations for the same subgrade types. The proce-
dure is described in Appendix B.
All of the k-value backcalculation methods developed to date
(except the Iowa procedure, based on direct correlation of deflec-
tions to static k-values) are based on plate theory, assuming pure
bending of the concrete slab. A base layer, if it is considered,

16
3 PCC ED , E psi, D inches
1 in = 25.4 mm, 1 psi = 6.89 kPa, 1 psi/ in = 0.27 kPa/mrn
1.OE+l I
1.OE+10
1.OE+09
50 Pci 1.OE+08 1
23 24 25 26 27 28 29 30 31 32 33 34 35 36
Deflection basin AREA, inches
Figure 7. Concrete E determination from k-value, AREA, and slab thickness (52).
is generally also considered to exhibit plate behavior. In future work on k-value backcalculation methods for concrete pave-ments, three-dimensional finite element analysis is recom-mended to model the behavior of the slab and base as elastic layers on a k-foundation. The effects on backcalculated k-value of slab size, joint load transfer, base thickness and stiffness, slablbase interface friction, slab compressibility, and slab defor-mation due to temperature or moisture gradients could also be examined more realistically using three-dimensional finite ele-ment analysis.
BACKCALCULATION FIELD RESULTS
This section presents some backcalculation results from field testing that provide insight into subgrade k-values and the factors that influence them. More detail on these field studies is provided in Appendix A.
Backcalculated Versus Static k: AASHO Road Test Loop I
Loop I of the AASHO Road Test was not trafficked during the experiment conducted between 1958 and 1960. It was used for strain measurements under vibratory loading and for materi-als sampling. Unlike the other AASHO Road Test loops, Loop
1 was not incorporated in the alignment of Interstate 80, and is still accessible today alongside 1-80. Deflection testing of Loop I using a Falling Weight Deflectometer (FWD) was conducted in May 1992.
The Loop I deflection data were analyzed in great detail. Careful efforts were made to account for the effects of tempera-ture, load transfer, slab size, and concrete slab compressibility. The results are shown in Table 1. The mean backcalculated k of 148 psi/in. (40 kPa/mm), when divided by 2, yields an esti-mated static k of 74 psi/in. (20 kPa/mm), which is within the range of 63 to 105 psi/in. (17 to 28 kPa/mm) obtained from elastic kE plate load tests on the subgrade, and within the 25 to 92 psi/in. (7 to 25 kPa/mm) range of volumetric k-values ob-tained by the Corps of Engineers from static load tests on top of the slabs. The mean backcalculated concrete E of 6.37 million psi (43890 MPa) is also very similar to the value of 6.25 million psi (43062 MPa) obtained from dynamic tests on beam samples.
Backcalculated Versus Static k: Willard Airport
Because plate bearing tests are rarely conducted today, very little data are available to compare static k-values from plate bearing tests with backcalculated k-values from pavement testing at the same site. Foxworthy's analysis of the U.S. Air Force data is one of the few available examples of such a comparison.

TABLE 1. AASHO Road Test Loop I rigid pavement backcalculation results
Slab Thickness (in)
Mean Backcalculated k (psi/in)
Mean Concrete E, M1l' psi)
5.0 ill 7.42
9.5 142 5.44
12.5 192 6.26
Overall Mean: 148 6.37
Note: 1 in = 25.4 mm, 1 psi/in = 0.27 kPa/mm, 1 million psi = 6890 MPa
17
Another example is the University of Illinois' Willard Airport in Savoy, Illinois. The results of ASTM D1196 nonrepetitive static-plate load tests conducted on the silty clay subgrade after slab removal yielded static k-values of 60, 75, and 120 psi/in. (16, 20, 33 kPa/mm). The subgrade soil has a densify of about 93 lbs/ft3 (1490 kg /M3 ) and a CBR value of about 5 (55).
FWD testing was conducted at several locations on a nearby pavement having a relatively thin slab (8 in. [203 mm]) and an aggregate base. The backcalculated dynamic k-values for several locations near the plate load tests ranged from I 11 to 163 psi/ in. (30 to 44 kPa/mm) with a mean of 135 psi/in. (37 kPa/mm). Dividing this value by two to obtain an approximate static k-value gives 68 psi/in. (18 kPa/mm), which is close to the mean static-plate load test result of 85 psi/in. (23 kPa/mm).
Subgrade and Base Type Versus k, RPPR Field Studies
Field evaluations of 95 in-service jointed-plain concrete pave-ments (JPCP) and jointed-reinforced concrete pavements (JRCP) highway pavements located throughout the United States were conducted for the FHWA's "Rigid Pavement Performance and Rehabilitation" (RPPR) study (56). Deflection testing was con-ducted on these pavements using an FWD. The backcalculated k-values are summarized by subgrade soil classification in Table 2. The values shown are estimated static values obtained by dividing the mean backcalculated values by 2. The ranges of estimated static k-values for the various soil classes appear to be very reasonable in most cases.
Data were also obtained that provide backcalculated k-values for six different groups of experimental test sections located in six different states. At each experimental test site, the sections were grouped into those with an aggregate base and those with a treated base (asphalt treated, cement treated, and lean concrete). FWD backcalculation k-value results for these sections with different types of bases but the same subgrades are given in Table 3. The ratio of the k-value for treated base sections divided by the k-value for untreated base sections is shown to vary from 1.0 to 1.5 with an average of 1.2.
Thus, it appears that the treated base may have about a 20 percent effect on increasing the backcalculated k-value, although it is still believed that the backcalculated k-value is primarily that of the subgrade or embankment beneath the base course because tharis where a large majority of deflection occurs.
The magnitude of increase in k-value for the treated base sections over the same subgrade is far less than would be pre-dicted'by the conventional top-of-base k-value charts, and much less than the composite k-values that would be predicted for treated bases by the 1986 Guide procedure. For example, a subgrade k-value of 100 psi/in. (27 kPa/mm) and a 5 in. (127 nun) treated aggregate base course would produce a composite k-value of 340 psi/in. (92 kPa/mm) using the PCA procedure and about 250 psi/in. (68 kPa/mm) for AASHTO, for a ratio of 2.5 to 3.4!
One possible explanation for the difference is slab size effect: the Ve ratio for a slab with a bonded, stabilized base is lower than the Ve ratio for a slab of the same dimensions on a granular base or no base at all. The lower the Lle ratio is below 8, the less applicable are the infinite slab theory backcalculation methods, without adjustment.
Subgrade Type Versus k: LTPP Study
Subgrade k-values were backcalculated from deflection data collected from the General Pavement Studies (GPS) experiments 3 and 4 in the LTPP study, using the SHRP LTPP method described in Appendix B. The subgrade k-value results are pre-sented by subgrade class in Table 4. The LTPP data include pavements with untreated granular bases and a variety of treated base types. These results are similar to those obtained from the RPPR deflection data, and are in reasonably good agreement with the k-value correlations suggested by the PCA and Corps of Enihneers charts.
Effect of k-Value on Performance: LTPP
Preliminary analysis of the concrete pavement LTPP data has shown some relationships between backcalculated k-value and concrete pavement performance (57). Prediction models were developed for various distresses for JPCP, JRCP, and continu-ously reinforced concrete pavements (CRCP). The following effects of backcalculated k-value were noted in the prediction models developed:

TABLE 2. Backcalculated k-values by soil class, from RPPR data (56)
Subgrade Class Number of Projects
Minimum Static k value (psi/in)
Maximum Static k value (psi/in)
A-1-a 10 116 310
A-1-b 0 ---
A-2-4 22 64 374
A-2-5 0
A-2-6 8 64 336
A-2-7 1 128 128
A-3 2 189 265
A-4 17 95 314
A-5 0 --- ---
A-6 22 78 311
A-7 1 170 170
1 psi/in = 0.27 kPa/mm
TABLE 3. Effect of treated and untreated bases on k, for projects with different bases at same location, from RPPR data (56)
Location (State) of Project
Backcalculated k (psi/in)
Aggregate Base Treated Base7 Ratio
North Carolina 554 535 < 1.0
Ohio 395 482 1.2
New York 577 560 < 1.0
Mic igan 304 468 1.5
Minnesota 200 270 1.3
Arizona 425 602 1.4
1 psi/in = 0.27 kPa/mm
18
As k-value increased: Faulting of dowelled joints decreased, Transverse cracking of JPCP decreased, Deteriorated transverse cracks in JRCP decreased, Lower International Roughness Index (IRI) resulted for JPCP, and Lower IRI resulted for JRCP.
Lower HU also resulted for CRCP when the subgrade type changed from fine-grained to coarse-grained. Although these results are tentative, they do indicate that the backcalculated k-value had some influence on the performance of all types of
concrete pavement. As the k-value increased, the performance generally improved.
Plate Load k on High-Strength Base: Japan
A Japanese study of deflection and strain measurements on concrete airfield pavements provides an interesting comparison of top-of-base plate load k-values and k-values backcalculated from slab deflections (58). Each section of concrete pavement was constructed on a crushed stone layer either 4 or 8 in. (102 or 203 nun) thick, which was in turn placed on a 12-in. (305-nun) layer of pit gravel. Plate load tests were conducted on top of the base to determine k-values.

TABLE 4. Backcalculated k-values by soil class, from LTPP GPS 3 and 4
Subgrade Class
Number of 'Projects
Minimum Static k (psi/in)
Maximum Static k (psi/in)
Average Static k (psi/in)
A-1-a 5 108 181 142
A-1-b 5 92 334 208
A-2-4 16 48 535 188
A-2-5 0 --- ---
A-2-6 2 101 370 235
A-2-7 4 68 239 133
A-3 13 60 271 135
A-4 24 54 395 154
A-5 2 66 102 84
26 61 512 146
A-7-5 5 79 181 117
A-7-6 18 48 248 126
I psi/in = 0.27 kPa/mm
19
After the concrete slabs were constructed, static load tests were conducted on the slabs with a 12-in. (305-nun)-diameter plate. A 45-ton (400-kN) truck provided the reaction force for the load tests at the slab interiors, edges, and comers. Westergaard's equations were used to backcalculate k-values using the maxi-mum deflections and the concrete E determined from labora-tory tests.
The k-values measured on top of the base were consistently two to four or more times the k-values backcalculated from top of slab deflections, and this discrepancy increased with increas-ing load level. These results confirm again that plate tests on base layers yield misleadingly high k-values, shown by slab deflection.
Effects of Fill and Bedrock: Dulles Airport
Dulles International Airport near Washington, D. C. provides an interesting example of the effect of a shallow rigid layer on deflections and backcalculated k-values (59). The site upon which the airport was built has shallow bedrock (stratified red shale), varying in depth from 0 to 6 ft (1.8 in) throughout most of the airport property. The overlying soils are red clayey silt and silty clay (FAA class E-7, liquid limit 34, plasticity index 17, dry density 104 lb/ft' [1666 kg/M3]). If the bedrock layer were not present and this soil were present to a substantial depth, it might be expected to have a static k-value in the range of about 100 to 250 psi/in. (27 to 67 kPa/mm).
The concrete slabs are all 15 in. (381 mm) thick. The elastic modulus of the concrete was estimated at 5.4 million psi (37200 MPa) from sonic modulus tests on cores and from backcalcula-tion of Waterways Experiment Station (WES) Vibrator and
FWD deflection data. The backcalculated dynamic k-values for the 35 pavement sections tested ranged from 260 to 1000 psi/ in. (70 to 270 kPa/mm), and averaged 480 psi/in. (130 kPa/ min). These correspond to an estimated static k-value range of 130 to 500 psi/in. (35 to 135 kPa/mm), and an estimated average static k-value of 240 psi/in. (65 kPa/mm). There is, however, considerable variation in fill heights and depths to bedrock within a section, and a corresponding variation in the k-values, as illustrated in Figure 8.
The average static k-value is within but near the high end of the range of values predicted for the subgrade soil type, which means that about half of the values are above the range expected for the subgrade type. The highest values (500 psi/in. [135 kPa/ min]) are twice the expected upper limit (about 250 psi/in. [67 kPa/mm]) for the subgrade type. The highest k-values were reported for areas with bedrock at a very shallow depth (0 to 2 ft [0.6 in)).
These results suggest that bedrock or a similar stiff layer at a shallow depth (i.e., within 10 ft of the subgrade surface) may increase k-values to as much as twice the level that would other-, wise be assigned to the subgrade soil based on its classification, density, and other properties. This type of field information is valuable because a shallow rigid layer is considered to be signifi-cant in producing an effectively stiffer foundation, but the mag-nitude of the increase that should be expected due to a rigid layer is extremely difficult to quantify. Simulating the effect of a rigid layer in an elastic layer computer analysis can yield much greater changes in k-value (e.g., by a factor of five or more), which may be very erroneous. Additional collection and analysis of field data on rigid layer depth and its effect on subgrade k-values are needed to more accurately quantify this effect.

Backcalculated k value:
20
20 TZ Ow rum I XY "'Z (~ 1 0
5 wt, ~O 0
Oy > 6' ~-u XO (~ 6' ~_O
n.uj 4' W(n 0
2'
STATION 30 50 70 90 110 130 150
I ft = 0.3 m, I psi/in = 0.27 kPa/mm
Backcalculated k value:
20 Ow
i;JM 1 5 X: Y_
10 (DOD
42 5 U.
0 0
> 6'
X CO (~ 6' r
,LW 4'
CO
2'
S TATION 30 50 70 90 110 130 150
Figure 8. Effect offill and bedrock on backcalculated k-values at Dulles International Airport (59).
Soft Subgrade With High Friction Treated Base: Utah 1-15 In Salit Lake City (60)
This highway pavement consists of a 9-in. (22
'
9-mm) undow-
elled JPCP over a 4-in. (102-mm) cement-treated base, over a
12-in. (305-mm) granular borrow layer consisting of AASHTO
A-1 and A-2 materials. Beneath the borrow layer is selected
embankment material and below this are very soft lake bed clays
(CBR 0-3 percent). During the construction of 1-15, vertical sand
drains were installed in these soft soils to drain water as the
soils consolidated under the weight of the embankment. The
embankment had to be constructed in I-ft (0.3 in) increments
because of the large volume of water that was drained from the
underlying soils during consolidation.
This pavement is over 25 years old and has shown excellent
performance with virtually no cracking and little faulting. The
pavement was tested with an FVVD, and the k-value was backcal-
culated using the 1993 AASHTO Guide procedure described in
Appendix B. The backcalculated dynamic k-values ranged from
49 to 234 psi/in. (13 to 63 kPa/mm), corresponding to a range
of estimated static k-values of 25 to 115 psi/in. (7 to 31 kPa/
mm). These are among the lowest k-values observed anywhere,
despite the presence of the embankment, borrow layer, and ce-
ment-treated base. The k-values were higher in one end of the
project where the embankments were over 10 ft (3 in) high, and
lower in the other end where the embankments were shallower.
Thus, the extremely soft lake bed clays, even buried beneath
several feet of improved material and a stiff base has a large
effect on the backcalculated k-value.
It is also interesting to note that this pavement has shown no
fatigue-related cracking in over 25 years of heavy traffic for a

TABLE 5. Mean backcalculated k-values from 20 Chilean JPCP test sections (61)
New Alignment Constructed Over Old Subgrade AC or PCC Pavement
Mean k = 185 psi/in Mean k = 368 psi/in n = 5 sections n = 15 sections Slabs Cracked = 6 % Slabs Cracked = 23 %
21
1 psi/in = 0.27 kPa/mm
relatively thin slab. A structural analysis conducted assuming that the slab and base had no frictional resistance indicated that the pavement should have failed from fatigue damage. A second analysis conducted- assuming that there was high friction indi-cated that there should be very little fatigue damage, which is consistent with the performance observed (60).
Effect of k-Value on Slab Cracking: Chile
A major research study has been underway in Chile for several years to monitor the deterioration of undowelled JPCP (61). Twenty of these pavements were instrumented and tested in a variety of ways. Results from this monitoring show a "permanent upward curling of slabs in all pavement sections.... The curling is demonstrated in the field by the perceptible rocking of the slabs under the early morning traffic and by the systematic trans-verse cracking and comer breaks of some rather new pavements with no signs of pumping. Cracking seems to start from the surface downward and from the edges inward".(61). The re-searchers have also concluded that moisture gradients in the concrete slabs have produced slab stresses, deformations, and increased deflections under load as significant as those caused by temperature gradients (62).
Static axle deflection data at the slab centers and an estimate of the concrete modulus of elasticity (from strength) were ob-tained and the static k-value was backcalculated using West-ergaard's center deflection equation. The backcalculated static k-values ranged from 87 to 675 psi/in. (23.5 to 182 kPa/mm) and seemed to vary considerably depending on the type of foun-dation. Some of the JPCP were constructed on new alignments having a normal subgrade and some were constructed over old AC or PCC pavement. The base type was mostly cement treated aggregates placed over the subgrade or over the existing.old pavements.
Results shown in Table 5 indicates some important results. Pavements constructed over old deteriorated pavements had backcalculated k-values about two times the k-value of pave-ments constructed on a new alignment with a typical subgrade. The percentage of cracked slabs of pavements constructed over old pavements was about four times that of pavements con-structed on new alignments. The underlying existing pavements have provided a much stiffer foundation, which may have con-tributed to increased stresses in the slabs when deformed by load, and temperature and moisture gradients, resulting in increased cracking. These results are consistent with the 3-13 finite element
analyses conducted in this study and proposed revised AASHTO design procedure.
RECOMMENDATIONS FOR DETERMINING k-VALUE
Three categories of methods for determining a k-value for use in concrete pavement design are recommended. Further details on the procedures are given in Appendixes B and F.
Correlation Methods
The k-value can be estimated using soil classification, resilient modulus, moisture level, density,. CBR, Hveem R-value, and the Dynamic Cone Penetrometer (DCP). These correlation methods are anticipated to be used routinely for design.
Deflection Testing and Backcalculation Methods
These methods are suitable for determining k-value for design of overlays of existing pavements, or for design of reconstructed pavements on existing alignments, or for design of similar pave-ments in the same general location on the same type of subgrade. An agency may also use backcalculation methods to develop correlations between nondestructive deflection testing results and subgrade types and properties.
Plate Testing Methods
-The standard ASTM, AASHTO, and Corps.of Engineers non-repetitive and repetitive plate-loading test methods, as well as the German plate-load test, are summarized in Appendix B. The American standard test methods are the most direct methods of determining the elastic k-value of the soil under static loading, but because these tests are costly and time consuming, it is not anticipated that they will be conducted routinely.
Adjustment for Fill and Rigid Layer
A nomograph was developed to adjust the k-value that would be assigned to a subgrade using the correlation methods to ac-count for the effects of a substantial embankment thickness

22
above the natural subgrade and/or a rigid layer (e.g., bedrock or hardpan clay) at a shallow depth beneath the natural subgrade. The nomograph for embankment and rigid layer effects is pro-vided in Appendix B.
3-13 FINITE ELEMENT MODEL OF CONCRETE PAVEMENT
A 3-D finite element model for concrete pavements was devel-oped in this study in order to analyze accurately the many com-plex and interacting factors that influence the support provided to a concrete pavement, including the following:
foundation support (subgrade k-value); base thickness, stiffness, and interface friction; slab curling and warping due to temperature and moisture
350
300
250
to
200
U
a 150 M
1—
Single Axle Load V V Tandem Axle Load
Each point represents one pavement section
gradients; * dowel and aggregate interlock load transfer action at
joints; and o improved support with a widened lane, widened base, or
tied concrete shoulder.
The ABAQUS general-purpose finite element software was used to develop a very powerful and versatile 3-D model for analysis of concrete pavements. The 3DPAVE model easily overcomes many of the inherent limitations of 2-D finite element models, which reduce the accuracy of the. results obtained from 2-D models.
The 3-D model was built in steps, first by building and vandat-ing a simpler 2-D model, and then extending the 2-D model. A careful analysis of ABAQUS' many element types, features, and options was conducted to select the components that would produce a robust and efficient model. During its development, 3DPAVE was checked against the existing 2-D finite element model ILLI-SLAB and against available theoretical solutions (e.g., Westergaard's equations). The 3DPAVE consistently out-performed the 2-D model in accuracy over wide ranges of inputs for a variety of problems.
The 3-D model was validated by comparison with deflection and strain measurements for traffic loadings and temperature variations fro ' m the AASHO Road Test, the Arlington Road Test, and the Portland Cement Association's slab experiments. A comparison of stresses computed with 3DPAVE and stresses computed from strains measured at the AASHO Road Test is shown in Figure 9. In every comparison with iheasured field data, 3DPAVE's calculated responses were found to be in very good agreement with the measured responses, and significantly closer to the measured responses than those calculated by the 2-D program. The development and validation of the 3DPAVE model is documented in Appendix D.
LOSS OF SUPPORT
Loss of support refers to any gap or void that may occur between the base and the slab, or between a stabilized base and the subgrade, causing increased deflection of the slab surface. There are three basic types of "loss of support" that a concrete slab exhibits over time.
100 150 200 250 300 350
AASHO Road Test Main Loop Edge Stress, psi (from measured strain)
PCC E = 6.25 million psi [43063 Wal PCC p = 0.28 k = 170 psi/in [46 kPa/mml Speed = 30 mph [48 km/hr] Axle load range = 12 to 48 kips [53 to 214 kNJ Slab thickness range = 6.5 to 11 inches [165 to 279 mm] 1 psi = 6.89 kPa 3DPAVE/AASHO stress ratio range is from 0.93 to 1.03 Mean 3DPAVE/AASHO stress ratio is 1.00 R2 = 0.99
n = 18
Figure 9. 3DPAVE calculated stresses versus stresses calculatedfrom strains measured at the AASHO Road Test.
9 Erosion of the base and/or subgrade from beneath the slab, resulting in increased deflections and stresses in the slab.
* Settlement or consolidation of the base and/or subgrade, usually resulting in slab cracking in the vicinity of the settlement.
* Temperature curling and moisture warping of the slab, resulting in increased deflections and stresses in the slab. Perma-nent construction curling presents a potential for very serious loss of support and early failure of jointed concrete pavement.
Loss of support can have a major impact on slab deflections and stresses, and thus pavement fife. These phenomena are dis-cussed below and in more detail in Appendix C.
Loss of Support from Erosion
Pumping results in loss of support either beneath the slab itself or beneath a treated base that is bonded to the slab. Either of these situations can lead to increased deflections and stresses in the concrete slab and is of concern to the design engineer. The extensive amount of loss of support that occurred at the AASHO Road Test site is well documented (see Appendix Q. If this loss of support had not occurred, many of the sections would have carried additional traffic loadings. Note that this erosion occurred even though the transverse joints were ade-quately dowelled to prevent faulting. If the joints were not dow-

23
elled, erosion would have been even greater and led to earlier
failure.
No methodology currently exists to predict the amount of loss
that may occur from erosion. To directly consider this in design,
the designer needs to be able to approximately predict the
amount of loss of support that may develop over time so that the
increased stresses can be predicted and their effect on cracking
included. A second main effect of pumping is joint faulting. An erodible base normally results in greater faulting and de-
creased life.
As far as the AASHTO design method is concerned, the exten-sive loss of support that occurred during the test period had a
very significant effect on pavement load-carrying capacity. It is
hard to imagine a greater amount of loss of support than that
which occurred at the AASHO Road Test site. Therefore, the AASHTO performance model is calibrated to the performance of pavements that experienced extensive loss of support. Further
increasing the slab thickness for anticipated loss of support rep-
resents an overdesign, which is not recommended. The current
AASHTO design procedure does not provide any way, other than an unrealistic increase in the k-value input, to account for
the benefit that an improved base would have on performance.
If the pavement is designed for a base type that is stronger and less erodible (or more permeable) than a dense-graded granular
base such as that to which the AASHTO performance model is calibrated, the effects of the improved base on reduced slab
stress and reduced faulting are accounted for in the proposed
revised AASHTO design model, which is presented in this re-port. Joint faulting can be predicted from several available pre-
diction models. A design check can be done to determine if joint faulting is excessive, and if so, a modified joint design can be
proposed. For other design procedures, however, the impact of erosion
and loss of support on the load-carrying capacity should be
considered differently. This involves a complex analysis of the
erodibility of underlying base and subgrade materials, erosion
of the concrete slab itself, the friction condition between the
base and concrete slab, the magnitude of deflections and load
transfer at the joints, the number of axles, and a subdrainage
analysis of the pavement section. Several of these factors must
be predicted not only for the newly constructed pavement, but
also over the life of the pavement (e.g., loss of load transfer
over time). The development of a predictive model for this
complex phenomenon would be extremely difficult. Further-
more, any such model, if developed, would need to be validated
with field performance data to assess its predictive capability.
The lack of good, field-validated models for loss of support is
currently an obstacle to predicting pavement life as a function
of progressive loss of support and increasing slab stress in a
mechanistic design procedure.
The most comprehensive design and construction guidelines
available on ways to minimize erosion and loss of support are
provided in the manual "Combatting Concrete Pavement Slab
Pumping" by the Permanent International Association of Road Congresses (PIARC) Technical Cominittee on Concrete Roads
from eight European countries and the United States (63). Fol-
lowing are the general principles:
9 The erodibility of subbase and shoulder materials is an important property that must be taken into account in the design
of new pavements and evaluation of existing pavements, because
25
AT —20:F AT —15 F C —10*F
20 AT —6*F AT —4 *F
1Z
AT O*F
15
0
10 10 C .2
.2 5
0
—5
0 8 16 24 32 40 48 56 64 72
Distance from mid—edge (in)
Notes: Nfidslab is at 0 inches and the comer is at 72 inches [1829 mml
Joint spacing L = 12 ft 13.7 ml k = 250 psi/in 168 kPa/mm] Slab thickness D = 8 In [203 mm) Concrete elastic modulus li~ = 4 million psi 127560 Wal AT = top temperature - bottom temperature, *F
I oF = 055 oC, I in = 25.4 mm, 1 mil = 25.4;Lm
Figure 10. Illustration of slab surface deflection due to
negative temperature differentials through the slab thickness,
computed using 3DPAVE.
the erosion of materials at interfaces causes pumping and desta-
bilizes concrete slabs.
* Simple tests have been -developed for characterizing the erodibility of materials. They offer data required for comparing
results using a common language understood in all countries
(rotary brush, jetting, rotational shear).
Five classes of erodibility resistance are defined in terms of
material type and binder content (see Appendix Q.
Loss of Support from Temperature Curling
Curling of a slab is caused by temperature differential through the slab, which occurs on a daily basis. A negative (top cooler than bottom) temperature differential occurs at night and results
in the comers and edges displacing upward, creating the poten-
tial for a gap or void between the slab and base or subgrade.
Figure 10 illustrates the magnitude of slab curling for a range of nighttime temperature differentials. When this happens, any
load near the comer or joint will cause an increased stress on
the surface of the slab that could lead to comer breaks, diagonal
cracks, or even transverse cracks several feet from the joint.
Figure 11 illustrates the stress caused by a load at the joint for a given combination of subgrade k, base modulus, and base thickness, for a range of nighttime temperature differentials.
A permanent form of slab curling caused by a temperature differential at construction has recently been identified by re-searchers in Chile and Germany (62, 64, 65, 66). Permanent
upward comer and edge curling may occur if a high positive

........ . .............. Joint Load Position
. . . . . .
18,000 IV, Single Aode .... : ..... ------ :'- ...... : k = 100 pci
........... I ........... Eb = 25,000 psi
- — ------------- 1% = 6 in
. . . . . .
---- ---- ---- ---- . . . . . . . . . .
........................
--------- ... ---- -- T: ....................... I ..
.. ... .. ... .... ....
...... ........ .......... ......
-- ------- - --- ---- -------
-------- .... 4 ... . . .....
-------- ..... ... ..... . .... .. ....
... ...... ....... .. . ............ L ... ........... ................
..................... ........................
24
500
450
400
350
300
250
200
150
100
50
showed that substantial drying occurs only at the top surface to a depth of less than 2 in. (51 mm). The rest of the slab remains at 80 percent saturation or higher (68). However, in dryer, less humid climates, greater drying and upward warping of the slab mayoccur. Figure 13 shows an example of seasonal warping of JPCP with no temperature differential for a typical JPCP in Chile (dryer climate area). The comers are warped upward almost 0.05 in. (1.27 nun) during the dry season (66). From the German and Chilean data it appears that moisture warping results in deformation equivalent to that which would be caused by a negative temperature gradient of about 0.5 to OYF per in. (0.011 to 0.0015'C per mm) of slab thickness.
These three climatic effects (temperature curling, construction curling, and moisture shrinkage warping) can all combine to cause a large tensile stress at the top of the slab near the joint, which in combination with axle loads could eventually lead to serious slab cracking. Combined stresses from negative tempera-ture differentials and from load can be estimated using the 3-D finite element model 3DPAVE.
0 2 4 6 8 10 12 14 16 18 20 22 24 26 28 30
Negativc Tcinperature Differential (T)
10F = 0.550C, 1 psi = 6.89 kFa, I in = 25.4 min, 1 1bf = 4.45 N, 1 psi/in = 0.27 kpa/mm
Figure 11. Increase in tensile stress at top of slab from increased negative temperature differential from top to bottom of slab.
(top warmer than bottom) temperature differential exists through the slab as it hardens. This occurs particularly on sunny days and unless extra precautions are taken to keep the top of the slab cool. This temperature differential has not been measured extensively in the past and its magnitude is not well known at the present time. One set of data from Germany shows that 5 hours after placement in sunshine, the top of a 8-in. (203-mm) slab had a temperature of 116*F (47*C) and the bottom had a temperature of 80*F (27*C). If the slab solidifies in a flat position with this large positive thermal gradient, the comers and edges will be permanently curled upward for any lower temperature gradient. Figure 12 illustrates the permanent construction curling which developed within 48 hours after placement for a concrete pavement in Germany.
"Construction curling" is defined as the temperature differen-tial that would be required to produce a flat slab (note that this is before any moisture shrinkage at the top of the slab is taken into account). A study of a concrete highway pavement in Flor-ida found that a 9*F (5*C) temperature gradient was required through the slab to flatten it (67). Obviously, any such perma-nent upward curling would create a serious loss of support be-neath the comers and edges of the slab. Such a phenomenon has been identified in Chile where several undowelled pavements exhibited excessive comer cracking within a few years after placement.
Loss of Support from Moisture Shrinkage Warping
Warping of the slab due to a moisture gradient (top drier than the bottom) occurs seasonally (56, 62, 64, 67). Data from Illinois
Consideration of Loss of Support in Design
The following recommendations were developed in this study for considering loss of support in the design process.
AASHTO Guide. The loss-of-support factor in the current AASHTO design procedures is not recommended because it is inconsistent with the performance of the AASHTO pavements to which the design equation is calibrated. Extensive loss of support occurred at the Road Test and thus is already built into the rigid pavement design model for slabs on dense-graded granular bases. The potential benefit to performance of a stiffer, less erodible, or more permeable base cannot be considered in the current AASHTO methodology.
In the proposed revision to the AASHTO procedure, the base thickness, stiffness, and friction with the slab are considered in calculation of slab stress due to midslab loading, and a design check is provided for joint/comer loading for undowelled pave-ments to identify cases for which this position may be critical. If the maximum stress due to joint/comer loading is greater than the maximum stress for midslab loading, a design modification is required. This check is not required for dowelled pavements because comer breaks or diagonal cracks have rarely occurred with dowelled joints. A design check for joint faulting is also recommended to ensure that for the design being considered, the load transfer, base type, and subdrainage are adequate to limit faulting to an acceptable level.
Mechanistic Design. Prediction of loss of support caused by thermal curling or moisture warping is possible and could be considered in design using 3-D finite element models. Prediction of additional loss of support from erosion is extremely difficult and would require a major research effort. Currently, it is recom-mended to determine the minimum material requirements that would minimize the occurrence of erosion under varying cli-matic, traffic, and design conditions, using the PLARC recom-mendations for example (63). These conditions should be met in the design and construction of the pavement. The effects of

W +1,0-
CURLING (WARPING)
LIFTING OF EDGD11 + O's -
0
O's J
LEVELLING POINTS
MEASUREMENT CONCRETE TEMP. MEAN N' AGE (h) GRADIENT CURLING
[K/-]
0 5 0,05 0,0 1 9 0,02 0,3 2 24 0,02 0,9 3 48
1 0,04
1 0,7
1 -) ZERO MEASUREMENT, JOINTS NOT CRACKED
Nr.1
Nr. 0
LONGITUDINAL LONGITUDINAL JOINT JOINT (MLF) (SLF)
25
CONCRETE Z 112,1 x _420 CM1
.0 CT80 s c ml 0
+ INSIDE LANE OUTSIDE LANE SHOULDER
4,25m — I I 4,25m 2,50M
11,0 M
12,0 m
1 in = 2.54 mm, 1 ft = 0.305 m, 1OF/in = 0.022OK/mm Figure 12. Development of permanent construction curling in a concrete slab within 48 hours after paving, in Germany (66).
thermal gradients, construction curling, and moisture warping should be considered in the design process for comer loading. A design check should be employed for joint faulting that would ensure that the load transfer, base type, and subdrainage are adequate to lirnit faulting to an acceptable level.
IMPROVED CONSIDERATION OF SUPPORT IN AASHTO METHODOLOGY
A comprehensive evaluation of the AASHO Road Test and the resulting concrete pavement design models revealed several major deficiencies related to pavement support conditions. Be-cause of the nature of these deficiencies, a major effort was required to develop procedures for improved consideration of support into the AASHTO design methodology. Details of the development are given in Appendix E.
This effort required an extensive examination of the design and subsequent performance of the test pavements at the AASHO Road Test, a detailed examination of the original devel-opment of the concrete pavement design model and its subse-quent "extensions" over time, the formulation of recommended improvements for pavement support, and finally the incorpora-tion of these improvements into a 'proposed revision to the AASHTO design model with different support inputs. Efforts were then made to verify the proposed revised AASHTO design model using long-term performance data from the extended AASHO Road Test and other in-service pavements in a variety
of climatic zones. The proposed revisions to the relevant portions of the AASHTO Guide are provided in Appendix F.
Concrete Pavement Performance at the AASHO Road Test
Details of the physical design and materials of the AASHO Road Test pavements are given in Appendix E. Traffic loadings were applied over a 2-year test period. Visible distress and roughness were recorded over this time period. Key performance aspects related to support conditions are summarized as follows.
a Extensive pumping and erosion of the. sand-gravel base occurred, causing loss of support beneath the comers and edges of the slab. The amount of material pumped onto the shoulder was so great that it was actually measured in a cubic foot con-tainer. A "pumping index" (PI) was computed as cubic inches of pumped material per inch along the pavement. The PI ranged from 0 to over 200 depending on slab thickness and axle loading.
* "By removing the concrete from a few failed sections and sampling the underlying material, it was observed that subbase material had apparently been removed by erosive action of water moving across the top of the subbase, and that the remaining subbase material was relatively undisturbed ... Inasmuch as the great majority of the sections which failed pumped severely prior to failure, many of these sections would have survived the

MAX. DEFLECTION [MMI
/ 3.5 M Z ITS-03 CHILE
J./ 4 /3.5 M
io.yym
2
4 .............. ............
MONTHLY RAINFALL [MMI 0 ............. I ............ ..... I ........................ .................................................................
0 ......................... .1 ................................................................................................
~ I J —EN— D F A J A F A , —P—. - D F A i A 0
11 087 — 1-1988
MEASUREMENT DATE
Annual cyclic variation of slab deflections and its relation to rainfall. No temperature differential through the slab thickness.
ESISIIVITY [Ka
.1000
100
OWONSTZRUCTION :
100 MON HLY RAINFALL Imml
0 ................................
.............. _L _' _' ~ LA__JM J 1 8 o I D J F -1080 1090
MEASUREMENT DATE
Annual cyclic variation of electric resistivity at the slab# surface and bottom calls in the experimental pavement, and its relation to rainfall.
Figure 13. Annual cyclic variation of slab deflections and its relation to rainfall (Note: Measurements were made when
no temperature gradient was present in the slab.) (62).
26
2
0.5
0
4
2
two years of traffic had the subbase material been stabilized
effectively to resist erosion by water (32)."
9 Slab cracking occurred on the thinner sections within each
loop. Thinner slabs (i.e., 2.5 to 5 in. [63.5 to 127 mml) developed
mostly longitudinal cracks in the wheel paths. Thicker slabs
developed transverse cracks that initiated mostly in the middle
third of the 15-ft (4.6-m) slabs. Almost none of the JPCP 11-
in. and 12.5-in. [279- and 317.5-nim] slabs cracked during the
2 years of the test, nor under an additional 14 years of 1-80
traffic.
e No faulting of the dowelled transverse joints occurred dur-
ing the 2-year period. Some faulting occurred later in the 8-in.
(203-mm) slabs (with 1-in.-diameter [25-mm] dowels) and 9.5-
in. (229-mm) slabs in the 1-80 extended traffic tests. Thicker
slabs with larger dowel bars did not fault during the extended
tests.
Original Empirical Concrete Pavement Performance Model
At the end of the 2-year traffic period, the performance data
were analyzed and prediction models were developed. Two key
prediction models were developed and incorporated into the final
design model:
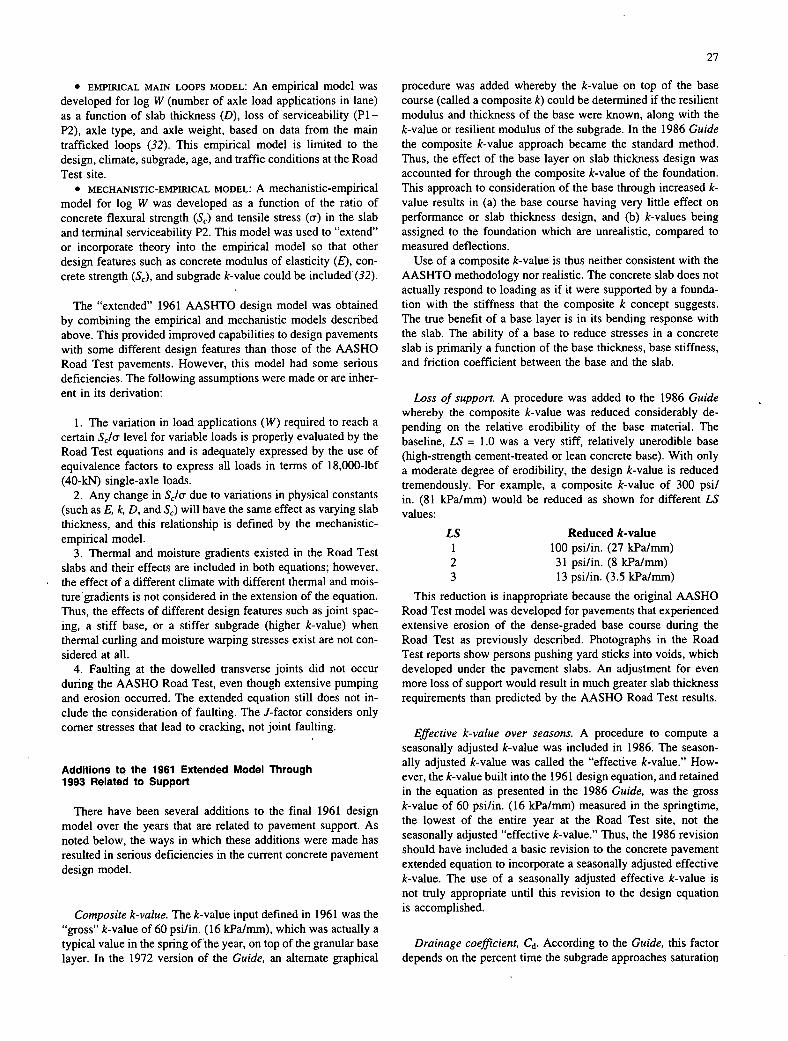
27
" EMPIIUCAL MAIN LOOPS MODEL: An empirical model was developed for log W (number of axle load applications in lane) as a function of slab thickness (D), loss of serviceability (Pl—P2), axle type, and axle weight, based on data from the main trafficked loops (32). This empirical model is limited to the design, climate, subgrade, age, and traffic conditions at the Road Test site.
* MECHANISTIC-EMPHUCAL MODEL: A mechanistic-empirical model for log W was developed as a function of the ratio of concrete flexural strength (S,) and tensile stress ((T) in the slab and terrninal serviceability P2. This model was used to "extend" or incorporate theory into the empirical model so that other design features such as concrete modulus of elasticity (E), con-crete strength (S,), and subgrade k-value could be included'(32).
The "extended" 1961 AASHTO design model was obtained by combining the empirical and mechanistic models described above. This provided improved capabilities to design pavements with some different design features than those of the AASHO Road Test pavements. However, this model had some serious deficiencies. The following assumptions were made or are inher-ent in its derivation:
The variation in load applications (W) required to reach a certain S,/cr level for variable loads is properly evaluated by the Road Test equations and is adequately expressed by the use of equivalence factors to express all loads in terms of 18,000-lbf (40-kN) single-axle loads.
Any change in Sla due to variations in physical constants (such as E, k, D, and S,) will have the same effect as varying slab thickness, and this relationship is defined by the mechanistic-empirical model.
Thermal and moisture gradients existed in the Road Test slabs and their effects are included in both equations; however, the effect of a different climate with different thermal and mois-ture'gradients is not considered in the extension of the equation. Thus, the effects of different design features such as joint spac-ing, a stiff base, or a stiffer subgrade (higher k-value) when thermal curling and moisture warping stresses exist are not con-sidered at all.
Faulting at the dowelled transverse joints did not occur during the AASHO Road Test, even though extensive pumping and erosion occurred. The extended equation still does not in-clude the consideration of faulting. The J-factor considers only comer stresses that lead to cracking, not joint faulting.
Additions to the 1961 Extended Model Through 1993 Related to Support
There have been several additions to the final 1961 design model over the years that are related to pavement support. As noted below, the ways in which these additions were made has resulted in serious deficiencies in the current concrete pavement design model.
Composite k-value. The k-value input defined in 1961 was the "gross" k-value of 60 psi/in. (16 kPa/mm), which was actually a typical value in the spring ofthe year, on top of the granular base layer. In the 1972 version of the Guide, an alternate graphical
procedure was added whereby the k-value on top of the base course (called a composite k) could be determined if the resilient modulus and thickness of the base were known, along with the k-value or resilient modulus of the subgrade. In the 1986 Guide the composite k-value approach became the standard method. Thus, the effect of the base layer on slab thickness design was accounted for through the composite k-value of the foundation. This approach to consideration of the base through increased k-value results in (a) the base course having very little effect on performance or slab thickness design, and (b) k-values being assigned to the foundation which are unrealistic, compared to measured deflections.
Use of a composite k-value is thus neither consistent with the AASHTO methodology nor realistic. The concrete slab does not actually respond to loading as if it were supported by a founda-tion with the stiffness that the composite k concept suggests. The true benefit of a base layer is in its bending response with the slab. The ability of a base to reduce stresses in a concrete slab is primarily a function of the base thickness, base stiffness, and friction coefficient between the base and the slab.
Loss of support. A procedure was added to the 1986 Guide whereby the composite k-value was reduced considerably de-pending on the relative erodibility of the base material. The baseline, LS = 1.0 was a very stiff, relatively unerodible base (high-strength cement-treated or lean concrete base). With only a moderate degree of erodibility, the design k-value is reduced tremendously. For example, a composite k-value of 300 psi/ in. (81 kPa/mm) would be reduced as shown for different LS values:
LS Reduced k-value 1 100 psi/in. (27 kPa/mm) 2 31 psi/in. (8 kPa/mm) 3 13 psi/in. (3.5 kPa/mm)
This reduction is inappropriate because the original AASHO Road Test model was developed for pavements that experienced extensive erosion of the dense-graded base course during the Road Test as previously described. Photographs in the Road Test reports show persons pushing yard sticks into voids, which developed under the pavement slabs. An adjustment for even more loss of support would result in much greater slab thickness requirements than predicted by the AASHO Road Test results.
Effective k-value over seasons. A procedure to compute a seasonally adjusted k-value was included in 1986. The season-ally adjusted k-value was called the "effective k-value." How-ever, the k-value built into the 1961 design equation, and retained in the equation as presented in the 1986 Guide, was the gross k-value of 60 psi/in. (16 kPa/mm) measured in the springtime, the lowest of the entire year at the Road Test site, not the seasonally adjusted "effective k-value." Thus, the 1986 revision should have included a basic revision to the concrete pavement extended equation to incorporate a seasonally adjusted effective k-value. The use of a seasonally adjusted effective k-value is not truly appropriate until this revision to the design equation is accomplished.
Drainage coefficient, Cd. According to the Guide, this factor depends on the percent time the subgrade approaches saturation

28
and the drainage time for the base course. The Road Test pave-
ments obviously had very poor subdrainage, as evidenced by the extensive erosion, pumping, and loss of support that oc-
curred. This poor subdrainage and loss of support is built into
the design equation through the use of the data from the Road
Test sections that had extensive erosion and loss of support.
Thus, the 1986 Guide not only added an unnecessary loss of support factor that results in additional slab thickness require-
ment, but also added a drainage factor that when applied could
result in an additional slab thickness requirement.
A pavement with better subdrainage than the AASHO Road Test pavements had may also have improved support over time
and may perform better from a cracking standpoint. Presumably,
a Cd factor greater than 1.0 reflects this benefit, but the 1986 AASHTO Guide does not specifically state what the Cd is in-tended to adjust: cracking, faulting or some other distress. Be-
cause faulting did not occur at the Road Test, the Cd obviously could not be used to improve on faulting.
Joint load transferfactor, J. The reference value of 3.2 for J is a constant from an equation derived by Spangler for stress due to loading at unprotected (free) comer conditions, based
on slab theory and laboratory test results. The comer stresses
(computed from measured strains) actually experienced by the AASHO Road Test pavements were linearly correlated to the free comer stress predicted by Spangler's equation. (The actual magnitude of the comer stresses in the dowelled Road Test
pavements was about one third of the magnitude predicted for
free comer conditions by Spangler's equation.) Thus, by incor-porating Spangler's equation into the AASHO design model (that is, calibrating it to the Road Test pavement stresses), the
J-value of 3.2 was made to represent a protected (dowelled) joint and no tied shoulders, as existed at the Road Test.
A value greater than 3.2 means higher tensile stress at the top of the slab is expected due to comer loading because the joint
load transfer is less than dowels would provide. A value less than 3.2 means the joint has better load transfer than dowels would provide, from improved joint load transfer (e.g., CRCP
or the addition of a tied concrete shoulder). It is very important
to remember that the Mactor is an adjustment for slab stresses
that cause comer breaks, and has absolutely nothing to do with
joint faulting. No joint faulting existed at the Road Test. One
cannot design a reduction or an increase in joint faulting by changing the Mactor. This has been a point of major confusion
among pavement engineers for years.
It is also important to realize that Spangler's comer equation
considers only load stress for a flat comer and does not include
thermal or moisture gradients that cause upward curl and warp
of the comer. Different climates or construction methods that
result in curling or warping magnitudes different than those that
occurred at the Road Test are not considered in the AASHTO design model.
Deficiencies In 1993 AASHTO Procedure Related to Pavement Support
The following summary is a list of the specific deficiencies
that were found to exist in the current version of the AASHTO
design procedure for concrete pavements that are related to pave-
ment support.
* The gross k-value input assumes a large amount of perma-nent deformation and does not represent the support that the
pavements actually experience during traffic loading. An elastic
k-value provides a far more realistic match to measured strains.
In analysis of AASHO Road Test pavements, the elastic k-value was found to reduce the stress in the slab equal to that computed
from measured strains under creep speed axle loading, as shown
in Appendix D. a The lowest gross k-value that was measured on top of the
base during the spring (60 psi/in. [16 kPa/mm]) was incorpo-rated into the AASHTO model in 1961 and has not been changed. The 1986 version provided a procedure to consider seasonal variation in selection of a design k-value; however, the
design equation was not modified to incorporate the effective
k-value that existed at the Road Test site. Thus, the current
seasonal adjustment procedure is incompatible with the current
design model.
* The effect of the base course on performance is not prop-erly considered through the composite top-of-the-base k-value.
This is especially true for stiff treated bases that act as structural
layers in reducing stress in the slab. An improved way to model
the effect of the base layer on slab stress is needed. I * Substantial loss of support existed for many sections at the
AASHO site, which led to increased slab cracking and loss of serviceability; thus, the performance data and design equation
already incorporate considerable loss of support. Incorporation
of an additional loss of support factor results in overdesign.
What is needed is a way to consider the benefit of an improved
base on performance in terms of cracking and faulting.
* The 1961 extension used Spangler's unprotected comer equation. The critical stress location at the AASHO Road test was along the slab edge for slabs 6.5 in. [165 mm] and greater, and resulted in transverse fatigue cracks initiating at the bottom
of the slab. The stresses in the vicinity of the comer were much
lower than those at rn~idslab due to the well-dowelled joints. Use
of Spangler's comer equation with dowelled joints does not
model the critical stress and crack initiation location, and thus
cannot possibly provide accurate indications of the effect of
slab support on cracking, especially when thermal curling and
moisture warping are considered.
* The current AASHTO procedure does not provide a meth-odology to design a pavement with undowelled joints. The J-factor only considers tensile stress that controls cracking, not
faulting. An undowelled joint requires improved slab support
from the base and a more erosion-resistant base material to
prevent loss of support over time and premature failure. Thermal
curling and moisture warping, which become much more critical
to performance with undowelled joints, are not considered in
the current AASHTO procedure. 9 Joint spacing other than that of the Road Test slabs is not
considered at all in the current design procedure. It is known
from many other studies that joint spacing has a major effect
on slab cracking and faulting (12,56). Subgrade and base support interact with joint spacing to affect combined slab stresses from
load, temperature, and moisture gradients. Thus, slab support is
a very important variable in the selection of joint spacing to
minimize transverse cracking. 4
o The original 1961 model reflects the climate of the

29
AASHO Road Test site only. The 1993 version does not include any variable that adjusts for different climates. Thus, other ch-mates that cause different magnitudes of slab curling or warping cannot be considered. This limitation alone has led to many pavement failures from premature cracking.
0
The only distress manifestation considered directly by the design procedure is transverse slab cracking because that is basi-cally the only distress which occurred at the Road Test (other than erosion and loss of support which contributes to slab crack-ing). Thus, the loss of serviceability was due almost entirely to slab cracking and the subsequent deterioration of those cracks resulting in roughness and loss of serviceability. Some sections had excessive loss of support prior to failure from slab cracking. Cracking is related to slab support, and the Spangler comer equation incorporated into the AASHO design equation is not a realistic model for predicting the cracking that occurred, as noted above.
0
Faulting of transverse joints did not occur during the 2 years of the Road Test because the joints all had dowels; thus, the performance predicted by the design model does not consider the effect of faulting on loss of serviceability. The Mactor, often thought to control faulting, has nothing to do with joint faulting.
0
Although thermal curling and moisture warping of slabs occurred during the 2-year Road Test, the effects of these impor-tant factors were not considered in any of the extensions. This is important because any design feature that would increase stresses from either of these stresses cannot be considered in design of that pavement. For example, joint spacing, base stiff-ness, and subgrade stiffness all affect stresses from thermal curl-ing and moisture gradients through the slab. None of these can be considered in pavement design using the current AASHTO Guide procedure.
Given these major deficiencies, the following sections de-scribe the research and development efforts that led to a recom-mended improved methodology for better consideration of slab support in the AASHTO design procedure.
Improved AASHTO Methodology Recommended
Improved technology exists today that was not available in 1961, including the capabilities of 3-D finite element models to compute slab stresses, larger and faster computers, and advanced mechanistic and statistical modeling. This technology was ap-plied to the original AASHO model to develop an extended and improved design model for concrete pavements that more fully considers pavement "support" aspects. Specific improvements in the proposed revision to the AASHTO design procedure in-clude the following:
Defining the k-value specifically as the value detem-Lined on the finished roadbed soil or embankment, upon which the base and slab will eventually be constructed. A composite top-of-the-base k-value is not valid and is not recommended for design.
The k-value input recommended is the elastic k-value as tested extensively at the AASHO Road Test and similarly at the Arlington test site. The elastic k-value was found to result in slab stresses similar to those produced in the field by axle loads at creep speed (see Appendix D).
P2 = 3.0 ............ ............. 02 = 2.5 P2 = 2.0
............................
.
.............. .............................
............... ............................
................. .......................... ...................
.......................... .... ..........................
............
.......... ///'' * '' * ..... * ......... * ... * ............ ...............................
..................................... .................
..... ............................... : .......
..... .......................................
.... * I * ... * ........ ..................... ** ...
...............................................
10 5 0.1 0.2 0.3 0.4 0.5 0.6 0.7 0.8 0.9
log ( S'c / CY)
Figure 14. Relationship of W to log S,'/a for three terminal serviceability levels for the proposed revised AASHTO extended concrete pavement design model.
Seasonal support variations are considered through the de-termination of an effective yearly elastic k-value of the embankment/subgrade (Appendix E). A procedure was devel-oped to determine the effective k-value for design.
The effect of the base course on slab stress due to load and temperature and moisture gradients is directly considered. The base thickness, stiffness, and friction coefficient (between the slab and the base) are direct inputs to the design procedure.
Temperature gradients and moisture gradients (as equiva-lent temperature gradients) are directly considered as inputs to the design procedure.
A procedure was developed for checking joint faulting and adjusting joint design if deficient, rather than increasing slab thickness.
Joint spacing is directly considered through consideration of its interaction with slab support and effect on combined load and temperature curling stresses.
The effects of longitudinal edge load transfer or a widened traffic lane on critical stress reduction are considered directly.
Joint (comer) load position stresses are checked for undow-elled joints in slab design.
A new design model for concrete pavement design was devel-oped using the same general approach used in 1961 to extend the original empirical model and also incorporate the above capabilities. Figure 14 shows this mechanistic-empirical type of
10 8
10 7
3:
10 6

30
3.
ts
CL
9
8.5 - ----- I Ne. 13,ediction Eq~joE .... i .......... .......... ------------ ----------- ---------
8 . .......... .......... .......... ..................... ......... ..........
... .................... .......... 7.5 . .......... : .......... ........... : ..................... ...........
7 ........... : .......... .......... .......... ............. ... ..................................
6.5 . ........... .......... .......... ........ ....... ......... ................................. : lop . ......... . .......... ..................... 6 . ........... : -----------
....................
------ ..........
5.5 . ...................... ......... .... a ............. .......... . ......... .................................
5 . ..................... .......... .......... I .......... ........... .......... ..................................
......... ........... ...........
.......... I .......... .......... .......... ........... I ........... I .......... 4.5
. 4. 4 45 5 55 6 ~3 i.5 6.5
Actual log W
Figure 15. Predicted versus actual log Wfor test sections
from the 2-year AASHO Road Test, the extended 1-80 tests,
and the FHWA database using the proposed revised concrete
pavement design model..
model, in which log W is linearly related to the logarithm of the
strength-to-stress ratio S'/(r. The new concrete pavement log W C model (for 50 percent reliability) was obtained by combining
the empirical model and the mechanistic-empirical model as
follows (see Appendix E for derivation):
log W' = log W + (5.065 — 0.03295 p22-4)
1 (1)
o. 0)] [log (!~`) — log M9
where
W' = number of design 18-kip equivalent single-axle loads
(ESALs) in traffic lane
(Y' = maximum tensile slab stress for the midslab load position due to combined load and effective temperature curl (with
inputs for the new pavement design)
W= number of 18-kip ESALs estimated using the original
empirical AASHO design model from the main loops
(with inputs from original- AASHO Road Test)
(T = Maximum tensile slab stress for the midslab load position due to combined load and effective temperature curl (with
inputs from original AASHO Road Test)
Equation 1 represents the best fit relationship between design features and log W. Reliability can be added in a manner similar
to that in the current AASHTO Guide.
Field Verification of New Models
Data were obtained from the 14-year extended AASHO Road
Test (69) and the RPPR database (56). This database provides
performance data from sections with various base types, sub-
grades, climates, and designs from many states. The number of
18-kip (40-kN) ESALs (log M were predicted from the initial
serviceability (Pl) to the current serviceability (P2). The actual
number of ESALs were computed from the traffic data on each
section. The results shown in Figure 15 indicate a reasonable
prediction of log W for a wide variety of pavement designs
across the United States with no particular bias of over or under
prediction.
Sensitivity of Proposed New AASHTO Concrete Pavement Design Model
Sensitivity analyses were conducted to show the relative ef-
fects of the design features, particularly those related to pave-
ment support, on slab thickness and traffic load-carrying capac-
ity. A standard pavement design section, described below, was used to conduct the sensitivity analyses:
Standard Pavement Section Features
Pl = 4.5
P2 = 2.5 Slab thickness D = 9 in. (229 mm), also I I
- in. (279 mm)
Slab elastic modulus Ec = 4,200,000 psi (28938 MPa)
Base thickness = 5 in. (127 mm), also 4
and 6 in. (102 and 152 mm)
Base elastic modulus Eb = Aggregate, 25,000 psi (172 MPa), also
Treated, 500,000 and I million psi (3445 and
6890 MPa) k = 100 psi/in. (27 kPa/
nim), also 250 and 400 psi/in. (67.5 and 108 kPa/mm)
Joint spacing L = 15 ft (4.6 in), also 10 and 20 ft (3.05 and 6.1 in)
Concrete flexural strength S' = 690 psi (4754 kPa) c Effective temperature gradient DT = Varies with slab thick-
ness; Urbana IL climate
Base friction coefficient f = Varies with base type (modulus);
1.5 for Eb = 25,000 psi (172 MPa) 6 for Eb = 500,000 psi (3445 MPa)
35 for Eb = I million psi (6890 MPa)
PCC Shoulder = No Widened Lane = No
Effect of Subgrade k-Value and Base Stiffness
The effects of the subgrade stiffness (k-value) and base stiff-
ness (Eb) on load-carrying capacity are complex, as they strongly interact with each other and other design features. Table 6.illus-
trates some results from varying subgrade k-value and base elas-
tic moduli (with corresponding variation in slab/base friction).
The friction coefficient used for each base type is shown in

TABLE 6. Sensitivity analysis for k-value and base modulus
Base Modulus
(psi)
k value (psi/ift)
100 250 400
25,000 (f = 1.5) 13 15 16
500,000 (f = 6) 20 20 20
1,000,000 ff = 35) 24 20 20
Values shown in table are 18-kip [80 kN] ESALs, millions I psi = 6.89 kPa, I psi/in = 0.27 kPa/mm
TABLE 7. Sensitivity analysis for base thickness and k-value
Base Modulus
(psi)
Base Thickness (in)
k value (psi/in)
1007 250 400
25,000 4 13 15 16
25,000 6 13 15 17
1,000,000 4 20 18 18
1,000,000 6 28 21 23
Values shown in table are 18-kip [80 kNI ESALs, millions 1 psi = 6.89 kPa, 1 in = 25.4 mm, I psi/in = 0.27 kPa/mm
31
Table 6 and represents a typical value of peak frictional resistance.
These results show that on a soft subgrade (k = 100 psi/in. [27 kPa/mm]), changing from an aggregate base to a treated base produces a large increase in the load-carrying capacity (13 to 24 million ESALs). The stiffer the subgrade, the less the
effect of base stiffness on load-carrying capacity.
Given an aggregate base (Eb = 25,000 psi [172 MPa]), an increased subgrade stiffness results in some increase in load-
carrying capacity. Given a stiffer treated base, however, the
stiffness of the subgrade has little effect on load-c~arrying
capacity. The coefficient of friction does not appear to have much of
an effect on the load-carrying capacity for any given base type,
unless a very high value is used. For example, given a treated
base with modulus Eb = 1,000,000 psi (6890 MPa), a change in the friction coefficient from 1.5 (low friction) to 35 (typical for cement-treated base) results in vey little change in the ESALs.
Thus, it is not necessary to quantify the friction coefficient f with great precision.
Effect of Base Thickness and Embankment
Stiffness
The effect of base thickness is shown in Table 7 for ranges of subgrade stiffness and base stiffness. Base thickness does not
affect traffic life when the- base has a low modulus (untreated
aggregate base). This same.conclusion was reached at the Road
Test, where "the effect on performance of varying the thickness
of the subbase between 3 and 9 in was not significant . . ." (32). However, when the base is treated and has a modulus such as
1,000,000 psi (6890 MPa), the thickness has a very significant effect as shown. The effect of base thickness is less with stiffer
subgrades.
Effect of No Base
Most of the AASHO Road Test sections had a dense-graded aggregate base course. The thickness of the base did not influ-
ence the load-carrying capacity of the pavements. Some sections,
however, were constructed directly on the silty-clay soil sub-
grade. Analysis of the performance of these sections led the
AASHO research staff to conclude that "sections with subbase had an average life about one third longer than that of sections
without subbase" (32). The increase in life between sections with base and matching sections without base ranged from 0 to 100 percent.
The proposed revision to the AASHTO design procedure in-cludes thickness of base as an input. The results shown in Table
8 were obtained for pavements with no base and pavements with a 6-in. (152-nun) aggregate base. The results are similar to those
obtained at the AASHO Road Test: for k = 100 psi/in. (27 kPa/ nun) the predicted traffic life of sections with a granular base
are about 35 to 50 percent greater than similar sections with no base.

TABLE 8. Sensitivity analysis for slab thickness, aggregate base thickness and k-value
Slab Thickness (in)
Aggregate Base
Thickness (in)
k value (psi/in)
100 250 400
9 0 9 11 12
9 6 13 18 17
11 0 37 35 32
11 6 51 45 41
Values shown in table are 18-kip [80 kN] ESALs, millions 1 in = 25.4 mm, 1 psi/in = 0.27 kPa/mm
TABLE 9. Sensitivity analysis for joint spacing and k-value for aggregate base
Joint Spacing (ft) k value (psi/in)
100 250 400
10 15 20 23
15 13 15 16
20 10 11 11
Values shown in table are 18-kip [80 kN] ESALs, millions 1 ft = 0.305 in, 1 psi/in = 0.27 kPa/mm
32
Effect of Joint Spacing
As joint spacing increases, stresses due to thermal curling and moisture warping increase. The JPCP at the Road Test had a 15-ft [4.6-m] joint spacing and none of the extensions to the empirical design model included curling or warping stresses. Table 9 shows some results for the standard pavement section.
These results show that for any level of subgrade stiffness, the number of load applications decreases as joint spacing in-creases. The results also show that as subgrade stiffness increases for a shorter joint spacing, the traffic applications to terminal serviceability increases. However, for longer (20-ft [6.1-m]) joint spacing the traffic remains about the same. These results again show the significant interactions between support and de-sign features.
Alternative Designs
The proposed revised design procedure permits the compari-son of a variety of pavement designs that are supposed to show approximately the same traffic life. Several of these designs are shown in Table 10. All of these designs meet the same design ESAL traffic level for the standard example (13 million).
As joint spacing increases from 15 to 20 ft (4.6 to 6.1 in), the required slab thickness increases from 9.0 to 9.3 in. (229 to 236 mm) for the untreated aggregate base and from 8.2 to 8.7 in. (208 to 221 mm) for the treated base. Use of a 5-in. (127-mm) treated base in lieu of a 5-in. (127-nun) aggregate base
decreases required slab thickness by about 0.8 in. (20 mm) for the 15 ft (4.6 in) joint spacing.
Effect of Climate
The effect of climate was brought directly into the proposed revised AASHTO design model through consideration of a posi-tive (daytime) effective temperature gradient from top to bottom of the slab. Values were computed for various locations across the United States and the results show that certain areas of the United States have much more critical values than the AASHO Road Test site. Note that the negative temperature gradient and moisture gradient was brought into the design through the joint loading position check described later.
Given the standard pavement section and a given design traf-fic, the results in Table 11 represent the effect of different cli-mates on slab thickness at 50 percent reliability, holding all other inputs constant. As the effective temperature differential inceases, slab thickness must be increased if joint spacing is held constant to carry the same amount of traffic.
A similar illustration could be made by holding slab thickness constant at 9 in. (229 n1m) (where practical) and varying joint spacing for the different climates. Table 12 shows that as the effective temperature differential increases for different regions, the joint spacing required to control curling stresses (to achieve the same loss in serviceability) decreases.

TABLE 10. JPCP pavement designs using proposed revised design model for 50 percent reliability, 13 million ESALs, k = 100 psi/in. (27 kPa/mm)
Slab Thickness Base Type ase Thickness Joint Spacing Required (in), (in) (ft)
9.0 Aggregate 5 15 (Eb = 25,000 psi)
9.3 Aggregate 5 20 (Eb = 25,000 psi)
8.2 Treated 5 15 (Eb = 11000,000 Psi)
8.7 Treated 5 20 (Eb = 1,000,000 Psi)
1 in = 25.4 mm, 1 psi = 6.89 kPa, 1 ft = 0.305 in
TABLE 11. Slab thickness and joint spacing required for various effective temperature differentials existing at various locations
Location
I
Effective Temperature Differential* (M
Slab Thickness Required (in)
joint Spacing Required (ft)
Syracuse, NY 5.2 8.6 15
Salem, OR 6.4 8.8 15
Raleigh, NC 7.2 8.9 15
Urbana,IL 7.9 9.0 15
Tallahassee, FL 8.7 9.2 15
Sacramento, CA 10.0 9.3 15
Las Vegas, NV 11.5 9.6 15
Effective temperature differential between top and bottom of 9 in [229 mm] slab PF = 0.55'C, 1 in = 25.4 mm, 1 ft = 0.305 in
33
Comparison with 1993 AASHTO Guide
A comparison was made to see how the proposed revised design procedure compared with the existing AASHTO proce-dure. The standard pavement section defined previously was examined over a range of traffic loadings to make this comparison.
Table 13 shows the comparison for a pavement located at the AASHO site but having a stiff (Eb = 1,000,000 psi [6890 MPa]) treated aggregate base course. The 1993 AASHTO method han-dles this case by increasing the k-value on top of the base. A "composite" k of 400 psi/in. (108 kPa/mm) was determined from the AASHTO Guide's nomograph for base thickness = 5 in. (127 mm), base E = 1,000,000 psi (6890 MPa), and subgrade MR = 3000 psi (20.7 MPa). Two sets of results are shown: the first set of thicknesses obtained using the composite k of 400 psi/in. (108 kPa/mm), assuming no loss of support, and the second set of thicknesses obtained using a k-value of 130 psi/ in. (35 kPa/mm), the value which would be obtained by reduc-ing the composite k-value for loss of support using LS = 1.0.
The proposed revised procedure handles the case of a treated-base course by considering the stiff base as a structural layer, with a degree of friction between the slab and base which is appropriate for the base type (see Appendix E), and a k-value input that represents the embankment beneath the base. The results show the thicknesses to be closer to the composite k-value with no loss of support, except at very high traffic levels.
However, many different comparisons could be made. For example, the existing AASHTO design does not consider the effect of Joint spacing. A second comparison was made for a design ESAL of 50 million. The existing AASHTO procedure would require the same thickness for any joint spacing, whereas the proposed revised procedure would require a thicker slab for a longer joint spacing (or conversely a shorter joint spacing for a thinner slab) to provide the same performance. This is commonly understood and provided for in various design manuals that thicker slabs can have somewhat longer joint spacings due to the reduction in thermal and moisture gradient effects. Table 14 illustrates some results for this example. An increase in joint spacing requires an increase in slab thickness.
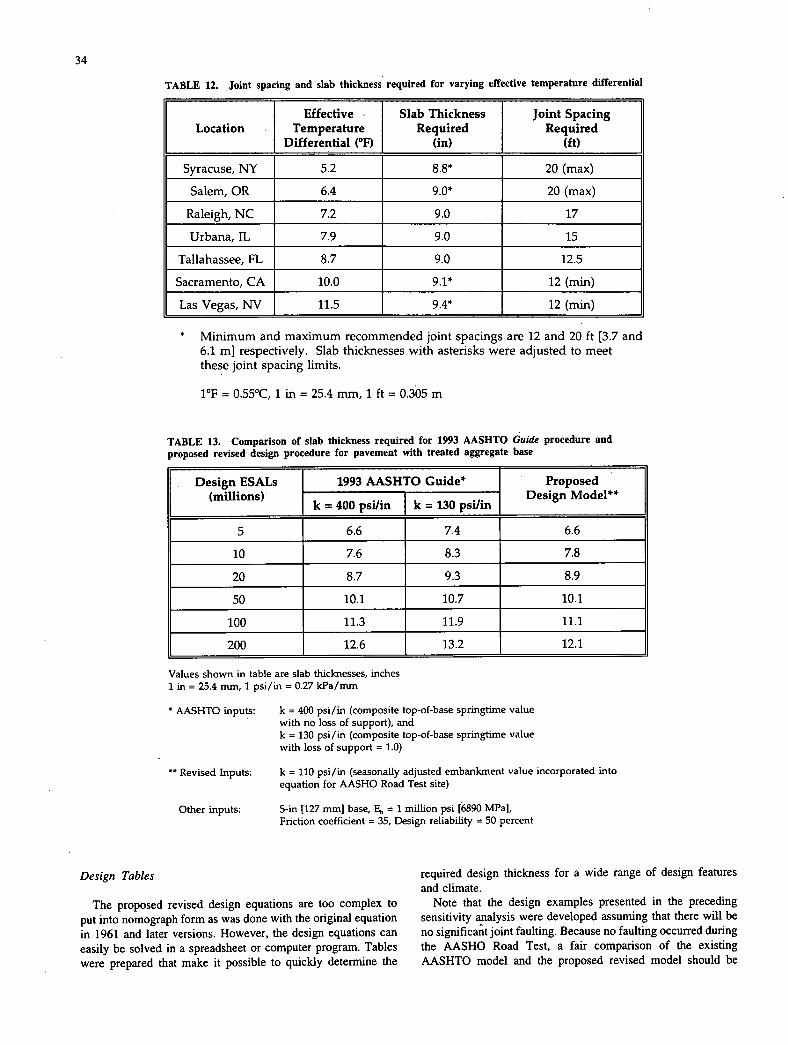
TABLE 12. Joint spacing and slab thickness required for varying effective temperature differential
Location Effective
Temperature Differential ff)
Slab Thickness Required
(in)
Joint Spacing Required
(ft)
Syracuse, NY 5.2 8-8* 20 (max)
Salem, OR 6.4 9.0* 20 (max)
Raleigh, NC 7.2 9.0 17
Urbana,fL 7.9 9.0 15
Tallahassee, FL 8.7 9.0 12.5
Sacramento, CA 10.0 9.1* 12 (min)
Las Vegas, NV 11.5 9.4* 12 (min)
Minimum and maximum recommended joint spacings are 12 and 20 ft [3.7 and 6.1 in] respectively. Slab thicknesses with asterisks were adjusted to meet these joint spacing limits.
1'F = 0.55*C, 1 in = 25.4 mm, 1 ft = 0.305 in
TABLE 13. Comparison of slab thickness required for 1993 AASHTO Guide procedure and proposed revised design procedure for pavement with treated aggregate base
Design ESALs (millions)
1993 AASHTO Guide* Proposed Design Model"
k 400 psi/M7 k = 130 psi/in
5 6.6 7.4 6.6
10 7.6 8.3 7.8
20 8.7 9.3 8.9
50 10.1 10.7 10.1
100 11.3 11.9 11.1
200 12.6 13.2 12.1
Values shown in table are slab thicknesses, inches 1 in = 25.4 nun, 1 psi/in = 0.27 kPa/mm
AASHTO inputs: k = 400 psi/in (composite top-of-base springtime value with no loss of support), and k = 130 psi/in (composite top-of-base springtime value with loss of support = 1.0)
** Revised Inputs: k = 110 psi/in (seasonally adjusted embankment value incorporated into
equation for AASHO Road Test site)
Other inputs: 5-in [127 mml base, Eb = 1 million psi [6890 Wal,
Friction coefficient = 35, Design reliability = 50 percent
34
Design Tables
The proposed revised design equations are too complex to put into nomograph form as was done with the original equation in 1961 and later versions. However, the design equations can easily be solved in a spreadsheet or computer program. Tables were prepared that make it possible to quickly determine the
required design thickness for a wide range of design features and climate.
Note that the design examples presented in the preceding sensitivity analysis were developed assuming that there will be no significant joint faulting. Because no faulting occurred during the AASHO Road Test, a fair comparison of the existing AASHTO model and the proposed revised model should be

TABLE 14. Comparison of slab thickness required for 1993 AASHTO Guide procedure and proposed revised design procedure for a range of joint spacings
Joint Spacing (ft)
1993 AASHTO Guide* Proposed Design Model"
k 400 psi/in k 130 psi/in
15 10.1 10.7 10.1
20 10.1 10.7 10.7
25* 10.1 10.7 11.3
Values shown in table are slab thicknesses, inches I in = 25.4 mm, 1 psi/in = 0.27 kPa/mm Inputs same as specified for Table 13 Design ESAL = 50 million
A joint spacing greater than 20 ft [6.1 in] is not recommended for this range of slab thickness but these are the values obtained.
35
made considering only loss of serviceability due to cracking that occurs as a function of stress repetitions. In reality, jointed concrete pavements in service for several years may develop faulting as well, which further reduces the serviceability and thereby reduces the number of axle loads that the pavement can carry. The next section discusses this aspect of performance and provides a design check for faulting.
Design of Joint Load Transfer to Control Faulting
Because all joints were adequately dowelled at the Road Test, no significant faulting occurred during the 2-year test. If the joints were not properly dowelled, a large amount of faulting would have occurred. According to the Road Test report:
One joint faulted seriously, but investigation showed that the joint had been accidentally sawed at some distance beyond the end o the dowels intended to protect it. Over the 2-year period of the test there were no other cases of measurable faulting at joints, all of which were dowelled. (32)
Faulting is one of the most important distresses affecting ride-ability and serviceability of jointed concrete pavements. There-fore, any pavement that faults significantly will have reduced serviceability and carry fewer traffic loads to tenninal service-ability. The current (1993) AASHTO design concept is to design for different load transfer levels by selection of the J-factor. A higher J-factor will result in an increase in slab thickness ac-cording to the 1993 AASHTO equation. However, field studies have demonstrated that slab thickness does not affect faulting significantly (56,69). Thus, joints must be prevented from signif-icant faulting through good joint load transfer, joint spacing, base design, and subdrainage design, not slab thickness design. The following procedure is recommended to determine the ade-quacy of a proposed joint load transfer design.
STEP 1: Initial Slab Thickness Design. Develop an initial slab thickness design. Note that the degree of joint load transfer is not an input at this stage since the midslab load position is used. However, joint spacing, base properties (type, thickness, stiffness, friction), and other design features must be chosen for
the slab thickness design. These can be modified later if neces-sary and a redesign made to achieve a better joint design.
STEP 2: Initial Joint Design. Develop an initial joint design, including the following: base type, joint spacing, subdrainage presence, and dowel diameter, if dowels are to be used.
STEP 3: Joint Faulting Predic ' tion. Mean joint faulting is predicted using models in Reference 56, and the adequacy of the design to control faulting below an acceptable level is evaluated.
Tables were prepared to show the faulting predictions for pavements with and without dowel bars. The mean joint faulting is predicted and compared with recommended critical levels. If the predicted faulting is greater than the recommended level, an adjustment to joint design is made. Adjustments include use of dowels, or if dowels already exist, an increase in the diameter, selection of a different base type and permeability, and a de-crease in the joint spacing (for undowelled joints). Slab thickness is not adjusted because it has only a minimal effect on joint faulting.
Design of the Base Course
The base course is considered a structural layer in the pro-posed revision to the AASHTO design procedure, as opposed to the current AASHTO procedure in which the base is consid-ered a. part of the foundation and thus affects the k-value input. In the proposed revision'to the design procedure, a coefficient of friction between the slab and base is also an input. An equa-tion was developed, using the results of many 3DPAVE runs, for slab stress due to midslab loading assuming full friction (i.e., a "bonded" interface). The stress in the slab due to a degree of friction less than full friction is computed by multiplying the full friction stress by an adjustment factor which is a function of the slab thickness, base modulus, and friction coefficient. The equation for the friction adjustment factor was also developed using the results of a factorial of 3DPAVE runs.
Ranges of values for friction coefficients for a variety of base types and interface treatments are given in Appendix E, summarized from the available literature. Most of the available data on slab/base interface friction comes from laboratory tests in which small-scale concrete slabs are constructed on bases

36
and pushed horizontally with a measured force. The vertical
force in such tests is generally only the weight of the slab. How
well such tests represent field conditions, in which full-scale
slabs also bend under the weight of applied loads, is not clear.
It is also not clear at this time how much the friction coefficient
of various bases and interface treatments changes over time and
how a coefficient that best represents,the typical value over the
service life of the pavement should be selected. The addition of
a friction coefficient as an explicit input to the slab thickness
design process is believed to be a significant improvement to
the AASHTO design procedure and a significant need in any mechanistic design procedure. However, long-term field per-
formance studies data essential to better establish how slab/
base interface friction over the life of the pavement should be
characterized. Friction between the slab and base affects the amount of
erosion between the layers also. A high degree of friction will greatly reduce or eliminate erosion between the slab and the
base. Reasonable friction of the slab to almost any type of base
course can be achieved without extraordinary means. To avoid
reflection cracking in a slab due to high friction with a cement-
treated or lean concrete base, transverse and longitudinal joints
should be cut in the base to a depth of approximately one fourth
of the thickness of the base prior to slab placement. Joints are
not needed in asphalt-treated bases.
The friction between the slab and base is also an input to the
calculation of stress due to joint (comer) loading. A check on this stress is included in the proposed revision to the design
procedure to identify situations in which the comer loading posi-
tion might control the design. This is described in the next
section.
The effect of the base is directly considered in joint design
as well as the slab thickness design. If the initial joint design and base features are not adequate to control faulting below a
design value, revisions must be made to the load transfer system
and/or the base and subdrainage.
Design Check for Critical Joint Load Position Stresses
The proposed revision to the AASHTO procedure uses the midslab loading position shown in Figure 16, because this was the critical position (maximum stress) at the AASHO Road Test. This occurred because all of the transverse joints were well
dowelled to provide good load transfer. Strain measurements
from Loop I showed that the maximum stress in the slab oc-curred "along the pavement edge with the center of the outer
loaded area at the distance of 1 ft (0.3 in) from the edge and 4 to 6 ft (1.2 to 1.8 in) from the nearest transverse joint" (70). This maximum stress approximately matched the stress com-
puted from strain measurements at the slab edge for midslab
loading from moving truck axles (30 mph [48 km/hr]):
For a constant axle weight and slab thickness, it was estimated that the maximum compressive stress at the (top) edge due to edge loading exceeded, in absolute value, the maximum tensile stress due to comer loading by 51 to 112 percent. The exact percentage depended on the thickness of the slab (32).
Similar results were obtained from 313PAVE for the dowelled AASHO Road Test pavements. For dowelled load transfer and
Mid—slab Loading (positive gradient)
J 4 1 J J J 1~ .S -1 4 4 ~jjl J J J 4 J 4
Subgrade
,a J 4 1 4 4 J 4 . . . . . .
Critical stress region at bottom of slab
Joint Loading (negative gradient)
Critical stress region ,at top of slab
Subgrade
Figure 16 Critical location of maximunc tensile stresses for
the midslab load position and joint load position.
typical positive and negative temperature differentials appro-
priate for the AASHO Road Test site, the maximum stress is much greater for the midslab loading position. Figure 16 shows the maximum critical stress region at the bottom of the slab for
loading combined with a positive temperature differential. This
explains why comer breaks are almost never observed for prop-
erly dowelled joints, as many pavement surveys have shown
(56,69).
However, cracks often do occur near the joints in pavements
with no mechanical load transfer such as dowels. Under certain
design and climatic conditions, truck axle loadings near the
transverse joint (see Figure 16) may produce even higher tensile stresses in the slab than the midslab load position. These high
tensile stresses could result in comer breaks, diagonal cracks,
or even transverse cracks several feet from the joint. This mecha-
nism has been well analyzed and described by Poblete et al. for undowelled jointed plain pavements in Chile (61,62).
Figure 16 shows the critical stress region on top of the slab, found using 3DPAVIE, to be the maximum critical tensile stresses for the joint loading position when no load transfer
exists at the transverse joint. With load transfer, these stresses
decrease significantly to values less than those obtained for the
midslab position.
Given these findings and concerns, a design check for the
joint loading position with negative equivalent temperature dif-

37
ferentials was developed. The joint loading position shown in
Figure 16 requires a different analysis due to the additive effects of the following contributors to slab stresses.
0 AXLE LOAD STRESS: When the axle load is near the trans-
verse joint a tensile stress occurs at the top of the slab.
(ni;NEGATIVE TEMPERATURE DIFFERENTIAL STRESS: Negative
httime) temperature differentials cause comers to curl up-
ward, creating a tensile stress at the slab surface. An effective
negative temperature differential stress was computed for each
climatic site using a procedure similar to that used for the day-
time positive temperature differentials.
0 CONSTRUCTION CURLING STRESS: Upward curling of cor-
ners occurs shortly after concrete slab placement if a high posi-
tive temperature differential through the slab is present as the
concrete sets (62,64). This positive differential occurs particu-
larly on sunny days when conventional curing procedures are
used. This temperature differential has not been measured exten-
sively in the past and its magnitude is not well known at the
present time (62,64). This is defined as the temperature differen-
tial that would be required to produce a flat slab (note that this
is before any moisture shrinkage occurred at the top of the slab).
" MOISTURE GRADIENT STRESS: Moisture shrinkage warping
of the top of the slab occurs over time (62,64,67,68). The stress induced by this type of warping can be determined by represent-ing the moisture warping by an equivalent temperature gradient (see Appendix Q.
Applied loads and the three climatic factors previously de-
scribed can lead to large tensile stresses at the top of the slab
near the joint. Combined stresses from negative temperature
differentials and from load can be estimated using 3DPAVE. Many jointed plain concrete pavements without dowel bars
or other mechanical load transfer devices have been constructed
in the United States and other countries. These pavements are
often built in warm dry climates (e.g., the western United States,
Chile, Spain) where the potential for construction curling and
moisture shrinkage warping is greater. When the joints are open
in cooler weather, the degree of load transfer at the joints pro-
vided by aggregate interlock is very low. Analyses were conducted using 3DPAVE of pavement sec-
tions no load transfer, loaded at the joint position. The maximum
stress in the slab due to load and temperature differential was
computed and plotted as shown in Figure 11 for a range of design features. The results showed that under conditions of
extreme negative temperature differential and poor load transfer,
the tensile stresses due to joint loading can equal or exceed
stresses due to midslab loading.
A procedure was developed to check for critical stress for the joint loading position for pavements that do not have mechanical
load transfer devices equivalent to dowel bars. Pavements that
have adequate load transfer devices such as properly sized and
spaced dowels would not experience significantly high stress
at the joint. The slab stress design check is accomplished by comparing the stress obtained for the midslab loading position
with the stress obtained for the joint loading position. If the joint loading stress is greater, then comer breaks, diagonal cracks,
and even transverse cracks may initiate at the top of the slab
first. The higher of the two stresses is the one which should be
used in the slab thickness design.
Design features that provide a defense against critical joint
loading stresses are the use of properly sized and spaced dowels
and to a lesser degree, a widened slab (i.e., slab paved wider
than 12 ft [~.7 in] but traffic lane striped 12 ft [3.7 in] wide), or a tied concrete shoulder. The other effect that good load
transfer has on performance is that comer deflections are re-
duced. ffigh differential deflections at the comer can lead to erosion and loss of support, resulting in even greater stresses
under comer loading.
Design of Different Types of Concrete Pavement
The current AASHTO Guide does not distinguish between JPCP, JRCP, and CRCP as far as thickness design is concerned. The proposed revision to the AASHTO procedure applies specif-ically to JPCP with relatively short joint spacing. Required slab thickness for JRCP and CRCP may be different; however, in
keeping with current AASHTO design philosophy, the thickness designed for JPCP should be adequate for JRCP and CRCP.
Summary Comparison of Existing AASHTO Design Procedure and Proposed Revised Procedure with Improved Support Considerations
Table 15 summarizes the key differences between the way in which design features related to pavement support are handled
in the current AASHTO procedure and the proposed revised procedure developed under NCHRP Project 1-30.

TABLE 15. Summary of comparison between existing and proposed revised design considerations
Design Existing AASHTO Procedure NCBRP 1-30 Proposed Revision Feature
Subgrade Gross k value required, lowest Elastic k value of subgrade, seasonal Support springtime.value incorporated into adjustment if needed. Subgrade
equation, NOT seasonally adjusted k stiffness directly considered in slab value. Effect of subgrade stiffness design for load and thermal curling not considered in thermal curling stresses. Brings climate into design stresses in slab. process. Ability to estimate k value
I for variety of soils and bedrock.
Base Considered only through a composite Direct consideration of base as Course (top-of-base) k value. Base stiffness structural layer (thickness, stiffness
and friction are not considered in and friction). Effect of base on both load or curling stresses in slab. load and thermal curling stresses.
joint Built-in 15 it [4.6 ml JPCP. Direct consideration of joint spacing Spacing Built-in 40 ft [12.2 m] JRCP. effect on load and curl stresses.
Not considered otherwise. Brings climate into design process.
Climatic AASHO site climate built into design Seasonal variation of subgrade elastic Effects model. Only adjustment is through k value possible through effective k
seasonal composite k value. Other procedure. Effective temperature climates. (temperature differentials) differentials can be determined for not considered. climates different than AASHO site.
Seasonal Seasonal adjustment is possible using Seasonally adjusted AASHO site Variation effective k value method, but effective k value built into design in Support adjustment is inconsistent with lowest model. Seasonal adjustment possible
springtime gross k value built into for other locations. model.
Loss of Substantial loss of support built into Substantial loss of support built into Support existing model. Additional reduction model from AASHO site, no further
of k value for loss of support is adjustment needed. overdesign.
joint Not considered at all in current Faulting checked after slab thickness Faulting procedure. Mstakenly thought to be, design completed. If joint design is
considered through J factor, which inadequate, joint design and/or base results in increased slab thickness, not changes allowed, but not slab improved joint design or reduced thickness increase. faulting.
joint Load Dowelled joints built into existing Effect of joint load transfer on comer Transfer model. J factor attempts to adjust load, curl and moisture gradient
comer stress for more or less load stresses for undowelled joints is transfer. No way to consider curling checked directly. or warping of corners, especially for undowelled joints.
Widened Inadequate stress adjustment through Direct adjustment of critical stress Slab, J factor. through consideration of longitudinal Tied load transfer. Shoulders
38

CHAPTER 3
INTERPRETATION, APPRAISAL, AND APPLICATION
39
Many practical insights and procedures were identified and
developed in this research study into support for concrete pave-
ments. This chapter summarizes the practical guidelines for im-
proving the consideration of support in concrete pavement de-
sign. The guidelines for selection of a design k-value are
applicable to both the AASHTO Guide design methodology and a mechanistic design methodology.
Specific guidelines were also developed for improved consid-
eration of support in slab thickness design and joint design in
the AASHTO methodology. Proposed revisions to the relevant portions of the AASHTO Guide are provided in the appendixes. Finally, guidelines for improved support considerations in mech-
anistic design of concrete pavements are provided.
IMPROVED GUIDELINES FOR SELECTION OF DESIGN k-VALUE
The following guidelines for selection of k-value were devel-
oped in this study:
* Selection of values for fine-grained soils as a function of AASHTO or Unified soil class and degree of saturation;
* Selection of k-values for coarse-grained soils as a function of AASHTO or Unified soil class and density;
* Correlations of k-value to California Bearing Ratio (CBR),
Hveem Stabilometer (R-value), and Dynamic Cone Penetrometer
(DCP); 0 Adjustment to k-value for height and density of embank-
ment above the subgrade;
~ Adjustment to k-value for a rigid layer within 10 ft (3 m) of e surface of the subgrade; and
* Adjustment to seasonal k-values on the basis of relative
damage to identify an average annual effective k-value for
design.
All of these k-value guidelines are directly applicable not only to the AASHTO design procedure but to any concrete pavement design procedure, with the exception of the seasonal adjustment.
The seasonal adjustment procedure given in Appendix H of this
report was derived for the proposed revised AASHTO perform-ance equation. The seasonal adjustment procedure is applicable
in concept to any concrete pavement design procedure, but
would have to be derived for the performance model used. All of the above k-value guidelines are presented in Appendixes F
and H and are documented in Appendix B.
IMPROVED SUPPORT CONSIDERATION IN AASHTO DESIGN METHODOLOGY
Improved consideration of the effect of slab support on con-
crete pavement performance is possible through proposed revi-
sions to the AASHTO design procedure. The revised procedure consists of the following steps:
Step 1. Develop Effective Modulus of Subgrade
Reaction (k-value).
The design k-value is defined as that on top of the finished
roadbed soil or embankment upon which the base and slab will
be constructed. The k-value may be determined by (a) correlation with soil types, properties, or tests; (b) deflection testing of in-service pavements; or (c) direct plate load testing. These options
are described in detail in Appendixes B and F. Adjustments to
the k-value for seasonal variation, embankment material, and a
shallow rigid layer may also be needed.
Step 2. Determine Required Slab Thickness.
The required slab thickness is a function of the following:
effective (seasonally adjusted) k-value,
estimated future traffic in the design lane for the perfor-
mance period, W18,
design reliability, R,
overall standard deviation, So, design serviceability loss, PI — P2, concrete modulus of rupture, Sc,
concrete elastic modulus, E,
joint spacing, L,
base modulus, Eb, base thickness, Hb, effective positive temperature differential, TD (from equa-
tion given),
* lane edge support condition (conventional width and AC shoulder, conventional width and tied PCC shoulder, or widened slab), and
* friction coefficient between the slab and base, f
Although the equation for midslab critical stress is very com-
plex, it was found that for a given combination of design k-value, base type (i.e., modulus and friction coefficient), joint
spacing, concrete modulus of rupture, and positive temperature
differential, a linear relationship exists between log W1 8R (the
logarithm of the design ESALs for the specified level of design
reliability) and the slab thickness D.

40
Step 3. Design Check for Joint Loading Stress.
If the transverse joints will not be dowelled, stress in the comer region due to joint loading may exceed the stress due to midslab loading under some design and climatic conditions. If the joint load stress is found to be critical, changes in the slab design or joint design features may be required.
Step 4. Design Check for Joint Faulting.
A design that is adequate in terms of slab thickness is not necessarily adequate in terms of faulting, a distress which has a significant effect on serviceability loss but which is not in-cluded in the AASHTO performance model. To ensure that the design is adequate with respect to faulting potential, faulting is predicted using available models. If the predicted faulting ex-ceeds the recommended critical level, changes in the joint design are required. Slab thickness should not be increased to attempt to compensate for faulting potential.
IMPROVED SUPPORT CHARACTERIZATION FOR MECHANISTIC DESIGN
Mechanistic design requires realistic characterization of the subgrade and base layers beneath the concrete slab so that the critical tensile stresses in the slab due to loading and climate can be accurately computed for design purposes. The key practical findings of this research related to improved support character-ization for mechanistic design of concrete pavements are sum-marized below.
Adequate Characterization of Subgrade Soil
The elastic response of real soils ties somewhere between the two extremes of the dense liquid and elastic solid idealizations. Unbound fine-grained and granular materials with relatively low shear strength are much closer to the dense liquid end of the spectrum than to the elastic solid end. Stabilized materials be-have much more like elastic layers than like a dense liquid foundation.
The dense liquid model is preferred for subgrade characteriza-tion in mechanistic concrete pavement design primarily because it more realistically represents the behavior of natural soil sub-grades or granular bases than does the elastic solid model. For example, if a load were placed at the edge of slab with no physical load transfer (e.g., no dowels or aggregate interlock) and an unstabilized foundation, the loaded slab would deflect and the unloaded slab would not deflect. This is the response the dense liquid model would predict. The elastic solid model, on the other hand, would predict equal deflections on both sides of the joint, even though the shear stress produced in the founda-tion may be substantially higher than the shear strength of the foundation material. Because concrete slab responses at edges and comers are considered critical for design purposes, the dense liquid model is considered more appropriate.
This research has shown that the elastic k-value, as detemiined at the Arlington and AASHO Road Tests through repetitive plate load testing on the subgrade, produces a support k-value that
when used in an appropriate 3-D finite element model of the pavement, agrees well with strains measured under full-scale field loading conditions. Results from FWD or vibratory deflec-tion testing on top of the slab and backcalculation of the k-value also produces an elastic k-value, after an appropriate reduction to estimate a static test value.
Rate of loading was found to have a major effect on the k-value. In analysis of the AASHO Road Test strain data, a k-value of about 80 psi/in. (22 kPa/mm] was found to achieve the best match between strains computed by the 3-D finite ele-ment model and the strains measured in the field under creep speed loading. Tifis k-value is close to the inean elastic k-value measured in plate load tests at the site. At speeds approaching 60 mph [97 kin/hr], an elastic k-value of over 300 psi/in. [81 kPa/mm] was required to match the measured strains. Mecha-nistic design could consider rate of loading (i.e., traffic speed) as a design input. This requires further research into the relation-ship of loading rate to stiffness for different types of soils. Fur-thermore, mechanistic performance models must be developed using performance data from pavements for which the observed performance (e.g., cracking) is related to responses (e.g., stresses) calculated using k-values appropriate for the rate of loading which the pavements experienced. In contrast, current performance models like the AASHTO model which were de-rived with respect to the static k-value of the pavements tested require a static k-value as a design input.
Foundation support characterization has in the past been sim-plified by representing the foundation as a uniform subgrade of infinite depth. However, more realistic situations that should be considered in mechanistic design are (a) the possibility that a thick layer of select material may be placed over the natural subgrade, or (b) the possibility that a stiff layer (e.g., bedrock or hardpan clay) may be present at some relatively shallow depth below the natural subgrade surface. This research has addressed these issues and has produced procedures to adjust subgrade k-values for fill layers above the subgrade and shallow rigid layers below the subgrade.
Characterization of the Base Layer
The base layer should be characterized as a structural elastic layer along with the concrete slab. The common practice of characterizing the base layer as an enhancement to the subgrade (a so-called "composite" k-value) yields computed slab re-sponses that are unrealistic.
The degree of friction between the base and slab is important to the magnitude of stress experienced in the slab. Studies indi-cate that a range of friction coefficient values can be identified for a specific base type or interface treatment. The analyses conducted with 3DPAVE for this study resulted in development of a stress model that permits calculation of the stress that will occur in a concrete slab under loading as a function of climate inputs and subgrade, base, and slab inputs, including the coeffi-cient of friction between the slab and base.
Effect of Subgrade and Base Stiffness With and Without Temperature Gradient
When no temperature gradient exists through a slab, an in-crease in subgrade k-value or base modulus will always decrease

41
tensile stress in the slab under loading, suggesting a thinner slab
is needed. The effect of subgrade and base stiffness is very
different when a temperature differential exists through the slab.
Results of 3-D finite element analyses show that very stiff foun-
dations may actualy increase combined load and temperature
curl stresses, resulting in thicker slab requirements or a reduction
in the joint spacing. Mechanistic design can fully consider these
complex tradeoffs between foundation stiffness, slab thickness,
and joint spacing to provide a more adequately designed
pavement.
Seasonal Variation in Subgrade Support
Seasonal variation in subgrade support is known to exist with
many climates and soils. Mechanistic design can accomodate
the computation of slab stresses over different seasons through-
out the year based upon changes in the subgrade k-value. Proce-
dures are provideo to estimate a k-value for a given fine-grained
soil classification based on its degree of saturation. Thus, if the
approximate degree of saturation can be estimated seasonally,
the elastic k-value can be estimated and used for design.
Loss of Support from Erosion and Slab Curl/Warp
Loss of support at joints can be caused by erosion of the base
or subgrade resulting in a void beneath the comer. Loss of
support can also be caused from (1) a negative temperature
differential through the slab, (2) construction-related built-in
temperature curling, or (3) moisture shrinkage of the surface—
all causing the comers and edges to lift up. Loss of support
from any of these causes results in increased tensile slab stress
at the top of the slab.
The loss of support and increased stresses caused from tem-
perature and perhaps from moisture gradients can be calculated
using 3-D finite element models. They can be reasonably in-
cluded in a mechanistic design procedure as discussed in the
next section.
The loss of support caused by erosion of the base or subgrade
material from pumping action is far more difficult to consider.
It is fairly easy to model a void beneath a slab comer using
finite element analysis. It is very difficult, however, to estimate
the progression of loss of support that will occur in the field for
a pavement with given design features in a given climate.. subject
to given traffic loadings. Research has linked erodibility of
treated base materials to the strength and permeability of the
materials. Many concrete pavements today are being constructed
over permeable bases, used for the express reason to prevent
erosion and loss of support. Further research is needed to develop
improved predictive models for erosion of various base types
and properties. When known, this loss of support from erosion
can be considered in mechanistic design through year-by-year
computation of stresses.
Critical Loading Position
Analyses have shown that two different loading positions may
produce critical tensile stresses in a jointed concrete pavement:
the midslab position and the joint positions. This is not a new
finding as there have been some well-documented research ef-
forts that have shown that both of these locations could be a
critical condition under various design and climatic conditions.
The midslab load position has been used in concrete pavement
design for many years. The wheel is positioned near the edge
of the traffic lane and the critical stress occurs at the bottom of
the slab. Cracks initiate at the bottom of the slab. This stress is
increased or decreased depending on the thermal gradient. This
stress leads to transverse cracking from fatigue damage. This
damage can be greatly reduced through the use of thicker slabs,
higher-strength concrete, shorter joint spacing, and treated bases
with high friction with the slab. Widened slabs and tied concrete
shoulders also reduce this stress.
The joint load position has not been used in concrete pavement
design in the past. When the axle load is near the joint and
comer of the slab, tensile stresses occur in the top of the slab.
These stresses are greatly increased with nighttime temperature
gradients, as well as from construction curl and moisture shrink-
age warping. These stresses are greatly reduced when the joints
are dow~lled; practically no comer breaks have been found in
pavements with adequately dowelledjoints. If thejoints contain
undersized dowels, they may become loose in their sockets and
become ineffective.
The joint loading position may be critical for undowelled
pavements, especially in dryer climates. Some undowelled pave-
ments that had significant permanent construction curling have
experienced many broken comers, diagonal cracks, and even
transverse cracks after just a few months or years. Situations in
which the joint load position may become critical may be easily
identified and modelled using mechanistic design procedures.
Joint Faulting Check
Joint faulting is the result of erosion of some underlying layer
beneath the slab and reduction in load transfer. Prediction mod-
els have been developed by various researchers that directly link
joint faulting with design features, climate, materials, and traffic.
Although these models need improvement, especially the incor-
poration of more mechanistic concepts and variables, they repre-
sent an initial attempt at providing improved design. They can
be used to directly check a given design for faulting. If the
predicted faulting is excessive, the joint design and other features
can be modified so that faulting is controlled. Procedures to
accomplish that design check are provided herein and improved
procedures can be developed for mechanistic design.
Effect of Subgrade/Base Stiffness on Joint Spacing
Field performance has shown that joint spacing has a consider-
able effect on the development of transverse cracking. However,
the stiffness of the base and subgrade are major factors in this
mechanism as well as slab thickness and the particular climate
involved. Complex interactions exist between all of these vari-
ables, which affect tensile stresses in the slab.
Mechanistic design procedures based on 3-D finite element
analyses have the potential to fully consider these interactions
so that the maximum joint spacing can be determined more
rationally than in the past. For example, several design manuals
provide rules of thumb for joint spacing as a function of slab

42
thickness. These rules of thumb do not, however, adequately readily available, along with finite element tools that can com- consider the effects of climate, frictional resistance, and base pute stresses caused by these climatic factors to a much more and subgrade stiffness. accurate degree than in the past. These tools may be used in
Data and computational methods for thermal gradients, mois- mechanistic design to more accurately model the pavement ture gradients and construction curling are becoming more structure under load and climatic conditions.

CHAPTER 4
CONCLUSIONS AND SUGGESTED RESEARCH
43
CONCLUSIONS
The support that the base and embankment or roadbed sub-grade provide to a concrete pavement was found to have a very significant effect on the performance of the pavement. The following key conclusions are based upon the results obtained from this research. Further information related to each conclu-sion can be found in the previous chapters and in the.appendixes to this report.
Determination of k-Value
The k-value that is most appropriate for design is defined as that measured on the finished roadbed subgrade (or constructed embankment) upon which the base and slab will eventually be constructed. The concept of a composite "top-of-the-base" k-value is not valid and is not recommended for design. Use of a composite k-value does not accurately represent the effects of the base and subgrade on slab stresses or deflections.
The recommended k-value input to concrete pavement de-sign is the static elastic k-value. The elastic k-value as measured in plate load tests at the AASHO Road Test and Arlington Road Test was found to provide a match between calculated and measured slab strains and deflections. When the elastic k-value was used in the 3DPAVE finite element model, the computed slab stresses were found to match very closely the stresses com-puted from strains. measured at the AASHO Road Test. An elastic k-value can be determined from the results of standard plate load test methods specified by ASTM, AASHTO, or the Corps of Engineers.
Three categories of methods for determining a k-value for use in concrete pavement design are available, with detailed guidelines provided for each.
Correlation methods. The static elastic k-value can be esti-mated using soil classification, moisture level, density, CBR, Hveem R-value, and the Dynamic Cone Penetrometer (DCP). These correlation methods (along with procedures to adjust for embankments of improved materials and underlying stiff layers) are adequate for use in routine design. Design of projects on very unusual subgrades and especially more critical high-traffic-volume projects may require field testing for further verification.
Deflection testing and backcalculation methods. These'meth-ods are suitable for determining k-value for design of overlays of existing pavements, for design of reconstructed pavements
on existing alignments, or for design of similar pavements in the same general location on the same type of subgrade. Backcal-culation represents the most rapid, cost-effective, and reliable method to obtain an adequate sample size of k-values for pave-ment design. An agency may also use backcalculation methods to develop correlations between nondestructive deflection testing results and subgrade types and properties. The k-value obtained from backcalculation, when divided by a factor of two, yields an estimate of the static k-value for design which agrees well with the static k-value estimated from the correlation or plate test methods.
Plate testing methods. The standard ASTM, AASHTO, and Corps of Engineers nonrepetitive and repetitive plate-loading test methods were reviewed in this study, as well as the German plate load test. The American standard test methods are the most direct methods of determining the elastic k-value of the soil or embankment under static loading, but because these tests are very costly, time-consuming, and thus provide a very limited sampling of the project, it is not anticipated that they will be conducted routinely. It is unfortunate that a more rapid and simple plate bearing test method for k-value has not yet been developed. The elastic k-value may be determined using a 30-in.-diameter (762-mm) bearing plate in either a repetitive static plate load test (e.g., AASHTO T 221, ASTM D 1195) or nonre-petitive static plate load test (AASHTO T 222, ASTM D 1196). In a repetitive test, the elastic k-value is determined from the ratio of load to elastic deformation (the recoverable portion of the total deformation measured). In a nonrepetitive test, the load-deformation ratio at a deformation of 0.05 in. (1.25 mm) is considered to represent the elastic k-value.
Many design manuals state that the k-value can be estimated with sufficient accuracy based on soil classification or correla-tions with soil tests because of the relative small effect that it has on slab thickness. Analyses were conducted for a variety of design conditions and the following general results obtained for the error in slab thickness due to an error in k-value estimation.
Percent Error Typical Maximum In k-value Error in Slab Thickness
10 1 percent
25 2.5
50 5
100 10
For example, a measured mean k-value of 250 psi/in. (68 kPa/ nim) is estimated to be 375 psi/in. (102 kPa/mm) in error (50 percent overestimation). The error in required slab thickness is approximately 5 percent (i.e., 7.6 vs 8.0 in. [193 vs 203 rrun]).

44
Thus, the k-value does not need to be estimated with great accuracy, but an error of 50 percent or greater could have a significant effect on slab thickness design.
Practical guidelines were developed for estimating the k-value for situations where the existing subgrade is a very poor soil and an embankment layer of improved soil is placed on top. Guidelines are also provided for increasing an estimated k-value (i.e., determined from correlations) when there is a stiff layer (such as bedrock) close to the surface.
Guidelines are provided for estimation of seasonal k-values on the basis of variation in moisture level and frost depth throughout the year for various soil types.
Improved Support Considerations In AASHTO Guide
Several major deficiencies related to concrete pavement support were found to exist in the current version of the AASHTO design procedure. These deficiencies were addressed in this study and an improved methodology was developed for better consideration of slab support. Key problems and solutions are listed below.
(a) Although the elastic k-value was the main test conducted at the AASHO Road Test, the more conservative "gross" k-value (including both elastic and permanent deformation) was incorporated in the AASHTO concrete pavement design equa-tion. The elastic k-values exceeded the gross k-values at the AASHO Road Test by an average ratio of 1.77. Extensive full-scale slab testing by the Corps of Engineers has found that it is the elastic k-value, not the gross k-value, which matches k-values backcalculated from slab deflection basins under static loading. In this study, 3-D finite element analyses showed that modelling the AASHO Road Test pavements with the elastic k-value pro-duced an excellent match between calculated and measured slab stresses.
Solution: the elastic k-value is recommended as the appro-priate subgrade input parameter for use in concrete pave-ment design.
The k-value incorporated in the AASHTO design equation was the mean gross k-value measured on top of the granular base, not the mean for the subgrade. This is inconsistent with the "composite V adjustment given in the current procedure, which increases the subgrade k to reflect the effect of the base. The concept of a composite, top-of-the-base k-value was judged in this study to be invalid because it does not represent the support that the slab actually receives from the subgrade and base layers, and thus does not accurately predict slab stresses or deflections. This is especially true for stiff treated bases that act more as structural layers in reducing stress in the slab.
Solution: the subgrade k-value is the recommended sup-port input for design. A procedure was developed to consider the effect of the base on slab stress and performance. The base layer was modelled as a structural layer of the pavement structure using the 3-D finite element model. The modulus of elasticity, thickness, and friction coefficient of the base course are important inputs.
The lowest gross k-value that occurred during the spring
on top of the base was incorporated into the AASHTO design model in 1961. The model was not re-derived for a seasonally adjusted k for the AASHO site when a procedure to determine an effective seasonally adjusted k was added to the Guide in 1986.
Solution: The original rigid pavement design equation was modified to incorporate a seasonally adjusted effective elastic k-value that existed on the embankment at the Road Test site.
A loss-of-support adjustment factor, which makes drastic reductions to k for erodible base types, was incorporated in the 1986 Guide. However, substantial loss of support existed for many sections at the AASHO site, which led to increased slab cracking and loss of serviceability. Thus, the performance data and design equation already represent the effect of considerable loss of support. Incorporation of an additional loss-of-support adjustment to k is unnecessary and unwarranted and produces a thicker slab design.
Solution: a loss-of-support adjustment is not recom-mended for the AASHTO design procedure. Erodibility should be directly evaluated in terms of the potential faulting of transverse joints, and the joint design adjusted if necessary to prevent faulting.
Spangler's unprotected comer stress equation was incor-porated in the 1961 extension of the AASHTO model. Critical stresses at the AASHO Road test occurred along the longitudinal slab edge for slabs 6.5. in. (165 nun) and greater, and resulted in transverse fatigue cracks. The stresses in the vicinity of the comer were much lower than those at midslab because the joints were well dowelled. Use of Spangler's comer equation when used with dowelled joints did not model the critical stress and crack initiation location, and thus could not possibly provide accurate indications of the effect of slab support on cracking, especially when thermal curling and moisture warping are considered.
Solution: A stress equation was developed using the 3-D finite element model 3DPAVE to compute critical stresses at the midslab location, including consideration of thermal gradients, base properties (stiffness, thickness, and friction), elastic k-value, slab modulus and strength, and joint spacing. Also, a design check for critical stress is provided for undow-elled pavements at the joint loading position which may be critical in certain conditions such as dry climates.
No procedure is provided in the current AASHTO Guide to design a pavement with undowelled joints. The Mactor only considers tensile stress that controls cracking, not faulting.
Solution: Design checks are provided for undowelled joints for both joint faulting and slab cracking due to joint loading. A check is also provided for dowelled joints to en-sure their adequacy. If the design checks show inadequate joint design, the design may be revised and reevaluated.
Joint spacing (other than that built into the procedure, i.e., 15 ft [4.6 in] at the Road Test) is not considered at all in the design procedure, and it is known that joint spacing has a major effect on slab cracking and faulting.
Solution: Subgrade and base support were found to have a significant effect on allowable joint spacing when stresses from load, temperature, and moisture gradients are consid-ered. Thus, slab support is a very important variable in the new procedure in the selection of a joint spacing to minimize
transverse cracking. The original 1961 model reflects the AASHO site climate
only. The current version does not include any variable that

45
adjusts for a different climate. Thus, other climates that result, for example, in different degrees of slab curling (temperature differential from top to bottom of slab) or warping (moisture gradient) than occurred at the AASHO site cannot be considered. This limitation alone has led to many pavement failures from premature cracking.
Solution: Temperature differentials were incorporated into the slab thickness design procedure: positive for the midslab location (i.e., warmer on top than bottom) and nega-tive for the corner/joint loading position. Appropriate posi-tive and negative temperature differential inputs for a given location may be determined as a function of readily available climatic data. Therefore, the stresses computed to design the pavement should be much more realistic. Moisture gradients are considered through an equivalent temperature gradient for the joint (corner) load position.
Q) The current AASHTO model does not reflect the effect of faulting on performance, because faulting of transverse joints did not occur at the Road Test because of properly sized dowels. As the Road Test results demonstrate, even with extensive ero-sion and pumping, faulting can be controlled through properly sized dowel bars. The J-factor input in the current AASHTO procedure, thought by many engineers to control faulting, has nothing to do with erosion and faulting at the joint. Increasing slab thickness in an attempt to reduce faulting has been shown to be an exercise in futility.
Solution: Joint faulting is predicted for the selected design and then checked against a defined maximum level. If pre-dicted faulting exceeds the allowable faulting, a redesign of the joint load transfer, base, subdrainage, or other features is required, not an increase in slab thickness.
A revised AASHTO rigid pavement design procedure is pro-posed in this study that provides significant improvements to characterizing pavement support. This procedure overcomes many of the limitations of the existing method. Partial verifica-tion of the method was accomplished with performance data from the extended AASHO Road Test pavements and pavements with other designs located in other climatic zones.
Method to Compute Slab Stresses Accurately
A 3-D finite element model for concrete pavements was developed in this study in order to analyze realistically the many complex and interacting factors that influence the support pro-vided to a concrete pavement, including:
subgrade support (subgrade k-value); base thickness, stiffness, and interface friction; slab curling and warping due to temperature and moisture
gradients; * dowel and aggregate interlock load transfer action at
joints; and @ improved support with a widened slab, widened base, or
tied concrete shoulder.
The ABAQUS general-purpose finite element software was used to develop a very powerful and versatile 3-D model for analysis of concrete pavements. The 3DPAVE model easily overcomes many of the inherent limitations of 2-D finite element and Westergaard models. During its development, 3DPAVE was
checked against the existing 2-D finite element models and against available theoretical solutions (e.g., Westergaard's equa-tions). The 3DPAVE consistently outperformed the 2-D model in accuracy over wide ranges of inputs for a variety of problems.
The 3-D model was validated by comparison with mea-sured deflection and strain data for traffic loadings and tempera-ture differentials from the AASHO Road Test, the Arlington Road Test, and the Portland Cement Association's slab experi-ments. In every comparison with measured field data, 3DPAVE's calculated responses were found to be in very good agreement with the measured responses, and significantly closer than those calculated by the 2-D program.
Loss of Support
Loss of support refers to any gap or void that may occur between the base and the slab, or between a stabilized base and the subgrade,, causing increased deflection of the slab surface. There are two basic types of loss of support that a concrete slab exhibits over time.
e Loss of support from erosion of the base and or subgrade from beneath the slab that results in increased deflections and stresses in the slab.
* Temperature curling and moisture warping of the slab that results in increased deflections or stresses in the slab. Permanent construction curling presents a potential for very serious loss of support and early failure of jointed concrete pavements.
Both of these causes of loss of support can have a major impact on slab deflections and stresses, and thus pavement life. Temper-ature curling and moisture warping can be reasonably considered in the design process and thus, to this extent, a significant amount of loss of support is included directly. Further loss of support from erosion of the base/subgrade cannot be predicted at the present time for any given design project. The specification of adequate material properties to limit the potential erosion for given classes of project applications is recommended at this time, and guidelines are provided.
Improved Support Characterization For Mechanistic Design
The elastic k-value produces a support k-value that when used in an appropriate 3-D finite element model of the pavement, agrees well with strains and stresses measured under full-scale field loading conditions. Results from FWD or vibratory deflec-tion testing on top of the slab and backcalculation of the k-value also produces an elastic k-value (after appropriate reduction from dynamic to static loading).
Speed of loading was found to have a major effect on the k-value of the AASHO Road Test soil. At creep speed, a k-value of about 80 psi/in. produced the measured strains (which was close to the mean elastic k-value measured in the field), whereas at speeds approaching 60 mph, an elastic k-value of over 300 psi/in. was required to produce the decreased measured strains. Mechanistic design could consider speed of loading as a design input.
The frictional resistance between the base and the slab is

46
an important factor for the critical stress in the slab. It is desirable to provide high friction between the base and the slab to reduce critical tensile stresses, reduce the potential for erosion, and provide desired cracking through sawed or formed joints. It is believed that in practice, a substantial amount of bonding and high friction exists between the base and the slab and attempts to "break bond" between two layers is rarely successful as deter-mined by coring and backcalculation. Reflection cracking prob-lems from the base can be handled through forming joints in the treated base course.
The effect of subgrade and base stiffness on slab stresses is very different when a temperature differential exists through the slab. When no temperature gradient exists through a slab, increased subgrade k-value or base modulus value will always show reduced tensile stress in the slab under loading, and thus design will require a thinner slab. Results shown herein using the 3-D finite element model indicates that very stiff foundations may actually increase combined load and temperature curl stresses resulting in thicker slab requirements. Greatly increased base and subgrade stiffness may not always be beneficial. Under these conditions it may be necessary to shorten the joint spacing to avoid premature transverse cracks in the slab. Mechanistic design using 3-D finite element as a basis can consider these complex tradeoffs to provide a more adequately designed pavement.
Analyses showed that two different loading positions could produce critical tensile stresses for a given pavement: midslab and joint (comer). This is not a new finding as there have been some well-documented research efforts that have shown that both of these locations could be a critical condition under various design and climatic conditions.
The real problem is undowelled or inadequately dowelled pavements. Some undowelled pavements that had substantial permanent construction curling have experienced many broken comers, diagonal cracks, and even transverse cracks after just a few months or years. This is a critical load position that can be very well modelled and the stresses checked using mechanistic design procedures.
Field performance has shown that joint spacing has a very large effect on the development of transverse cracking. The stiffness of the base and subgrade (and their bonding situation) are major factors in this mechanism as well as slab thickness and the particular climate involved. Complex interactions exist between all of these variables in affecting tensile stresses in the slab and mechanistic design that utilizes 3-D finite element mod-els has the potential to consider these interactions so that the joint spacing for projects can be determined more rationally than in the past.
Data and computational methods for thermal gradients,
moisture gradients, and construction curling are becoming more readily available along with the finite element software to predict the resulting stresses to a much more accurate degree and to then use them to produce a more reliable and cost-effective pavement design. These can all be used in mechanistic design to more accurately model the pavement structure under load and climatic conditions.
SUGGESTED RESEARCH
The following key areas of research are suggested.
Further verification of the elastic k-value test and estima-tion procedures in the field is needed. This would include the evaluation of all three approaches to estimating the elastic k-value at specific project sites: correlations with soil properties and tests, backcalculation, and plate bearing tests. A field and analytical study is needed to verify that these procedures will provide approximately the same results.
The prediction of erosion and subsequent loss of support beneath concrete pavements is an area requiring additional re-search. The study should first concentrate on developing simple test procedures to characterize the degree of erodibility of vari-ous materials. Second, analytical methods (finite element) of modelling loss of support should be developed. Third, methods should be developed for prediction of loss of support over a pavement's life.
Development of a rapid method of measuring the bearing capacity of subgrades is needed. This study could concentrate on the development of a portable, hand-held device and/or a static loading version of a Falling Weight Deflectometer. In theory, this device should be relatively easy to manufacture since only the maximum deflection in the center of the plate is needed along with the weight applied. The resulting dynamic bearing value could be correlated with the standard elastic k-value measured with a large 30-in. (760-mm) diameter plate.
Further verification of the friction coefficients is needed. The values recommended in this study are based on those deter-mined through pushing a slab over a base course, not a slab and base course under wheel load and thermal gradient. The main concern is determining the appropriate friction for design of different bases and interfaces that would exist over a pavement's life cycle.
Further verification of the revised AASHTO rigid pave-ment design model is needed. This could be accomplished using the Long-Term Pavement Performance database. Partial verifica-tion was accomplished under this study using the extended AASHO sections and the FHWA RPPR database. However, more verification is needed and the LTPP database includes most of the required information. .

REFERENCES
47
WINKLER, E., Die Hehre von der Elastizitat und Festigkeit (The Theory of Elasticity and Stiffness), H. Dominicus, Prague (1867). HERTZ, H., 'tber das Gleichgewicht schwimmender elas-tischer Platten," (On the Equilibrium of Floating Elastic Plates), Wiedemann's Annalen der Physik und Chemie, Vol. 22 (1884). F6PPL, A., Technische Mechanik, Vol. 5 (1907). KOCH, J.J., "Berekening van vlakke platen, ondersteund in de hoekpunten van een willekeurig rooster," De Ingenieur, No. 6 (1925). SCHLEICHER, F., "10ber Kreisplatten auf elastischer Unter-lage," Festschrift Sur Hundertjahrfeier der. Technischen Hochschule Karisrube (1925). WESTERGAARD, H.M., "Computation of Stresses in Concrete Roads," Proceedings, Highway Research Board (1925). Also published as "Stresses in Concrete Pavements Com-puted by Theoretical Analysis," Public Roads, Vol. 7, No. 2(1926). SELVADURAi, A.P.S., Elastic Analysis of Soil-Foundation Interaction, Developments in Geotechnical Engineering, Vol. 17, Elsevier Scientific Publishing Company, the Neth-erlands (1979). PECK, R.B., HANSON, W.E., and THORNBURN, T.H., Foun-dation Engineering, 2nd edition, John Wiley and Sons, New York (1974). WESTERGAARD, H.M., "Theory of Stresses in Road Slabs," Proceedings, Fourth Annual Meeting of the Highway Re-search Board (1925). TELLER, L.W. and SUTHERLAND, E.C., "The Structural De-sign of Concrete Pavements, Part 1, A Description of the Investigation," Public Roads, Vol. 16, No. 8 (1935). TELLER, L.W. and SUTHERLAND, E.C., "The Structural De-sign of Concrete Pavements, Part 2, Observed Effects of Variations in Temperature and Moisture on the Size, Shape and Stress Resistance of Concrete Pavement Slabs," Public Roads, Vol. 16, No. 9 (1935). TELLER, L.W. and SUTHERLAND, E.C., "The Structural De-sign of Concrete Pavements, Part 3, A Study of Concrete Pavement Cross Sections," Public Roads, Vol. 16, No. 10 (1935). TELLER, L.W. and SUTHERLAND, E.C., "The Structural De-sign of Concrete Pavements, Part 4, A Study of the Struc-tural Action of Several Types of Transverse and Longitudi-nal Joint Designs," Public Roads, Vol. 17, Nos. 7 and 8 (1936). TELLER, L.W. and SUTHERLAND, E.C., "The Structural De-sign of Concrete Pavements, Part 5, An Experimental Study of the Westergaard Analysis of Stress Conditions in Con-crete Pavements of Uniform Thickness," Public Roads, Vol. 23, No. 8 (1943). KELLEY, E.F., "Application of the Results of Research to the Structural Design of Concrete Pavements," Public Roads, Vol. 20, No. 5 (1939). U.S. ARMY CORPS OF ENGINEERS, "Wright Field Slab
Tests," Ohio River Division, Cincinnati Testing Labora-tories, Cincinnati, OH (1942). U.S. ARMY CORPS OF ENGINEERS, "Report on Special Field Bearing Tests on Natural Subgrade and Prepared Subbase Using Different Size Bearing Plates," Ohio River Division, Cincinnati Testing Laboratories (1943). SALE, J.P. and HUTCHINSON, R. L., "Development of Rigid Pavement Design Criteria for Military Airfields," Journal of the Air Transport Division, Proceedings of the American Society of Civil Engineers, Vol. 85, No. AT3 (July 1959). PHILLIPPE, R. R., "Field Bearing Tests Applied to Pavement Design," Symposium on Load Tests of Bearing Capacity of Soils, American Society for Testing and Materials, Special Technical Publication No. 79 (1947). U.S. ARMY CORPS OF ENGINEERS, "Rigid Plate-Bearing Test Investigation," Waterways Experiment Station, Vicksburg, MS (1945). U.S. ARMY CORPS OF ENGINEERS, "Determination of High Values of the Subgrade Modulus, k, from the Plate Bearing Test," Rigid Pavement Laboratory, Ohio River Division, Mariemont, OH (1953). SALE, J.P., "Rigid Pavement Design for Airfields," Proceed-ings, First International Conference on Concrete Pavement Design, Purdue University, West Lafayette, IN (1977). MIDDLEBROOKS, T.A. and BERTRAM, G. E., "Soil Tests for Design of Runway Pavements," Proceedings, Highway Re-search Board (1942). U.S. DEPARTMENT OF THE ARMY, Technical Manual TM 5-824-3. U.S. DEPARTMENT OF THE ARMY, "Rigid Airfield Pave-ments," Engineering and Design Manual EM 1110-45-303, Office of the Chief of Engineers (1958). PORTLAND CEMENT ASSOCIATION, "Thickness Design for Concrete Pavement" (1966). PACKARD, R.G., "Design of Concrete Airport Pavement," Portland Cement Assoc. Engineering Bulletin (1973). CAMPEN, W.H. and SMITH, J.R., "Use of Load Tests in the Design of Flexible Pavements," Symposium on Load Tests of Bearing Capacity of Soils, American Society for Testing and Materials, ASTM Special Publication No. 79 (1947). HITTLE, J.E. and W.H. GOETZ, "Factors Influencing the Load-Carrying Capacity of Base-Subgrade Combinations," Proceedings, Highway Research Board (1946). MCLEOD, N.W., "A Canadian Investigation of Load Testing Applied to Pavement Design," Symposium on Load Tests of Bearing Capacity of Soils, American Society for Testing and Materials, ASTM Special Technical Publication No. 79 (1947). AHLVIN, R.G., "Origin of Developments for Structural De-sign of Pavements," Technical Report GL-91-26, U.S. Army Corps of Engineers, Waterways Experiment Station, Vicks-burg, MS (1991). HIGHWAY RESEARCH BOARD, "The AASHO Road Test, Re-port 5, Pavement Research," Special Report 61E (1962). LANGSNER, G., HUFF, T.S., and LIDDLE, W.J., "Use of Road Test Findings by AASHO Design Committee," from "The

48
AASHO Road Test, Proceedings of a Conference Held May 16-18, 1962, St. Louis, MO," HRB Special Report No. 73 (1962). U.S. ARMY CORPS OF ENGINEERS, "Results of Modulus of Subgrade Reaction Determination at the AASHO Road Test Site by Means of Pavement Volumetric Displacement Test," Ohio River Division Laboratories (April 1962). VEsic, A.S. and SAXENA, S.K., "Analysis of Structural Be-havior of AASHO Road Test Rigid Pavements, NCHRP Report No. 97 (1966). HUDSON, W.R., "Comparison of Concrete Pavement Load-Stresses at AASHO Road Test with Previous Work," High-way Research Record No. 42 (1963). CHILDS, L.D. and KAPERNICK, JW., "Tests of Concrete Pavements on Crushed Stoned Subbases," Proceedings of the American Society of Civil Engineers, Vol. 89, No. HW-1 (1963). CHILDS, L.D., "Cement-Treated Subbases for Concrete Pavements," Highway Research Record No. 189 (1967). NUSSBAUM, P.J. and LARSEN, T.J., "Load-Deflection Char-acteristics of Soil-Cement Pavements," Highway Research Record No. 86 (1965). AMERICAN ASSOCIATION OF STATE HIGHWAY AND T'RANS-PORTATION OFFICIALS, "Interim Guide for Design of Pave-ment Structures," Washington, D. C. (1972). DARTER, M.I., "Design of Zero-Maintenance Plain Jointed Concrete Pavement, Volume I -Development of Design Procedures," University of Illinois at Urbana-Champaign, Report No. FHWA-RD-77-111 (1977). DARTER, M.I. and BARFNBERG, E.J., "Design of Zero-Main-tenance Plain Jointed Concrete Pavement, Volume 2-De-sign Manual," University of Illinois at Urbana-Champaign, Report No. FHWA-RD-77-112 (1977). THOMPSON, M.R. and ROBNETT, Q.L., "Resilient Properties of Subgrade Soils," Illinois Cooperative Highway Research Program, Report No. UILU-ENG-76-2009, University of Il-linois and Illinois Department of Transportation (1976). AMERICAN ASSOCIATION OF STATE HIGHWAY AND TRANS-PORTATION OFFICIALS, Guidefor Design ofPavement Struc-tures, Washington, D.C., (1986). HOFFMAN, M.S. and THOMPSON, MR., "Mechanistic Inter-pretation of Nondestructive Pavement Testing Deflections," Transportation Engineering Series No. 32, Illinois Coopera-tive Highway and Transportation Research Series No. 190, University of Illinois at Urbana-Champaign (1981). ERES CONSULTANTS, INC., "Nondestructive Structural Evaluation of Airfield Pavements," prepared for U.S. Army Corps of Engineers Waterways Experiment Station, Vicks-burg, MS (1982). FoXWORTHY, P.T., "Concepts for the Development of a Nondestructive Testing and Evaluation System for Rigid Airfield Pavements," Ph.D. thesis, University of Illinois at Urbana-Champaign (1985). BARENBERG, E.J. and PETROS, K.A., "Evaluation of Con-crete Pavements Using NDT Results," Illinois Highway Re-search Project IHR-512, University of Illinois and Illinois Department of Transportation, Report No. UILU-ENG-9 I - 2006 (1991). IOANNIDES, A.M., "Dimensional Analysis in NDT Rigid Pavement Evaluation," Transportation Engineering Jour-
nal, American Society of Civil Engineers, Vol. 116, No. TEI (1990). IOANNIDEs, A.M., BARENBERG, E.J., and LARY, J.A., "Inter-pretation of Falling Weight Deflectometer Results Using Principles of Dimensional Analysis," Proceedings, Fourth International Conference on Concrete Pavement Design and Rehabilitation, Purdue University, West Lafayette, IN (1989). HALL, K.T., "Performance, Evaluation, and Rehabilitation of Asphalt-Overlaid Concrete Pavements," Ph.D. thesis, University of Illinois at Urbana-Champaign (1991). AMERICAN ASSOCIATION OF STATE HiLaiWAY ANi) TkANS-PORTATION OFFICIALS, "Guide for Design of Pavement Structures," Washington, D. C. (1993). CROVETTI, J.A., "Evaluation of Jointed Concrete Pavement Systems Incorporating Open-Graded Subbases," Ph.D. the-sis, University of Illinois at Urbana-Champaign (1994). POTTER, C.J. and DiRKs, K.L., "Pavement Evaluation Using the Road RaterTm Deflection Dish," Final Report, Project MLR-89-2, Iowa Department of Transportation (1989). BARENBERG, E.J. and RATTERREE, B.L., "Fully Bonded Concrete Overlay for an Airport Runway," Proceedings, ASCE International Air Transportation Conference, New Orleans, LA (1979). SMITH, K.D., PESHKIN, D.G., DARTER, M.I., MUELLER, A.L., and CARPENTER, S.H., "Performance of Jointed Con-crete Pavements," Phase 1, Volume IV-Appendix A, Re-port No. FHWA-RD-89-139 (1990). SIMPSON, A.L., ET AL., "Early Analysis of LTPP General Pavement Studies Data," Volume 3-Sensitivity Analyses for Selected Pavement Distresses, Strategic Highway Re-search Program (1993). KOGURE, K. and SAKAI, T., "Measurements of Deflection and Strain of Airfield Rigid Pavement for Deterioration and Evaluation," Proceedings, International Conference on Bearing Capacity of Roads and Airfields, Minneapolis, MN (July 1994). CRAWFORD, MURPHY, and TILLY, ET AL., "Evaluation of Airfield Pavements at Dulles International Airport," report for Federal Aviation Administration (1984). BECKEMEYER, C.B. and DARTER, M. I., "Utah 1-15 Pave-ment Evaluation," Final Report for Utah DOT, ERES Con-sultants, Inc. (1993). POBLETE, M., SALSILLI, R., VALENZUELA, R., BULL, A., and SPRATZ, P., "Field Evaluation of Thermal Deformations in Undowelled PCC Pavement Slabs," Transportation Re-search Record No. 1207 (1989). POBLETE, M., GARCIA, A., DAVID, J., CEZA, P., and ESPINOSA, R., "Moisture Effects on the Behaviour of PCC Pavements," Proceedings, Second International Workshop on the Design and the Evaluation of Concrete Pavements, Siguenza, Spain (October 1990). PERMANENT INTERNATIONAL ASSOCIATION OF ROAD CON-GRESSES, "Combatting Concrete Pavement Pumping," Tech-nical Committee on Concrete Roads ..... EiSENMANN, J. and LEYKAUF, G., "Effect of Paving Temper-atures on Pavement Performance," Proceedings, Second In-ternational Workshop on the Design and the Evaluation of Concrete Pavements, Siguenza, Spain (October 1990). ZACHLEHNER, A. "Beanspruchung von Betonfahrbahnen durch Einfliise dutch Hydration und Witterung," (Concrete

49
Pavement Stress due to the Influence of Hydration and Cli-matic Conditions), Ph.D. thesis, Technical University of Munich, Germany (1989).
66. ZACHLEHNER, A., "Restraint Stresses in Young Concrete Pavements," Proceedings, Sixth International Symposium on Concrete Roads, Madrid, Spain (October 1990).
67 ARMAGHANI, J.M., LARSEN, T.J., and SMITH, L.L., "Tem-perature Response of Concrete Pavements," Transportation Research Record No. 1121 (1987).
68. JANSSEN, D.J., "Moisture in Portland Cement Concrete," Transportation Research Record No. 1121 (1987).
DARTER, M.I., BECKER, J.M., SNYDER, M.B., and SMITH,
R.E., "Portland Cement Concrete Pavements Evaluation System—COPES," NCHRP Report 277, Transportation Research Board (1985). HUDSON, W.R. and SCRIVNER, F.H., "AASHO Road Test Principal Relationships —Performance with Stress, Rigid Pavements," from "The AASHO Road Test, Proceedings of a Conference Held May 16-18, 1962, St. Louis, MO," HRB Special Report No. 73 (1962).

50
APPENDIXES A THROUGH H
Unpublished Material
Appendixes A through H contained in the research agency's final report are not published herein. For a limited time, copies of that report, entitled, "Support Under Concrete Pavements—Appendixes," will be available on a loan basis or for puchase ($30.00) on request to NCHRP, Transportation Research Board, Box 289, Washington, D.C., 20055. The available appendixes are titled as follows:
APPENDIX A: Development of k-Value Concepts and Methods APPENDIX B: Methods for Estimating k-Value
APPENDIX C: Loss-of-Support Concepts and Methods APPENDIX D: Three-Dimensional Finite Element Model De-
velopment and Validation APPENDIX E: Improved Consideration of Support in Current
AASHTO Methodology APPENDIX F: Proposed Revision to AASHTO Guide, Part 11,
Section 3.2, "Rigid Pavement Design," and Sec- tion 5.3, "Rigid Pavement Joint Design"
APPENDIX G: Rigid Pavement Design Example (Proposed Re- vision to AASHTO Guide Appendix I)
APPENDIX H: Development of Effective Roadbed Soil k-Value (Proposed Revision to AASHTO Guide Appen- dix HH)

THE TRANSPORTATION RESEARCH BOARD is a unit of the National Research Coun-cil, which serves the National Academy of Sciences and the National Academy of Engineering. It evolved in 1974 from the Highway Research Board which was established in 1920. The TRB incorporates all former HRB activities and also performs additional functions under a broader scope involving all modes of transportation and the interactions of transportation with society. The Board's purpose is to stimulate research concerning the nature and performance of transportation systems, to disseminate information that the research produces, and to encourage the application of appropriate research findings. The Board's program is carried out by more than 270 committees, task forces, and panels composed of more than 3,300 administrators, engineers, social scientists, attorneys, educators, and others concerned with transportation; they serve without compensation. The program is supported by state transportation and highway departments, the modal administrations of the U.S. Department of Transportation, the Association of American Railroads, the National Highway Traffic Safety Adrrdnistration, and other organizations and individuals interested in the development of transportation.
The National Academy of Sciences is a private, nonprofit, self-perpetuating society of distin-guished scholars engaged in scientific and.engineering research, dedicated to the furtherance of science and technology and to their use for the general welfare. Upon the authority of the charter granted to it by the Congress in 1863, the Academy has a mandate that requires it'to advise the federal government on scientific and technical matters. Dr. Bruce M. Alberts is president of the National Academy of Sciences.
The National Academy of Engineering was established in 1964, under the charter of the National Academy of Sciences, as a parallel organization of outstanding engineers. It is autonomous in its administration and in the selection of its members, sharing with the National Academy of Sciences the responsibility for advising the federal government. The National Academy of Engineering also sponsors engineering programs aimed at meeting national needs, encourages education and research and recognizes the superior achievements of engineers. Dr. Robert M. White is president of the National Academy of Engineering.
The Institute of Medicine was established in 1970 b y the National Academy of Sciences to secure the services of eminent members of appropriate professions in the examination of policy matters pertaining to the health of the public. The Institute acts under the responsibility given to the National Academy of Sciences by its congressional charter to be an adviser to the federal government and, upon its own initiative, to identify issues of medical care, research, and education. Dr. Kenneth I. Shine is president of the Institute of Medicine.
The National Research Council was organized by the National Academy of Sciences in 1916 to associate the broad community of science and technology with the Academy's purpose of furthering knowledge and advising the federal government. Functioning in accordance with general policies determined by the Academy, the Council has become the principal operating agency of both the National Academy of Sciences and the National Academy of Engineering in providing services to the government, the public, and the scientific and engineering communities. The Council ' is administered jointly by -both Academies and the Institute of Medicine. Dr. Bruce M. Alberts and Dr. Robert M. White are chairman and vice chairman, respectively, of the National Research Council.
