support for sales figures analyses with vipas … for sales figures... · support for sales figures...
TRANSCRIPT

SUPPORT FOR SALES FIGURES ANALYSES WITH VIPAS
Berthold Kerl - db Versicherung
1 . The - company-
2.
db Life Insurance was founded 1989 as a subsidiary of Deutsche Bank, Germany's largest banking establishment. It employs over 300 people. The headquarter is located in Wiesbaden, Germany.
wi th innovati ve life insurance products it was growing rapidly. Right from the beginning our company was amongst the TOP 20 in selling new business.
Although we sell regular types of life insurances our particular know how is focused on 'one-shop-shopping' which in our case is the connection of bank and insurance business services.
For that reason db Life Insurance is an important partner of the Deutsche Bank group in questions of old-ageprotection and family provision.
The marketing network of db Life Insurance consists of four main distributive channels (see diagram 1). Of course, the Deutsche Bank branches are the most important. But our products are also selled through other subsidiaries of Deutsche Bank, through competent insurance brokers as well as employees of db Life Insurance.
Why we developed VIPAS
Our managers allover the branches of Deutsche Bank but also in the headquarter need actual information to lead our business successfully. It is very important for them to get a fast overview of the current situation and to recognize an out-of-line situation as early as possible. To find out, why a particular situation has occured they have to go down to the basic facts: to a region, a devision, a product or even an individual business transaction.
At the beginning they received their information in form of paper reports either produced periodically or after an ad-hoc request.
Very often it took days and was a time consuming job to get the information really needed out of a number of listings.
So we started to develop VIPAS in order to enable managers of any authorization level and location to get the information they needed by themselves, directly.
246
3. Requirement Definition of VIPAS
First of all we had to get an idea what kind of data and what kind of functions were required. Therefore, we carried out an analyses by asking a representative sample of managers.
From these interviews we gained the following information:
>
>
>
There was a number of well established reports. Most managers wanted to continue using them as they were familiar with their contents and layouts. But they wanted to decide themselves - what particular report and at what time this report - should be drawn up.
There should be no time lag between requesting the information and receiving it.
Many managers were not familiar with computers. They wanted to get there information without studying a reference book or going through training programs. other managers or their staff were already experienced in using retrieval techniques.
> Our Data Processing Departement had to deal with a large number of ad-hoc requests. In addi tion to time consuming discussions with the requesting departement the realisation took a lot of capacity. with the new system the user should be able to obtain almost any information of any aspect necessary for his particular business, directly by himself.
Based on the results of our analyses we defined five main requirements for a future system.
1. Easy to use for all types of users
2. Navigational aids for stepwise selection through several levels of aggregation providing information according to individual preferences and requirements
3. Automatical gathering and centralizing of relevant / data from different sources
4. Access from every branch office and recognition of different levels of access authorities
5. Easy to maintain and easy to adapt
247
I,.

3. Architecture of VIPAS
3.1 Overview
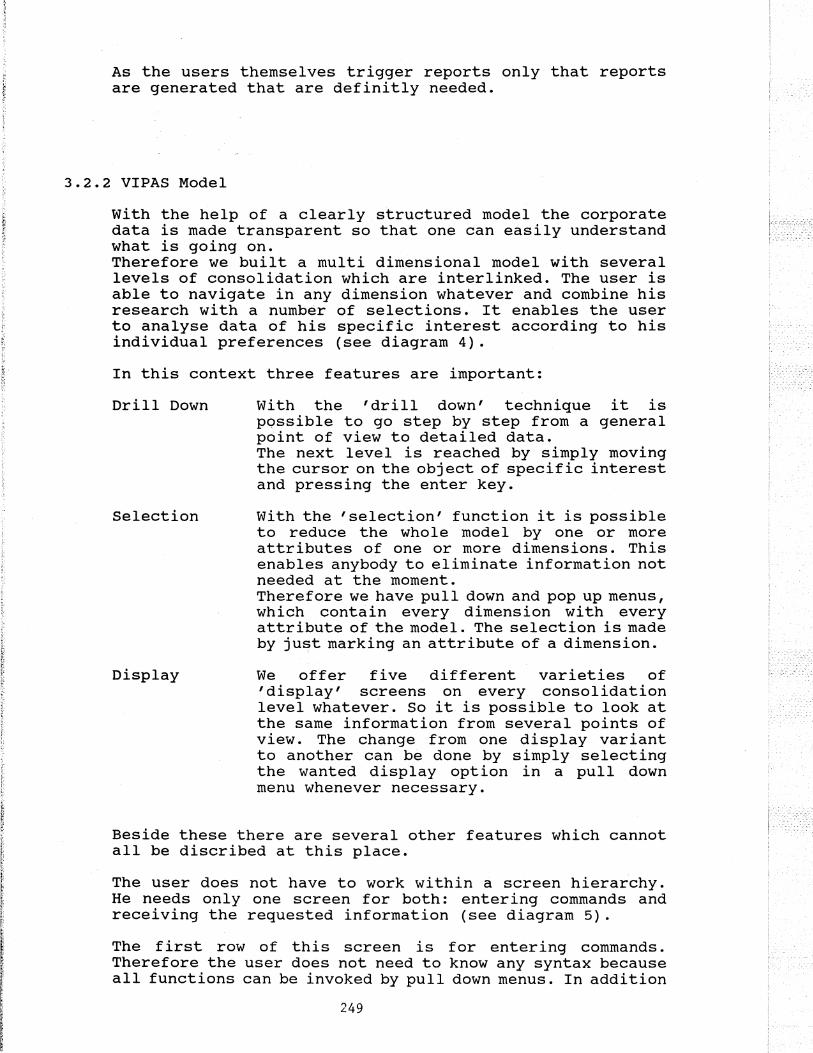
To allow access from branches allover Germany the relevant data has. to be gathered from the corporate application systems of -db Life Insurance and transfered to the Deutsche Bank mainframe.
Diagram 2 gives an overview of the main data sources and access facilities for drawing up information by VIPAS.
The basic application systems of db Leben are:
VVS: Insurance Administration System
SAP: Accounting Systems
SGM: Document Image Processing Facility
ASF: Correspondence Generating System
Unfortunately, they are not integrated and so data integrity cannot be guaranteed.
For giving VIPAS data a unique structure and centralize it the relevant data from above-mentioned systems is collected and validated by copy management.
We designed the logical data structure with the help of a case tool according to the entity relationship method. This guarantees transparency and keeps it easy to maintain.
System control tables which are maintained by the system administrator enable us easiliy either to adapt changes or include additional data without programming.
According to the different types of users with their particular needs and preferences we offer three different access facilities for several purposes.
We call them Report catalogue, VIPAS Model and ad-hoc Reporting. They are presented unger the VIPAS User Interface which was developed with SAS/AF software.
3.2 Access Options
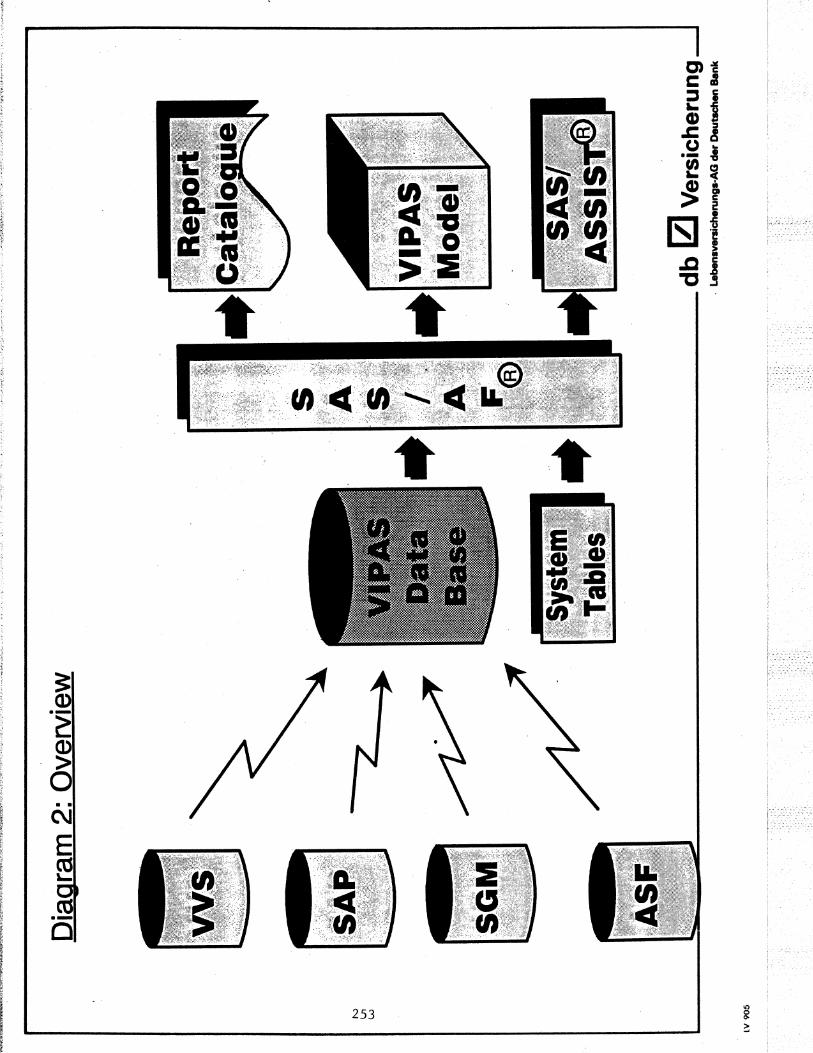
3.2.1 Report Catalogue
The Report Catalogue contains hierarchically organized reports (see diagram 3). It enables the user to prepare reports with a fixed listing layout. Its contents can easily be varied by entering select-options.
This access option is suitable for drawing up standardized listings of common use.
248
As the users themselves trigger reports only that reports are generated that are definitly needed.
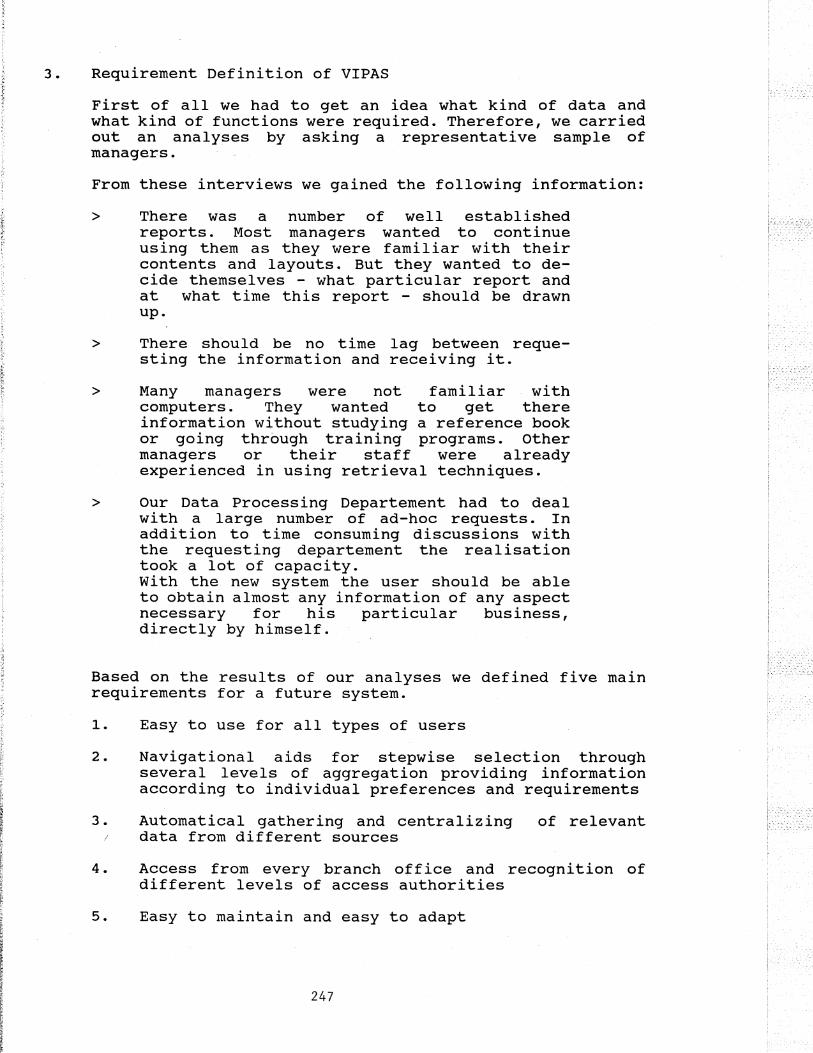
3.2.2 VIPAS Model
with the help of a clearly structured model the corporate data is made transparent so that one can easily understand what is going on. Therefore we built a multi dimensional model with several levels of consolidation which are interlinked. The user is able to navigate in any dimension whatever and combine his research with a number of selections. It enables the user to analyse data of his specific interest according to his individual preferences (see diagram 4).
In this context three features are important:
Drill Down
Selection
Display
with the 'drill down' technique it is possible to go step by step from a general point of view to detailed data. The next level is reached by simply moving the cursor on the object of specific interest and pressing the enter key.
with the 'selection' function it is possible to reduce the whole model by one or more attributes of one or more dimensions. This enables anybody to eliminate information not needed at the moment. Therefore we have pull down and pop up menus, which contain every dimension with every attribute of the model. The selection is made by just marking an attribute of a dimension.
We offer five different varieties of 'display' screens on every consolidation level whatever. So it is possible to look at the same information from several points of view. The change from one display variant to another can be done by simply selecting the wanted display option in a pull down menu whenever necessary.
Beside these there are several other features which cannot all be discribed at this place.
The user does not have to work within a screen hierarchy. He needs only one screen for both: entering commands and receiving the requested information (see diagram 5) .
The first row of this screen is for entering commands. Therefore the user does not need to know any syntax because all functions can be invoked by pull down menus. In addition
249

all functions are described in several help screens.
In the second row appear advices to the user for further proceeding~ and error messages.
The rows 3 to 6 show the user exactly where in the hierarchy he is and what selection he already has made.
The report heading is placed at row 7 to 11. It contains the column heading, the period of time and the choosen comparison option. The time period can be simply changed by overtyping. The change between year-on-year comparison and planning variance is made by just activating the push button.
The remaining rows are reserved for the requested figures of the research. with 'point and click' the user can activate the drill down to reach a lower level.
3.3.3 Ad hoc Reporting
4.
For information which cannot be drawn up either by Report Catalogue or by VIPAS Mqpel we offer under the VIPAS user interface the SAS/ASSIST software.
In contrast to the use of the access options mentioned above the training is absolute~y necessary. Even people who are familiar with SAS/ASSIST have to be introduced into the data structure of VIPAS.
But it is worth the effort. with this powerful tool almost every requested information can be delivered in short time. For example, it is now easy to combine VIPAS data with local data owned by an user. It also takes a lot of load off our programmers in the Data Processing Departement.
Experiences and Further Developments
Due to the SAS System's powerful tools and features for application development, it took us only 4 months to make VIPAS. We started working with VIPAS in January of this year. It was a success right from the beginning. Although many users have had prejudices against a mainframe application they were astonished by its PC-like userfriendlyness. Up to now we have 150 acti ve users and the number is increasing. Amongst them are members of the executive board as well as agents of the branch offices.
250

The speed of information delivery is one of the greatest benefits that VIPAS has brought to our users. It saves a lot of time and improves the efficiency by detecting wether we are on schedule or if there is an out-of-line situation.
We know that the development of a system like VIPAS will never be completed. But besides the routine adaptations we want to improve the system by adding new features.
First of all we intend to integrate grafical features. For that reason we plan to offer VIPAS on the PC and connect it with the mainframe.
We even want to improve the efficiency of analysing by implementing typical EIS features such as Exception Reporting, Traffic Lighting and Forecasting functions.
It was not our intention to develop an EIS and so far it is not a typical EIS. But we are on our way to get one, little by little.
Berthold Kerl db Versicherung Kaiser-Friedrich-Ring 98 6200 Wiesbaden Tel. 0611/176-318
SAS/AF and SAS/ASSIST are registered trademarks of SAS Institute Inc., Cary, NC, USA.
251
~ . -'.
r","

~_~~ .... !t"",:~,,:,~\.~~:~rt':-.r-:;;,:~t1~~~-~_"'~-,-~~~~·~_~,,"':::~~1!~'T'::n"_"'~"_'" ~-:"'~"'-.
Diagram 1: Channels of·Distribution
•
N V1 N
Deutsche Bank Branches
~ ....... ' .. , . J ca ••
, .. J ca •
---_ .. ' ......... .J "'.
Life Insurance
Subsidiaries
, . -- :::-. .
----"'-"" .. J ;..
Insurance Agents
, . __ <a •
• •• J ,-
Insurance
• •• s .,.
'--________________________ db '.I" Versicherung . Lebensversicherunga-AG der Deutschen Bank
til 905_
;: --2:
1.- Q) r I' > l' t: 0 ~ [ }
--I C\I ~
E f, i ~ co I .... !
I co , --
I 0
,
253 It) 0 ... ~
'~!..~"i'A",,/.{~,. ~~~~:'~~~~"!'~:':'-"~.,,":~~ ...... ,<'''·i'~,~c.<-;:'''';SI;. .• f0'''.~~·;:·''·''''_;.i'rt~~~"?'.'::r";;"~~'~":'"":"'·~-:-?l"....-;:m::-)~fY~:-.(?'<~~-:O:,-:-",.~,~,·,,, ..-',', ...... ,?
N V1 ,p.
Diagram 3: Hierarchical Structure in Report Catalogue
Application Reports
• • •
Attributes
Certificate Reports
Distributive Channels
• • •
Devisions
db Life
• • •
Commission Reports
•••
• • •
Branches I I Subsidiaries I I" Agents . Insurance
L----------------_________ db 1/1 Versicherung " Lebenaversichenlnga-AG dar DeUUChen Bank
LV 90S

-~--=--__ C~_= ••. """'Ar.J<c~~=~~=""""'''''\:C''_'7;~-:r~''''Y..''!'~'''}''' •• :" ...... ~~!'.<-::~~};(_.,_ .. __ ,.~~'''' .... ,,''._ •. '''~ •• ,
N VI VI
LV 905
Diagram 4: VIPAS Model
[ --- 1- I I r-l ,- --1---- 1 r- 1 1
•••••••••••• I I' I I I I I I I
••••••••• I . ,---I ---l
•• ------.---~.,---,
..... -~.:1~~:., '.~' •.. :.fr>.t":;~:
Channels of
.'~ .u" -:.::':If<L..'~'JIfl:~7':""< -" ".'~-;-'_ ~'-; .• ·_.M.'>~~'._' .
sum 10000 + 15 %
Distribution I Berlin 4000 + 12 % Mainz 3000 + 17 %
Devisions
Tariffs
Attributes
Hamburg 3000 + 14 %
. ":bbJ~i\?W~i~fn~~:V~fi~H8~T~ sum 10000 + 15 %
PK 6000 + 12 % AM 3000 + 17 % FK 1000 + 14 %
~:obi~~'~jjjfu~tN~.· ..... / sum 10000 + 15%
112 6000 + 12 % 131 4000 + 17 %
sum 10000 + 15 %
Depot 6000 + 12 % ENT 3000 + 17 % RPP 1000 + 14 %
Versicherung . Lebenaversicherunga-AG dar Deutsc:hen Bank
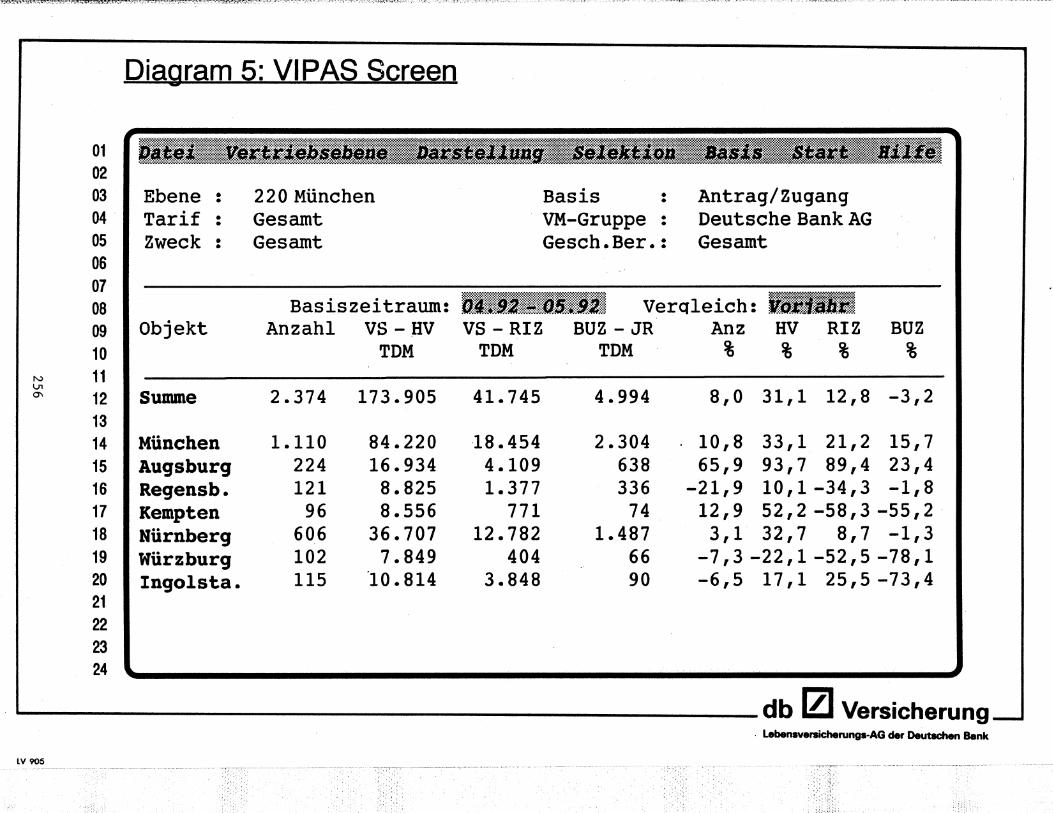
Diagram 5: VIPAS Screen
01 02 03 1 Ebene : 220 Miinchen Basis • Antrag/Zugang • 04 Tarif: Gesamt . VM-Gruppe : Deutsche Bank AG 05 Zweck: Gesamt Gesch.Ber.: Gesamt 06 07
08 I Basiszeitraum: ' .... ~_(lI"I'.li Verqleich: ~ • ,' •• ~ ...... ~ •••••••• " ...... :-"$
09 Objekt Anzahl VS -;HV VS - RIZ BUZ - JR Anz HV RIZ BUZ 10 TDM TDM TDM % % % %
N 11 \J1
12 I Summe 0\ 2.374 173.905 41.745 4.994 8,0 31,1 12,8 -3,2 13 14 MUnchen 1.110 84.220 18.454 2.304 10,8 33,1 21,2 15,7 15 Augsburg 224 16.934 4.109 638 65,9 93,7 89,4 23,4 16 Regensb. 121 8.825 1.377 336 -21,9 10,1-34,3 -1,8 17 Kempten 96 8.556 771 74 12,9 52,2 -58,3 -55,2 18 Hiirnberg 606 36.707 12.782 1.487 3,1 32,7 8,7 -1,3 19 Wiirzburg 102 7.849 404 66 -7,3 -22,1-52,5 -78,1 20 Ingolsta. 115 10.814 3.848 90 -6,5 17,1 25,5 -73,4 21 22 23 24
db IZI Versicherung . lebenaversicherunga-AG dar Deut8Chen Bank
LV 90S