supply chain logistics post recovery landscape€¦ · 1 supply chain logistics post recovery...
TRANSCRIPT

1
Supply Chain LogisticsPost Recovery Landscape
Rotary Club of Saint PaulOctober 12, 2010
Richard Murphy Jr.President & CEOwww.murphywarehouse.comandPast ChairCouncil of Supply Chain Management Professionals (CSCMP)Center For Transportation Studies (CTS), U of MNAmerican Society of Landscape Architects – MN Chapter
Presentation Flow5 Major Topics
Logistics Industry Perspective
Transportation• Trucking, Rail, Ocean, River, Fuel
Global Supply Chains: Impacts on U.S. Logistics
• Land Bridges, Inland ports, Import Warehouses, Plant Locations
Domestic Logistics• Retail / Consumer Demands, Geographic “Mega Regions,” Land
Prices Impacts, Freight Security / Theft, Network Design Changes
Green Logistics
• Green measures, Urban Heat Island, Stormwater, EnergyManagement & Production

2
Why Care About:Supply Chain Logistics…???
Why Care About:Supply Chain Logistics…???
10.1% of Economy!

3
Why Care About:Supply Chain Logistics…???
Perspective
U.S. Logistics costs represent:10.1% of GDP
$4,483 per person
Logistics Cost
$122B is the cost of warehousing in U.S. (CSCMP)
Equates to $407.00 per person in the USA
$680B - cost of trucking in U.S. (CSCMP)
Equates to $2,267.00 per person in the USA
$63B - cost of rail in U.S. (CSCMP)
Equates to $210.00 per person in the USA
Perspective
U.S. Logistics costs represent10.1% of GDP - $4,483 per person
4
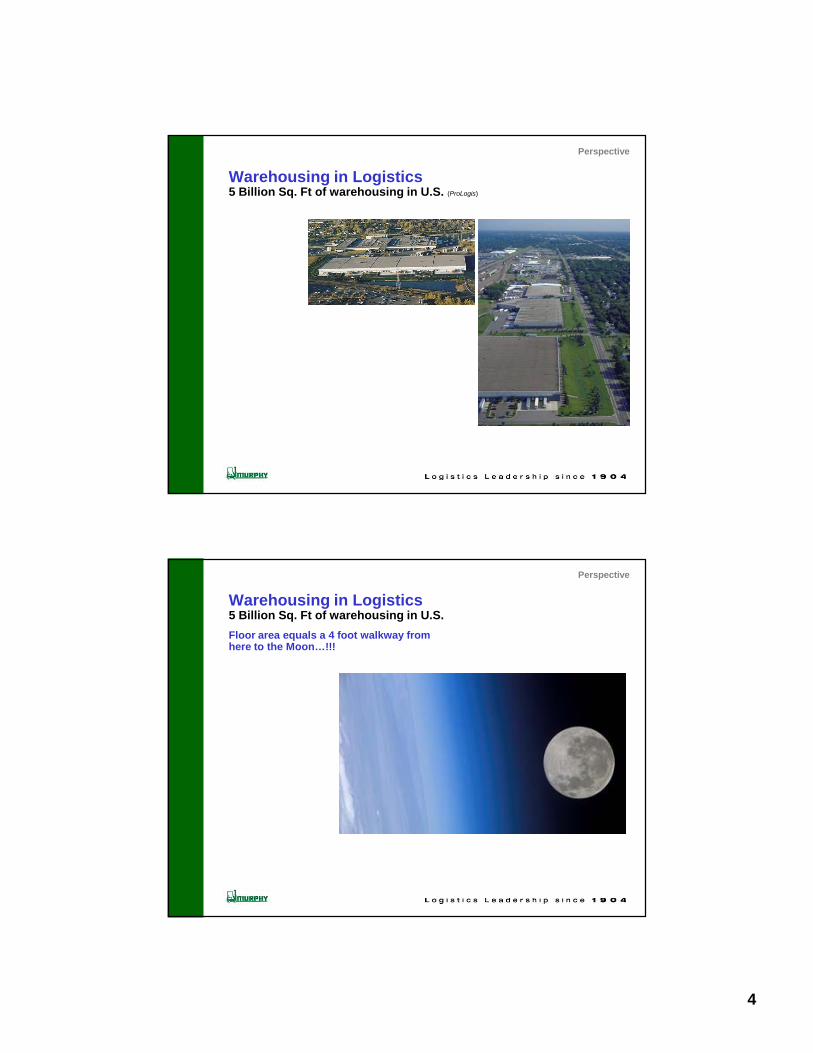
Warehousing in Logistics5 Billion Sq. Ft of warehousing in U.S. (ProLogis)
Perspective
Warehousing in Logistics5 Billion Sq. Ft of warehousing in U.S.
Floor area equals a 4 foot walkway fromhere to the Moon…!!!
Perspective

5
Who is MurphySupply Chain Logistics Services / 3PL
We are a Service Company Warehousing, distribution, transportation, value-added,
fulfillment, international, etc.
We handle products throughout their life-cycle From raw materials to in-process goods to finished
products to returns for numerous industry segments.
3PL – “3rd Party Logistics Services Provider”
Companies Served:Fortune 100 to Small EntrepreneursDomestic and Global
Industries Served:Retail / Catalogue / ConsumerMedical / Health CareGrocery / Food ProcessingBeveragePlasticsRecreational / CampingIndustrialForest Products (Paper/Packaging)International
Perspective
Who is MurphySupply Chain Logistics Services / 3PL
Murphy Family, 4thGeneration (1904)Square Feet Operated: 2,500,000Employees: 180
ISO 9001 Certified / ISO 14001 (pending)
OSHA - MNSHARP Certified ASI Food Certified / Organic Food Certified
LEED “Gold” Certified (2 facilities)
Energy Star Certified (Top 1%)
US Customs Bonded – CES, CFS, GO
FTZ (Foreign Trade Zone)
SKU’s Controlled: 29,000+
Order Activity / Month: 30,000+
Truck Loads Handled / Year: 120,450
Rail Cars Handled / Year: 10,000
Perspective

6
How do firms use Murphy13 Examples
1. Big Box / Mass Merchant / Retail
2. Global Sourcing – Domestic Distribution
3. Domestic Sourcing – Domestic Distribution
4. Vendor Consolidation Park
5. Seasonal Space Offsets
6. Domestic Manufacturing Support / JIT Plant
Support
7. Distribution / Transportation Services
• Regional Distribution
• U. S. Distribution
• Consolidation / Cross Docking
• Rail Transload / Truck-Rail-Ocean Integration
8. Contract Logistics
9. Medical Support Logistics
10. Value Added Services
• Parts Assembly
• Pick and Pack operations
• Packaging
11. Customer Returns Processing
12. Core Competency Strategies Solutions
13. Build to Suit Operations and Warehouses
Perspective
0%
20%
40%
60%
80%
100%
Jan
Feb
March
April
May
June
July
Aug
Sep
t
Oct
Nov
Dec
Murphy Rigging & Erecting, Inc.A Rigging / Millwright Contractor
Clients:Manufacturers to Printers
Medical to High Tech.
Artists to Classified Military.
From Very Precarious Handling….to Very
Heavy Lifts ….to Fragile Works of Art….to
Delicate and Expensive Medical Devices

7
• Truck
• Rail
• Ocean
• River Barge
• Fuel Prices
Transportation –
Trends & Implications–
Trucking IndustryCapacity Reductions
Parked equipment
Bankruptcy as fuel prices rose
200
400
600
800
1,000
1,200
1,400
Q1
00
Q1
01
Q1
02
Q1
03
Q1
04
Q1
05
Q1
06
Q1
07
Q1
08
Q1
09
Q1
10
Transportation

8
Trucking IndustryCapacity Reductions
Equipment Sell-offUsed Class 8 Tractor Exports
Trucking companies soldtractors to overseasmarkets when engines hitmajor overhaul point.
During recession practicegrew to get rid of capacity.
March 2010 U.S. tradedata
0
5,000
10,000
15,000
20,000
25,000
2004 2005 2006 2007 2008 2009 2010
Nigeria
Russia
Canada
Rest of the World
Transportation
69%
7%1% 0%
15% 10%
0%
70%
15%
9%7% 2%
0%
10%
20%
30%
40%
50%
60%
70%
80%
Truck Rail Pipeline Water RailIntermodal
Air
2005
2017
U.S. Commercial Freight Activity By %Sources: Cureau of Transportation Statistics
& U.S. Freight Transportation Forecast to…2016
0%
10%
20%
30%
40%
50%
60%
70%
80%
Truck Rail Pipeline Water Multimodal Air
1993
1997
2002
2004
2016
Source: U.S. Freight Transportation Forecast to…2017
Freight Modal SharesIn domestic tonnage
Trucking capacity issuewill plaque economy foryears!
Transportation

9
Transportation ImplicationsTrucking Industry
Trucks Will Remain a Major Player Trucks expected to continue to handle 60-70%
of all freight. Most freight involving rail / ocean / river handled
by trucks at beginning & end of movements.
Severe shortage of capacity will grow
Equipment will not be replaced as fast aseconomic recovery
Prices will rise faster than economicrecovery
Carriers must make up cash from last few yearslosses to survive.
Driver shortage will reappear driving upcosts & reducing service levels
Transportation
Rail IndustryTrucking not alone!
Container & Rail Car business inching up
Transportation

10
Rail IndustryEquipment Parking
On every available siding upto 31.9% of capacity
Transportation
Rail IndustryRebirth Before Recession Hit
Key Realities: More energy efficient Lower emissions Lower cost Longer lead-times Were at max capacity Intermodal growing
Intermodal – Major Growth Area Grew to off-set diesel prices
and congested seaports
“Intermodal is a core growthopportunity for the railroads, butthey must adapt to expectationsof typical truckload customers”
Steve Weiby, VP, CH Robinson.
Transportation
11
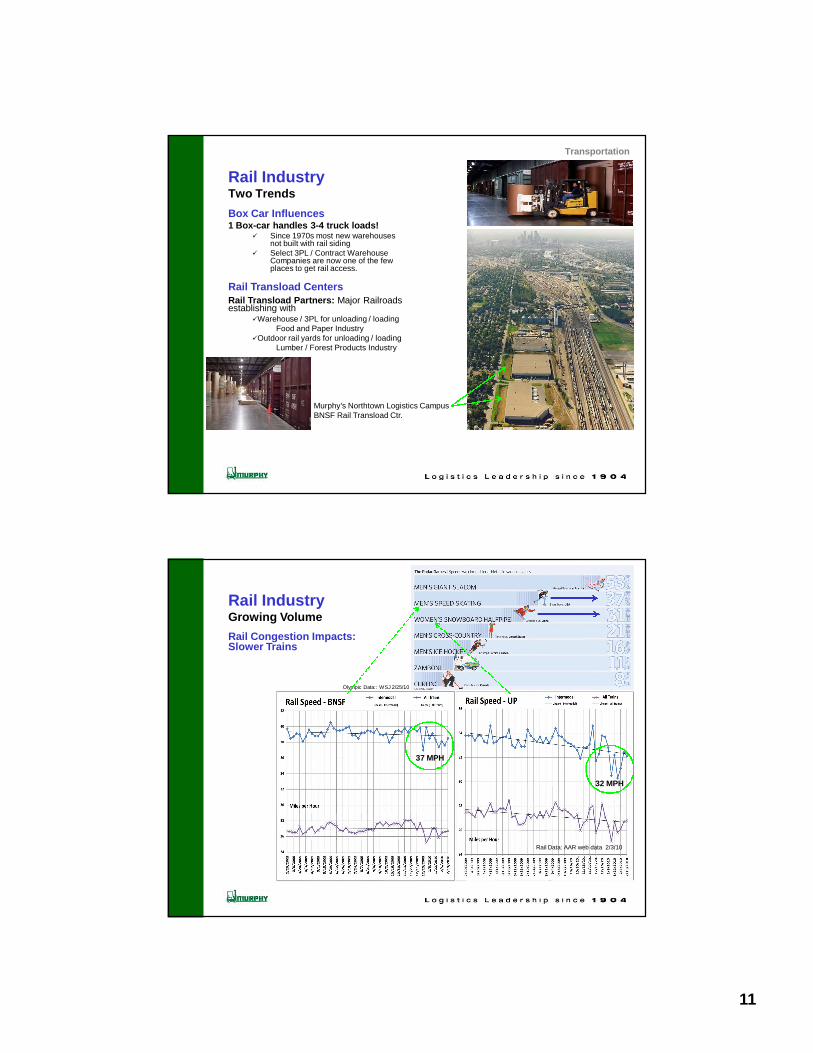
Rail IndustryTwo Trends
Box Car Influences1 Box-car handles 3-4 truck loads!
Since 1970s most new warehousesnot built with rail siding
Select 3PL / Contract WarehouseCompanies are now one of the fewplaces to get rail access.
Rail Transload CentersRail Transload Partners: Major Railroadsestablishing with
Warehouse / 3PL for unloading / loadingFood and Paper Industry
Outdoor rail yards for unloading / loadingLumber / Forest Products Industry
Murphy’s Northtown Logistics CampusBNSF Rail Transload Ctr.
Transportation
37 MPH
32 MPH
Olympic Data:: WSJ 2/25/10
Rail IndustryGrowing Volume
Rail Congestion Impacts:Slower Trains
Rail Data: AAR web data 2/3/10

12
Transportation ImplicationsRail Industry
Railroads making a comeback Will play a greater role in the future.
Rail carriers raising prices as if norecession
Will again feel capacity constraints Equipment & labor - when activity levels reach
pre-recession volumes, will push prices higher
Intermodal must meet trucking serviceexpectation levels to compete
Unless fuel prices reach astronomical levels andforce traffic to intermodal, despite the railsservice postures.
Environmental efficiency, esp. fromcarbon footprint, will push growth.
Box car use will grow
Transportation
Ocean IndustryOver Capacity
Two Issues Impacting:1. Drop in business had carriers parking equipment
throughout the world waiting for resurgence2. Carriers ordered many new and much larger
capacity ships over the past few years. Started arriving in 2009 Rates plummeted in response + impact of world
recession. Bigger ships will keep arriving no matter what
freight is available!
Transportation

13
Ocean IndustryNew Ships Huge
Photos show Emma MaerskWorlds largest container ship
Transportation
Container ShortageRaised Fees Significantly This Summer
Started With Container Plants ShuttingDown in China Late 2008
2010 Shipping rebound caught industry off guard
Supply & Demand allowed carriers to raise rates
Have been slow to reduce with additions to containerpools and reduced demand
Slower Speeds & Other RoutesTo Save Fuel & Canal Fees
Started in 2008 Fuel Price Bubble
Returned in 2010 to off-set lowfreight volumes
Added minimum one week toPacific transit
Results in 1 - 3 weeks additional inventoryrequired in system.
Carriers say they will continueslow sailing.
Transportation

14
River Barge IndustryInland Waterway
Keep in mind the inland waterwaysas a transportation option
Transportation
TransportationEconomic Comparison
Transportation

15
Transportation ImplicationsOcean Industry
Severe over capacity will linger for years! Prices will continue to stay low as a result.
New, bigger ships will add operationalefficiencies
Cost savings will not be realized till smaller, olderships retired.
Fuel price increases will push higher rates,over capacity will keep downward pressure
If global sourcing reduces significantly asfuel prices rise, carriers will be left withhuge ships with no freight to move
Smaller, older ships may be sorely missed.
Slow speeds will remain a tactic to savefuel and reduce carbon
Has added 1 - 3 weeks to system inventory.
River Barge IndustryMay see rebirth, esp. 300 miles of coast
Fuel efficiency very good Compared to land transpiration modes on tonnage
basis
Transportation
Source: Department of Energy, August 11, 2010
Fuel PricesWe all know what happened in 2008, but notice 2010!
($/Gallon)
$1.00
$1.50
$2.00
$2.50
$3.00
$3.50
$4.00
$4.50
$5.00
Ja
n0
5,
20
04
Ma
r0
5,
20
04
Ma
y0
5,
20
04
Ju
l05
,2
00
4
Se
p0
5,
20
04
No
v0
5,
20
04
Ja
n0
5,
20
05
Ma
r0
5,
20
05
Ma
y0
5,
20
05
Ju
l05
,2
00
5
Se
p0
5,
20
05
No
v0
5,
20
05
Ja
n0
5,
20
06
Ma
r0
5,
20
06
Ma
y0
5,
20
06
Ju
l05
,2
00
6
Se
p0
5,
20
06
No
v0
5,
20
06
Ja
n0
5,
20
07
Ma
r0
5,
20
07
Ma
y0
5,
20
07
Ju
l05
,2
00
7
Se
p0
5,
20
07
No
v0
5,
20
07
Ja
n0
5,
20
08
Ma
r0
5,
20
08
Ma
y0
5,
20
08
Ju
l05
,2
00
8
Se
p0
5,
20
08
No
v0
5,
20
08
Ja
n0
5,
20
09
Ma
r0
5,
20
09
Ma
y0
5,
20
09
Ju
l05
,2
00
9
Se
p0
5,
20
09
No
v0
5,
20
09
Ja
n0
5,
20
10
Ma
r0
5,
20
10
Ma
y0
5,
20
10
Ju
l05
,2
01
0
Pri
ce
per
Gallo
n
U.S. No 2 Diesel Retail Sales Price
$3.00
Transportation
16
$2.50
$2.75
$3.00
$3.25
2009
:Q4
2010
:Q1
Q2
Q3
Q4
2011
:Q1
Q2
Q3
Q4
Die
se
lP
ric
ep
er
Ga
llo
n
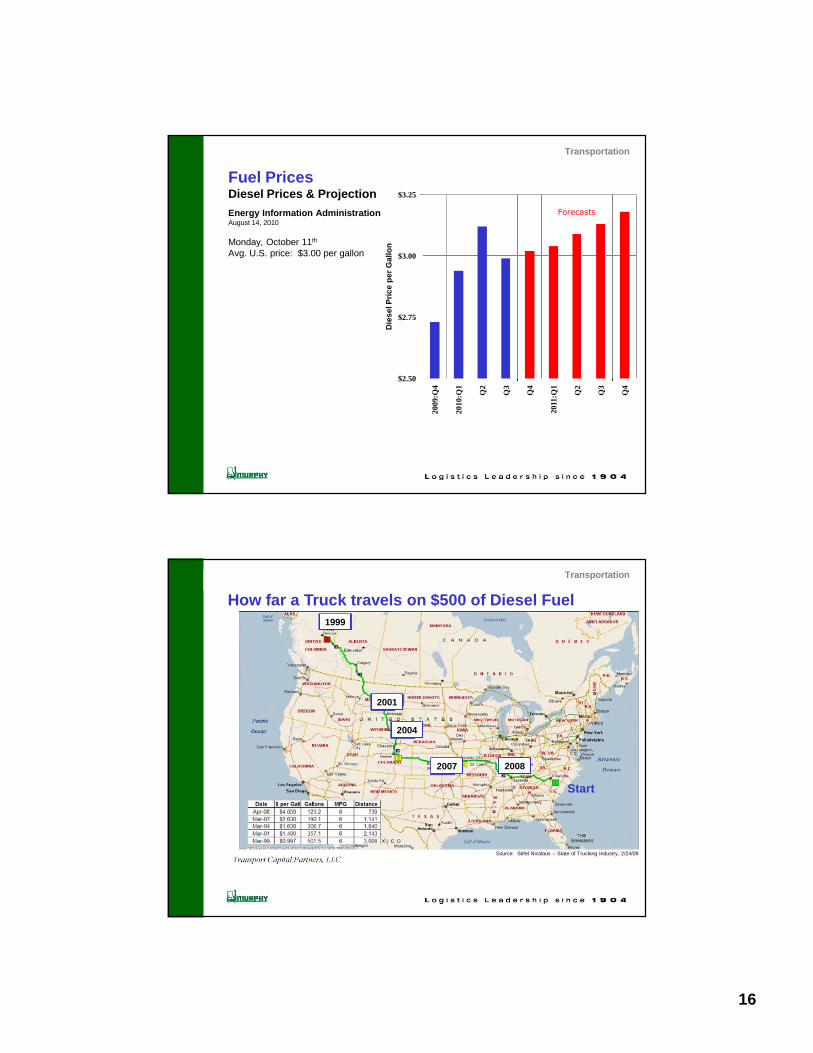
Forecasts
Fuel PricesDiesel Prices & Projection
Energy Information AdministrationAugust 14, 2010
Monday, October 11th
Avg. U.S. price: $3.00 per gallon
Transportation
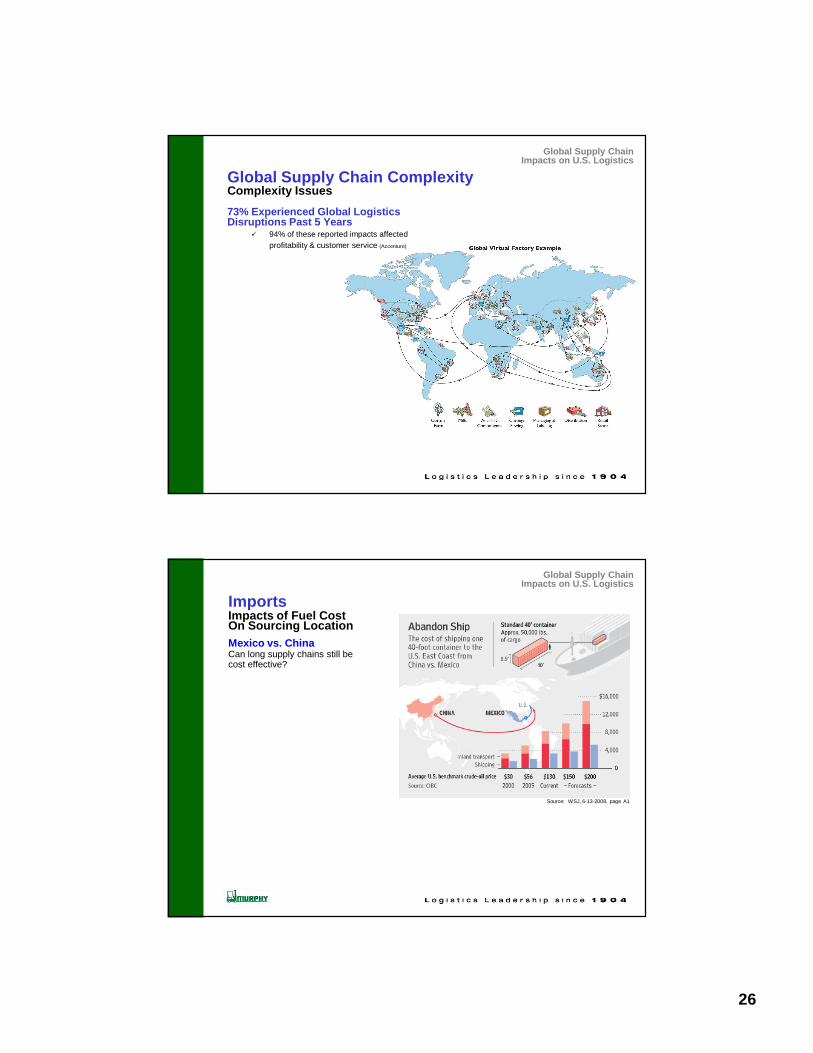
Source: Stifel Nicolaus – State of Trucking Industry, 2/24/09
20082007
2004
2001
1999
Start
How far a Truck travels on $500 of Diesel Fuel
Transportation

17
Crude Oil SupplyU.S. Energy Information Administration View
Note how price projection jumped from 2008 to 2009 to 2010 report!
Source: US Energy Info Admin 2010 Energy Outlook
Transportation
NOTE: Est’ed price in year 2015 – highlighted in green.
2008 projection: $ 77.00 / barrel2009 “ 119.00 / barrel2010 “ 147.00 / barrel
Crude Oil SupplyStrategic Perspective
Oil supply subject to serious geographic “choke points”If closed prices will rise drastically!
Transportation

18
Transportation ImplicationsFuel Prices
Will go up!
Will impact Logistics• Transportation Rates• Sourcing Locations• Domestic Distribution Networks
Next two sections will review these trends.
Smart Supply Chain, Logistics and Transportationfolks already planning changes to offset increaseimpacts as long as possible
Transportation
Source: “Preliminary National Rail Plan” Fed Rail Admin., Oct 2009
Transportation ImplicationsMode Integration Will Increase
Tonnage on Highways,Railroads and InlandWaterways 2002
Powder River BasinMontana Coal Fields
Transportation

19
Transportation ImplicationsMode Integration
Mode Shifting to Occur More FrequentlyShippers moving down rungs to save moneyand reduce carbon footprint
Air Ground
Air Ocean
Intermodal Boxcar
Truckload Intermodal
LTL Truckload
Rail Barge
Transportation
• Landbridge Evolution & Changes
• Panama Canal Influence
• Northwest / Northeast Passages
• Inland Ports Landscape
• Import Warehouses
• Sourcing Locations Network Redesign
Near Sourcing
Made in the USA
Global Supply ChainsImpacts on U.S. LogisticsTrends & Implications
–

20
If Only The World’s ContinentsWere Closer TogetherWe Would Not Need Container Ships
–
Global Supply ChainImpacts on U.S. Logistics
If Only InternationalSourcing Was Easy
–
Global Supply ChainImpacts on U.S. Logistics

21
and Then There’s Pirates!2010 as of October 11th
– Source: http://www.icc-ccs.org/
Global Supply ChainImpacts on U.S. Logistics
Implications of Offshore SourcingChanging U.S. Distribution PatternsLess manufacturing required in U.S.
Distance adds time More safety stock required
More DC / warehouse space needed in U.S.1 month of inventory minimum added to system tocover travel times
Slower containership speeds adding additional timeand thus inventory to system; 1-3 weeks.
Domestic Product FlowsHistoric Domestic Oriented Networksvs. New Import Oriented NetworksProduct flow evolved over past 20 years to today’s importfocused flow
Large shippers like Wal-Mart have adjusted networks /warehouse locations as a result
–
Global Supply ChainImpacts on U.S. Logistics

22
Domestic Import TransportationLandbridges Evolved
To haul import containers by rail from west coastto markets in mid & eastern parts of U.S.
–
Global Supply ChainImpacts on U.S. Logistics
Domestic Import TransportationLandbridge Changing Economics
All Water (vs. Rail) to East Coast All water usually cheaper
Mini Landbridge Impact – Line Moving West Trend started only 3 years ago.
–
Global Supply ChainImpacts on U.S. Logistics

23
Panama CanalCanal Expansion Changing The Game
More Asian Freight to East & Gulf Ports Landbridge cost portion pushing many to
consider ocean voyages through thePanama Canal for better access to eastcoast and gulf ports.
In 2008 – 25% of U.S. imports flowedthrough the Panama Canal.
Starting in 2014 with expansion ofPanama Canal finished domesticintermodal will face steep competition offthe west coast ports. All-water route willbe cheaper, esp. as fuel prices rise.
–
Global Supply ChainImpacts on U.S. Logistics
Panama CanalToday’s New Ships Too WideFor Existing Lock Widths
Expansion Completion in 2014
6-12” clearance!
–

24
Global Logistics Route“Northwest Passage”
Feasibility for Container Ships. A cable-laying ship sailed through in 2008
from Hong Kong to a project in the NorthAtlantic.
Coast Guard data finds 62 othercommercial and re-supply ships and threeore carriers in the Passage in 2008.
Shorter route to East coast and St.Laurence Seaway ports from Asia.
Global Supply ChainImpacts on U.S. Logistics
Global Logistics Route“Northeast Passage”
Europe and Russia BenefitsAsia Benefits
34% Less Miles, Less Carbon, Less Fuel Use
Global Supply ChainImpacts on U.S. Logistics

25
Domestic Import LogisticsPort Congestion andHigh Fuel Price Impacts
Creation of Inland Ports Chicago Columbus DFW Texas Kansas City Memphis Atlanta
Global Supply ChainImpacts on U.S. Logistics
Domestic Import LogisticsPort Congestion andHigh Fuel Price Impacts
Creation of Import WarehousesUp to 100 Miles from Ocean PortsServices Often Provided by 3PLs
3 - 40’ ocean containers = 2 - 53’ trailers
Reasons for: Land shortages near seaports Transportation efficiencies gained by
transloading containers to 53’ trailers –whether intermodal or over-the-road
Activities include: Transloading Repack Value add labeling
30.2% of all U.S. import containers wheretransloaded into 53’ trailers so far in 2010.
Global Supply ChainImpacts on U.S. Logistics
26
Global Supply ChainImpacts on U.S. Logistics
Global Supply Chain ComplexityComplexity Issues
73% Experienced Global LogisticsDisruptions Past 5 Years
94% of these reported impacts affected
profitability & customer service (Accenture)
ImportsImpacts of Fuel CostOn Sourcing Location
Mexico vs. ChinaCan long supply chains still becost effective?
Source: WSJ, 6-13-2008, page A1
Global Supply ChainImpacts on U.S. Logistics

27
Imports“Near Sourcing”
Factors influencing re-evaluationof offshore manufacturing:
Energy costs – esp. in logistics /transportation
Complexity of supply chains andvisibility issue
Long lead times
Excess inventory required
Larger carbon footprints – “Green”movement impact
Product Quality Controls
Available labor pools in select countries
Impact in China from growing internalconsumer market (vs. export market)
Global Supply ChainImpacts on U.S. Logistics
Changes In Offshore CostsLogic Changing
Total Landed Cost vs. Only Labor Cost Corporations are abandoning their myopic
focus on hourly wages for “Total Landed Cost”.
Total Landed Cost Model
Global Supply ChainImpacts on U.S. Logistics

28
Global Sourcing Network EvaluationBecoming More Important
When to move from Offshoring to Inshoring
Source: MIT 10-2008
Global Supply ChainImpacts on U.S. Logistics
Global Sourcing Network EvaluationCase Study 1 - impact of fuel prices and rising Asian labor cost
Source: MIT 10-2008
Global Supply ChainImpacts on U.S. Logistics

29
Global Sourcing Network EvaluationCase Study 2 - impact of fuel prices and rising Asian labor cost
Global Supply ChainImpacts on U.S. Logistics
69%
7%1% 0%
15% 10%
0%
70%
15%
9%7% 2%
0%
10%
20%
30%
40%
50%
60%
70%
80%
Truck Rail Pipeline Water RailIntermodal
Air
2005
2017
Source: U.S. Freight Transportation Forecast to…2017
Global Supply ChainImpacts on U.S. Logistics
Freight TransportationTruck and Rail Capacity Limits willPlaque Post-Recession Economy
Trucks Handle 69% of Freight!In Domestic Tonnage
Rail & Intermodal will be key, but still onlyhandle 16-20% in foreseeable future

30
Global Supply ChainImpacts on U.S. Logistics
Global Supply ChainImpacts on U.S. LogisticsImplications
Ocean Freight Lanes More traffic through the Panama Canal – esp.
after major lock expansion completed in 2014. More cargo will arrive at gulf & east coast
ports Land bridge cost from west coast ports will
continue to rise relative to all water routeforcing more Asian containers to east and gulfcoast ports.
Northwest passage may open and allowcontainer ships to more economically reachupper east coast & St. Laurence Seaway ports.
Inland Ports & Import Warehouses Continue to grow These two trends creating large Logistics
Centers in key inland markets.
Plant Locations Total landed cost will be the driver - not just
labor cost per hour; especially as fuel prices rise. “Near sourcing” will grow - Mexico, Central
America & South America. “Made in USA” will see more movement.
• Retail / Consumer Demands
• Geographic “Mega Regions”
• Network Design Changes:“More is Less”
Fuel Price Impact
Carbon Footprint Impact
• Freight Security / Theft
• Land Prices & Urban Proximity
• The Sky’s The Limit
Domestic LogisticsTrends & Implications
–

31
Domestic Logistics
Retail / Consumer DemandsGrowing Impact of Big-Box Retailers
Less backroom stock space
Pushing inventory up-stream Reducing cash flow tie-up a factor
Demanding frequent replenishment & smaller orders
–
Order Profile ChangesOld Rules No Longer Apply
Christmas SalesNow in July…!!!

32
Domestic Logistics
Retail Options GrowIn the Internet Age…
No Longer Know: Where sales are going top come from When they will arrive How they will arrive
Makes Demand Planning Difficult
Domestic Logistics
Retail Options Grow“Growing” New Consumers

33
Domestic Logistics
Consumer DemandSKU Proliferation
“We want it Now!....and Our Way!”
Source: The Tioga Group
Domestic Logistics
North America “Mega-Regions”Eastern Market Still Biggest Impact To Models

34
Network DesignReceiving More Attention Today
Last 15 yrs trend - fewer & bigger warehouses: 3 - 5 Total JIT, ERP, TQM, Lean Impacts Lower fuel costs helped also
Today, attention given to increasing number of warehouses:6-10 Locations Network
Impact of higher local delivery cost (vs. long haul cost) is changing networks. Trend also towards smaller warehouses.
Source: New Age of Trade. Cushman & Wakefield, 2009
Green TrendsLogistics Industry
“DC” stands for Distribution Center / Warehouse
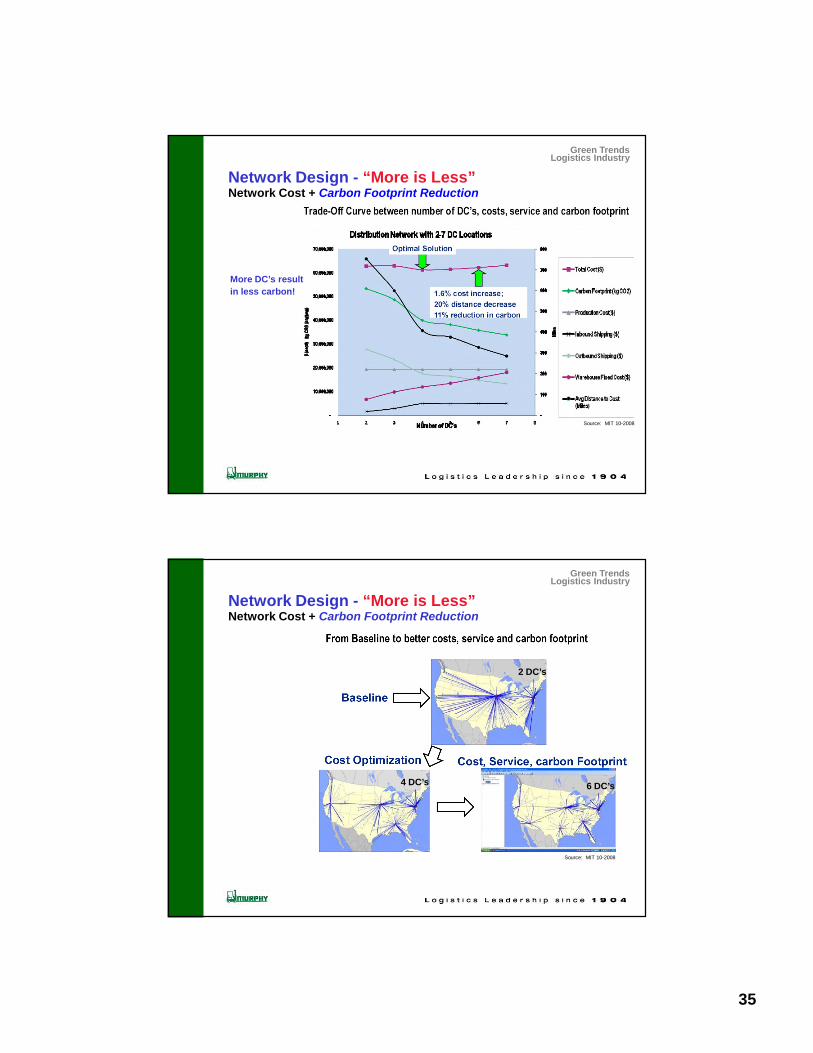
Network DesignNetwork Design - “More is Less”
Green TrendsLogistics Industry
35
Network Cost + Carbon Footprint Reduction
Source: MIT 10-2008
More DC’s result
in less carbon!
Network Design - “More is Less”
Green TrendsLogistics Industry
Network Cost + Carbon Footprint Reduction
2 DC’s
6 DC’s4 DC’s
Network Design - “More is Less”
Source: MIT 10-2008
Green TrendsLogistics Industry

36
Domestic Logistics
Logistics SecurityCargo Theft Incidents Past 12 Months
Warehouse Break-insTruck Heisting
FBI estimates $15-50B / year Warehouses & Carriers handling high value
products see increase in out-side initiated theft
Map / Diagram: July 2010 ReportFreightWatch Internationalhttp://www.freightwatchintl.com/?q=node/3
Domestic Logistics
Logistics SecurityWhy Logistics Theft Growing
Product Value Increasing + Counterfeiting Esp. electronics, meat / fish, cigarettes,
metals.
Easily sold domestically & globally Orders go out for products from
organized gangs/crime. Cuban criminals been hard at work
steeling Cigarettes.
Low risk of being caught Since 911 FBI’s Cargo Theft Teams
assigned to domestic security.
Inadequate criminal justice system Drug arrest yields 20 years in prison $2M Cigarette heist yields 10 year
max, usually less! Result, drug criminals have shifted to
Logistics theft. “Crime doesn’t pay” no longer applies!

37
Domestic Logistics
Urban Land Prices500% Increase in 10 Years
Pushing Logistics CampusesFurther Out
To suburban edge sites: 2nd tier-plusoutward suburban locations & ruraledge
Adding increased transportation time,cost & congestion
500% land price increases are sitesnear freeway rung system closer tourban center
Big campuses can’t be too closeto cities, but they also can’tbe too far out
Domestic Logistics
Urban Land PricesWhere to Find Warehouses / DCs Today
Logistics Parks & Corridors – Freight Villages Regional Economic Development Drivers

38
Domestic Logistics
The Sky’s the LimitExisting Warehouse Upgrade
Raising the Roof Conversion of low height warehouses to tall structures Cheaper than new construction Photos: Albertson 600,000 sq. ft. DC Chicago – 18’ up to 38’
A. Epstein and Sons International, Inc. Chicago
Domestic LogisticsImplications
Retail / Consumer Demands…. Retailers & consumers demands are playing havoc
with inventory management, cycles, & productionplanning.
Geographic “Mega Regions”…. Regionally concentrating freight delivery areas.
Local delivery costs rising – congestion, fuel, labor
Land Prices & Urban Closeness Continued pressure pushing DC’s / warehouses
further out, thus adding to local delivery costs andtime.
Economics of “raising the roof” to modernize olderfacilities gaining momentum – will pick up steam onceindustrial vacancy rates lower which may take 3 years.
Domestic Logistics

39
Domestic LogisticsImplications
Freight Security / Theft Growing during the recession.
Increasing values of cargo and lenient justicesystem insure theft will continue escalating
Logistics industry fighting back with technology andbetter law enforcement coordination.
Not just unique to USA.
Network Design Changes - “More is Less” Fuel price increases forcing changes to Supply
Chain Networks – domestically and globally.
Growing interest in more DC and Crossdocklocations.
Likely to see 6-10 DC/Warehouse networks (vs.3-5 which was common since the late 1980’s).
Carbon footprint influence will grow as a factorin network design – in some cases, this leads tomore locations.
Domestic Logistics
Green Logistics–
–
–
–
• Green Performance Measures –Impact on Speed of Supply Chain
• Urban Heat Island
• Facility Design & StormwaterManagement
• Energy Creation Measures

40
Major corporations Green InitiativesPerformance Measures - two new examples
100% Order Accuracy
Traditional Focus - Customer satisfaction.
Green Focus - to avoid redelivery and thusreduce carbon emissions.
Zero Customer Order Complaints
Traditional Focus - do whatever it takes to makecustomer happy!...order minimums are noproblem…delivery ASAP!
Green Focus - increasing order minimums toreduce delivery frequency, and longer orderlead times to facilitate transportationconsolidation.
Green Logistics
Facility DesignStormwater Regulation Impacts
Few outside profession realize growing impact…!!!
EPA mandated cities to control their stormwater – quantity & quality Regulations required cities to comply with no additional Federal Funds,
thus local fees.
Stormwater fees growing 1400+ cities to date nationwide.
Minneapolis - $3,400 per acre (i.e. $0.12 per sq. ft. of warehouse).Most DC/warehouses use 20+ acres; cost is $68,000+/yr.
Green Logistics

41
Facility DesignNative Prairie Planting vs. Lawn
Maintenance Cost DifferenceIf all
Cut Lawn
Prairie Lawn Lawn
Areas Areas AreasAnnual Costs 6 acres 4.19 acres 10.19 acres
Maintenance 4,240$ -$ -$
Mowing - 12,015.00 29,220.25
Watering - 8,630.00 20,988.00
Fertilization - 1,005.00 2,444.14
Total Cost: 4,240$ 21,650$ 52,652$
Cost / Acre.: 707$ 5,167$ 5,167$
Existing Set-up
Manicured Lawn costs 7.3x more to maintainthan native prairie plants!
“Since 1994 we have saved over $520,000while being green…!!!”
Green Logistics
Energy Creation - Solar PowerRoofs - Large available flat areas “just sit there.”Solar panels not great load factors
Commercial solutions include: “Solar Energy Service Provider” - 100% responsibility to design, build,
own and operate the asset - including all upfront purchase andinstallation costs.
to solutions where building owner owns the solar assets and providerdesign-builds the system.
Staples Store, CA
2 SolarProviders:
Green Logistics

42
Energy Creation - Solar PowerMinnesota Manufactured Panels
Jim Losleben, 952-303-7600, [email protected]
Run at lower voltage – increases efficiency and solves firedepartment issues with live systems.
Solved “shadow problem” – shading a portion of panel nowdoesn’t shut system down!
Meets Minnesota’s new law to receive state grants for usingMN manufactured panels.
Murphy installed 3 systems Fall 2010 – 140KW total power
• 3 buildings; each w 40 KW array
• Array size: 5,000 sq. ft., less than 2% of building.
• Produces 50+% of energy use…!!!
Green Logistics
Energy Creation - WindWind power units – individual fans, horizontal row of blades, & stand alone tower units.
Horizontal wind power units – research in Chicago on units mounted in horizontal rowof blades at roof edge to capture air flow rising up and over building, and to better handleturbulent urban air patterns.
Green Logistics

43
Urban Heat Island ImpactsPotential solution - green roofs
Minneapolis LibraryGreen roof temperature statistics
Situation: 90-degree day
Green Roof: 92° F
White Roof: 125° F
Dark Ballast: 145° F
Black Roof: 170° F
Green LogisticsImplications
Green Logistics is in “Green” seen as a reflection of good management
by Wall Street and public.
Could lead to less service & options for shippers
Likely see a “slow-down of logistics velocity” As transportation modes slow down to maximize fuel
efficiency & consolidation
LEED & other environment certifications willgrow in importance
Facility design changes including green roofs, stormwater management, &
other planting concepts.
Wind & Solar energy production on logisticsfacilities roofs

44
Supply Chain LogisticsPost Recovery Landscape
Rotary Club of Saint PaulOctober 12, 2010
Richard Murphy Jr.President & CEOwww.murphywarehouse.comandPast ChairCouncil of Supply Chain Management Professionals (CSCMP)Center For Transportation Studies (CTS), U of MNAmerican Society of Landscape Architects – MN Chapter