supply chain logistics and the role of ports · pdf file28/11/2017 · supply chain...
TRANSCRIPT
Supply Chain Logistics and the Role of Ports
SEDC Ports Workshop Nov. 28, 2017Lee Kindberg
Director, Environment & SustainabilityMaersk Line

90% of
internationally traded goods are transported by sea
SHIPPING ENABLES TRADE AND AFFECTS THE LIVES OF BILLIONS2
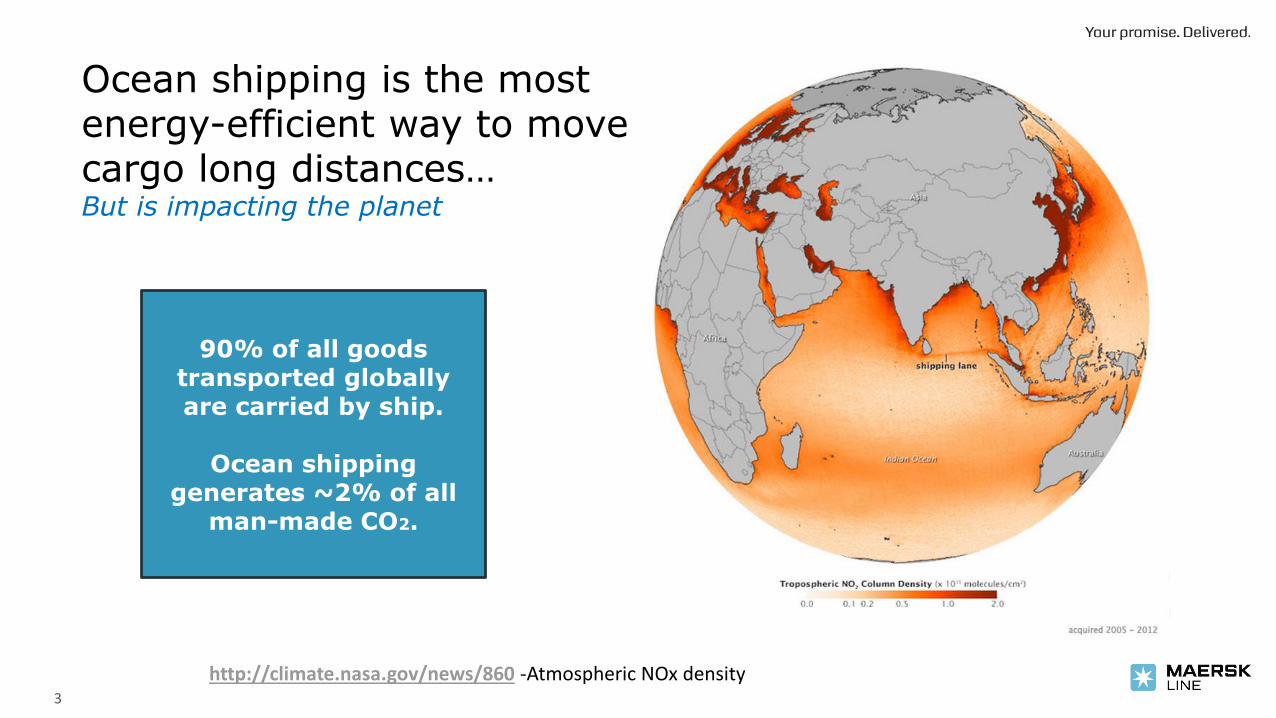
http://climate.nasa.gov/news/860 -Atmospheric NOx density
Ocean shipping is the most energy-efficient way to move cargo long distances…But is impacting the planet
90% of all goods transported globally are carried by ship.
Ocean shipping generates ~2% of all
man-made CO2.
3
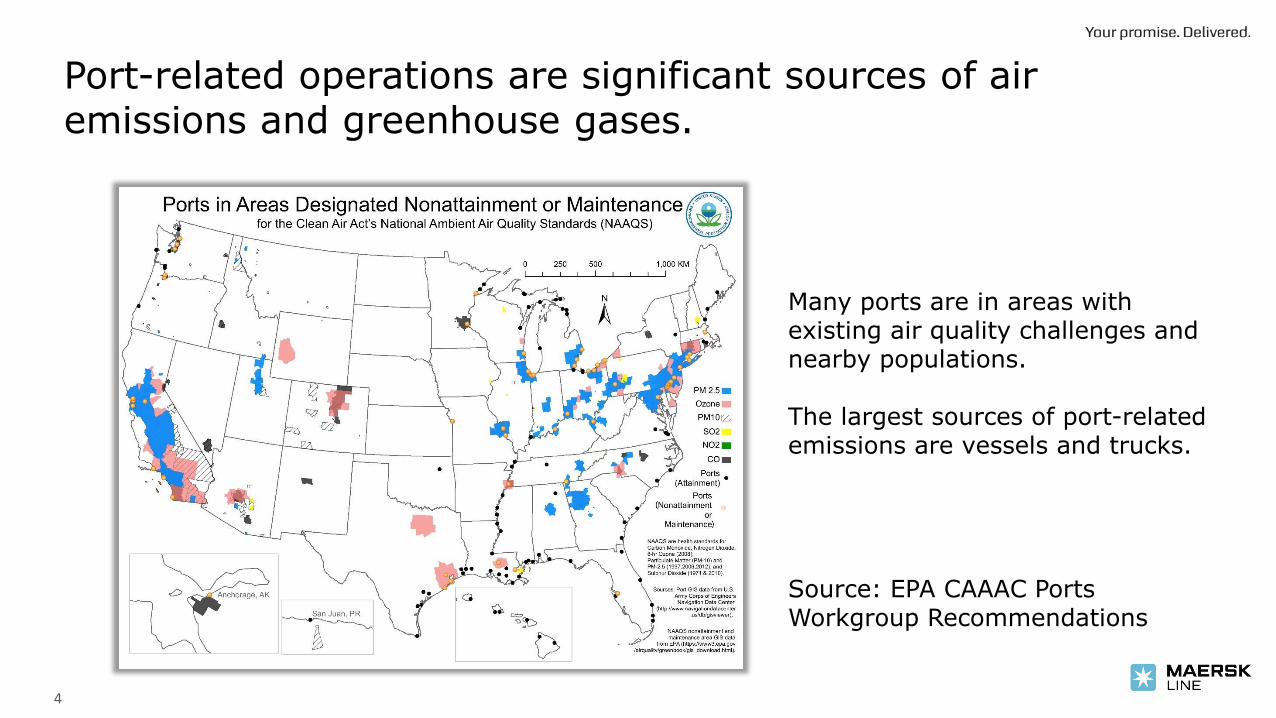
Port-related operations are significant sources of air emissions and greenhouse gases.
Many ports are in areas with existing air quality challenges and nearby populations.
The largest sources of port-related emissions are vessels and trucks.
Source: EPA CAAAC Ports Workgroup Recommendations
4
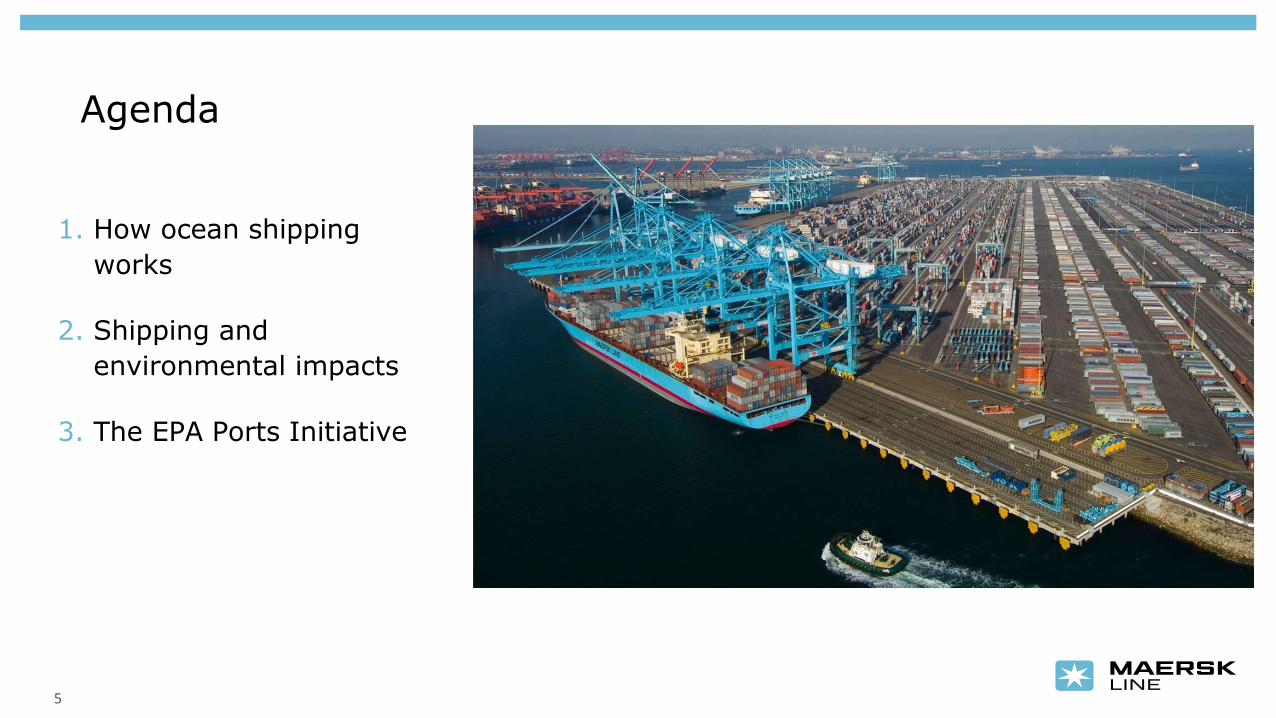
Agenda
1. How ocean shipping
works
2. Shipping and
environmental impacts
3. The EPA Ports Initiative
5
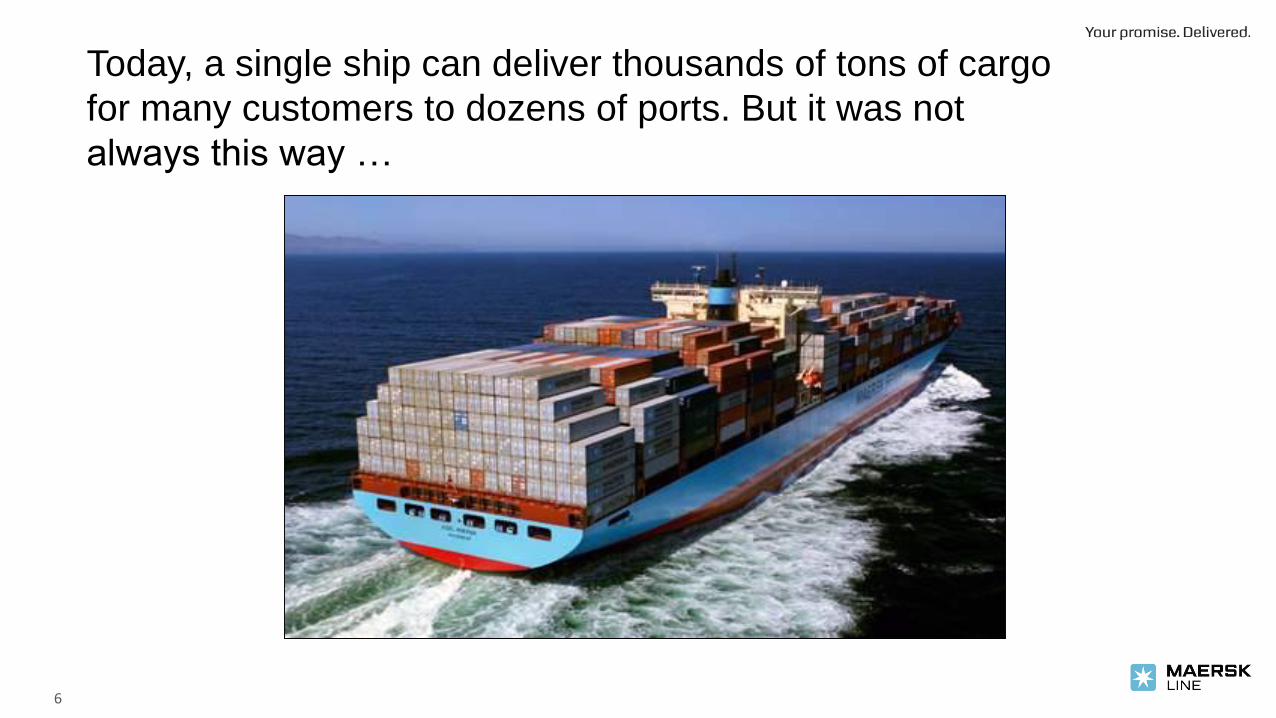
Today, a single ship can deliver thousands of tons of cargo
for many customers to dozens of ports. But it was not
always this way …
6

Diesel engines have replaced wind power
7
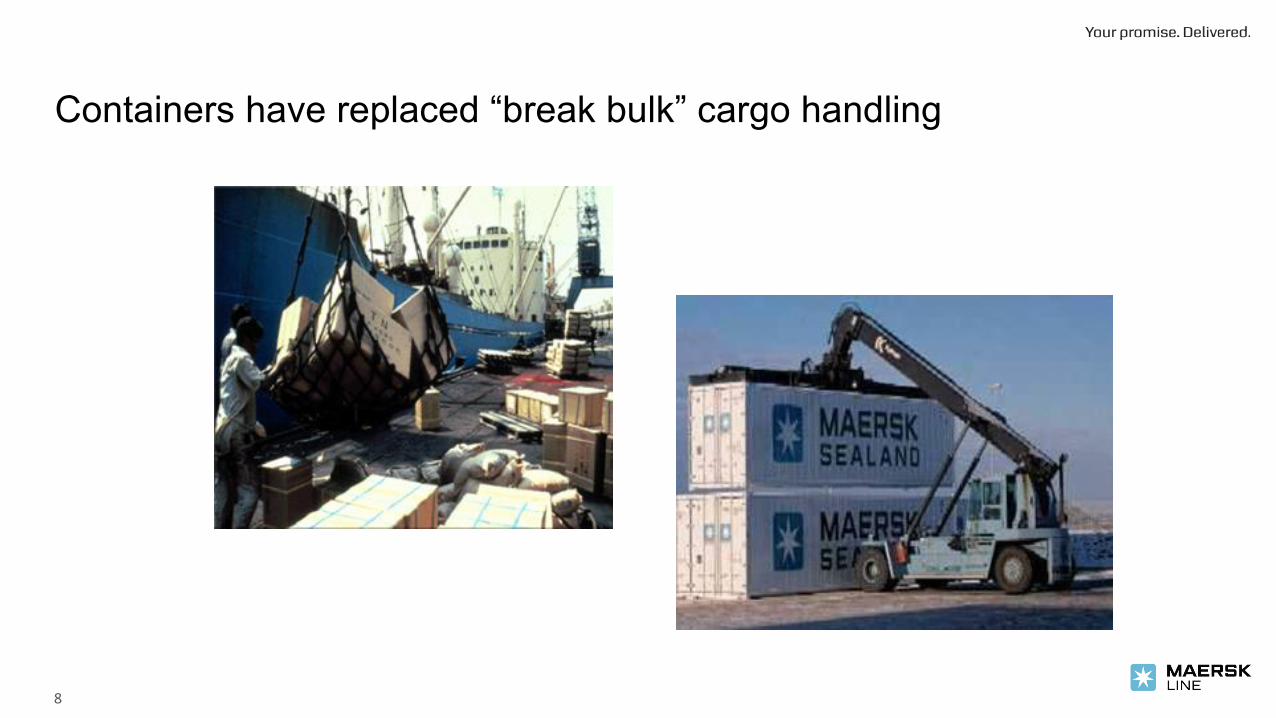
Containers have replaced “break bulk” cargo handling
8
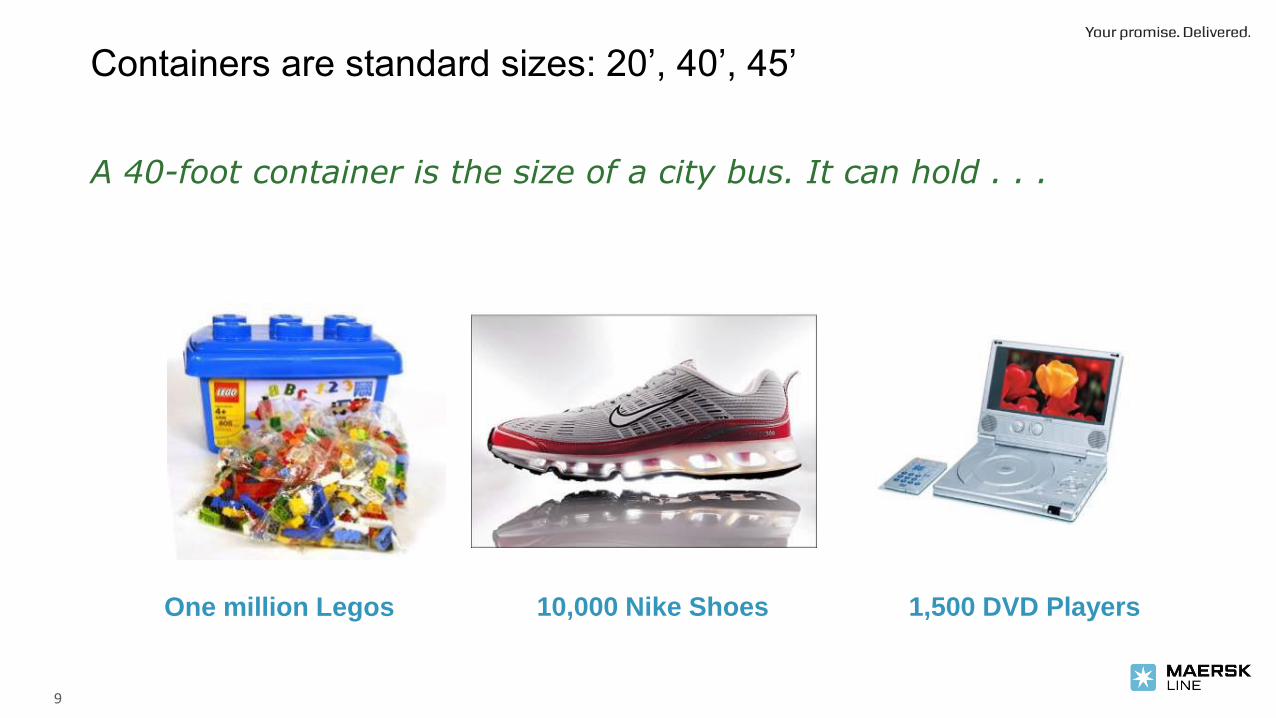
Containers are standard sizes: 20’, 40’, 45’
A 40-foot container is the size of a city bus. It can hold . . .
One million Legos 10,000 Nike Shoes 1,500 DVD Players
9
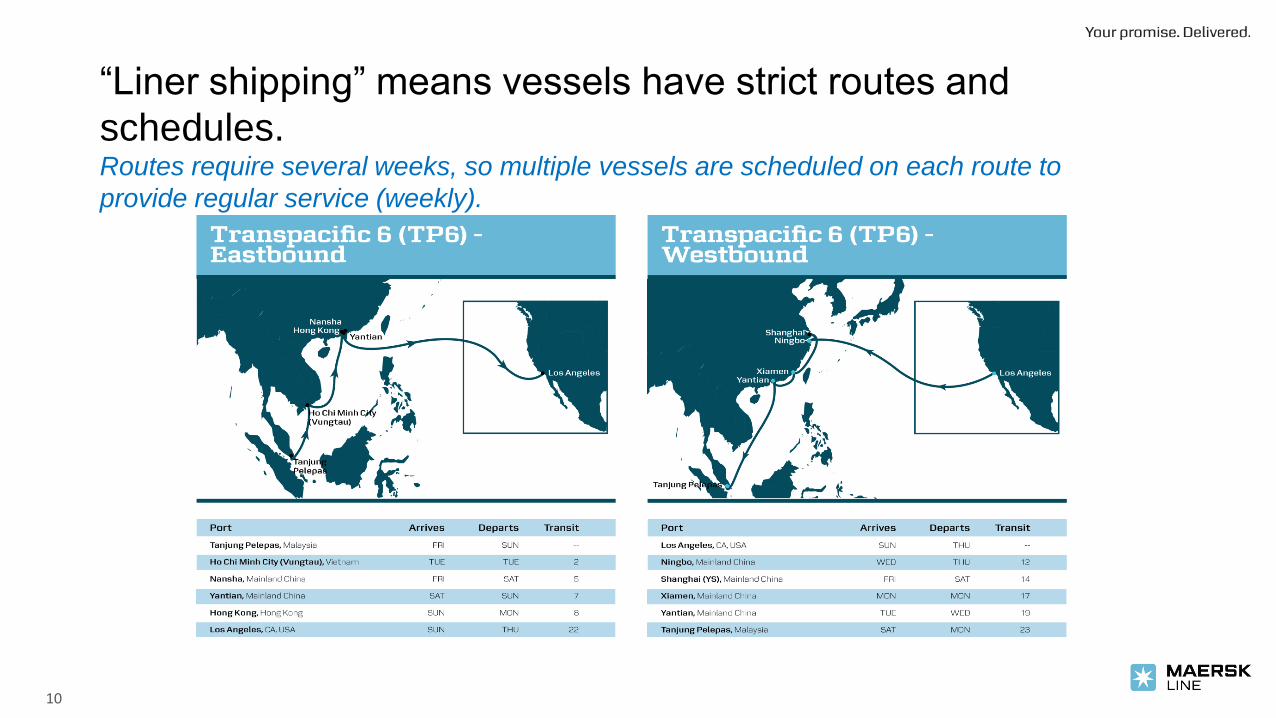
“Liner shipping” means vessels have strict routes and
schedules.Routes require several weeks, so multiple vessels are scheduled on each route to
provide regular service (weekly).
10
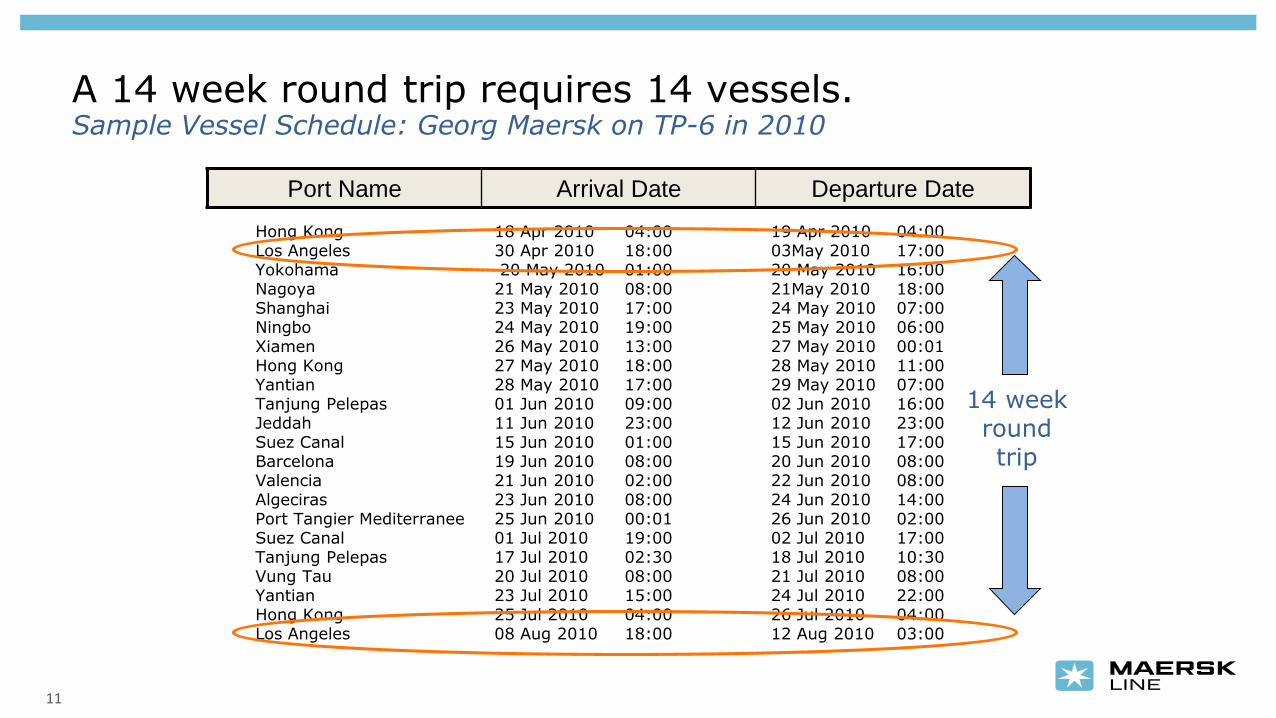
A 14 week round trip requires 14 vessels. Sample Vessel Schedule: Georg Maersk on TP-6 in 2010
Port Name Arrival Date Departure Date
Hong Kong 18 Apr 2010 04:00 19 Apr 2010 04:00Los Angeles 30 Apr 2010 18:00 03May 2010 17:00Yokohama 20 May 2010 01:00 20 May 2010 16:00Nagoya 21 May 2010 08:00 21May 2010 18:00Shanghai 23 May 2010 17:00 24 May 2010 07:00Ningbo 24 May 2010 19:00 25 May 2010 06:00Xiamen 26 May 2010 13:00 27 May 2010 00:01Hong Kong 27 May 2010 18:00 28 May 2010 11:00Yantian 28 May 2010 17:00 29 May 2010 07:00Tanjung Pelepas 01 Jun 2010 09:00 02 Jun 2010 16:00Jeddah 11 Jun 2010 23:00 12 Jun 2010 23:00Suez Canal 15 Jun 2010 01:00 15 Jun 2010 17:00Barcelona 19 Jun 2010 08:00 20 Jun 2010 08:00Valencia 21 Jun 2010 02:00 22 Jun 2010 08:00Algeciras 23 Jun 2010 08:00 24 Jun 2010 14:00Port Tangier Mediterranee 25 Jun 2010 00:01 26 Jun 2010 02:00Suez Canal 01 Jul 2010 19:00 02 Jul 2010 17:00Tanjung Pelepas 17 Jul 2010 02:30 18 Jul 2010 10:30Vung Tau 20 Jul 2010 08:00 21 Jul 2010 08:00Yantian 23 Jul 2010 15:00 24 Jul 2010 22:00Hong Kong 25 Jul 2010 04:00 26 Jul 2010 04:00Los Angeles 08 Aug 2010 18:00 12 Aug 2010 03:00
14 week round trip
11
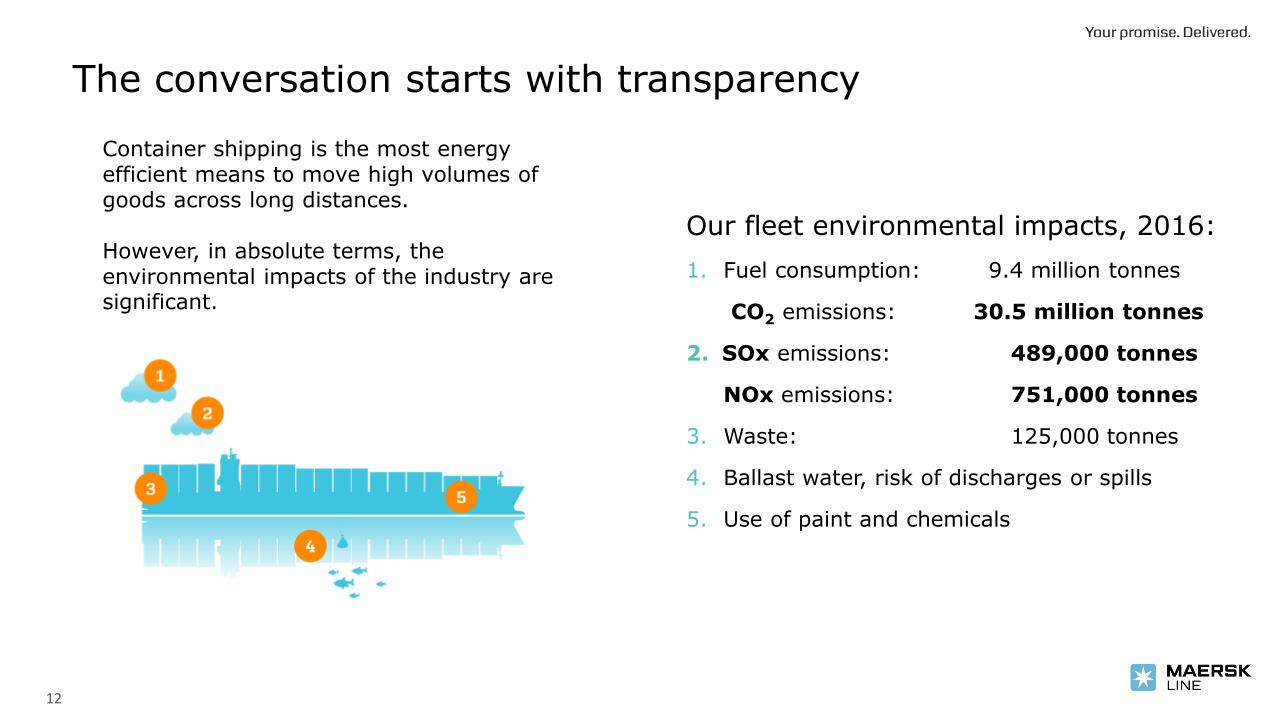
Container shipping is the most energy efficient means to move high volumes of goods across long distances.
However, in absolute terms, the environmental impacts of the industry are significant.
The conversation starts with transparency
Our fleet environmental impacts, 2016:
1. Fuel consumption: 9.4 million tonnes
CO2 emissions: 30.5 million tonnes
2. SOx emissions: 489,000 tonnes
NOx emissions: 751,000 tonnes
3. Waste: 125,000 tonnes
4. Ballast water, risk of discharges or spills
5. Use of paint and chemicals
12
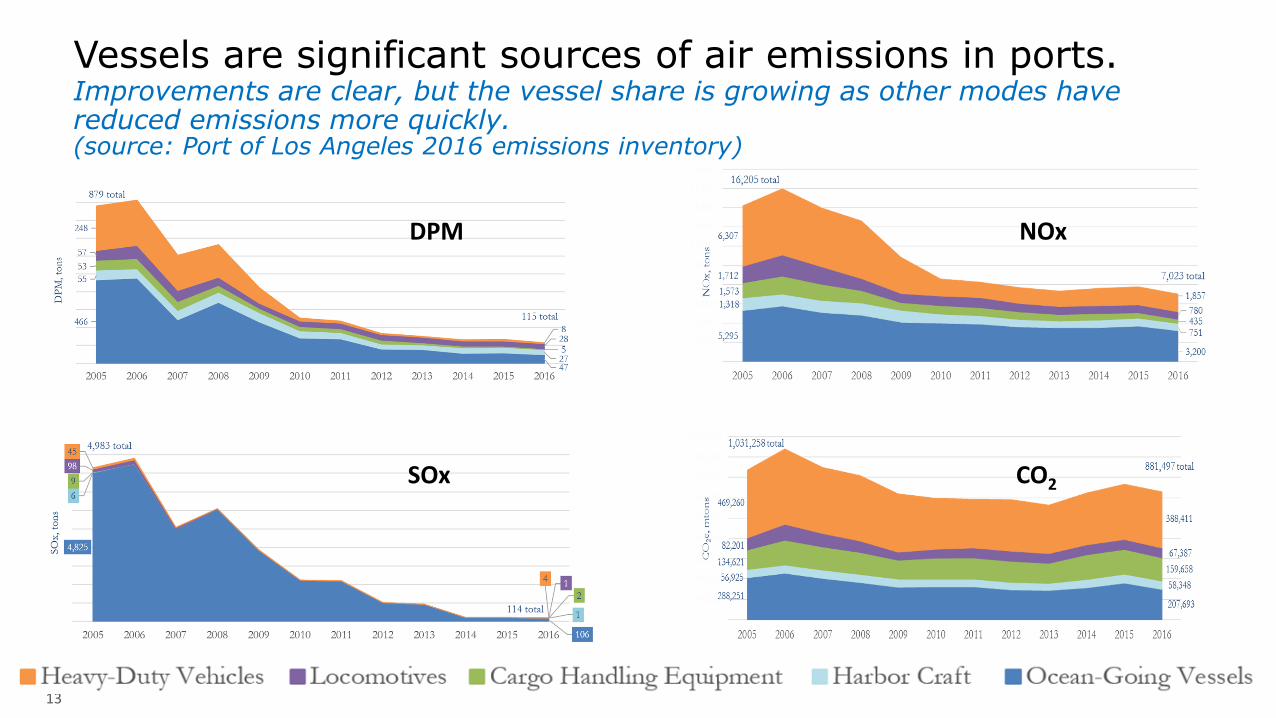
Vessels are significant sources of air emissions in ports.Improvements are clear, but the vessel share is growing as other modes have reduced emissions more quickly. (source: Port of Los Angeles 2016 emissions inventory)
13
DPM NOx
SOx CO2
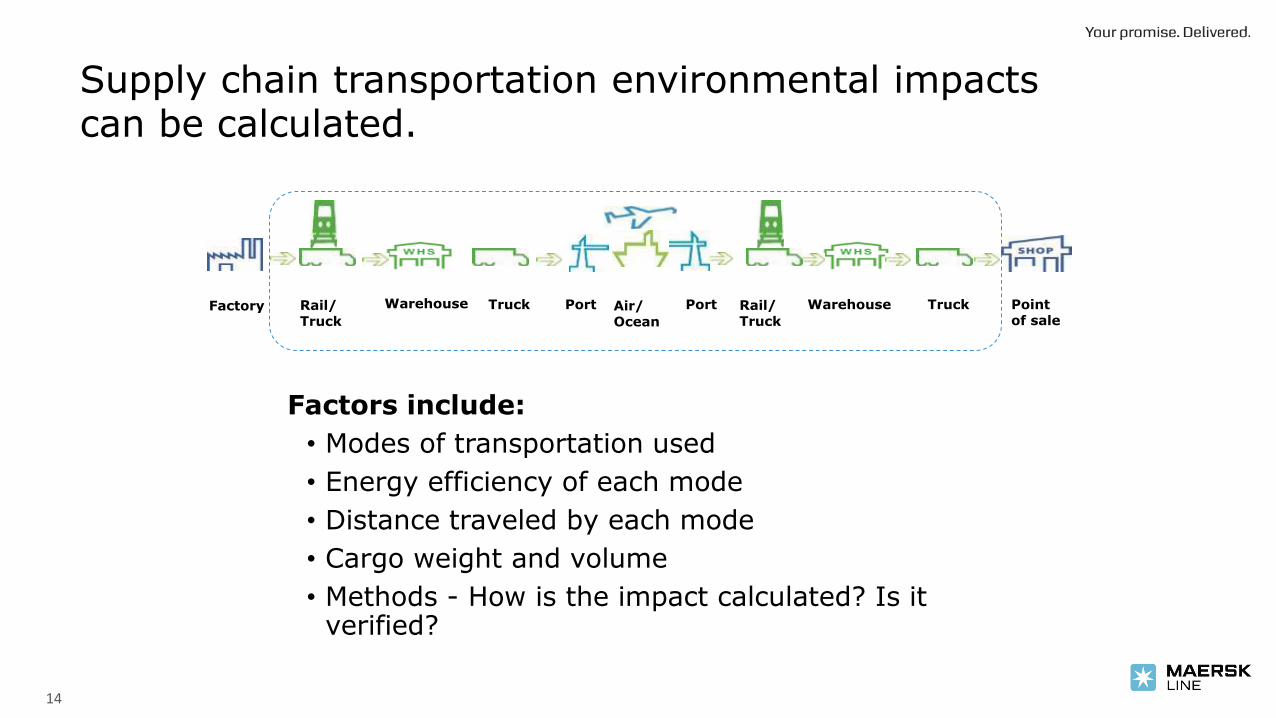
Supply chain transportation environmental impacts can be calculated.
Factors include:
• Modes of transportation used
• Energy efficiency of each mode
• Distance traveled by each mode
• Cargo weight and volume
• Methods - How is the impact calculated? Is it verified?
Factory Rail/Truck
Warehouse PortTruck Air/Ocean
Port Rail/Truck
Warehouse Truck Point of sale
14
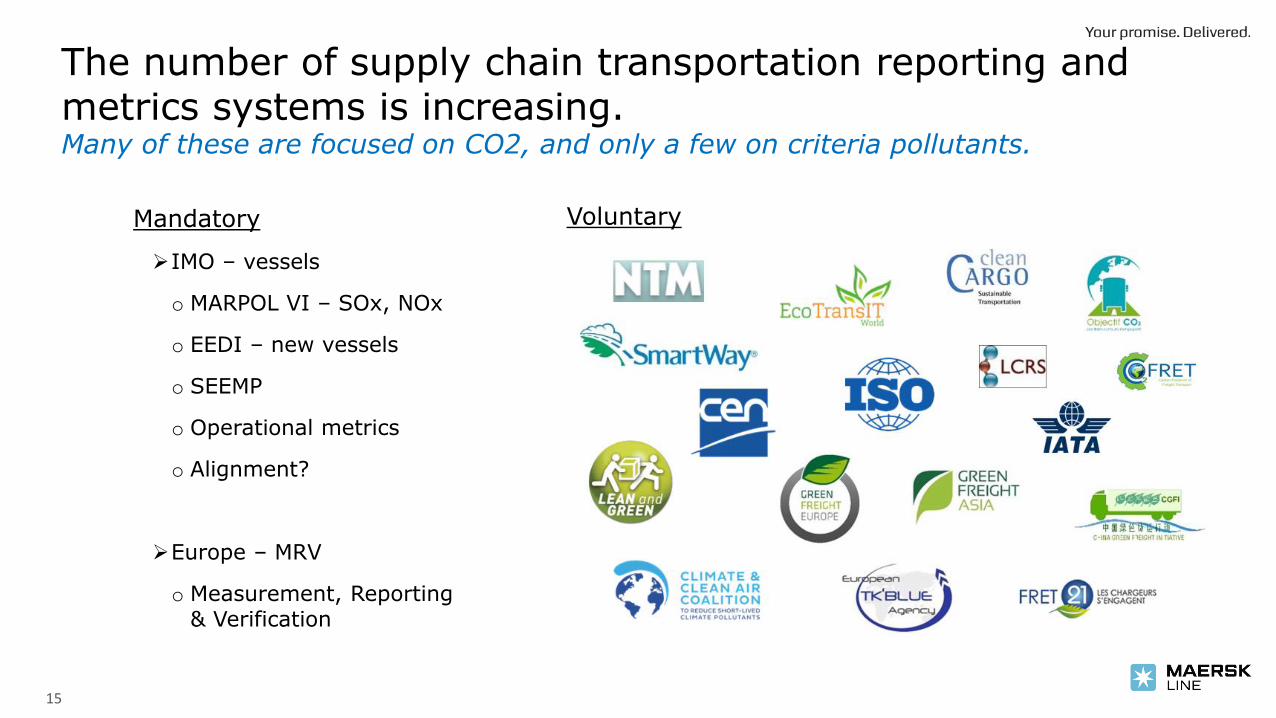
The number of supply chain transportation reporting and metrics systems is increasing.Many of these are focused on CO2, and only a few on criteria pollutants.
Mandatory
IMO – vessels
o MARPOL VI – SOx, NOx
o EEDI – new vessels
o SEEMP
o Operational metrics
o Alignment?
Europe – MRV
o Measurement, Reporting & Verification
Voluntary
15

Standard methods are available to report the environmental impacts of ocean shipping. The best-accepted are from the Clean Cargo Working Group.
16
>85% of the global container
capacity in CCWG membership
Annual data collection and
benchmarking since 2005
Standardized CO2 industry methodologies
Verification protocol.
Enables customers to make
informed decisions and integration
of sustainability into the supplier
selection process.
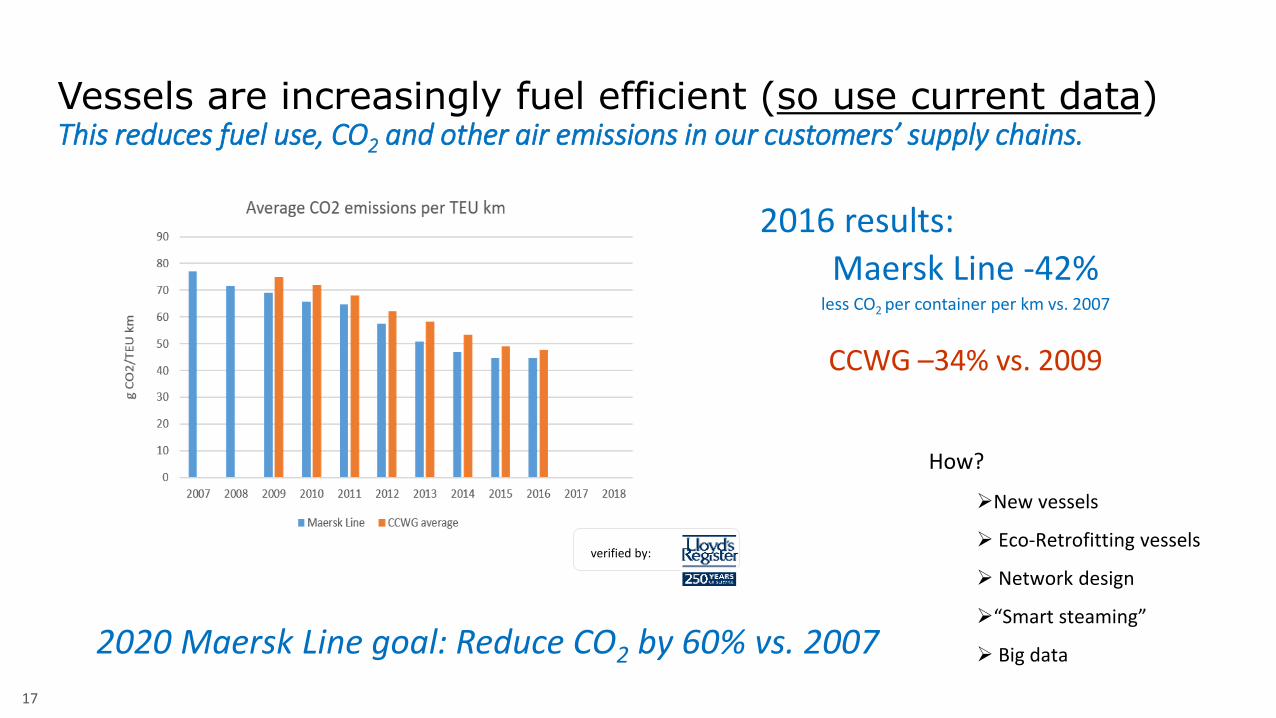
Vessels are increasingly fuel efficient (so use current data) This reduces fuel use, CO2 and other air emissions in our customers’ supply chains.
How?
New vessels
Eco-Retrofitting vessels
Network design
“Smart steaming”
Big data
2016 results:
Maersk Line -42% less CO2 per container per km vs. 2007
CCWG –34% vs. 2009
2020 Maersk Line goal: Reduce CO2 by 60% vs. 2007
verified by:
17

18
Overview of EPA’s Ports Initiative
EPA Contact: Sarah Froman
U.S. EPA - OTAQ
19
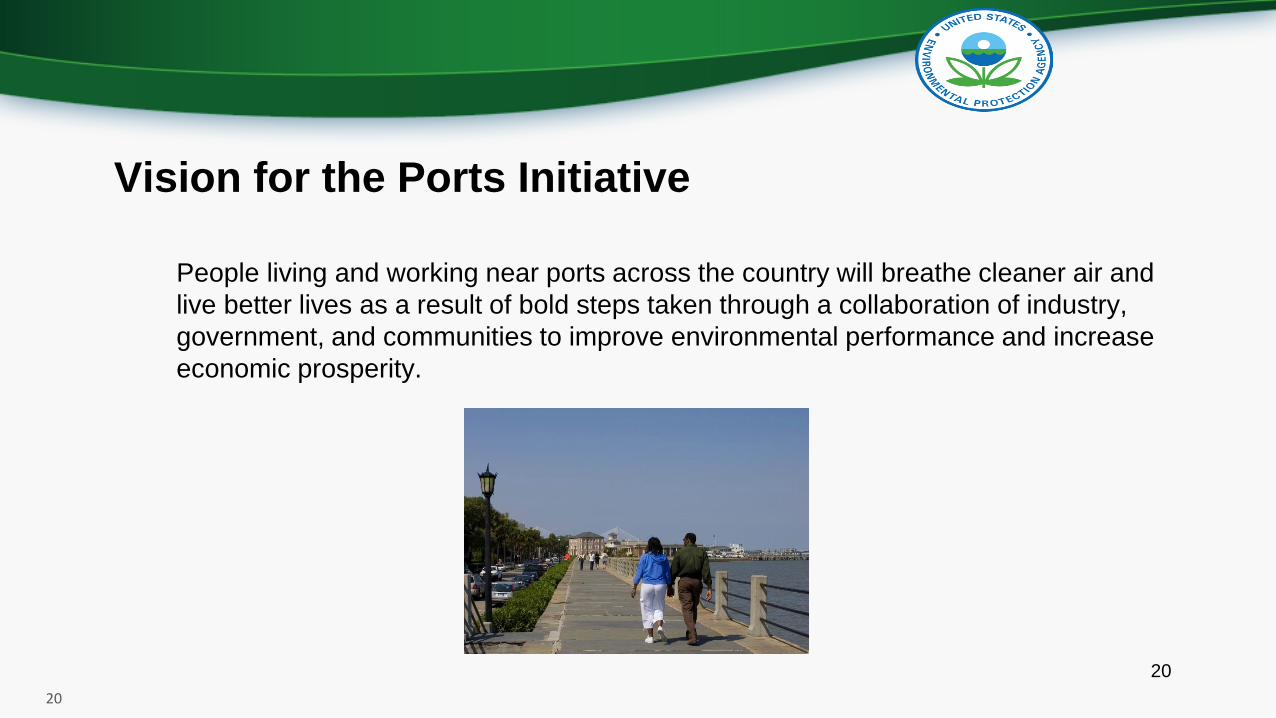
Vision for the Ports Initiative
People living and working near ports across the country will breathe cleaner air and
live better lives as a result of bold steps taken through a collaboration of industry,
government, and communities to improve environmental performance and increase
economic prosperity.
20
20
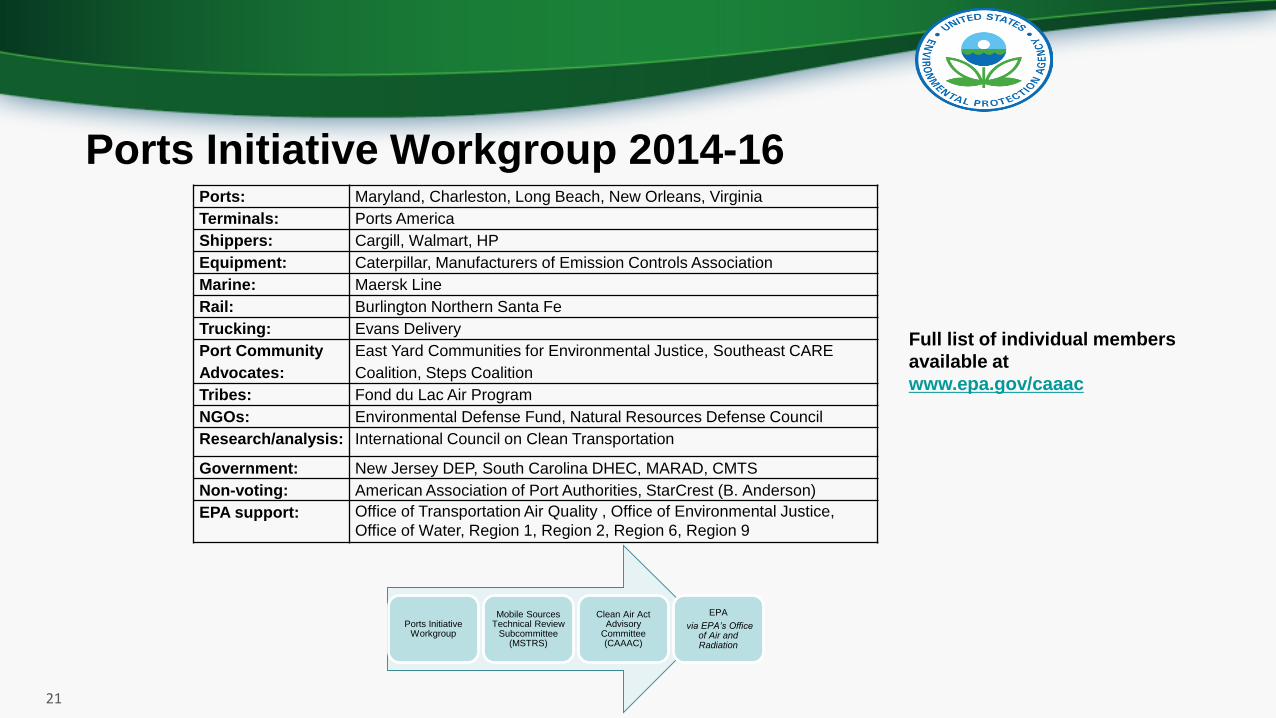
Ports: Maryland, Charleston, Long Beach, New Orleans, Virginia
Terminals: Ports America
Shippers: Cargill, Walmart, HP
Equipment: Caterpillar, Manufacturers of Emission Controls Association
Marine: Maersk Line
Rail: Burlington Northern Santa Fe
Trucking: Evans Delivery
Port Community
Advocates:
East Yard Communities for Environmental Justice, Southeast CARE
Coalition, Steps Coalition
Tribes: Fond du Lac Air Program
NGOs: Environmental Defense Fund, Natural Resources Defense Council
Research/analysis: International Council on Clean Transportation
Government: New Jersey DEP, South Carolina DHEC, MARAD, CMTS
Non-voting: American Association of Port Authorities, StarCrest (B. Anderson)
EPA support: Office of Transportation Air Quality , Office of Environmental Justice,
Office of Water, Region 1, Region 2, Region 6, Region 9
Ports Initiative Workgroup 2014-16
Ports Initiative Workgroup
Mobile Sources Technical Review
Subcommittee (MSTRS)
Clean Air Act Advisory
Committee (CAAAC)
EPA
via EPA’s Office of Air and Radiation
Full list of individual members
available at
www.epa.gov/caaac
21
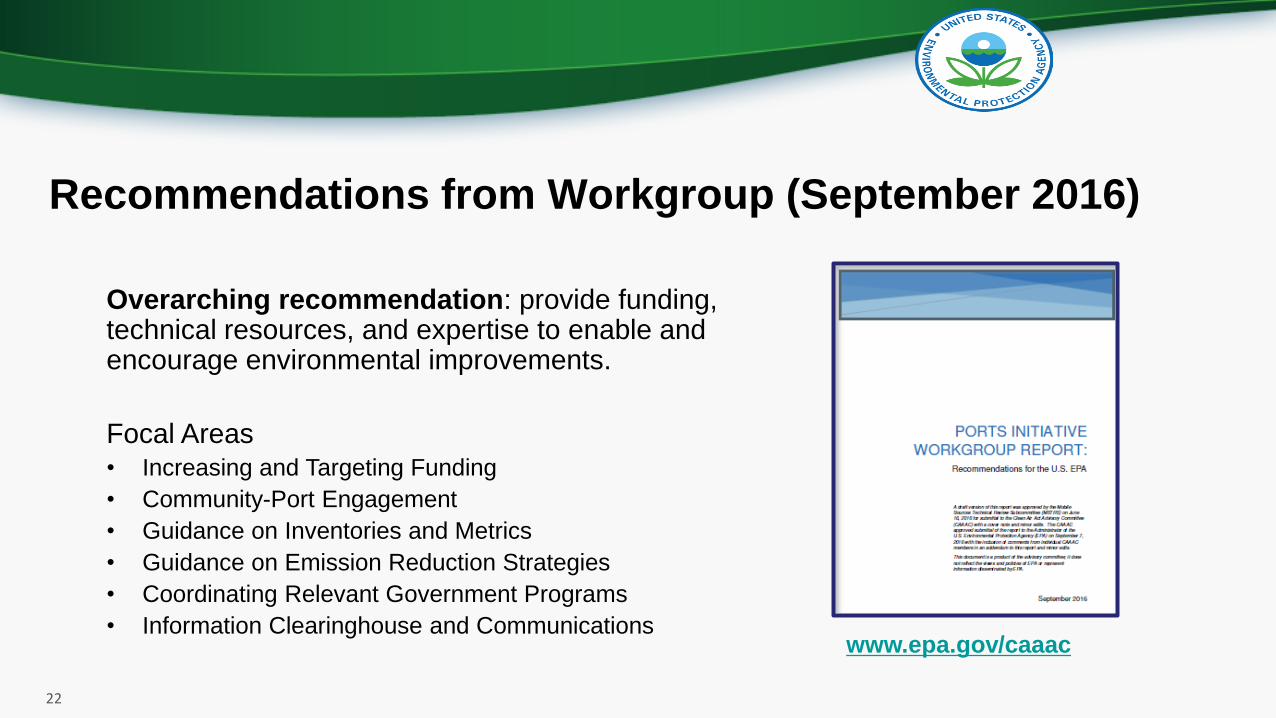
Recommendations from Workgroup (September 2016)
Overarching recommendation: provide funding, technical resources, and expertise to enable and encourage environmental improvements.
Focal Areas• Increasing and Targeting Funding
• Community-Port Engagement
• Guidance on Inventories and Metrics
• Guidance on Emission Reduction Strategies
• Coordinating Relevant Government Programs
• Information Clearinghouse and Communicationswww.epa.gov/caaac
22
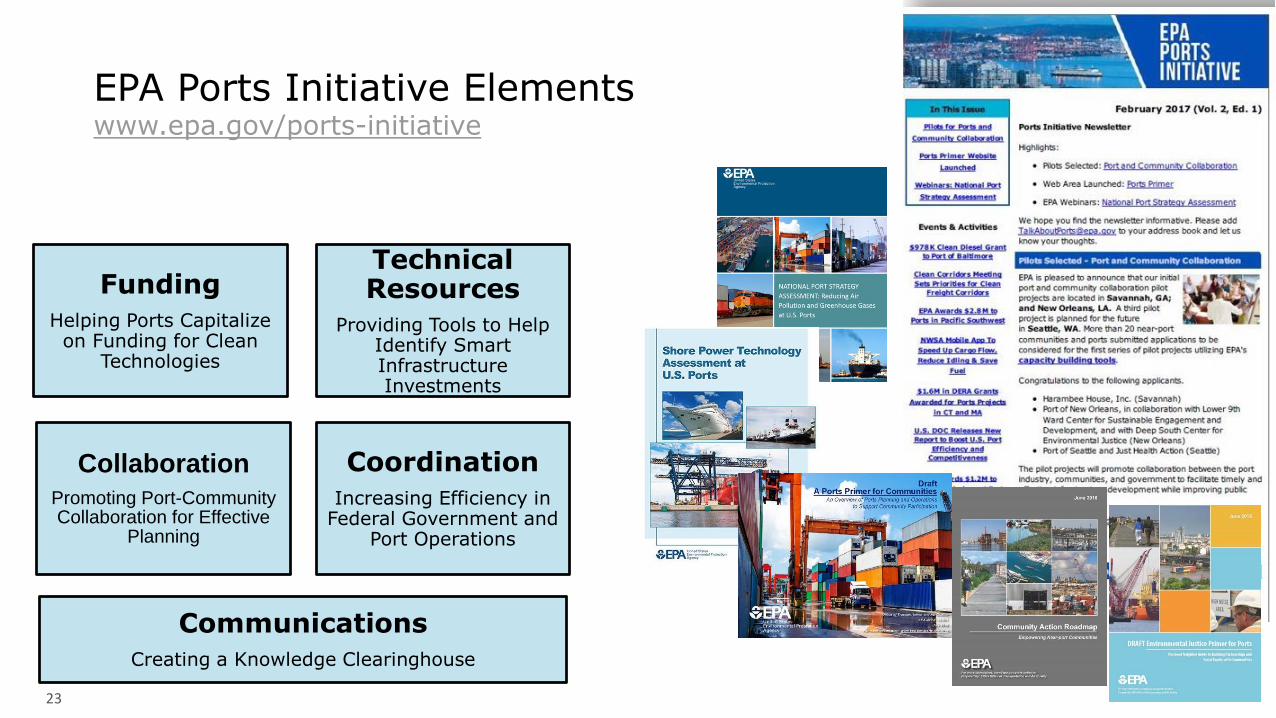
EPA Ports Initiative Elements www.epa.gov/ports-initiative
23
Funding
Helping Ports Capitalize on Funding for Clean
Technologies
Technical Resources
Providing Tools to Help Identify Smart Infrastructure Investments
Collaboration
Promoting Port-Community Collaboration for Effective
Planning
Coordination
Increasing Efficiency in Federal Government and
Port Operations
Communications
Creating a Knowledge Clearinghouse
23
Thank you
2424