supply chain leadership collaboration (sclc) pilot results ... chain... · supply chain leadership...
TRANSCRIPT

Supply Chain Leadership Collaboration (SCLC) Pilot Supply Chain Leadership Collaboration (SCLC) Pilot Results and Findings Report Results and Findings Report May 2008 May 2008
Contact: Frances Way Account Manager, Supply Chain Carbon Disclosure Project Office: +44 20 7415 7095 [email protected] www.cdproject.net
Prepared by:
2000 North 14th Street Suite 230 Arlington, VA 22201 www.clearcarbonconsulting.com Ph: 571-527-4180

Carbon Disclosure Project– SCLC Pilot Results and Findings Report Page 2 of 30
Results of the CDP Supply Chain Leadership Collaboration
Executive Summary The Carbon Disclosure Project’s (CDP) Supply Chain Leadership Collaboration (SCLC) is an effort to help companies better understand the climate impacts within their supply chains. Twelve companies (members) participated in a pilot collaboration launched in October 2007 and completed in February 2008. Members distributed surveys to 328 suppliers, requesting information on their climate change initiatives. Forty-four percent of suppliers solicited responded. A particularly noteworthy finding was that, of the 144 responding suppliers, 95 companies submitted information to CDP for the first time. The number of new reporters is evidence of how supply chain initiatives can create excellent penetration into industry for broader disclosure on climate change planning.
SCLC Pilot Members Cadbury Schweppes Proctor & Gamble Dell PepsiCo Hewlett-Packard Prudential Imperial Tobacco Reckitt Benckiser L’Oréal Tesco Nestlé Unilever
The SCLC survey is a successful first step in creating a consistent approach for suppliers to report their climate change efforts to their customers and other stakeholders. The number of companies becoming a part of SCLC demonstrates that there is a growing interest from businesses to gain a better understanding of the climate impacts of their supply chain. The survey responses are useful as a baseline for members to understand the preparedness of suppliers to address climate change issues and to increase their knowledge of supply chain greenhouse gas emissions. Survey responses reveal participating companies generally have an understanding of the potential risks from climate change. A smaller number of responders (58%) have assessed their risk through completion of a greenhouse gas (GHG) inventory of their operations, and even fewer companies (33%) have an understanding of their indirect climate emissions, including supply chain impacts. Although many survey responders are still in the early stages of addressing the climate issue, they are willing to share information regarding their climate change activities and appear committed to increasing their efforts in the future. The challenge for the next phase of the SCLC is how to effectively scale the effort to include a larger number of participating companies and improve the quality of survey responses. The SCLC pilot did reveal some findings that could aid in both improving the number and quality of responses.
Key Findings and Recommendations: • Initial findings show that response rates to the survey are higher where members distributed the survey directly
themselves rather than CDP. • Based on SCLC members’ experiences, coordination with suppliers in advance of survey distribution appears
to significantly increase response rates. • Survey results also show that suppliers that received a survey from more than one member had a much higher
response rate (68%) than the average response rate of 44%. As SCLC membership grows, suppliers will be more likely to get survey requests from multiple customers.
• Given that many supplier companies are new to GHG reporting and strategy, a logical first area of focus should be to understanding their Scope 1 (Direct) and Scope 2 (Indirect from electricity, heat, and steam purchases) emissions. Once they have assessed the climate impacts of their operations, they can expand efforts to their supply chain and other Scope 3 (other indirect) emissions.

Carbon Disclosure Project– SCLC Pilot Results and Findings Report Page 3 of 30
Background In October 2007, the CDP created the SCLC with the aim of creating a standardized process for supply chain reporting of carbon emissions, risks, opportunities and strategies. The SCLC seeks to address the increasing focus on carbon impacts of corporate supply chains, where, for many sectors, the majority of GHG emissions are generated. Corporations require better information to develop and deliver robust and effective carbon management strategies into supply chain decisions. Using the CDP process, which is the established global system for disclosing carbon emissions and related climate change issues, purchasers are now able to better understand the emissions embedded within their individual and shared supply chains. A few similar initiatives, launched in the last year, have contributed to a growing interest in understanding the carbon associated with product supply chains. In 2007, Wal-Mart. in partnership with CDP, piloted an effort to work with suppliers from seven product categories to measure the carbon embedded in their products. Four of the SCLC members participated in the Wal-Mart pilot. A second phase of this effort, working with a number of additional product categories, will begin this summer. Tesco also launched an effort last year to develop a carbon label for the products sold in their stores. They are working with the UK-based Carbon Trust, Defra, and the British Standards Institute to develop a carbon measurement standard. The pilot phase of the SCLC launched with 12 member companies. Each member made a commitment to request that up to 50 of their suppliers complete the CDP questionnaire including additional supply chain-related questions. Surveys were distributed in December 2007 with a response deadline of the end of February 2008. The SCLC questionnaire has three sections. Section A asks suppliers for information about their overall knowledge of climate change and how it affects their company operations. The questions target acknowledgement of risks, opportunities, reduction targets, and emissions quantification methodology. Additionally, Section A inquires about Scope 1 (Direct), Scope 2 (Indirect), and Scope 3 (Other Indirect) GHG emissions. Section B asks for a detailed breakdown of emissions by country, participation in carbon emission trading schemes, a description of their reduction program and the responsibility for climate change within the company. Questions in Section C target information on companies’ supply chains and product-level detail. Requests include how many suppliers they have, a breakdown of other types of Scope 3 emissions, and challenges and successes with addressing emissions in the supply chain. A copy of the full SCLC questionnaire is in Appendix A. To review and analyze results, CDP retained Clear Carbon Consulting, located in the State of Virginia, USA. Clear Carbon Consulting, referred to as the “Report Team” hereafter, evaluated the survey responses and interviewed the SCLC members to capture a complete picture of the pilot effort’s results. This report includes a detailed analysis of the SCLC pilot and recommendations for the next phase of the Collaboration. The Report Team’s evaluation approach included categorizing the information collected for each question and quantifying results, providing comparisons, revealing trends, and offering explanatory insights from dialogue with members. More than half of the members were interviewed directly by the Report Team to gain insights into their involvement in the SCLC. Additionally, the Report Team also drew upon the findings of interviews with the 12 members conducted by CDP staff at the beginning of the SCLC pilot.
SCLC Pilot Approach The survey, designed by CDP in partnership with the 12 member companies, was distributed to suppliers selected by each member. To select suppliers for the pilot, each member developed their own approach. Some members wanted to survey a broad spectrum of suppliers. Others distributed the survey to suppliers they believed were most likely to provide a response because they had already begun to address the climate change issue. For distributing the surveys, the members used their discretion to select one of two approaches. Companies either sent the surveys themselves, or CDP sent the survey directly to the members’ suppliers.

Carbon Disclosure Project– SCLC Pilot Results and Findings Report Page 4 of 30
SCLC pilot members: • Cadbury Schweppes • Proctor & Gamble • Dell • PepsiCo • Hewlett-Packard • Prudential • Imperial Tobacco • Reckitt Benckiser • L’Oréal • Tesco • Nestlé • Unilever
Goals and Expected Benefits SCLC members each joined the initiative for a variety of reasons. The most common expectation among the members is to gain from participation a better understanding of their suppliers’ climate change management efforts and the opportunity to create a consistent approach for collecting climate change information from suppliers. A full list of reasons for participation includes:
“The CDP Supply Chain Leadership
Collaboration Pilot helped create
momentum and awareness of the
need for suppliers to disclose carbon
within the supply chain.” • Gain a better understanding of what suppliers are doing
Jay Celorie, Global Program
Manager of Supply Chain Energy,
HewlettPackard
• Harmonize the approach with suppliers • Improve information on supply chain climate impacts • Ensure consistency and minimize reporting burden for
suppliers • Engage suppliers in a dialogue about how to reduce their
climate impacts • Identify and focus attention on key supply chain impacts • Maintain/improve corporate reputation • Encourage suppliers to measure emissions • Understand the greatest impacts within the supply chain • Enable reporting of supply chain emissions • Be a CDP leader • Support CDP
Survey Response Rate The 12 SCLC members sent surveys to 383 selected suppliers asking their participation in the pilot. As one might expect with members being large companies and in some cases within the same industries, 41 supplier companies received a survey request from more than one member. Therefore, SCLC members asked 328 unique suppliers to participate. One hundred and forty-four (144) suppliers responded by providing information to the survey, a 44% response rate. The 44% response rate is equal to the response rate of the CDP1 questionnaire in 2003. Interestingly, the suppliers that received surveys from more than one member had a substantially higher response rate of 68%. This higher response rate demonstrates that the more demand a company has from its customer base to address climate risk, the more likely they are to take action. A striking result of the survey is that 95 out of the 144 responders submitted information to CDP for the first time demonstrating the potential of the SCLC to increase disclosure of carbon information along corporate supply chains. Forty-two (42) suppliers registered their company information on the CDP website but never provided survey information. It is unclear why these suppliers never submitted survey information. They may have been interested in the survey but could not complete it due to time constraints.
A striking result of the survey is that 95 out of the 144 responders submitted
information to CDP for the first time.
Figure 1. Response rates for SCLC questionnaire.

Carbon Disclosure Project– SCLC Pilot Results and Findings Report Page 5 of 30
Through its interview with Dell, the Report Team detailed an exceptional supply chain initiative. The Dell Corporation had a 100% supplier survey response rate, while no other member had better than a 75% response rate. A case study describing the Dell initiative is provided below.
How did Dell get a 100% survey response rate? In 2007, the Dell Corporation launched a company-wide initiative to achieve “carbon neutrality” of its worldwide operations. This climate policy focuses on minimizing both direct and indirect emissions, including those from supplier operations and customer product use. The initiative will also work to maximize the energy efficiency of Dell products and over time to offset their carbon impact. Efforts to engage their supply chain in the zero carbon initiative started in mid-2007. Dell requested its major suppliers to identify and report their emissions as part of a commitment to help suppliers reduce emissions. Suppliers risk having their overall scores reduced during Dell quarterly business reviews for not identifying and publicly reporting GHG emissions. The scores earned on reviews can affect a supplier’s volume of Dell business. Dell will work with suppliers on emissions reduction strategies once data is collected. The SCLC pilot was included as part of Dell’s overall supplier engagement initiative. In a workshop in mid-2007, the suppliers were notified that they would be receiving a CDP survey request. Dell made the decision to distribute the survey on behalf of CDP to emphasize to suppliers the importance of the initiative. By the time the SCLC survey arrived in December, suppliers had six months to prepare and already understood the importance Dell placed on the survey. While other SCLC members took weeks to identify the appropriate supplier contacts, Dell already had a contact list from their established ISO14001 program. Dell’s procurement representatives were able to distribute the survey to appropriate supplier contacts significantly earlier than other SCLC members, giving their suppliers more time to complete the survey. After e-mailing the survey to appropriate contacts, Dell followed up with reminders and tracked supplier reporting activity through the CDP reporting system. Although Dell did not require suppliers to respond to the SCLC survey, they achieved a surprising 100% supplier response rate. Dell’s commitment to their supplier engagement initiative, their early notification of a forthcoming survey at their supplier workshop, and their quick distribution of the survey to appropriate contacts all contributed to their impressive results.
Responding suppliers represent a variety of industries and range from small businesses (less than 100 employees) to large corporations with thousands of employees. A full breakdown of the industries represented in the survey is in Appendix B (Table 1). The table below shows the size of companies represented in the SCLC pilot and their corresponding response rate. Response rates by company size may indicate that larger companies have more resources available to complete the survey and have also previously received requests from their customers for climate information, making themselves better prepared to respond. However, the sample size, in particular for small companies, is too small to draw definitive conclusions. It is important to note that for the pilot SCLC survey, members tended to focus on their larger suppliers, resulting in a smaller percentage of solicitations to small companies for survey responses.

Supplier Makeup Total Number of Companies Surveyed
Number Suppliers who Responded
Response Rate
Large Companies (greater than 1000 employees) 120 64 53%Medium Companies (101 – 1000 employees) 189 77 41%Small Companies (less than 100 employees) 19 3 16%
Table 1. Size of suppliers responding to the SCLC survey and their response rates. Overall, there is a higher response rate for Section A questions (Climate Change Risk, Opportunities, and Strategy), than Section B (Additional GHG Emissions Accounting) and C (GHG Emissions Analysis). Table 2 describes the number of responses for each question out of the 144 total suppliers that submitted a survey. Section A questions have an average response rate of 60%, Section B 42%, and Section C 28%. The response rates reflect the typical carbon management continuum of companies. Companies generally assess risks first, perform GHG emission accounting to get a detailed picture of their impacts, set targets to measure progress, and then evaluate reduction opportunities and implement projects. Once companies have a handle on the management of their internal GHG footprint, they begin to evaluate impacts and implement reduction activities along their supply chain. Considering all 328 of the companies that received the survey, only 12% of the suppliers responded to Section C questions, indicating that few suppliers are ready to respond to questions about their respective supply chains’ emissions. In spite of the few companies that currently provide responses to Section C questions, many companies intend to obtain supply chain information in the future. A surprising 41 responders indicate they are planning to engage their suppliers in greenhouse gas emission reduction strategies. This level of interest within the supplier base coupled with the 12 member companies illustrates the growing interest in supply chain carbon emissions and management.
A surprising 41 responders indicate they are planning to engage their suppliers in
greenhouse gas emission reduction strategies.
Table 2. Individual question response rates for SCLC questionnaire.
Carbon Disclosure Project– SCLC Pilot Results and Findings Report Page 6 of 30

Carbon Disclosure Project– SCLC Pilot Results and Findings Report Page 7 of 30
Evaluation of the Responses
SECTION A Climate Change Risks, Opportunities and Strategy Most responding companies have evaluated the risks climate change poses to their company. Suppliers indicated they have assessed both regulatory and physical risks. Many companies (77% of respondents) see some type of GHG regulation(s) as a future risk for their company. The next most commonly reported risk is price increases in energy and raw materials. Extreme weather and its effects on the company is the biggest physical risk to suppliers. Companies see extreme weather causing problems with energy or water availability, destruction of company property, and other adverse affects slowing productivity. Raw material shortages from changes in climate or weather are also a worry for many of the companies surveyed. The suppliers in the food industry were particularly sensitive to the future availabilities of crops serving as raw materials. Based on response rates, companies have a more immediate concern about regulatory risks than physical risks. This speaks to the concern of businesses to address short-term impacts, versus less predictable and long-term impacts even though these may be on a larger scale. Answers to questions on risks indicate that while companies understand how regulations affect them directly and indirectly, they have less understanding of how the physical impacts of climate change will affect them directly and indirectly. The tables below show supplier responses to questions on regulatory and physical risks.
Question 1.a.i. What regulatory risks associated with government policy affect your company?
Regulatory Risks Number of Suppliers Percent of supplier responses (out of 144)
Suppliers reporting regulatory risks 138 96%No response 6 4%
Breakdown of Regulatory Risks Identified Percent of supplier responses (out of 138)
Taxation, emission limits, emission trading 106 77%Energy/material price increases 16 12%Perfluorocompound (PFC) limits 2 1%Other: Process change mandates, Product end use rules
Table 3. Supplier responses to regulatory risks associated with climate change. Question 1.a.ii. What are the physical risks to your company from climate change?
Physical Risks Number of Suppliers Percent of supplier responses (out of 144)
Suppliers reporting physical risks 126 87%No response 18 13%
Breakdown of Physical Risks Identified Percent of supplier responses (out of 126)
Extreme weather 60 48%Raw material availability 29 23%Energy/water availability 19 15%In development 7 6%
Table 4. Supplier responses to physical risks associated with climate change. Suppliers report various opportunities presented by climate change mitigation strategies. The companies list savings from energy reduction as the biggest opportunity. Suppliers also see production of energy efficient and/or new environmental products as opportunities for the future. For example, there are opportunities to produce more energy efficient computer components. Other suppliers indicated they are looking at reducing the weight of products and/or

Carbon Disclosure Project– SCLC Pilot Results and Findings Report Page 8 of 30
packaging to be more efficient and reduce the waste and fuel-use that impacts shipping costs. A table showing climate change opportunities identified by suppliers is below.
Question 1.b. What commercial opportunities does climate change present to your company for both existing and new products and services?
Opportunity Number of Suppliers
Percent of supplier responses (out of 144)
Energy cost reduction 46 32%Energy efficient products 34 24%New environmental product 12 8%Renewable energy sources 9 6%Packaging solutions 8 6%Carbon credits 4 3%Increased product use from warming 4 3%Logistics solutions/local sourcing 3 2%Telecommuting 1 1%No response 36 25%36 Suppliers only addressing energy cost reductions and not addressing other opportunities (25% of suppliers).
Table 5. Supplier climate change commercial opportunities. The majority of suppliers have projects in place to reduce GHG emissions. Based on responses from suppliers to question 1.c, many companies are engaging in energy consumption reduction programs (58%). A table showing the strategies suppliers have in place to reduce risks and take advantage of opportunities is below. Based on the responses to question 1.c., there is an indication that many of the suppliers are in an early stage of addressing climate change. To this point, more than a third of the companies do not respond to this question or respond that they are still exploring their current position. Additionally, forty-six (46) companies are only pursuing strategies to reduce energy consumption, which is typically a first step in addressing GHG emissions.
Question 1.c. Please detail the objectives and targets of the strategies you have undertaken or are planning to take to manage these risks and opportunities.
Strategy Number of Suppliers
Percent of supplier responses (out of 144)
Energy consumption reduction* 83 58%Alternative fuel use 17 12%Understanding current position 16 11%Alternative or reduced material use 15 10%Improved product efficiency 9 6%New technology/product development 8 6%Travel reductions (telecommuting/local sourcing) 4 3%Diversifying production locations 3 2%PFC Reductions 2 1%No response 30 21%*46 of the suppliers are only using energy consumption reduction as a climate change strategy (32%).
Table 6. Strategies suppliers are using to address climate change at their company. Thirty-two percent (32%) of responders have set some type of reduction target and 26% of suppliers have emissions reduction targets in development. Twenty-nine (29) of the 37 suppliers with targets in development are new CDP responders. This may indicate that the request to participate in the CDP encourages these companies to develop reduction targets. Responders understand that stakeholders expect them to develop a GHG reduction target as part of a credible climate strategy. The most common type of target is an absolute or intensity metric GHG emissions reductions goal. Other targets reported include carbon neutral, PFC reductions, diesel fuel reductions, and reductions from renewable energy use. The table below summarizes the responses regarding types of reduction targets.

Carbon Disclosure Project– SCLC Pilot Results and Findings Report Page 9 of 30
Question 1.d. What are your emissions reduction targets?
Target Areas Number of Suppliers
Percent of supplier responses (out of 144)
GHG emission reductions 38 26%Targets in development* 37 26%PFC reductions 5 3%Carbon neutral 1 1%Diesel use 1 1%Renewable energy use 1 1%No response 62 42%*Of the 37 suppliers with targets in development, 29 are new CDP reporters.
Table 7. Supplier emission reduction target areas.
Greenhouse Gas Emissions Accounting Over half of the suppliers responding to the survey (56%) use the GHG Protocol as their methodology to calculate corporate emissions. The GHG Protocol, developed by the World Resources Institute and the World Business Council for Sustainable Development, is the international standard for how companies measure their GHG emissions. Other suppliers use a wide range of accounting methods including; Carbon Trust, the UK Department for Environment, Food and Rural Affairs (DEFRA) tools, Clean Planet Trust, United Nations Conference on Trade and Development (UNCTAD) methodology, Integrated Pollution Prevention and Control (IPPC) Directive, ISO 14064, Canada’s National Pollutant Release Inventory (NPRI), Dutch CO2 Emission Protocol, British Poultry Meat Federation Climate Change Levy (BPMF CCL), and the Taiwan Semiconductor Industry Association (TSIA) tools. It should be noted, that many of these inventory tools are consistent with the GHG Protocol. Fifty-eight percent (58%) of the suppliers report their Scope 1 and 2 emissions. All but one of these companies is a large or medium sized supplier. Only one small company reports they had measured their GHG Scope 1 and Scope 2 emissions. There is a temptation to draw a conclusion that small companies have less of an understanding of their GHG footprints than larger companies do, but the sample size (three small companies responded to the survey) is too small to come to this conclusion. Of the 42% of the respondents that did not supply Scope 1 and 2 emission data, various reasons account for the non-responses. Some companies find GHG emissions information confidential; others indicate they are working on creating an inventory. For a breakdown of the Scope 1 and 2 emissions, see Appendix B (Table 3.a-c). A majority of responders (65%) report electricity use information. Only 27 suppliers report renewable energy investments. There was no appreciable pattern of renewable energy investments among specific industry sectors, but large companies were responsible for 65% of renewable energy investments reported through the survey. In some cases, suppliers are investing in renewable energy before they have assessed their inventories, set reduction targets or established strategies to address climate change. Of the 27 companies investing in renewables, seven do not have baselines, seven do not have targets (four companies indicate they are in development), and three companies did not indicate a strategy for climate change initiatives. Companies investing in renewables before developing a GHG measurement and reduction strategy are typically interested in reputational benefits and may be missing more financially attractive reduction opportunities. A minority of the responders address Scope 3 emissions. Only 17 companies report they are tracking use/disposal of waste, supply chain, distribution/logistics, and/or business travel emissions. Many of the suppliers indicate difficulty in accessing Scope 3 emissions data. This is an expected result since many responders are in an early stage of addressing their GHG impacts. Companies typically spend a few years understanding the impacts of their internal operations before they assess Scope 3 emissions. A few companies also indicate Scope 3 emissions are a very small part of their total emissions and they do not have the resources to address this aspect of their inventory. The table below shows the types of Scope 3 emissions suppliers report.

Carbon Disclosure Project– SCLC Pilot Results and Findings Report Page 10 of 30
Question 2.c.i-iv. Provide estimates for the following categories of emissions (use/disposal, supply chain, distribution/logistics, and business travel).
Scope 3 Emission Reporting Number of Suppliers
Percent of supplier responses (out of 144)
Distribution/logistics emissions 17 12%Business travel emissions 17 12%Product use/disposal emissions 15 10%Supply chain emissions 8 6%No response 127 88%
Table 8. Supplier estimates of Scope 3 emission categories.
SECTION B Additional Greenhouse Gas Emissions Accounting Fifty-two (52) suppliers (36% of responders) report country-level emissions breakdowns. The suppliers report information on 262 facilities in 49 different countries. For a full list of country emissions data, see Appendix (Table 4). There are 29 companies (20% of responders) participating in the EU Emissions Trading Scheme (ETS). Twenty-seven (27) suppliers have allowances under the National Allocation Plans (NAP). Of those participating in the ETS, five companies see positive profitability impacts, eight see little or no impact, and seven see negative impacts. The other suppliers are still evaluating or decline to comment. Further information on ETS and National Allocation Plan responses are in Appendix B (Table 5).
Greenhouse Gas Emissions Management Fifty-eight percent (58%) of responding suppliers have an established baseline for their GHG reduction program (see Table 6 in Appendix B). Fifty percent (50%) of the companies with a baseline report using 2005, 2006, or 2007. The fact that 50% of the reported baselines were created in the last few years, and that 42% of suppliers have no inventory to date, further indicates that GHG management within the members’ supply chains is still at an early stage. One confusing result of the survey is that 69 companies report that they have a baseline or are working on a baseline, while 117 companies indicate the choice of a GHG measurement methodology. More companies indicating a chosen protocol than reporting a baseline may indicate that companies are currently working on their baseline inventories or that these companies are not confident enough in the approach or results of the inventory to use it as their baseline. Largely driven by the high response to Dell’s inquiries of its supply chain, the computer components industry leads the other industries for established emissions targets. Twenty-two (22) out of 24 computer component companies supplying information have emissions reduction programs in place. No small companies report emissions targets in this survey. An overwhelming number of suppliers with targets aim to meet them in the next 1-5 years (71% of companies with targets). Only two companies indicate they have timeframes for emission reduction longer than 10 years. The tables below show reduction program baselines, reduction targets and timeframes for reaching their targets. Only 39 companies (27% of the responding suppliers) estimate future emissions for their company.

Carbon Disclosure Project– SCLC Pilot Results and Findings Report Page 11 of 30
Question 4.a.ii. What are the emissions reduction targets?
Reduction Program Information Number of Suppliers
Percent of supplier responses (out of 144)
Suppliers Reporting Reduction percentage goal 61 42%No response 83 58%Company Size (by employee: small <100, medium 101-1000, large >1000)
Percent of responses within size category
Large company reduction goals 28 44%Medium company reduction goals 33 43%
Reduction Goals by Industry Sector Percent of responses within industry sector
Computer components 22 92%Food industry & processing 11 34%Chemicals 8 50%Containers & packaging 7 27%Electronic equipment 4 31%Home products 2 33%Semiconductors 2 22%Other: conglomerate, office supplies, real estate services, telecom, vending machines 5
Table 9. Suppliers reporting reduction target percentage goals.
Question 4.a.ii. Over what period do the emissions targets extend?
Reduction Program Information Number of Suppliers
Percent of supplier responses (out of 144)
Suppliers reporting reduction goal timeframe 51 35%No response 93 65%Reduction Timeframe Percent of responses (out of 51)1 to 5 years 36 71%5 to 10 years 10 20%Over 10 years 2 4%No timeframe 3 6%
Table 10. Suppliers reporting reduction target timeframe to reach goals. Less than 20% of the suppliers participate in emissions trading schemes. They participate across a variety of programs as shown in the table below.
Question 4.b. What is your company's strategy for trading in the EU Emissions Trading Scheme?
Emission Trading Scheme Number of Suppliers
Percent of supplier responses (out of 144)
No trading scheme 117 81%EU ETS participant 27 19%CDM/JI participant 13 9%CCX participant 3 2%Other trading scheme 3 2%RGGI participant 0 0%Other trading schemes: Australian trading scheme, NOx trading in the Houston/Galveston Ozone Non-Attainment area, Climate Change Levy (CCL)
Table 11. Supplier participation in emission trading schemes.

Carbon Disclosure Project– SCLC Pilot Results and Findings Report Page 12 of 30
Only 26% of the suppliers provide emissions intensity measurements. These respondents indicate emissions per unit of production or volume of production as the two most commonly used emissions intensity metrics. The table below shows respondent’s emissions intensity measurements.
Question 4.c. Which measurement best describes your company's emissions intensity performance?
Intensity Unit Number of Suppliers
Percent of supplier responses (out of 144)
Suppliers reporting intensity measurements for emissions 38 26%No response 106 74%
Intensity Measurement Percent of responses (out of 38)
Units of product 14 37%Volume of production 10 26%Unit of sales 6 16%Weight of production 4 11%In development 4 11%
Table 12. Supplier emission intensity measurements.
4.d. What percentage of your total operating costs does energy represent?
Energy Consumption Number of Suppliers
Percent of supplier responses (out of 144)
Suppliers reporting energy as percentage of operating costs 45 31%No response 99 69%
Percentage of Operating Costs Percent of supplier responses (out of 45)
0-5% 26 58%5-10% 13 29%10-20% 4 9%Over 20% 2 4%
Table 13. Supplier percentage of energy in operating costs. Fifty-six (56) companies (39%) supply information on their total cost of energy consumption in question 4.d. However, the data was generally not reported clearly and currency was not provided, making it difficult to analyze this information. Some companies indicate energy costs are proprietary information and cannot disclose the amounts. Of the reporting suppliers, 45 companies provide the percentage of operating costs that come from energy. The average of energy costs as a percentage of total operating costs is 6% and percentages range from 0.01% for a container and packaging company to 37% for a computer component company.
Climate Change Governance More than a third of the responding companies have a member of the Board of Directors responsible for climate change. Another third of the respondents report an Environment, Health, and Safety (EH&S) or Corporate Social Responsibility (CSR) committee as the responsible organization for climate change. The table below shows the full results of the survey responses.

Carbon Disclosure Project– SCLC Pilot Results and Findings Report Page 13 of 30
Question 5.a.i. Which Board Committee or other executive body has overall responsibility for climate change?
Climate Change Responsibility Number of Suppliers
Percent of supplier responses (out of 144)
Suppliers reporting responsibility roles 103 72%No responses 41 28%
Responsible Units Percent of responses (out of 103)
Board of Directors 37 36%EHS/CSR committee 31 30%Senior manager 15 15%Management team 9 9%Other committee 5 5%In development 5 5%Plant manager 1 1%
Table 14. Supplier management structure for climate change responsibilities. Forty-nine percent (49%) of the suppliers report their companies review the status of their climate change initiatives through various mechanisms. Many companies integrate climate change initiatives review with their ISO 14001 management review meetings or other environmental committee meetings. Other companies indicate it is an agenda item for Board meetings. Annual review meetings for the entire company are also a mechanism used to review climate change programs. Thirty-two (32) companies (22%) have performance reviews or appraisals for their managers tied to goals set in their climate change programs. The table below shows supplier responses to the mechanisms used to review climate change programs.
Question 5.a.ii. What is the mechanism by which the company reviews climate change progress?
Climate Change Responsibility Number of Suppliers
Percent of supplier responses (out of 144)
Suppliers reporting mechanisms 71 49%No responses 73 51%
Reporting Mechanisms Percent of responses (out of 71)
Other regularly scheduled meetings (e.g. ISO 14001 management reviews, environmental board meetings) 23 31%Corporate annual reviews 16 23%In development 11 16%Board of Director meetings 8 11%Monthly meetings 7 10%Bi-yearly reviews 6 9%
Table 15. Supplier mechanisms to review climate change performance.
SECTION C Greenhouse Gas Emissions Analysis Many suppliers indicate they are working on breaking down emissions calculations into various business segments and provide many reasons why they currently are not able get to that level of detail. The high level of interest in future business segment reporting, including at the product level, may be an indication that the SCLC encourages the survey respondents to expand their GHG measurement activities to include their supply chain. Some companies stated they produce multiple products within one facility and it would be difficult and expensive to sub-meter the entire facility to get individual product line emissions. Others indicate resources do not exist to collect or analyze the data needed to get to that level. A majority of the respondents (68%) are able to breakdown emissions to

Carbon Disclosure Project– SCLC Pilot Results and Findings Report Page 14 of 30
the factory or facility level. A few companies indicate the ISO 14064 – Greenhouse Gas Accounting standard only requires facility level data and they have not gone beyond what is required in that standard. Some companies state they are engaging in future efforts to look at the life cycle impacts of products to reveal product-level GHG impacts. The tables below show the responses to supplier’s ability to break down emissions data and the challenges they face breaking down emissions data.
Question 6.a.i. Are you able to breakdown your Scope 1 & 2 emissions by the following (business division, business unit, factory, product group, product line, or SKU)?
Emissions Breakdown Ability* Number of Suppliers
Percent of supplier responses (out of 144)
Suppliers reporting emission breakdown ability 80 56%No response 64 44%Smallest Unit Suppliers Breakdown Emissions
Percent of responses (out of 80)
Factory/facility 54 68%Business division 6 8%Product line 6 8%Country 4 5%Product group 4 5%Business unit 3 4%SKU 3 4%*Smallest unit that suppliers can break emissions down to are displayed.
Table 16. Supplier breakdown of Scope 1 and 2 emissions into business segments.
Question 6.f. What are the challenges that prevent you from being able to breakdown emissions?
Emission Challenges Number of Suppliers
Percent of supplier responses (out of 144)
Suppliers reporting emission challenges 63 44%No response 81 56%
Main Challenges Percent of responses (out of 63)
Ability to get to product level info 21 33%General measurement issues 13 21%Data capture systems 8 13%Identifying high energy uses 5 8%Manpower/resources 5 8%
Table 17. Supplier challenges for breaking down Scope 1 and 2 emissions. Suppliers do not answer questions 6.b. (Using your preferred basis above for splitting emissions what are the five biggest emitting groups for your company?), and 6.c. (Please explain your methodology (including units of measure) for allocating emissions to the groups you have been able to do this for) thoroughly enough to fully analyze. Only 21 companies supply a breakdown of their top five biggest emitting groups. Of these 21, some do not provide units for the emissions and some do not provide output amounts. A few companies in the feedback section report that they need more guidance on question 6. Only 28% of the respondents supply information on their major sources of GHG emissions. Ninety percent (90%) of the companies responding to this question indicate electricity as a major GHG source. A little less than 50% also have natural gas and other on-site fuels reported as major emission sources.

Disclosure in Your Supply Chain Eighty-four or 58% of the survey responders report the number of companies who supply them. Eighty-six percent (86%) of those companies have over 100 suppliers of their own. However, companies report that 80% of their supply chain impact comes from only 100 or fewer suppliers. Seventeen companies know some of their suppliers who also completed the CDP5 questionnaire. Of the companies who know the size of their supply chain, three companies have strategies in place to engage their suppliers on GHG emissions and 41 companies have strategies in development. The large number of companies with strategies in development is an indication that the CDP SCLC encourages respondents to seek GHG information from their suppliers. Further information on the supply chain is in Appendix B (Table 7.a-b).
While only three companies report that they have strategies in place to
engage their suppliers on their GHG emissions, a surprising 41 responders indicate they have a strategy to engage
suppliers in development.
Question 7.c. Do you have a strategy for engaging your suppliers on their GHG emissions?
Supplier Engagement Strategy Number of Suppliers
Percent of supplier responses (out of 144)
Suppliers Reporting how they engage climate change issues with their suppliers 47 33%No response 97 67%Strategies Percent of responses (out of 47) In development 41 87%Supplier questionnaires 5 11%Meetings 1 2%7.d. How many of your suppliers completed a CDP5 questionnaire? 17 Suppliers know if their suppliers are CDP reporters (12%).
Table 18. Supplier strategy for engaging suppliers in GHG emissions reductions.
Scope 3 Emissions Only 33% of companies surveyed report they track any Scope 3 emissions. Nineteen (19) companies indicate they are developing Scope 3 emissions reporting in the future. Two suppliers also state Scope 3 is a small portion of their total emissions and do not have the resources to address Scope 3 at this time. Energy intensive companies state their reluctance to calculate Scope 3 in the feedback section because it is a small proportion of their total emissions.
Only ten percent (10%) of the responders can breakdown their Scope 3 emissions to
some level within their company.
The most commonly tracked Scope 3 emissions are business travel and distribution/logistics. Only 10% of the responders can breakdown their Scope 3 emissions to some level within their company. No companies surveyed can breakdown emissions to the SKU level. Most companies tracking Scope 3 indicate data comes from internal databases. About a dozen suppliers report that lack of access to data and the resources to collect and analyze data limit supplier’s ability to calculate these emission sources.
Carbon Disclosure Project– SCLC Pilot Results and Findings Report Page 15 of 30

Carbon Disclosure Project– SCLC Pilot Results and Findings Report Page 16 of 30
Question 8.a. Do you track Scope 3 emissions (use/disposal, supply chain, distribution/logistics, and/or business travel)?
Tracking Emissions Number of Suppliers
Percent of supplier responses (out of 144)
Suppliers reporting which Scope 3 emissions they track 48 33%No response 96 67%Emissions Tracked Percent of responses* Business travel 19 40%In development 19 40%Distribution/logistics 16 33%Use/disposal 5 10%Supply chain 4 8%
Table 19. Suppliers tracking Scope 3 emissions. *Responders have the option to provide more than one response.
Question 8.b. Are you able to breakdown Scope 3 emissions by any of the following categories (business division, business unit, factory, product group, product line, SKU)?
Scope 3 Breakdown Ability Number of Suppliers
Percent of supplier responses (out of 144)
Suppliers reporting ability to breakdown Scope 3 emissions 15 10%No response 129 90%Breakdown Ability Percent of responses* Factory/facility 6 40%Product line 4 27%Business division 3 20%Business unit 1 7%Product group 1 7%SKU 0 0%8.c. What methodology do you use to track or calculate Scope 3 emissions? 18 companies reported their methodology for tracking Scope 3. All but one use internal databases, the other supplier reported using employee surveys. Table 20. Supplier breakdown of Scope 3 emissions.*Responders have the option to provide more
than one response Question 8.d. What challenges do you see in calculating and being able to breakdown Scope 3 emissions?
Scope 3 Challenges Number of Suppliers
Percent of supplier responses (out of 144)
Suppliers reporting ability to breakdown Scope 3 emissions 31 22%No response 113 78%
Main Challenges Percent of responses (out of 31)
Access to data 12 39%Resources 10 32%Logistics 4 13%Methodology 4 13%Data reliability 3 10%
Table 21. Supplier challenges to calculating Scope 3 emissions.

Carbon Disclosure Project– SCLC Pilot Results and Findings Report Page 17 of 30
Innovating to Reduce Greenhouse Gas Emissions from Product Life Cycles Suppliers indicate they are pleased to have the opportunity to participate in the SCLC pilot effort. Companies also indicate they plan to continue their efforts in greenhouse gas reduction, improving the energy efficiency of their products and producing new environmental products for the market. Eleven companies also report they are working on life cycle analyses of their products. These suppliers hope the life cycle analysis will improve their future CDP responses. The table below shows the plans and successes of the respondents.
Question 9.a. List major successes and future opportunities to reduce GHG emissions.
Success Stories/Future Plans Number of Suppliers
Continued GHG reduction 27 Efficient/greener products 21 Product LCAs 11 Efficient packaging solutions 10 Renewable project investment 2 Business travel reduction program 2 Starting emissions calculations 2 Other: ETS participation, green product substitutions, sustainable supplier selection
Table 22. Supplier GHG emission reduction success and future opportunities.
Further Information In this section, nine suppliers let CDP know where to find more information about their corporate sustainability initiatives or why they do not have information at this time for the survey. Some suppliers note that they are still working on their emission calculations and that is why they are unable to provide information at this time. Other suppliers provide their website to direct reviewers to more information included on that site.
Feedback The feedback section provides comments from suppliers on how to improve the SCLC questionnaire in the future. The most common feedback is that the survey is difficult for the company to fill out because it is too lengthy, there are not enough resources available to complete data, and the data is not available for the questions asked. The suppliers are also interested in seeing results of this survey. The table below summarizes the survey feedback.
Question 11. Please provide feedback on the questionnaire.
Feedback/Suggestions Number of Suppliers
Difficult to complete 8 Too technical (need terminology/help) 5 Supplier interested in results 4 Helped understand Scope 3 emissions/GHG calculations 3 Chinese version needed 3 Hard to complete (company too big/too many suppliers) 2 Scope 3 not necessary for energy-intensive company 2 Clearer scope, duplicate questions 1 LCA based questions instead of Scope 1-3 1 Responded to CDP5 and will do CDP6 didn't see need for this 1 Separate questions for manufacturers and service suppliers 1
Table 23. Supplier feedback to SCLC questionnaire.

Carbon Disclosure Project– SCLC Pilot Results and Findings Report Page 18 of 30
Summary of Survey Results The active participation of members and suppliers in the SCLC pilot demonstrates the growing interest from companies to gain a better understanding of the climate impacts of their supply chain. The pilot survey responses are a useful baseline for members to see where suppliers stand on climate change issues and their knowledge of greenhouse gas emissions within their supply chains. Many responders appear willing to share information regarding their climate change emissions and strategy and appear committed to increasing their climate change efforts in the future. The SCLC pilot is a successful first step in creating a consistent approach for suppliers to report their climate change efforts to their customers and other stakeholders. A consistent approach to collecting carbon supply chain information is valuable to minimize the burden for suppliers to report their emissions to their customers and to drive greenhouse gas reductions along product supply chains. The pilot’s survey response rate of 44% is the same that the CDP found in the first year they requested disclosure on behalf of investors. This similarity in results may be an early indication that the SCLC will be able to achieve growing participation in the future, as the general questionnaire has achieved over the last 6 years. As with the general questionnaire, the number of responses and the quality of survey responses should increase over time. Similarly, the response rate also indicates that supply chain carbon emissions programs are still in their early stages of development. Based on survey responses, suppliers are in an early stage of addressing climate change. Many companies started measuring their GHG emissions in 2005 or later. Some of the suppliers state they are just beginning to look at GHG emissions and many have just begun using energy reduction efforts to mitigate their climate impact. Only 42% of responders have set targets to reduce emissions and only 33% track any Scope 3 emissions. In addition, only about one third of responders have a member of their Board of Directors responsible for climate change. While many responders are able to supply Section A and B information, few suppliers are able to reply to Section C questions. Only three suppliers are able to provide SKU level data for Scope 1 and 2 emissions, and no responders are able to provide any SKU level data for Scope 3 emissions. The SCLC is therefore an opportunity to educate a large number of additional companies on the potential risks from climate change and encourage them to measure the emissions from their operations and products and implement climate mitigation strategies.
Successes Much has been learned from the pilot phase of the SCLC that will inform and improve the next phase of the initiative. A clear success of the SCLC pilot is the number of new CDP responders. Ninety-five (95) companies who submitted responses to this survey never responded to CDP in the past. Many report that this survey helped them understand the issues they need to address. It does appear that the request to complete the SCLC survey has motivated many companies to increase their efforts to address their climate change risk. Twenty-nine companies report that they have reduction targets in development, 41 companies report that they have efforts to engage their suppliers in development, and 19 companies report that they have efforts to measure Scope 3 emissions in development. Interest from customers about suppliers’ climate change management likely influenced them to initiate these efforts.
Data Gaps Many of the responses to the survey questions are qualitative information, limiting the ability to aggregate the responses and effectively analyze them. The flexibility that the survey provides for responses leads to incomplete answers and no responses to questions without explanation. There is also no information on why some companies did not submit a survey response. Possible reasons for not completing the survey include lack of time and resources to complete the survey and lack of available information. The questions that pose the biggest challenge for suppliers are; 2.c, 6.b, and 8.b where companies are asked about breaking down emissions by either Scope 3 or units within the company. Some companies indicate in the feedback section that they would like more help or guidance on these areas since they are new to CDP reporting.

Responses to some of the survey questions are poor because the suppliers do not understand the questions or do not have enough time to gather the needed data. A typical problem with the reporting of quantitative information is that the reporter does not provide the units of measurement for the data. Additional factors have led to poor quality responses. Some of these include non-native English speaking respondents and lack of familiarity with climate change and greenhouse gas terminology. First-time CDP responders may not have the data readily available resulting in incomplete responses or poor quality data. A small number of companies also state the questionnaire is too long, and requires too much time to fill out properly. Many suppliers have never addressed climate change issues before. However, now that suppliers are familiar with the SCLC questionnaire, the response rate in future years should increase and the quality of responses should improve. Articulating expectations of suppliers will allow them to prepare for future CDP reporting. The one piece of information that few companies are able to supply is emissions broken down by SKU number. This data could be useful for members to fully understand the climate impact of their products and identifying reduction opportunities across their supply chain. The request for this data may result in this information being reported in future years. Already 11 companies are planning to complete product life cycle analyses, which may help produce SKU level emissions data. Forty-one companies are planning to ask their suppliers for their climate change information, which may be useful in performing future SKU level analysis.
Feedback from Members
Carbon Disclosure Project– SCLC Pilot Results and Findings Report Page 19 of 30
SCLC members provided feedback during the pilot and again upon completion. Feedback was collected on members’ experiences’ with the SCLC and recommendations for the second phase of the initiative. The majority of members participated in the early interviews and about fifty percent of the members participated in interviews conducted at the end of the pilot. Feedback gathered from the interviews is tabulated in the Appendix (Table 8). Members of the SCLC report that the pilot allows members to engage their suppliers on climate change management with the backing of CDP. This collaboration gives members a consistent approach to collect the information and strengthen the drivers for suppliers to report information. Members gain a better understanding of their supply chain impacts and provide support to their suppliers on climate change issues within their company.
“The challenges for the next phase of the
Collaboration are: how do we scale up this
effort; how can the survey process be more
automated; and how can all this data be
efficiently managed and used effectively?”
Andrew Boyd, Environmental
Sustainability Manager, Unilever
All members interviewed find the SCLC pilot beneficial to their organization. Members indicate that one of the goals of participation is to shape the methodology and standardize the process for reporting supply chain emissions. The SCLC provides an opportunity for many of the members to benchmark their supply chain emissions and understand the current state of supplier climate change initiatives. One member indicates their supply chain GHG emissions are greater than emissions from their operations so they want to include supply chain emissions in their inventory in order to better track these impacts. Members who sent the survey out themselves generally have better survey response rates. These members report that this is because suppliers are more reactive to large customer requests than a non-profit-organization request. Two members also report that having their company name behind the survey pushed the suppliers to respond more than a survey coming only from CDP. With both approaches, members report that suppliers recognize the importance of responding to the survey because of the request coming from the combination of a prominent customer and a well-regarded climate change organization. Response rates also differ between members based on the type of suppliers they chose to participate in the survey. Some members chose major suppliers who they know are already engaging on climate change issues within their companies. Other members chose to survey a diverse group of suppliers to see what responses they would receive. All members followed up with suppliers who had not responded near the end of the response period through e-mail and/or

Carbon Disclosure Project– SCLC Pilot Results and Findings Report Page 20 of 30
phone calls to ensure good results. Two members indicate they used the tracking system on CDP’s website to manage supplier responses. Based on survey results, members will determine next steps and future supply chain activities. Activities members are considering include; adding supply emissions to corporate GHG inventory; assisting suppliers in efforts to reduce their emissions; and creating benchmarks to assess their suppliers. The major concern of suppliers for the next phase of the SCLC is how to efficiently scale up the effort to include many more members and suppliers. Members are concerned that if they expand their effort to include all their suppliers the Collaboration will become a burden on resources and CDP will be unable to manage the additional reporters. Members are interested in finding ways to streamline the survey process and automate where possible in order to minimize the resources required for CDP to manage the Collaboration and to maximize participation.
Recommendations The next phase of the SCLC is to launch a full-scale initiative. Improvements to the survey process and survey questions, along with additional program components, will maximize participation of members and suppliers. These improvements will also help provide quantifiable and analyzable data, and drive actions to reduce greenhouse gas emissions reductions.
Survey Response Rate and Completeness To increase the response rate of suppliers, the time allowed for responses should be expanded. The SCLC survey could be put on the same schedule as the general CDP annual questionnaire giving companies a number of months to respond. To maximize SCLC membership, CDP needs to provide continued assistance in distributing the survey and possibly assist with reminders to suppliers. Members working with the same suppliers could also share their supplier contact lists to reduce the time needed for them to track down appropriate supplier contacts. Although few companies can provide product level information at this point, this information is important for companies to collect in order to fully understand their supply chain impacts and identify greenhouse gas reduction opportunities. Additional survey questions requesting supply chain emissions broken down by packaging, manufacturing, transport, raw material manufacturing, and finished product manufacturing would provide a further level of granularity to help companies effectively target reduction efforts. New reporters should first quantify their Scope 1 and Scope 2 emissions before they address Scope 3 emissions. Companies should understand the footprint of their operations before they start asking suppliers for climate change information. Small companies, in particular, should be encouraged in the first few years of reporting to provide only Scope 1 and Scope 2 emissions impacts to improve their overall response rate. The response rate of small companies needs to be increased to get a larger sample size and fully evaluate these companies’ knowledge of climate change and their actions to address impacts.
Best Practices for Supplier Engagement
• Coordinate with suppliers in advance of the survey distribution • Distribute the survey directly to suppliers • Recommend that new CDP reporters focus efforts on reporting Scope 1 and
Scope 2 emissions in first few years • Communicate to suppliers the purpose of the effort and how the data will be
used • Work with suppliers’ procurement function to complete the survey • Have realistic expectations of suppliers about what they are able to report • Send surveys on an annual basis to track suppliers’ progress • Communicate the value of providing both qualitative and quantitative
information • Follow-up with suppliers multiple times after the survey has been sent to
emphasize the value of their response • A growing member base will increase demand for supply chain information

Carbon Disclosure Project– SCLC Pilot Results and Findings Report Page 21 of 30
Best Practices for Climate Change Disclosure • Complete Scope 1 and Scope 2 GHG reporting before reporting Scope 3
emissions • Respond to all questions in the survey, even if the answer is “still considering” • Have information reviewed by a credible third-party • Report annually to be transparent about progress
Data Quality There are a number of data quality issues that could easily be improved. To improve the quality of the quantitative information reported to CDP, the survey could provide pull-down menus with pre-populated answers from which respondents can choose along with space to provide a qualitative response. This will reduce amount of inaccurate and incomplete data provided. Providing examples of the answers that CDP is looking for, will also improve the accuracy of survey responses.
New Program Components Additional program components will also provide improved data quality, greater overall participation, and drive greenhouse gas emissions reduction activities. For companies new to CDP reporting, an online or phone ‘Help Desk’ could be provided to get quick answers to reporting questions. An in-person or online training for completing the survey would also be helpful for new reporters. Additional guidance on answering product and supply chain questions is particularly needed. Guidance and training to identify and develop supply chain reduction activities could help to drive reductions in greenhouse gas emissions.

Carbon Disclosure Project– SCLC Pilot Results and Findings Report Page 22 of 30
Appendix A Greenhouse Gas Emissions Questionnaire – SCLC1

Carbon Disclosure Project (SCLC1)Greenhouse Gas Emissions Questionnaire1 December 2007
Carbon Disclosure ProjectGreenhouse Gas Emissions Questionnaire – SCLC1
One of the main objectives of the SCLC is to better understand how companies in our supply chains are consideringclimate change and working to reduce their greenhouse gas (GHG) emissions. To this end, we request that you completesections A, B and C of the attached questionnaire as best you can. Sections A and B are identical to the questionnaire sentby CDP to over 2400 large companies globally in February 2007. We have made no changes to these sections as many ofyou already respond to a request from CDP for disclosure on behalf of investors and one of our main objectives is theavoidance of duplication of effort. If your company has already answered the questions in sections A and B in response toCDP5, they will automatically be included in your response to this request.
Section A asks for your overall emissions and some information on your view of risks and opportunities associated withclimate change.
Section B goes into more detail about how you manage GHG emissions and climate change risks and opportunities.
Section C invites you to examine your own emissions and emissions from your supply chain in more detail. We recognizethat it may not be possible for you to provide much data in this section at this time. For this reason, each question givesyou the opportunity to explain what you are able to report and how you expect to improve your management systems inthis area in the future.
The purpose of Section C is to help companies to extend their carbon disclosure to include related activities (reportedunder Scope 3 of the GHG Protocol) and to understand the risks and opportunities related to climate change within thesupply chain. Specifically it concentrates on creating visibility of emissions within the supply chain. To do this, companies are asked to split their total emissions reported in Section A (question 6). Question 7 asks to what extent you use the CDP or any other process to invite disclosure of emissions data from your suppliers. Question 8 invites you to explain your capabilities to calculate Scope 3 emissions. Question 9 provides an opportunity to share successes and plans for the future. In question 10, you have the opportunity to report any other information which you think might be of interest to customers with regards to the risks and opportunities of climate change. Finally, in question 11, we request that youprovide us with any feedback which will help us to improve this process in the future.
We request that answers to the following questions are provided for your company as defined in your consolidated auditedfinancial statements. If you are unable to respond on this basis, please explain why and detail the reporting boundaries youhave used.
Please use our website for direct data entry via www.cdproject.net/supplychain.
For the pilot your responses will ONLY go the specific customers who have requested this information and in the production of aggregate statistics. In the future your response to Section A and B will be made publicly available atwww.cdproject.net, unless you notify us to the contrary. Your response to Section C will be made available to yourspecific customers who have requested this information.
For additional guidance and information please see the Further Information attached to this questionnaire, or refer to theReporting Guidance section at www.cdproject.net/supplychain/guidance.
Page 1 © Copyright Carbon Disclosure Project 2007

Carbon Disclosure Project (SCLC1)Greenhouse Gas Emissions Questionnaire1 December 2007
Section A:For all companies to complete
1 Climate Change Risks, Opportunities and StrategyFor each question please state the time period and, where possible, the associated financial implications.
a Risks: What commercial risks does climate change present to your company including, but not limited to, those listed below?
i Regulatory risks associated with current and/or expected government policy on climate change e.g. emissions limits or energy efficiency standards.
ii Physical risks to your business operations from scenarios identified by the Intergovernmental Panel on Climate Changeor other expert bodies, such as sea level rise, extreme weather events and resource shortages.
iii Other risks including shifts in consumer attitude and demand.
b Opportunities: What commercial opportunities does climate change present to your company for both existing and new products and services?
c Strategy: Please detail the objectives and targets of the strategies you have undertaken or are planning to take tomanage these risks and opportunities. Please include adaptation to physical risks.
d Reduction targets: What are your emissions reduction targets and time frames to achieve them? What renewableenergy and energy efficiency activities are you undertaking to manage your emissions? (This question not required if answering Section B.)
2 Greenhouse Gas Emissions Accounting1
a Methodology: Please provide the following information on your company’s emissions measurements:i The accounting year used to report GHG emissions2.ii The methodology by which emissions are calculated.iii Whether the information provided has been externally verified or audited.iv An explanation for any significant variations in emissions from year to year, e.g. due to major acquisitions, divestments,
introduction of new technologies, etc.
b Scope 1 and 2 of GHG Protocol: Direct and Indirect GHG emissions and electricity consumption3
Please complete the table below for tonnes CO2e emitted and electricity consumption:
Globally Annex B Countries
Scope 1 activity tonnes CO2e emitted
Scope 2 activity tonnes CO2e emitted
MWh of purchased electricity
Percentage of purchased MWh from renewables
c Scope 3 of GHG Protocol: Other Indirect GHG emissionsWhere feasible please provide estimates for the following categories of emissions:
i Use/disposal of company’s products and services.ii Your supply chain.iii External distribution/logistics.iv Employee business travel.
1The six main Greenhouse Gases are carbon dioxide (CO2), methane (CH4), nitrous oxide (N2O), hydrofluorocarbons (HFCs), perfluorocarbons (PFCs) and sulphur hexafluoride (SF6).2If you are responding to CDP for the first time, please provide details where available, of emissions for the last three measurement cycles.3For the purposes of responding to this section, please follow the World Resources Institute (WRI), World Business Council for Sustainable Development’s (WBCSD’s) Greenhouse GasProtocol (corporate standard revised version), details of which can be found at www.ghgprotocol.org.
Page 2 © Copyright Carbon Disclosure Project 2007

Carbon Disclosure Project (SCLC1)Greenhouse Gas Emissions Questionnaire1 December 2007
Section B:
3 Additional Greenhouse Gas Emissions AccountingUsing the methodology as set out in 2(a), please state your Scope 1 and 2 emissions as follows:
a For each country in which you have operations, where available.
b For facilities covered by the EU Emissions Trading Scheme. Please also include the number of allowances you were issued under the applicable National Allocation Plans.
c What has been the impact on your profitability of the EU ETS?
4 Greenhouse Gas Emissions Management
a Reduction programs: What emission reduction programs does your company have in place? Please include anyreduction programs related to your operations, energy consumption, supply chain and product use/disposal.
i What is the baseline year for the emissions reduction program?ii What are the emissions reduction targets and over what period do those targets extend?iii What investment has been/will be required to achieve the targets and over what time period?iv What emissions reductions and associated costs or savings have been achieved to date as a result of the program?v What renewable energy and energy efficiency activities are you undertaking to manage your emissions?
b Emissions trading: What is your company’s strategy for trading in the EU Emissions Trading Scheme, CDM/JI projects and other trading systems (e.g. CCX, RGGI, etc), where relevant?
c Emissions intensity: Please state which measurement you believe best describes your company’s emissions intensityperformance. What are your historical and current emissions intensity measurements? What are your targets?
d Energy costs: What are the total costs of your energy consumption e.g. from fossil fuels and electric power? What percentage of your total operating costs does this represent?
e Planning: Do you estimate your company’s future emissions? If so please provide details of these estimates andsummarize the methodology for this. How do you factor the cost of future emissions into capital expenditure planning?Have these considerations made an impact on your investment decisions?
5 Climate Change Governance
a Responsibility:i Which Board Committee or other executive body has overall responsibility for climate change?ii What is the mechanism by which the Board or other executive body reviews the company’s progress and
status regarding climate change?
b Individual performance: Do you provide incentive mechanisms for managers with reference to activities relating toclimate change strategy, including attainment of GHG targets? If so, please provide details.
Page 3 © Copyright Carbon Disclosure Project 2007

Carbon Disclosure Project (SCLC1)Greenhouse Gas Emissions Questionnaire1 December 2007
Section C:This section is new for SCLC1
6 GHG Emissions Analysis
The highest sources of emissions in the whole supply chain are not always obvious so it is helpful to build up a picture ofwhere these sources are. Breaking down total emissions in a meaningful way is a precursor to focussing resources to takeaction. This question explores how far your organization is currently able to support the data-driven reduction of emissionsalong the supply chain.
From question 2b, your total emissions (Scope 1+ 2) are
a Possible emissions split: Are you able to break down your total scope 1 and 2 emissions by any of the following:business division, business unit, factory, product group, product line, SKU?
If yes, please answer questions b to g where possible.
If no, please explain how else you might be able to break down your emissions and go to question f.
b Using your preferred basis above for splitting emissions what are the five biggest emitting groups for your company?(e.g. business units or product groups). For each group please give the output quantity relating to these emissions andthe unit of measure used for this output quantity. E.g. ‘potatoes, kilotonnes’ or ‘detergent, kilotonnes’. This will enableyour customers to calculate their share of these emissions.
Group 1 Group 2 Group 3 Group 4 Group 5 Other Total
Emissions
Output
Units
c Methodology: Please explain your methodology (including units of measure) for allocating emissions to the groups you have been able to do this for.
d GHG Emissions drivers: If known, for each of the above groups list the major sources of GHG emissions withinScope 1 and 2.
e Source of information: Where possible, please explain how you have identified the sources above, citing a publishedsource of information where they were used.
f Challenges and developments: What are the challenges that prevent you from being able to break down emissions?Please describe whether and how you plan to develop your capabilities to break down your emissions in the future.
g Contact person: If someone else in your organization would be better placed to answer queries on the abovequestions, please give their name, position and email address here.
Page 4 © Copyright Carbon Disclosure Project 2007

Carbon Disclosure Project (SCLC1)Greenhouse Gas Emissions Questionnaire1 December 2007
Section C (Continued):This section is new for SCLC1
7 Disclosure in your Supply Chain
In order for your organization to identify the main sources of GHG emissions in your supply chain and to understand risksand opportunities, you may find it useful to regularly ask for information relating to climate change from some or all of yoursuppliers. This question invites you to consider how you obtain the information you need from your suppliers.
a Number of suppliers: How many suppliers do you have?
b Major suppliers: How many suppliers cover 80% of your supply chain impact? (If you have actual or estimatedsupplier emissions, enter number of suppliers who are responsible for 80% of your supply chain emissions, otherwisethe number responsible for 80% of your purchases by expenditure).
Please explain how you arrived at this number.
c Suppliers asked to disclose: Do you have a strategy for engaging your suppliers on their greenhouse gas emissionsand the impacts of climate change on their business?
If so please provide details of this strategy including how many of your suppliers you are engaging and answerquestions d to e.
If not, please explain any plans you have to do so in the future.
d Suppliers disclosing to CDP: How many of your suppliers completed a CDP questionnaire in the last request fordisclosure (CDP5)?
e Use of data: If you have data on your suppliers’ GHG emissions and climate change strategies, please explain howyou make use of that data (for example: identifying major GHG sources to prioritize reduction actions, identifyingphysical risks in the supply chain, stimulating innovation etc).
8 Scope 3 Emissions
Question 6 invited you to look in detail at your Scope 1 and 2 emissions, which you have most control over. This question extends that exploration into your Scope 3 emissions. Scope 3 emissions occur in the following four areas.
i Use and disposalii Your supply chain iii External distribution/logisticsiv Employee business travel
a Tracking emissions: Do you track or calculate Scope 3 emissions? If yes, what types of scope 3 emissions do you track.
If the answer to a) is yes, please go to question b). If the answer to a) is no, please go to question d)
b Emissions split: Are you able to break down your Scope 3 emissions by any of the following categories: business division, business unit, factory, product group, product line, SKU?
c Methodology: Please describe the methodology you use to track or calculate Scope 3 emissions, including the extentto which you rely on primary data (such as actual data from suppliers) and secondary data (from available databasesfor example). Please list the sources of information you use and comment on their relevance where possible.
d Challenges and developments: What challenges do you see in calculating and being able to break down Scope 3emissions? Please describe whether and how you plan to develop your capabilities in the future.
Page 5 © Copyright Carbon Disclosure Project 2007
Carbon Disclosure Project (SCLC1)Greenhouse Gas Emissions Questionnaire1 December 2007
Section C (Continued):This section is new for SCLC1
9 Innovating to reduce GHG emissions from product life cycles
We are interested to hear about some of your success stories as well as your future plans.
a Successes and plans: Please list any major successes and/or planned activities or opportunities to reduce GHGemissions in the life cycle of groups of products or individual products, including an estimate of the possible annualreductions for each initiative.
b Targeted lifecycle reductions: Do you have a target to reduce your total scope 3 emissions?If so please provide details.
10 Further information.
Please provide any further information which you believe might be of interest to your customers in understanding your viewsof the risks and opportunities of climate change and your capabilities to analyse emissions.
11 Feedback.
Please provide us with feedback on this questionnaire. All comments are welcome.
Page 6 © Copyright Carbon Disclosure Project 2007

Carbon Disclosure Project (SCLC1)Greenhouse Gas Emissions Questionnaire1 December 2007
Carbon Disclosure ProjectFurther information
This is the sixth time the Carbon Disclosure Project has made an information request. Your company may be receiving this for the first time because in 2007, at the request of a group of majorcorporations, we have continued to expand the number of companies receiving the request and haveadded section C to explore Scope 3 emissions in more detail. To find out more about the previousresponses from other major companies, see our website at www.cdproject.net where you can alsofind full details on the background and structure of CDP.
Why is this request from a group of companies to a group of suppliers rather than from an individual customerto an individual supplier?a To facilitate ease of response for suppliers by being able to provide one standard response to many customers.b To receive data in a common format from all suppliers.
Which companies have been written to and who are the SCLC1 members?This information request has been sent to up to 50 suppliers from each of the following companies:
- Cadbury Schweppes- Dell- Hewlett-Packard- Imperial Tobacco- L’Oreal- Nestle- PepsiCo- Procter & Gamble- Prudential- Reckitt Benckiser - Tesco- Unilever
What are the legal/financial implications for responding corporations?The legal implications are the same as those associated with standard disclosure. There may be some internal costsassociated with answering the questionnaire.
What will happen to the data received?All responses to sections A and B will be made publicly available at www.cdproject.net in April 2008 except where theresponding company has requested otherwise. Responses to section C will be made available to customers who haverequested this information only.
What if a company wishes to change or update a response?For the website, CDP can accept responses or revisions to responses at any time and will aim to make these available fromwww.cdproject.net within five days of receipt.
How can a company confirm its participation?Please use our website for registration at www.cdproject.net/supplychain
What is the legal status of the co-ordinating body?It is a Special Project of Rockefeller Philanthropy Advisors, with United States IRS 501(c)3 charitable status, with the solepurpose of providing a co-ordinating secretariat for the participating investors.
Page 7 © Copyright Carbon Disclosure Project 2007

Carbon Disclosure Project (SCLC1)Greenhouse Gas Emissions Questionnaire1 December 2007
Carbon Disclosure ProjectFurther information (Continued)
Will CDP make any money from this exercise?CDP is a not-for-profit NGO. Any revenue generated from members of the SCLC will be used by CDP to support theprocess of disclosure and to invest in the process to ensure that it improves in line with member expectations.
Is there a cost to my organization for participating?There is no direct cost for completing the CDP questionnaire at the moment. However, companies will need to commitresources in order to be able to answer the questions. This may be internal or external and the level of resource will dependon the complexity of the business and how well developed the company’s management systems are.
Will there be publicity?The CDP secretariat will issue a press release in consultation with the participating members on 1 March 2008. The project team does not have authority to make other statements on behalf of this group.
Global Reporting InitiativeThe CDP Secretariat works closely with the Global Reporting Initiative (GRI) to ensure that this request and the GRIindicators are closely aligned and complementary.
Page 8 © Copyright Carbon Disclosure Project 2007

Carbon Disclosure Project– SCLC Pilot Results and Findings Report Page 23 of 30
Appendix B Table 1. Responding Suppliers by Industry Sector
Supplier Makeup Number Suppliers who Responded
Percent of Suppliers who Responded (out of 144)
Industry Sectors Represented by Suppliers Automotive 2 1%Building Equipment 1 1%Chemicals 16 11%Cleaning Service 1 1%Computer Components 24 17%Conglomerate 2 1%Consulting 1 1%Containers & Packaging 26 18%Electronic Equipment 13 9%Food Industry 28 19%Food Processing 4 3%Government 1 1%Home Products 6 4%Insurance 1 1%Office Supplies 1 1%Real Estate Services 2 1%Semiconductors 9 6%Telecommunications 1 1%Transportation 1 1%Utilities 1 1%Vending Machines 1 1%Wholesaler 1 1%Unknown 1 1%

Carbon Disclosure Project– SCLC Pilot Results and Findings Report Page 24 of 30
Table 2. Response Rate by Question Question Number of Suppliers Percent of supplier responses (out of 144) Section A Average 60% 1.a.i. 138 96%1.a.ii. 126 88%1.b. 108 75%1.c. 114 79%1.d. 82 57%2.a. 117 81%2.b.i. 84 58%2.b.ii 52 36%2.b.iii. 93 65%2.b.iv. 26 18%2.c.i-iv. 17 12%Section B Average 42% 3.a. 52 36%3.b. 29 20%3.c. 43 30%4.a.i. 72 50%4.a.ii. 51 35%4.b. 27 19%4.c. 38 26%4.d. 56 39%4.e. 99 69%5.a.i. 103 72%5.b. 98 68%Section C Average 28% 6.a.i. 80 56%6.b. 24 17%6.c. 51 35%6.d. 41 28%6.e. 40 28%6.f. 63 44%6.g. 51 35%7.a. 84 58%7.b. 62 43%7.c. 47 33%7.d. 17 12%7.e. 33 23%8.a. 48 33%8.b. 15 10%8.c. 18 13%8.d. 31 22%9.a. 33 23%9.b. 41 28%10 9 6%11 31 22%

Carbon Disclosure Project– SCLC Pilot Results and Findings Report Page 25 of 30
Table 3.a‐c. Question 2.b.i. What are your total Scope 1 and 2 global emissions?
Global Emissions Number of Suppliers
Percent of supplier responses (out of 144)
Suppliers reporting global emissions 84 58% No response 60 42% Company size (by employees small <100, medium 101-1000, large >1000) Percent of responses (out of 84) Large company global emissions reporting 38 45% Medium company global emissions reporting 45 54% Small company global emissions reporting 1 1% Response by Industry Sector Percent of responses (out of 84) Food Industry & Processing 18 21% Containers & Packaging 17 20% Computer Components 14 17% Chemicals 12 14% Electronic Equipment 7 8% Semiconductors 6 7% Other: cleaning company, conglomerate, consultant, insurance, telecom, transport 6 7% Home Products 4 5% Question 2.b.ii. What are your Annex B emissions?
Annex B Emissions Number of Suppliers
Percent of supplier responses (out of 144)
Suppliers reporting Annex B emissions 52 36% No response 92 64% Company size (by employees small <100, medium 101-1000, large >1000) Percent of responses (out of 52) Large company Annex B emissions 24 46% Medium company Annex B emissions 27 52% Small Company Annex B emissions 1 2% Response by Industry Sector Percent of responses (out of 52) Food Industry & Processing 12 23% Containers & Packaging 11 21% Chemicals 10 19% Electronic Equipment 5 10% Semiconductors 4 8% Computer Components 3 6% Home Products 3 6% Other: Building equipment, conglomerate, consultant, telecom 4 8%

Carbon Disclosure Project– SCLC Pilot Results and Findings Report Page 26 of 30
Question 2.b.iii. How many MWh of global electricity did you purchase?
Global Electricity Purchases Number of Suppliers
Percent of supplier responses (out of 144)
Suppliers reporting Global Electricity Purchases 93 65% No response 51 35% Company size (by employees: small <100, medium 101-1000, large >1000)
Percent of responses (out of 93)
Large company electrical purchase data 43 46% Medium company electrical purchase data 48 52% Small Company electrical purchase data 1 1% Uncategorized company 1 1%
Response by Industry Sector Percent of responses (out of 93)
Food Industry & Processing 20 22% Containers & Packaging 18 19% Computer Components 16 17% Chemicals 13 14% Electronic Equipment 7 8% Semiconductors 6 6% Home Products 5 5% Other: conglomerate, consultant, insurance, real estate services, telecom, transport, wholesaler, unknown 8 9%
Table 4. Question 3.a. For each country where you have operations, state your emissions.
Country Suppliers Reporting Facility Information Total Emissions (metric ton CO2 eq)
Argentina 2 26,568 Australia 5 1,445,021 Austria 4 421,887 Belgium 6 571,650 Bolivia 1 27,607 Brazil 8 423,208 Canada 6 3,555,398 China 19 2,014,048 Colombia 1 405 Costa Rica 1 15,046 Czech Republic 3 23,782 Denmark 2 204,649 Finland 2 90,855 France 10 362,493 Germany 12 7,975,698 Greece 1 608 Hungary 2 33,143 India 5 35,754 Indonesia 4 38,795 Ireland 2 120,069 Israel 1 100,476 Italy 7 626,352
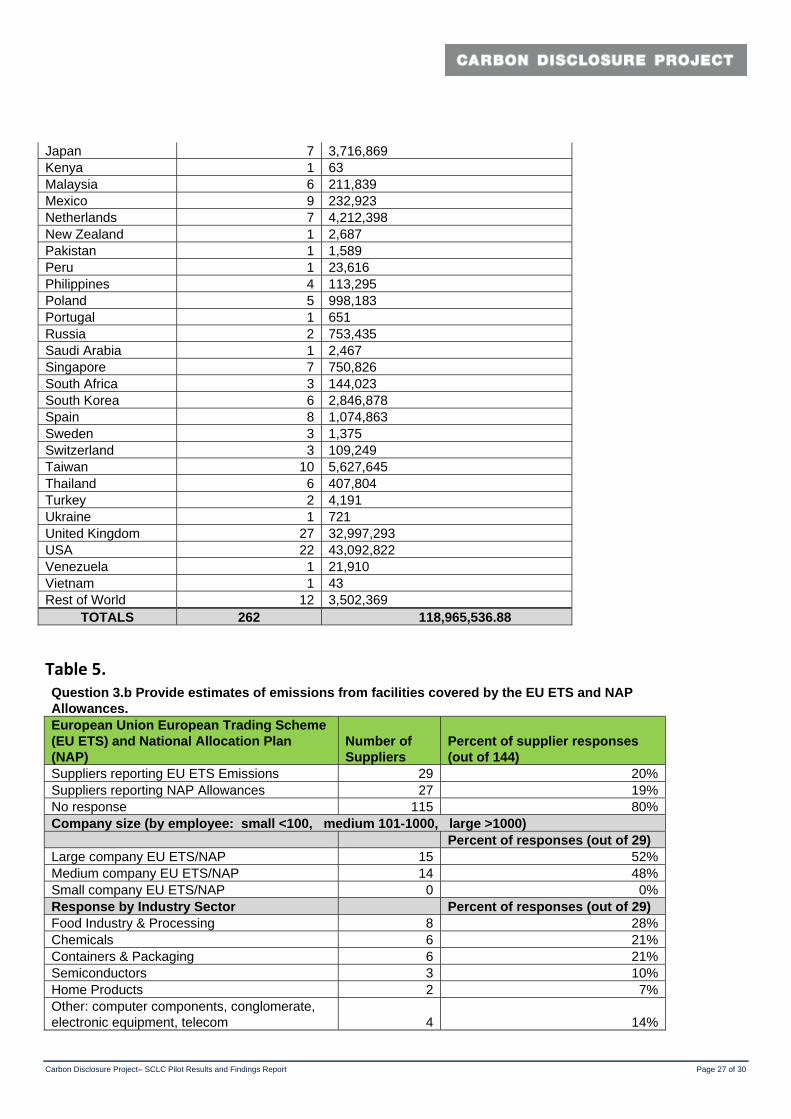
Carbon Disclosure Project– SCLC Pilot Results and Findings Report Page 27 of 30
Japan 7 3,716,869 Kenya 1 63 Malaysia 6 211,839 Mexico 9 232,923 Netherlands 7 4,212,398 New Zealand 1 2,687 Pakistan 1 1,589 Peru 1 23,616 Philippines 4 113,295 Poland 5 998,183 Portugal 1 651 Russia 2 753,435 Saudi Arabia 1 2,467 Singapore 7 750,826 South Africa 3 144,023 South Korea 6 2,846,878 Spain 8 1,074,863 Sweden 3 1,375 Switzerland 3 109,249 Taiwan 10 5,627,645 Thailand 6 407,804 Turkey 2 4,191 Ukraine 1 721 United Kingdom 27 32,997,293 USA 22 43,092,822 Venezuela 1 21,910 Vietnam 1 43 Rest of World 12 3,502,369
TOTALS 262 118,965,536.88
Table 5. Question 3.b Provide estimates of emissions from facilities covered by the EU ETS and NAP Allowances. European Union European Trading Scheme (EU ETS) and National Allocation Plan (NAP)
Number of Suppliers
Percent of supplier responses (out of 144)
Suppliers reporting EU ETS Emissions 29 20%Suppliers reporting NAP Allowances 27 19%No response 115 80%Company size (by employee: small <100, medium 101-1000, large >1000) Percent of responses (out of 29) Large company EU ETS/NAP 15 52%Medium company EU ETS/NAP 14 48%Small company EU ETS/NAP 0 0%Response by Industry Sector Percent of responses (out of 29) Food Industry & Processing 8 28%Chemicals 6 21%Containers & Packaging 6 21%Semiconductors 3 10%Home Products 2 7%Other: computer components, conglomerate, electronic equipment, telecom 4 14%

Carbon Disclosure Project– SCLC Pilot Results and Findings Report Page 28 of 30
Table 6. Question 4.a.i. What is the baseline year for the emissions reduction program?
Reduction Program Information Number of Suppliers
Percent of supplier responses (out of 144)
Suppliers Reporting Baseline Year 72 50%No response 72 50%
Baseline Year Percent of supplier responses (out of 72)
1990 2 3%1995 3 4%1996 1 1%1997 1 1%1998 1 1%1999 6 8%2000 6 8%2001 4 6%2002 4 6%2004 5 7%2005 11 15%2006 10 14%2007 15 21%
Future years 3 4%
Table 7.a–b. Question 7.a. How many suppliers do you have?
Supplier's Suppliers Number of Suppliers
Percent of supplier responses (out of 144)
Suppliers Reporting number of companies who supply them 84 58%No response 60 42%Supplier Breakdown Percent of responses (out of 84) <100 12 14%101-1000 35 42%>1001 37 44%Response by Main Industry Sectors Chemicals
>1000 6101-1000 2
Computer Components >1000 5
101-1000 7<100 4
Containers & Packaging >1000 5
101-1000 6<100 2
Food Industry & Processing >1000 9
101-1000 6<100 1

Question 7.b. How many suppliers cover 80% of your supply chain impact?
Major Suppliers Number of Suppliers
Percent of supplier responses (out of 144)
Suppliers Reporting number of companies who supply 80% of supply chain impact 62 43%No response 82 57%Supplier Breakdown Percent of responses (out of 62) 10s 34 55%100s 21 34%1000s 7 11%
Carbon Disclosure Project– SCLC Pilot Results and Findings Report Page 29 of 30

Carbon Disclosure Project– SCLC Pilot Results and Findings Report Page 30 of 30
Table 8. SCLC Member Interview Summary
Member Interview Questions & Responses
1. What are your main reasons for joining the SCLC? Number of MembersWant to standardize process to address supply chain emissions 2 To support CDP work 1 Interest in knowing supply chain emissions for benchmarking 1 Want CDP's name recognition with supply chain efforts 1 Want clear view of supply chain to see areas for improvement 1 Want to gain other perspectives on supply chain emissions issues 1 2. How does your company plan to benefit from participation? Number of MembersCreate a consistent, integrated approach to emissions data gathering efforts 2 Will better understand indirect footprint 1 Want to engage suppliers in climate issues 1 Want to understand current state of suppliers’ climate response 1 3. What information are you hoping to get from the results of the survey? Number of MembersUnderstand current state of suppliers’ climate change efforts 2 Shape methodology for engaging suppliers to address climate change 1 Help suppliers reduce their emissions 1 4. What process did you use to approach and distribute the supplier survey? Number of MembersCDP sent to member suppliers 5 Chose key suppliers to respond 4 Members sent to their own suppliers with CDP letter 3 Chose wide range of supplier types and sizes to respond 2 Members sent own survey to protect supplier privacy 2 5. What date did your suppliers receive the survey? Number of MembersDuring December 2007 all members Followed up with suppliers to find appropriate contacts all members 6. What kind of effort was made to engage suppliers in the initiative and encourage them to complete the survey? Number of MembersSurvey sent with reminders to suppliers all members Follow up with e-mail and/or phone calls 5 Sent out press release, tracked suppliers on the CDP website, and contacted suppliers to insure participation 1 7. How does your company plan to use the data collected from your suppliers? Number of MembersEvaluating data - benchmarking suppliers 4 Beginning to track supply chain footprint data 1 Help suppliers reduce their emissions 1 8. Are you considering any new activities based on the results of the SCLC? Number of MembersEvaluating data for future use 6 Augmenting program in place 1 9. Any success stories from participation in this effort you would like to share? Number of MembersNeed to evaluate data 4 New CDP reporters in this survey 1 10. Any thought on how the survey process could be improved? Number of MembersDifficult to scale up this effort with more suppliers or members 5 Questions too open ended - need quantitative data 4 Need to find the best way to engage suppliers without burdening them 2 Multi-lingual surveys needed 1