supply and recovery controls for perfluorobutane used in
TRANSCRIPT
1
Supply and Recovery Controls for Perfluorobutane Used in Low Threshold Cerenkov Counter
Marc McMullen, Mary Ann Antonioli, Peter Bonneau, Pablo Campero, Brian Eng, Amanda Hoebel, George Jacobs, Mindy Leffel, Tyler Lemon, and Amrit Yegneswaran
Physics Division, Thomas Jefferson National Accelerator Facility, Newport News, VA 23606March 4, 2019
This note presents the upgrade of the gas controls and monitoring system to facilitate supply and recovery of perfluorobutane, C4F10, used in the Low Threshold Cerenkov Counter (LTCC). The upgraded control system monitors each sector’s pressure and determines the need to supply or exhaust C4F10.
DSG Note 2019-10
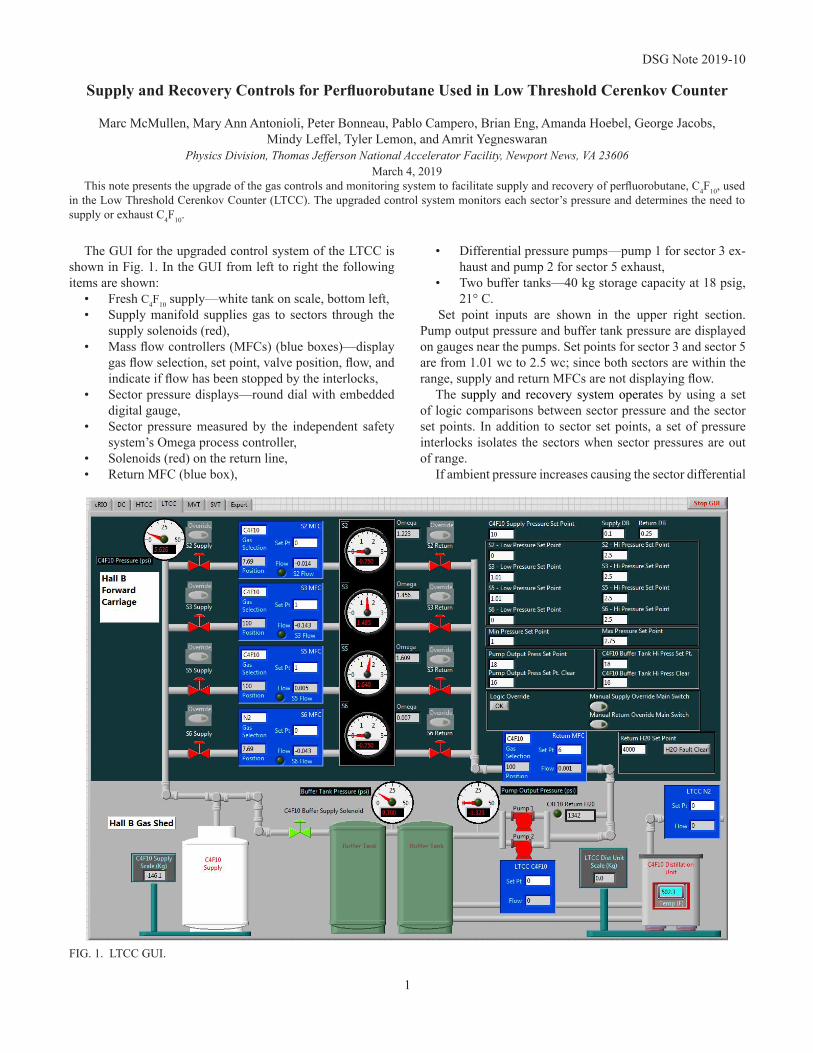
The GUI for the upgraded control system of the LTCC is shown in Fig. 1. In the GUI from left to right the following items are shown:
• Fresh C4F10 supply—white tank on scale, bottom left,• Supply manifold supplies gas to sectors through the
supply solenoids (red), • Mass flow controllers (MFCs) (blue boxes)—display
gas flow selection, set point, valve position, flow, and indicate if flow has been stopped by the interlocks,
• Sector pressure displays—round dial with embedded digital gauge,
• Sector pressure measured by the independent safety system’s Omega process controller,
• Solenoids (red) on the return line, • Return MFC (blue box),
• Differential pressure pumps—pump 1 for sector 3 ex-haust and pump 2 for sector 5 exhaust,
• Two buffer tanks—40 kg storage capacity at 18 psig, 21° C.
Set point inputs are shown in the upper right section. Pump output pressure and buffer tank pressure are displayed on gauges near the pumps. Set points for sector 3 and sector 5 are from 1.01 wc to 2.5 wc; since both sectors are within the range, supply and return MFCs are not displaying flow.
The supply and recovery system operates by using a set of logic comparisons between sector pressure and the sector set points. In addition to sector set points, a set of pressure interlocks isolates the sectors when sector pressures are out of range.
If ambient pressure increases causing the sector differential
FIG. 1. LTCC GUI.

2
pressure to drop below the low pressure set point (1.01 wc), C4F10 is supplied at 1 L/min until the sector’s differential pres-sure reaches the set point plus the deadband of 0.1 wc (set point + deadband = 1.11 wc).
If the ambient pressure decreases, causing the sector dif-ferential pressure to rise above the high pressure set point (2.5 wc), C4F10 is exhausted at 2 L/min, until the sector’s dif-ferential pressure reaches the set point minus the deadband of 0.25 wc (set point + deadband = 2.25 wc). Pump 1 engages if sector 3 has to exhaust gas, while pump two engages if sector 5 has to exhaust gas.
There are three interlocks in use:• Supply pressure > 10 psi. Prevents the sector supply
solenoid from opening,• Buffer tank pressure > 18 psi. Prevents the sector re-
turn solenoid from opening and secures both return pumps; if necessary, sector gas will be vented to at-mosphere through the bubblers,
• Return pump output pressure > 18 psi. Prevents the sector return solenoid from opening and secures both
return pumps; if necessary, sector gas will be vented to atmosphere through the bubblers.
In addition to recording the daily flow, a graphical gas re-port is generated daily on flow and pressure, ambient pres-sure, sectors pressures, C4F10 supply weight, and the moisture content of return gas. Figure 2 displays the gas system values from a selected daily data log file.
Upgrades to the LTCC gas controls are functioning as de-signed [1]. The system has been tested and used to fill and maintain gas pressure in the sectors. System is monitored daily to check that it is functioning properly and for statistical analysis.
[1] M. McMullen, et al. Usage of Perfluorobutane in the Hall B Low Threshold Cerenkov Counter, DSG Note 2019-08, 2019.
FIG. 2. LTCC gas report for 48 hours from 2/11 to 2/13, starting at 08:30 a.m. The top graph displays the pressure [wc] in S3 (blue) and S5 (magenta) and the instances of flow [L/min] from S3 (green) and C4F10 return (orange). The graph below displays the ambient pressure [wc]. The third graph displays the C4F10 scale, which is stable at ~44 kgs (white) and pressure spikes from the pumps engaging (green), while buffer tank pressure (red) increases as gas is returned to the tanks. The supply pressure (blue) increases drastically around mid-day on 2/12/19 after S3 completed filling and the S3 supply solenoid was closed (see top graph at hour 29). The last graph displays moisture content of the return gas. Note, the moisture content is typically 500 ppm–1000 ppm before the return cycle starts. Moisture content increases to 3000 ppm, which is the limit of the sensor before settling down over the course of several hours.