supplementary online file: getz et al., lessons from … · supplementary online file: getz et al.,...
TRANSCRIPT

Supplementary Online File: Getz et al., Lessons from CBC for Rethinking Elections
1. Figures referred to in main text
Fig. S1. Sourced June 30, 2016, at http://www.gallup.com/poll/1600/congress-public.aspx.
Fig. S2. A spectrum of related electoral systems, assuming N is divisible by r. In the late 2000s >20% of democratic governments worldwide employed SMP (the winner is first past the post) systems, including the US and Great Britain, >70% employed PR systems, while—along with Spain and Ireland—no more than 2% used variations multi-member-district (MMD) systems with single-transferable-vote (STV) methods for selecting the winners.
Fig. S3. A histogram of Cook’s Partisan Voting index (CPVI) values across all districts for the 2012 Congressional Representative Elections: Groups 1 and 2 refer to the Democratic and Republican values (data from https://en.wikipedia.org/wiki/Cook_Partisan_Voting_Index). Democratic values are significantly higher than Republican values (t test) indicating a strong bias of districting patterns that pack Democratic support into “democratic districts”. The categories 1 to 10 of this histogram represent binned values in the ranges of (1:PVCI<0.5, 2:-0.5 to 4.5, 3:4.6 to 9.5, …., 10:PCI>39.5).

Fig.S4.Side-by-sidecomparisonofUSCongressionaldistrictsascurrentlyconfigured,withsignificanteffectsofgerrymanderingevidentin2012votingdata(Fig.S3),andasgeneratedusingacomputeralgorithmthatorganizesconstituenciesinto5-seatdistrictssubjecttoreduceddistrictsizetomeetspecifiedstateseatallocations,contiguityandcompactnesscriteria.Shadeindicatesvoterdisenfranchisementduetopartisanvotepacking. 2. Background
In 1965, Lyndon B. Johnson signed the Voting Rights Act (VRA) into law. The law was designed to overcome legal barriers at the state and local levels that prevented African Americans from exercising their right to vote under the 15th Amendment. Since then, this act has been re-interpreted to justify creating “majority minority” districts districts where the population is mostly of one ethnic minority. The argument enables minorities to elect a person of their own ethnicity.
However, to achieve this with single-member districts requires packing minorities together into one or a few districts. This decreases the number of elections minority voters can meaningfully participate in, while also decreasing the competitiveness of the few elections that they can. Ultimately, this means that their votes . For instance, African American voters regularly vote on the order of 90% Democratic. packing their votes together

amounts to partisan gerrymandering in favor of Republicans - the party they predominately vote against. While gerrymandering them into packed districts may afford them “descriptive” representation in Congress (in that they can elect a person of their own ethnicity), the net effect is to reduce the representation of their favored party. Since, most votes in U.S. Congress are down party lines, this amounts to reducing their impact on legislation; reducing their political power. This, of course, is to the purpose of the Voting Rights Act – it was designed to give the voters political power, not to take it away.
On these grounds, this re-interpretation of the VRA has been legally contested in the Supreme Court (e.g., https://www.brennancenter.org/blog/supreme-court-rejects-mechanical-interpretation-voting-rights-act ), and, at the time of this writing continues to be so. (e.g., http://www.politico.com/blogs/under-the-radar/2016/06/virginia-redistricting-supreme-court-223946 )
Multi-member districts have long been lauded as a way to reduce gerrymandering while increasing proportionality, but the studies and arguments for them have been mostly analytical and theoretical, and focused on political party representation rather than descriptive representation of ethnic minorities. To help fill these gaps, we have performed in-silico simulations (i.e., via computer) combined with empirical data, with a focus on examining the effects of not only partisan proportionality, but also proportionality of the ethnic makeup of the elected body to that of the voters. Additionally, we examine how both the number of seats per district and the vote-tallying method used affects said proportionality.
Our hope is to theoretical experimental (in-silico)multi-member districts, when combined with an appropriate vote-tallying method, solve both problems at once: they provide a permanent solution to partisan gerrymandering, while also affording ethnic minorities proportional “descriptive” representation in Congress. In short, our hope is to show a way out of the VRA conundrum. 3. Overview
In this study we were interested primarily in the effect of multi-member districts and different vote-tallying methods on proportional political representation, both for minority parties and for ethnic minorities.
As there are a lot of variables to consider (both dependent and independent), including geo-spatial effects (such as minorities tending to cluster geographically), a sequential series of smaller analysis was undertaken, allowing for the progressive reduction in the number of independent variables under consideration, while taking into account progressively more empirical data.
The analysis is broken down into roughly 3 sections: • In-silico emulation of different vote-tallying methods and numbers of seats per district
o Here we select a specific tallying methods and number of seats per district for further analysis • Inclusion of geo-spatial effects on partisan representation and ethnic representation at the
state-level (using California as a case study) • Application of findings to national-level data
4. In-silico experimental analysis of multi-member district tallying methods
Simulated tallying results were generated with a stand-alone program written in Java. The program is composed of three small parts:
1) Tallying subroutines for the different methods 2) A ballot generator that converts a set of utility expectations of the different candidates to various types
of ballots (ranked, allocated, etc.) 3) A run controller that sends requests to the ballot generator, then takes those generated ballots and feeds
them to the different tallying subroutines, then outputs the results in tab-delimited format. The run controller ran a number of scenarios differing by a few basic variables:
• Percent voters voting for party 1 varied from 0 to 60, in 5 percent increments. The remaining voters voted for party 2
• Number of seats per district varied from 1 to 8, in 1-seat increments • Whether the votes within each party were randomly distributed or favored candidates existed (e.g., for
every vote candidate 1 got, candidate 2 got 2, candidate 3 got 3, etc.)

• Whether the parties ran 1 candidate for each open seat or a number of candidates proportional to the expected votes ( % for party * number of seats * 2)
Thus, the total number of runs was 416 (13*8*2*2). There are 4 basic ballot types:
• Allocation (x points are allocated among the candidates) • Approval (each candidate is given an up or down vote) • N-votes (the voter has up to n votes that they can assign to any candidate, but only a maximum of 1 per candidate) • Ranked (the voter ranks all the candidates from best to worst)
First we start with the voter’s expected utility value for each candidate. We normalize this so that the sum equals 1, and then:
• For allocation, we multiply this by twice the number of seats, round down, and then assign another point to the candidate with the highest remainder, until all (2*seats) points are assigned.
• For approval, we multiply by the number of candidates, and then round nearest. • For n-votes, we take the n highest scores and give a vote to each. • For ranked, we simply order the candidates from highest score to lowest.
In general there are two basic categories of tallying method: Non-transferable vote(s) (NTV) and single transferable vote (STV). Very briefly, in the case of NTV, the allocations for each candidate are totaled up, and the candidates with the P highest totals are elected, where P is number of seats to fill. In an STV tallying method, either the Hare or Droop method (discussed below) is chosen to set the quota required for election. If no candidate reaches that quota, the one with the fewest votes is eliminated and votes cast for them are divided proportionally among the remaining candidates until one reaches the quota. Similarly, in the case of an n-seat district, if one candidate reaches the quota, the additional votes above this level are distributed proportionally to the other candidates until all n seats are filled.
Additionally, we implement a modified single-transferable-vote tallying method with two important differences from the standard method. Firstly, when a candidate is eliminated in order to make another candidate reach quota, this elimination is only temporary instead of permanent – the votes for that candidate are added back in before determining who fills the next seat. Secondly, instead of cumulatively eliminating candidates (e.g., A, then A and B, then A and B and C), all combinations of candidates are considered for elimination (e.g., A, then B, then A and B). This new method will be referred to as the “corrected” STV method, as it is one of the authors’ contentions that it fixes two “bugs” in the standard counting algorithm that lead to sub-optimal results.
The most basic way of counting STVs is to use the Hare quota H=(votes cast)/(#seats) remove winners exceeding H, and transferring the votes in excess of the quota to the remaining candidates, in proportion to their original allocation of votes. If no candidate meets quota, a set of candidates is eliminated, and the lower ranking candidates moved up to fill the gaps. The set that is eliminated is the “weakest” allows a candidate to meet quota. This process continues until r (the number of seats in the district) of the k> r candidates have been transferred to the winners’ list. Modifications of this system use the Droop quota D=1+(votes cast)/(#seats+1) to readjust the number of votes cast for each candidate after the top candidates successively get allocated to the winners’ list. The accepted measure for how well an electoral system performs is deviance from proportionality. While the Droop quota is more popular, our simulations that the Hare quota actually performs better by this measure. Another critical issue to is the preferred value for r: i.e. that number of seats per district. This value is going to depend on an assessment of the tradeoff between two conflicting sets of goals: protecting against gerrymandering and increasing the diversity & proportionality of the electorate, and keeping the ballot complexity low for the voters and the cost of running a campaign low for the candidates.
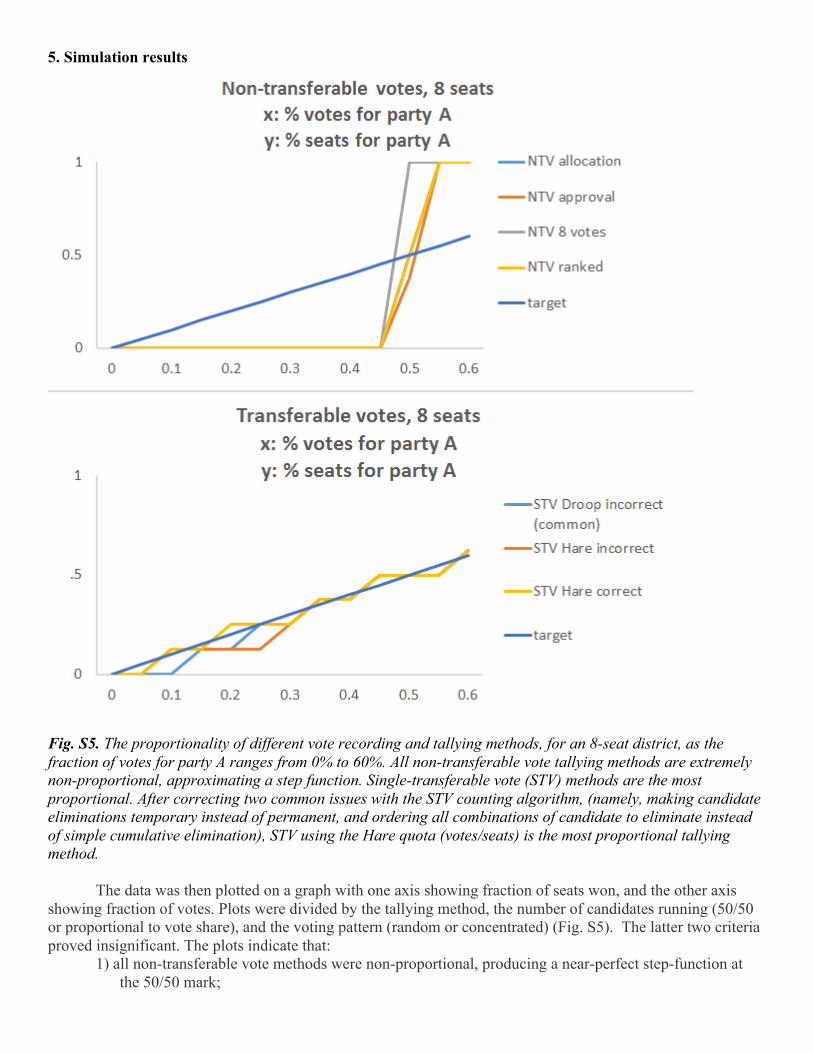
5. Simulation results
Fig. S5. The proportionality of different vote recording and tallying methods, for an 8-seat district, as the fraction of votes for party A ranges from 0% to 60%. All non-transferable vote tallying methods are extremely non-proportional, approximating a step function. Single-transferable vote (STV) methods are the most proportional. After correcting two common issues with the STV counting algorithm, (namely, making candidate eliminations temporary instead of permanent, and ordering all combinations of candidate to eliminate instead of simple cumulative elimination), STV using the Hare quota (votes/seats) is the most proportional tallying method.
The data was then plotted on a graph with one axis showing fraction of seats won, and the other axis showing fraction of votes. Plots were divided by the tallying method, the number of candidates running (50/50 or proportional to vote share), and the voting pattern (random or concentrated) (Fig. S5). The latter two criteria proved insignificant. The plots indicate that:
1) all non-transferable vote methods were non-proportional, producing a near-perfect step-function at the 50/50 mark;

2) single transferable vote methods (ranked choice) were the most proportional; and 3) single transferable vote methods were the most robust against a mismatch between the number of
candidates running versus fraction of votes Consequently, the most proportional STV method (corrected STV tallying with Hare quota), and the
most commonly used STV method (standard STV tallying with Droop quota) were chosen for the remainder of the analysis. 6. Adding Geo-spatial effects
After identifying the tallying methods that enabled proportionality using in-silico experiments, actual geographic and demographic data were analyzed. We gathered Citizen Voting Age Population (CVAP) ethnicity demographics (Caucasian, Hispanic, etc.) from census.gov, as well as population, and district shapefiles for both California Assembly and California Federal Congressional Districts.
7. Seats per district
Fig. S6. Minority representation disproportionality of California Assembly seats, after recombining the current (Census year 2010) districts into 2-seat districts, then recombining those into 4-seat districts, then 8, then 16. Disproportionality drops sharply with the first few additional seats per district, then approaches an asymptote at y (disproportionality) = 0.
We investigated the manner in which number of seats per district affected proportionality. To emulate a many-party scenario (as opposed to the current two-party system) geo-spatial effects, we used ethnic groups in lieu of political party affiliation. We treated each ethnicity as if it were a different party, assuming no cross-party voting. Using the California Assembly, we applied open source automated redistricting software to combine the aforementioned data to produce per-district statistics on ethnicity and calculatetarget seat allocation that maximize proportionality of the electorate to the ethnic groups of the voters. We then combined the districts in pairs, preserving compactness and contiguity, to create 2-seat districts, and repeated that again for 4-seat districts, 8-seat districts, and 16-seat districts. We plotted the number of seats per district against the total number of seats, by ethnicity, short or in excess of the target distribution that maximizes proportionality (Fig. S6). Disproportionality drops sharply at the beginning and then asymptotes, following a roughly curve. From this information we selected 5-seats per district as a reasonable choice for the remainder of the analysis.
y=32.76x-0.701R²=0.9232
0
5
10
15
20
25
30
35
40
0 2 4 6 8 10 12 14 16 18
y:seatsofffromtargetx:seatsperdistrict

8. Minority Representation, California
Using CVAP, we can also examine minority representation in Congress to determine whether minorities are “descriptively” represented, per the Supreme Court’s re-interpretation of the Voting Rights Act (VRA). That is, the ethnic demographics of Congress should mirror that of the voters, or such an outcome should at least be possible if that is what the minority group desires.
Our analysis of seats won, assuming all ethnicities run a candidate of their ethnicity, and no intra-ethnicity voting, shows that single-member districts were the most disproportional, strongly favoring majority ethnicities at the expense of minority ethnicities. 5-seat districts tallied using STV with Droop quota were significantly more proportional under-represent the Asian population and not represent the African American population at all. Instead, using the Hare quota in these 5-seat districts produced outcomes that very closely mirrored the ethnicities of the voting age population. (Fig. S7)
a) b) c) d) Fig. S7. Hypothetical minority representation for California U.S. Congressional districts under different districting and vote tallying schemes, using actual precinct-level demographics from the 2010 census. This represents the number of seats each minority would get if elections were 100% racially polarized. a.) Actual 113th congress single-member districts, b.) Hypothetical 5-seat districts using STV with Droop quota c.) Hypothetical 5-seat districts using STV with Hare quota d.) Actual population (ideal) Gray = Caucasian; Green = Hispanic; Cyan = Asian; Red = African American; Orange = Other/Multiple 9. Minority Representation, U.S. Federal Congress
a) b) c) d) Fig. S8. Hypothetical minority representation for all (nation-wide) U.S. Congressional districts under different districting and vote tallying schemes, using actual precinct-level demographics from the 2010 census. This represents the number of seats each minority would get if elections were 100% racially polarized. a.) Actual 113th congress single-member districts, b.) Hypothetical 5-seat districts using STV with Droop quota c.) Hypothetical 5-seat districts using STV with Hare quota; d.) Actual population (ideal) Gray = Caucasian, Green = Hispanic, Cyan = Asian, Red = African American, Orange = Other/Multiple
We then looked at the effect of multi-member districts using a tallying system with transferable votes on Minority representation, this time for the entire country. The effects observed for California persisted when scaled up to the entire country. Single-member districts showed very non-proportional projected minority representation, strongly over-favoring the majority Caucasian ethnicity, while 5-seat districts using Hare quota came very close to ideal (proportional) representation (Fig. S8). 10. A closer look at proportionality, including geo-spatial effects.

Fig. S9. The cumulative statewide proportionality of different vote recording and tallying methods for California, as the fraction of votes for party A ranges from 0% to 100%. This analysis used actual precinct-resolution vote counts from the 2012 presidential election. Compared are: Single-member districts, using actual districts from the 113th congress (2010 census); 5-seat districts counted with Single Transferable Vote (STV) using the Droop quota; and 5-seat districts counted with (STV) using the Hare quota. The top chart shows the raw values he bottom chart shows displacement from proportionality. The total (unsigned) area in the bottom chart for the different scenarios are: Current single-seat districts: 0.1426, 5-seat Droop quota: 0.0400; 5-seat Hare quota: 0.0162.
Using per-precinct vote count data from the 2012 presidential election based on the California Federal Congressional districts, we could examine how various tallying methods affected proportionality while incorporating the geo-spatial effects identified in the previous analysis.
-0.2
0
0.2
0.4
0.6
0.8
1
0 0.1 0.2 0.3 0.4 0.5 0.6 0.7 0.8 0.9 1
California2-partyproportionality
x:%votesy:%seats
Votes Singleseat 5-seatDroop 5-seatHare
-0.4-0.3-0.2-0.10
0.10.20.30.4
00.0375
0.075
0.1125
0.15
0.1875
0.225
0.2625
0.3
0.3375
0.375
0.4125
0.45
0.4875
0.525
0.5625
0.6
0.6375
0.675
0.7125
0.75
0.7875
0.825
0.8625
0.9
0.9375
0.975
California2-partyproportionality
x:%votesy:%dis-proportionality
Singleseat 5-seatDroop 5-seatHare

For the single-seat districts, we used actual districts for the 113th congress (2010 census year). For the 5-seat districts, we used Genetic Algorithm to create 5-seat districts optimiz for compactness, contiguity, and equal population per seat. Then we exported the “seats-votes” curve from this for the single-member districts, the 5-seat districts using the Droop quota, and the 5–seat districts using the Hare quota. Over the entire spectrum of uniform partisan swings, 5-seat Hare had the lowest disproportionality at 62, Droop had the second at 4, and single-seat districts were last at . (Fig. S9) 11. Partisan Representation, U.S. Federal Congress
Using the same software and optimization criteria, we can automatically design 5-seat districts for every congressional seat in the country. There are a few obvious advantages to this set of empirical data, including data (meaning among other things, less noise, tighter confidence intervals), effects present in only one or a few states can be “drowned out,” and we can observe the effect of applying our rules on a larger scale.
Using actual vote counts from the 2012 presidential election, at precinct-level resolution, we investigated the number of votes in excess of the amount needed to win a seat. A high number of excess votes is a primary indicator of gerrymandering, called “vote-packing”. People will put like-minded-voters together into one un-competitive district, to take away their ability to elect a candidate in other districts, thus reducing the total number of seats they can win.
Our analysis shows that having 5-seat districts, tallying system transferable votes, results in fewer excess votes, and thus, both high partisan proportionality and a high resistance to gerrymandering. States with only 1 or 2 districts to begin with are unable to reap these benefits effectively, as they are limited by their relatively lower population size (Fig. S10).
Conclusion We have demonstrated that using multi-member districts may not serve as a panacea for the woes of the
U.S. political system. For example, when implemented with a non-transferable vote tallying method (such as bloc voting), the outcome is highly disproportional. However, when multi-member districts are combined with a transferable vote tallying method such as STV, proportional representation is dramatically improved, both for political parties (including third and fourth parties) and ethnic minorities. Among these STV systems, after correcting two common errors in the tallying algorithm (namely, reintroducing eliminated candidates each round, and eliminating the weakest set first, rather than the weakest individual candidate first), single-transferable vote (ranked choice) using the Hare quota results in the most proportional representation at both the state and national scales.

Fig. S10. Unrepresented voters by party affiliation for U.S. congressional districts. This analysis used actual precinct-resolution vote counts from the 2012 presidential election. The top map shows the actual single-member districts from the 113th congress (2010 census). The bottom map shows hypothetical 5-member districts (or fewer, where necessary to match current apportionments) created by using a Genetic Algorithm to optimize for maximal compactness, minimal county splits, no precinct splits, and equal population.