supplementary material for -...
TRANSCRIPT

1
Supplementary Material for
Reactive Uptake of Ammonia by Secondary Organic Aerosols: Implications for Air Quality
Jeremy R. Horne,1 Shupeng Zhu,1 Julia Montoya-Aguilera,2 Mallory L. Hinks,2 Lisa M. Wingen,2 Sergey A. Nizkorodov,2 and Donald Dabdub1*
1Computational Environmental Sciences Laboratory, Department of Mechanical & Aerospace Engineering, University of California, Irvine, Irvine, CA, 92697-3975, USA
2Department of Chemistry, University of California, Irvine, Irvine, CA, 92697-3975, USA
*Corresponding author: Donald Dabdub ([email protected])

2
2.1 Modeling Methods
Figure S1: The UCI-CIT model domain (dashed outline). County borders shown as dashed-dot lines.
2.2 Additional Experimental Details
In order to confirm NOC formation in SOA + NH3 reactions, and establish an upper limit on the fraction of SOA compounds that can be converted to NOC, we performed several smog chamber experiments. A biogenic (limonene) or an anthropogenic (toluene, n-hexadecane) VOC was oxidized in a 5 m3 Teflon chamber to generate SOA under low-NOx conditions. We deliberately used low-NOx conditions to avoid interference between NOC formed during the oxidation and NOC resulting from the reactive uptake of NH3 onto SOA particles. No inorganic seed aerosol was used to avoid interference with mass-spectrometric analysis of SOA. Relative humidity (RH) in the chamber was achieved by flowing purified air through a Nafion humidifier. The relative humidity (±2% RH) and temperature (±1°C) were monitored with a Vaisala HMT330 probe. (The RH was <2% for most experiments. However, in addition to generating toluene SOA at low RH, a set of experiments were also performed at ~50% RH due to the known low viscosity of toluene SOA at low RH.) Limonene (97%, Sigma) was introduced to the chamber to reach a mixing ratio of 500 ppb. Subsequently, 1000 ppb of O3 was introduced into the chamber, and gases in the chamber were mixed with a fan for 10 minutes. The fan was turned off after that to slow down particle wall loss. Anthropogenic SOA was produced from photooxidation of 1000 ppb toluene (99.8%, Fisher Scientific) or 500 ppb n-hexadecane (99%, Sigma-Aldrich). In these photooxidation experiments, aqueous hydrogen peroxide (30 % wt, Fisher Scientific) was introduced into the chamber by evaporation into a flow of clean air to achieve an initial mixing ratio of 2 part per million by volume (ppm). After mixing with a fan for

3
10 minutes, UV-B lamps were turned on to initiate the photooxidation. After the particle mass concentration of SOA reached a peak value, a measured volume of gas mixture containing NH3 (1000 ppm NH3 in N2, Airgas) was introduced into the chamber. The target mixing ratio of NH3 in the chamber was supposed to be 500 ppb, however, due to losses in the inlet lines and chamber walls the actual mixing ratio of NH3 was around 200 ppb as verified with an Ecotech 9842 NH3/NOx analyzer (which uses an external converter to convert NH3 to NO and then measures NO). Particle volume concentration was monitored with a scanning mobility particle sizer (SMPS; TSI 3936). The chemical composition of SOA particles was probed online with a Time-of-Flight Aerosol Mass Spectrometer (ToF-AMS). The ToF-AMS data were analyzed using PIKA 1.16I with SQUIRREL 1.57I software.
The polydispersed particles were collected on a Teflon filter (47 mm diameter, Millipore FGLP04700) at 20 L min-1 for 3 hours and prepared for composition analysis via direct analysis in real time mass spectrometry (DART-MS). The sample was extracted by placing the filter face down in a petri dish containing 3 mL of acetonitrile (LC-MS grade, 99.9% purity, Honeywell) and placed in a shaker for 5 minutes. Aliquots from the acetonitrile SOA extracts were transferred onto a clean stainless-steel mesh, dried in air and manually inserted between the DART ion source and mass spectrometer inlet. The DART-MS consisted of a Xevo TQS quadrupole mass spectrometer (Waters) equipped with a commercial DART ion source (Ion-Sense, DART SVP with Vapur® Interface). It was operated with the following settings: -350 V grid electron voltage, 3.1 L/min He gas flow, 350°C He gas temperature, and 70°C source temperature. The samples were analyzed with DART-MS in both positive and negative ion modes. Background spectra from the pure solvent were also collected and subtracted from the DART mass spectra.
Additional experiments were performed in which SOA particles were exposed to NH3 vapor directly on a filter, after the collection. The Teflon filter containing the collected particles was cut in half. Each filter half was placed in a small petri dish and was allowed to float on the surface of a liquid in a larger petri dish. One of the larger petri dishes contained nanopure water and another contained a 0.1 M ammonium sulfate (>99%, EMD) solution. Each larger petri dish was covered separately and stored in the dark. The filter was never in direct contact with liquid, but it was exposed to the vapors above the liquid. The estimated mixing ratio of gaseous ammonia above 0.1 M ammonium sulfate solution is about 300 ppb according to AIM-II model [Clegg et al., 1998]. After two days of aging, the samples were extracted in acetonitrile and analyzed with DART-MS as described above. In some cases, for example for limonene SOA, the filter that was aged over the ammonium sulfate solution became visibly brown, in agreement with previous observations [Laskin et al., 2010].
In a typical DART ionization, a proton is either added (positive mode) or subtracted (negative mode) leading to largely unfragmented molecular ions of with an m/z of [M+H]+ or [M-H]- ions, respectively. We expected the SOA compounds which were not exposed to NH3 to consist of only C, H, and O atoms (CHO compounds). The CHO compounds have even nominal molecular weights and appear in the DART mass spectra at odd nominal m/z values. After the

4
exposure, we expected some of the CHO compounds to be converted into molecules having one nitrogen atom. The resulting CHON compounds would have odd nominal molecular weights and appear at even m/z values. Our (crude) way of testing for the occurrence of the CHO + NH3 → CHON reaction was to compare the combined abundances of all even peaks and odd peaks before and after the exposure to ammonia. Specifically, the average nitrogen fraction (fN) of nitrogen-containing organic compounds (NOC) in the SOA sample exposed to NH3 was estimated with the following equations:
𝑓𝑁 =1𝜎
(𝑅𝑅𝑅𝑅𝑜𝑁𝐻3 − 𝑅𝑅𝑅𝑅𝑜𝑐𝑐𝑐𝑐𝑐𝑐𝑐)
𝑅𝑅𝑅𝑅𝑜 =∑ 𝐼𝑖𝑒𝑒𝑒𝑐
∑ 𝐼𝑖𝑐𝑜𝑜.
The variable “σ” accounts for the different ionization probability of CHON compounds
(typically higher in the positive ion mode mass spectra) relative to that of CHO compounds. In the absence of better information, the average detection sensitivity for CHO and CHON was assumed to be equal (σ = 1). We note that this is a highly approximate treatment, and therefore, the fractional amount of nitrogen obtained from these equations should be treated as an order-of-magnitude estimate. The results of these measurements are described in the main text.
5
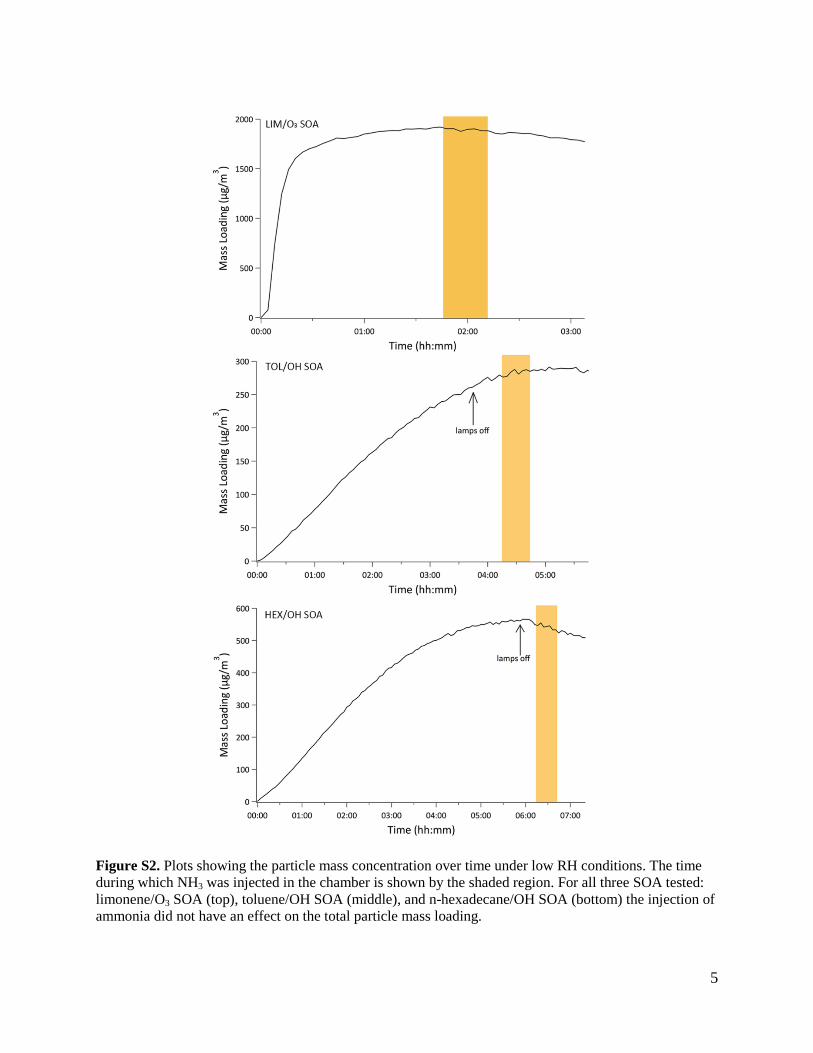
Figure S2. Plots showing the particle mass concentration over time under low RH conditions. The time during which NH3 was injected in the chamber is shown by the shaded region. For all three SOA tested: limonene/O3 SOA (top), toluene/OH SOA (middle), and n-hexadecane/OH SOA (bottom) the injection of ammonia did not have an effect on the total particle mass loading.

6
Figure S3. Plots showing the N:C ratio of the particle composition over time for limonene/O3 SOA and n-hexadecane/OH SOA generated under low RH and toluene/OH SOA generated under 54% RH in the chamber. Ammonia exposure (shaded region) caused a small increase in the N:C ratio in the limonene/O3 SOA (top). In contrast, after NH3 exposure, no clear changes in N:C ratio were observed in the toluene/OH SOA (middle) nor n-hexadecane/OH SOA (bottom). Given the known higher viscosity of toluene/OH particles at low RH, toluene/OH was also generated at higher RH (54%) shown here.The H:C and O:C ratios (not shown) remained approximately constant in all three SOA systems over time.

7
Figure S4. DART mass spectra of limonene/O3 SOA samples generated under low RH conditions in the chamber in the absence of NH3 (black) and in the presence of NH3 (red). The shaded box in the top panel is magnified in the middle panel. In the bottom panel, the ratio of the peak abundance of the SOA exposed to NH3 over the peak abundance of SOA not exposed to NH3 is plotted as a function of m/z. The bottom plot illustrates how presence of NH3 generally leads to an increase in the abundance of even m/z peaks in the limonene SOA system. The peak abundance at each m/z has been normalized with respect to the sum of total peak abundances in each mass spectrum.
8
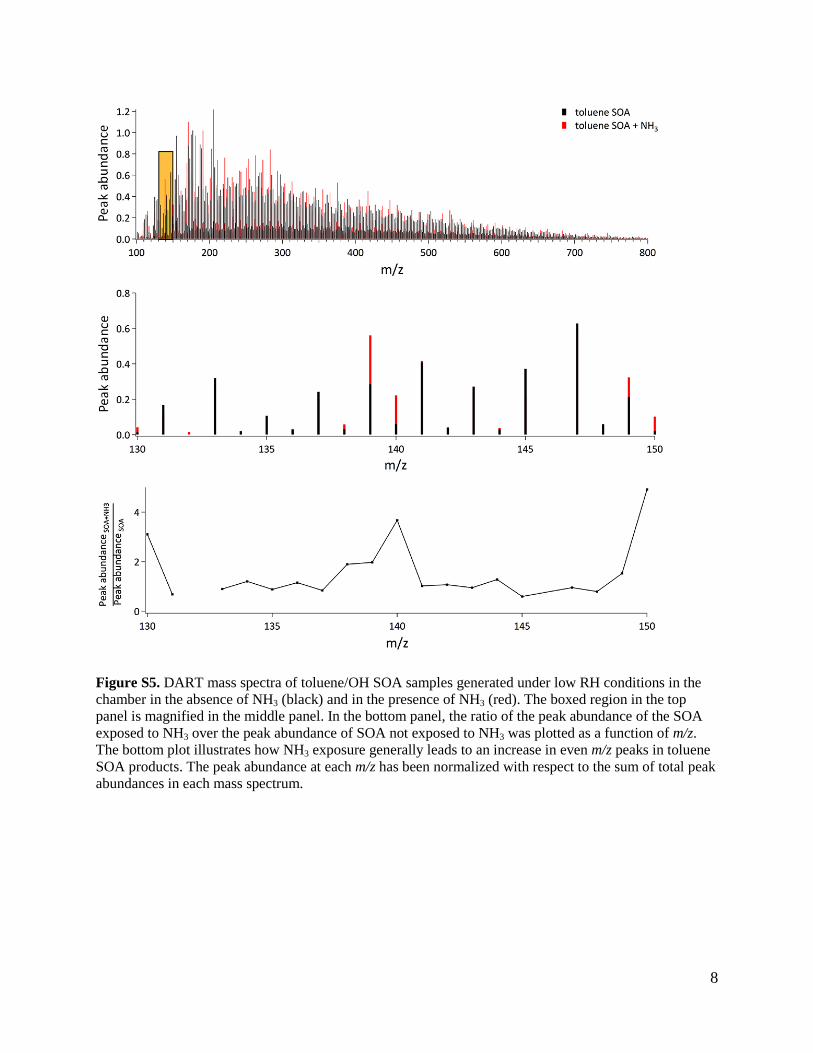
Figure S5. DART mass spectra of toluene/OH SOA samples generated under low RH conditions in the chamber in the absence of NH3 (black) and in the presence of NH3 (red). The boxed region in the top panel is magnified in the middle panel. In the bottom panel, the ratio of the peak abundance of the SOA exposed to NH3 over the peak abundance of SOA not exposed to NH3 was plotted as a function of m/z. The bottom plot illustrates how NH3 exposure generally leads to an increase in even m/z peaks in toluene SOA products. The peak abundance at each m/z has been normalized with respect to the sum of total peak abundances in each mass spectrum.
9
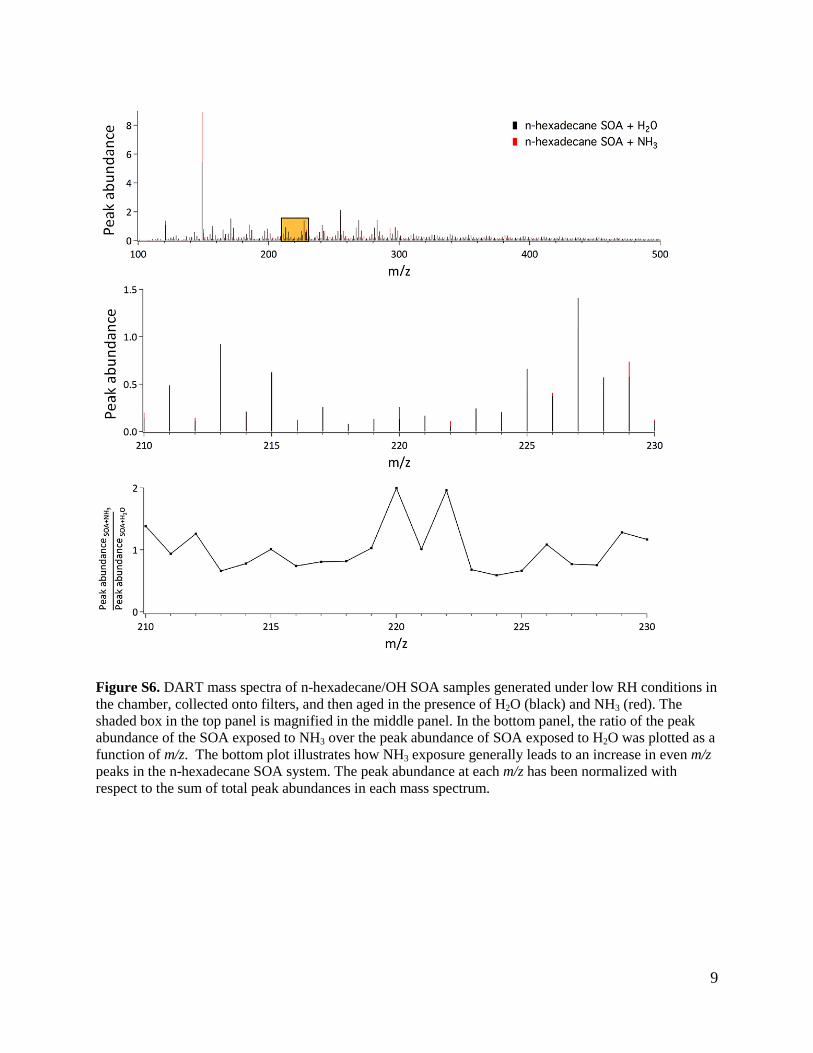
Figure S6. DART mass spectra of n-hexadecane/OH SOA samples generated under low RH conditions in the chamber, collected onto filters, and then aged in the presence of H2O (black) and NH3 (red). The shaded box in the top panel is magnified in the middle panel. In the bottom panel, the ratio of the peak abundance of the SOA exposed to NH3 over the peak abundance of SOA exposed to H2O was plotted as a function of m/z. The bottom plot illustrates how NH3 exposure generally leads to an increase in even m/z peaks in the n-hexadecane SOA system. The peak abundance at each m/z has been normalized with respect to the sum of total peak abundances in each mass spectrum.
10
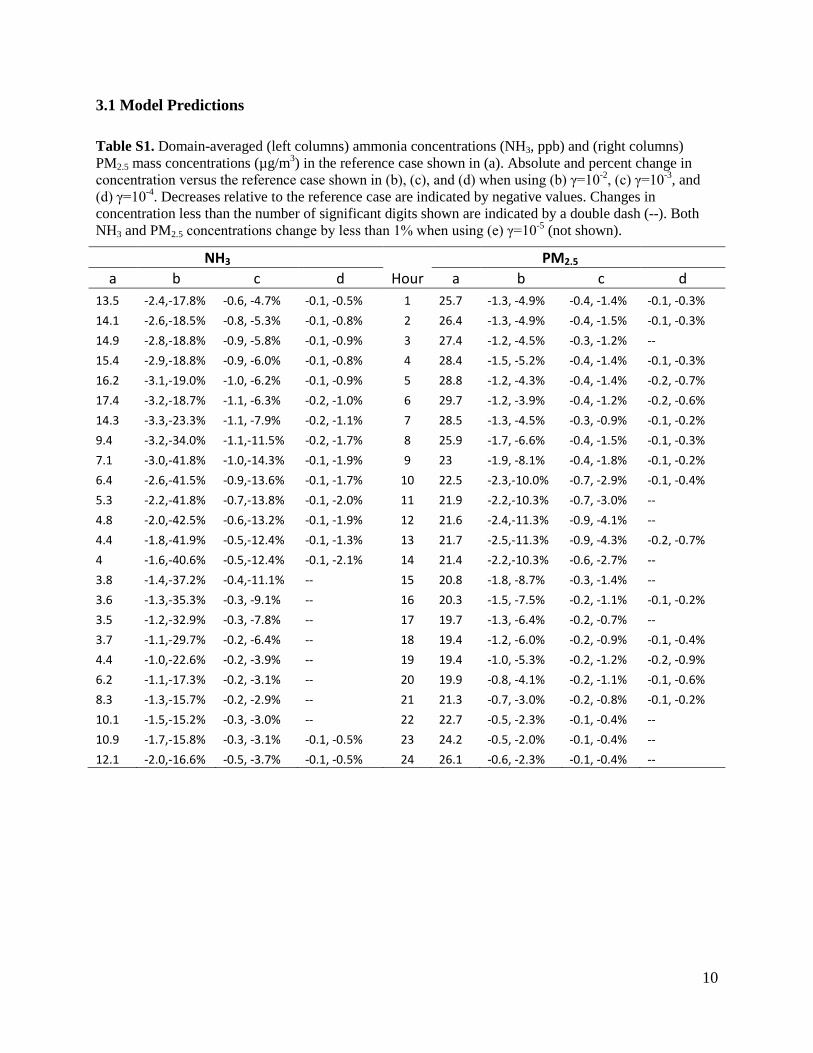
3.1 Model Predictions Table S1. Domain-averaged (left columns) ammonia concentrations (NH3, ppb) and (right columns) PM2.5 mass concentrations (µg/m3) in the reference case shown in (a). Absolute and percent change in concentration versus the reference case shown in (b), (c), and (d) when using (b) γ=10-2, (c) γ=10-3, and (d) γ=10-4. Decreases relative to the reference case are indicated by negative values. Changes in concentration less than the number of significant digits shown are indicated by a double dash (--). Both NH3 and PM2.5 concentrations change by less than 1% when using (e) γ=10-5 (not shown).
NH3
PM2.5
a b c d Hour a b c d 13.5 -2.4,-17.8% -0.6, -4.7% -0.1, -0.5% 1 25.7 -1.3, -4.9% -0.4, -1.4% -0.1, -0.3% 14.1 -2.6,-18.5% -0.8, -5.3% -0.1, -0.8% 2 26.4 -1.3, -4.9% -0.4, -1.5% -0.1, -0.3% 14.9 -2.8,-18.8% -0.9, -5.8% -0.1, -0.9% 3 27.4 -1.2, -4.5% -0.3, -1.2% -- 15.4 -2.9,-18.8% -0.9, -6.0% -0.1, -0.8% 4 28.4 -1.5, -5.2% -0.4, -1.4% -0.1, -0.3% 16.2 -3.1,-19.0% -1.0, -6.2% -0.1, -0.9% 5 28.8 -1.2, -4.3% -0.4, -1.4% -0.2, -0.7% 17.4 -3.2,-18.7% -1.1, -6.3% -0.2, -1.0% 6 29.7 -1.2, -3.9% -0.4, -1.2% -0.2, -0.6% 14.3 -3.3,-23.3% -1.1, -7.9% -0.2, -1.1% 7 28.5 -1.3, -4.5% -0.3, -0.9% -0.1, -0.2% 9.4 -3.2,-34.0% -1.1,-11.5% -0.2, -1.7% 8 25.9 -1.7, -6.6% -0.4, -1.5% -0.1, -0.3% 7.1 -3.0,-41.8% -1.0,-14.3% -0.1, -1.9% 9 23 -1.9, -8.1% -0.4, -1.8% -0.1, -0.2% 6.4 -2.6,-41.5% -0.9,-13.6% -0.1, -1.7% 10 22.5 -2.3,-10.0% -0.7, -2.9% -0.1, -0.4% 5.3 -2.2,-41.8% -0.7,-13.8% -0.1, -2.0% 11 21.9 -2.2,-10.3% -0.7, -3.0% -- 4.8 -2.0,-42.5% -0.6,-13.2% -0.1, -1.9% 12 21.6 -2.4,-11.3% -0.9, -4.1% -- 4.4 -1.8,-41.9% -0.5,-12.4% -0.1, -1.3% 13 21.7 -2.5,-11.3% -0.9, -4.3% -0.2, -0.7% 4 -1.6,-40.6% -0.5,-12.4% -0.1, -2.1% 14 21.4 -2.2,-10.3% -0.6, -2.7% -- 3.8 -1.4,-37.2% -0.4,-11.1% -- 15 20.8 -1.8, -8.7% -0.3, -1.4% -- 3.6 -1.3,-35.3% -0.3, -9.1% -- 16 20.3 -1.5, -7.5% -0.2, -1.1% -0.1, -0.2% 3.5 -1.2,-32.9% -0.3, -7.8% -- 17 19.7 -1.3, -6.4% -0.2, -0.7% -- 3.7 -1.1,-29.7% -0.2, -6.4% -- 18 19.4 -1.2, -6.0% -0.2, -0.9% -0.1, -0.4% 4.4 -1.0,-22.6% -0.2, -3.9% -- 19 19.4 -1.0, -5.3% -0.2, -1.2% -0.2, -0.9% 6.2 -1.1,-17.3% -0.2, -3.1% -- 20 19.9 -0.8, -4.1% -0.2, -1.1% -0.1, -0.6% 8.3 -1.3,-15.7% -0.2, -2.9% -- 21 21.3 -0.7, -3.0% -0.2, -0.8% -0.1, -0.2% 10.1 -1.5,-15.2% -0.3, -3.0% -- 22 22.7 -0.5, -2.3% -0.1, -0.4% -- 10.9 -1.7,-15.8% -0.3, -3.1% -0.1, -0.5% 23 24.2 -0.5, -2.0% -0.1, -0.4% -- 12.1 -2.0,-16.6% -0.5, -3.7% -0.1, -0.5% 24 26.1 -0.6, -2.3% -0.1, -0.4% --

11
Figure S7: 24-hour average concentrations of SOA (µg/m3) in the reference case.

12
Figure S8: 24-hour average concentrations of nitric acid (HNO3, ppb) and sulfuric acid (H2SO4, ppb) in the base case shown in (a). Difference in concentration versus the base case shown in rows (b), (c), (d) and (e) when using (b) γ=10-2, (c) γ=10-3, (d) γ=10-4 and (e) γ=10-5. Negative values represent decreases in concentration with respect to the base case.
13
References
Clegg, S.L., Brimblecombe, P. and Wexler, A.S., (1998). Thermodynamic model of the system H+− NH4+− SO42-− NO3-− H2O at tropospheric temperatures. The Journal of Physical Chemistry A, 102(12), 2137-2154.
Laskin, J., Laskin, A., Roach, P.J., Slysz, G.W., Anderson, G.A., Nizkorodov, S.A., Bones, D.L. and Nguyen, L.Q., (2010). High-resolution desorption electrospray ionization mass spectrometry for chemical characterization of organic aerosols. Analytical Chemistry, 82(5), 2048-2058.
Updyke, K.M., Nguyen, T.B. and Nizkorodov, S.A., (2012). Formation of brown carbon via reactions of ammonia with secondary organic aerosols from biogenic and anthropogenic precursors. Atmospheric Environment, 63, 22-31.