supplementary material for: a secondary mutation in braf ... file⚫ supplementary figure s5:...
TRANSCRIPT

Wang et al. Supplemental: Acquired resistance mutation in BRAF.
Supplementary Material for:
A secondary mutation in BRAF confers resistance to RAF inhibition in a BRAF
V600E-mutant brain tumor
Jiawan Wang, Zhan Yao, Philip Jonsson, Amy N. Allen, Alice Can Ran Qin, Sharmeen
Uddin, Ira J. Dunkel, Mary Petriccione, Katia Manova, Sofia Haque, Marc K. Rosenblum,
David J. Pisapia, Neal Rosen, Barry S. Taylor, Christine A. Pratilas
Supplementary Figures
⚫ Supplementary Figure S1: Representative H&E, phospho-ERK and FISH images of
pre-dabrafenib (3) and post-dabrafenib (4) tumors.
⚫ Supplementary Figure S2: WES analysis of copy number variation in pre- and post-
dabrafenib tumors.
⚫ Supplementary Figure S3: Whole copy number profiles from WES of pre- and post-
treatment tumors.
⚫ Supplementary Figure S4: Homology alignment of BRAF p. L514 with residues in
other tyrosine kinases.
⚫ Supplementary Figure S5: Relative frequency of BRAF variant alleles in SK-BT-DR
cells determined by individual clone sequencing.
⚫ Supplementary Figure S6: BRAF V600E/L514V reduces dabrafenib sensitivity in NIH-
3T3 cells, related to Figure 2.
⚫ Supplementary Figure S7: BRAF V600E/L514V confers biochemical resistance to
dabrafenib over a time course, related to Figure 2G.
⚫ Supplementary Figure S8: Comparison of IC50, IC75 and IC90 of dabrafenib against
A375 cells expressing BRAF V600E and BRAF V600E/L514V, related to Figure 2H.
⚫ Supplementary Figure S9: The BRAF V600E/L514V double mutant promotes
homodimerization, related to Figure 3A and B.
⚫ Supplementary Figure S10: BRAF L514V alone is hypoactive and associated with
decreased ERK signaling that is not sensitive to dabrafenib.
⚫ Supplementary Figure S11: BRAF V600E/L514V is inhibited by dabrafenib in a
purified kinase assay, indicating that it is not a gatekeeper mutation.
⚫ Supplementary Figure S12: Quantitation of p-MEK and p-ERK immunoblots, related
to Figure 4B.
⚫ Supplementary Figure S13: Comparison of IC50, IC75 and IC90 of trametinib against
A375 expressing BRAF V600E and BRAF V600E/L514V, related to Figure 4C.

Wang et al. Supplemental: Acquired resistance mutation in BRAF.
Supplementary Figure S14: The BRAF V600E/L514V mutant mediates resistance to
dabrafenib that cannot be completely overcome by trametinib or dabrafenib plus
trametinib, related to Figure 4D.
Supplementary Figure S15: V5, p-MEK, total MEK immunoblots, and quantitation of
p-ERK immunoblots, related to Figure 5A.
Supplementary Figure S16: Novel RAF dimer inhibitors, MEK inhibitor and ERK
inhibitor equipotently inhibit cell growth in BRAF V600E and V600E/L514V expressing
cells.
Supplementary Figure S17: Novel RAF dimer inhibitor, MEK inhibitor and ERK
inhibitor equipotently inhibit ERK signaling in BRAF V600E and V600E/L514V
expressing cells.
Supplementary Figure S18: BGB3245 binds mutant BRAF V600E monomer and
second site of V600E/L514V dimer with similar affinity.
Supplementary Tables
Supplementary Table S1: Mutations identified by WES of pre-dabrafenib and post-
dabrafenib tumors.
Supplementary Table S2: Secondary mutations associated with acquired resistance
and occurring in residues homologous with L514 in BRAF.
Supplementary Table S3: BRAF L514V allele frequency determined by ddPCR.
Supplementary Methods
Supplementary References

H&E
3, pre
-dabra
fenib
A
pERK
4, astr
ocytic
4, sarc
om
a4, olig
o-lik
e
BRAF - Cen7
B C
F
I
E
H
D
G
J K L
Supplementary Figure S1. Wang et al. Supplemental

Wang et al. Supplemental: Acquired resistance mutation in BRAF.
Fig. S1. Representative H&E, phospho-ERK and FISH images of pre-dabrafenib (3)
and post-dabrafenib (4) tumors.
The post-dabrafenib tumor was comprised of three distinct histologic areas, including
astrocytic, rhabdomyosarcomatous, and oligo-like, shown separately. A, D, G and J. H&E
images. B, E, H and K. Representative images from immunohistochemical detection of
phospho-ERK. C, F, I and L. 3-color BRAF/Cen7 fluorescence in situ hybridization (FISH)
detection of BRAF. 3’ BRAF = Green; 5’ BRAF = Red. A centromeric repeat plasmid for
chromosome 7 served as the control (Blue). Scale bars = 30 μm.

Supplementary Figure S4.
Supplementary Figure S2.
Pre-treatment Post-treatment
2
0
-2
Cop
y nu
mbe
r(lo
g ra
tio)
Alle
le-s
peci
fic(lo
g od
ds ra
tio)
Inte
ger
copy
num
ber
420
-2-4
2
0
1
3
6 7 8 9 6 7 8 9
Wang et al. Supplemental
40%35%
0
25%
WT BRAF
BRAF V600E
BRAF L514V
BRAF V600E L514V
40
50
30
20
10
0
Alle
le fr
eque
ncy
of B
RA
F
BRAF 500 NEVGVLR-KTRHVNILLFMGYSTKPQLA-IVTQWCEGSSLYHHLHIIE------------ 545514
299
1180
783
654
573
315 317
1196
798
670
589 595
1202 1203
ERBB2 769 DEAYVMA-GVGSPYVSRLLGICLTSTVQ-LVTQLMPYGCLLDHVRENR------------ 814
ALK 1166 MEALIIS-KFNHQNIVRCIGVSLQSLPRFILLELMAGGDLKSFLRETRPRP--------- 1215
ABL1 285 KEAAVMK-EIKHPNLVQLLGVCTREPPFYIITEFMTYGNLLDYLRECNR----------- 332
KIT 639 SELKVLSYLGNHMNIVNLLGACTIGGPTLVITEYCCYGDLLNFLRRKRDSFICSKQEDHA 698
NTRK1 559 REAELLT-MLQHQHIVRFFGVCTEGRPLLMVFEYMRHGDLNRFLRSHGPDAKLLA----- 612
Pre-treatment
Post-treatment
2
0
-2
Cop
y nu
mbe
r(lo
g ra
tio)
-4
1 2 3 4 5 6 7 8 9 10 11 12 13 14 1516 171819202122
Supplementary Figure S3.
2
0
-2
Cop
y nu
mbe
r(lo
g ra
tio)
-4
Supplementary Figure S5.

Wang et al. Supplemental: Acquired resistance mutation in BRAF.
Fig. S2. WES analysis of copy number variation in pre- and post-dabrafenib tumors.
Total, allele-specific, and integer copy number data (top, middle, and bottom) from pre-
and post-treatment WES data as indicated (left and right, respectively), showing
chromosomes 6-9. The BRAF locus is indicated with a green line.
Fig. S3. Whole copy number profiles from WES of pre- and post- treatment tumors.
Total copy number data from pre- (top) and post- (bottom) treatment tumors, showing
chromosomes 1 – 22.
Fig. S4. Homology alignment of BRAF p. L514 with residues in other tyrosine
kinases.
Alignment of the relevant BRAF sequence with that of five other tyrosine kinase targets in
which secondary mutations occur as major mechanisms of acquired resistance. L514 is
homologous to the amino acid changes associated with acquired resistance as shown.
References: ABL1: (5-7); ALK: (8); ErbB2: (9); KIT: (10-12); NTRK1: (13, 14).
Fig. S5. Relative frequency of BRAF variant alleles in SK-BT-DR cells determined
by individual clone sequencing.
Twenty individual clones were sequenced. The frequency of wild-type BRAF and variant
alleles (V600E, L514V, or V600E/L514V) is shown as a percent of total.

Vect
orBR
AFBR
AF V
EBR
AF V
EHBR
AF L
VBR
AF L
VHBR
AF V
ELV
BRAF
VEL
VH
BRAF
ERKpERK
V5pMEK
A. B.
BRAF
ERKpERK
V5pMEK
- + - + - + - + - +
BRAF
BRAF
VE
BRAF
LV
BRAF
VEL
V
BRAF
VEL
VH
dabrafenib
BRAF
MEK1pMEK
dabrafenib
VELVVE
ATP
3 100
10 30 300
0 1 1000
+++++ +++
3 100
10 30 300
0 1 1000
+++++ +++
Supplementary Figure S10.
GFPVEVELV
0 2 4 6 8 10 12 14Time (hr)
rela
tive
pER
K (%
)
0
20
40
60
80
100
120
Supplementary Figure S7.
BRAF
ERKpERK
V5pMEK
NIH-3T3UT VE VELV
- - + + + dabrafenib
Supplementary Figure S6. Wang et al. Supplemental
Supplementary Figure S11.
Supplementary Figure S8.
Supplementary Figure S9. B.
V5pMEK
pERKERK
MEK1
FLAG
V5FLAG
IP: A
nti-V
5In
put
VE-V5
VELV-V5VE-FLAG
VELV-FLAGUT UT UT M
++--
++
--
++--
++
--
++--
++
--
MM
+ lapatinib
BRAF
Cell line
IC90
WT-
V5/F
LAG
p61
VE-V
5/FL
AGVE
-V5/
FLAG
VELV
-V5/
FLAG
IP: A
nti-V
5 In
put
Rel
ativ
e FL
AG (I
P/W
CL)
DMSO
0
0.5
1.0
1.5
2.0
2.5
VEVELV
*FLAG
V5
FLAG
V5
pERKpMEK
MEK1
A.
-
dabrafenib, nM
Cell lineA375_VE
A375_VELV
IC75 IC9011.2189.66
127.07844.08
IC500.999.52

Wang et al. Supplemental: Acquired resistance mutation in BRAF.
Fig. S6. BRAF V600E/L514V reduces dabrafenib sensitivity in NIH-3T3 cells, related
to Figure 2.
NIH-3T3 cells were transfected with BRAF mutants (V600E or V600E/L514V) for 24 hr,
followed by treatment with dabrafenib (300 nM, or DMSO as control) for 1 hr.
Untransfected (UT). The indicated proteins were assessed by immunoblot.
Fig. S7. BRAF V600E/L514V confers biochemical resistance to dabrafenib over a
time course, related to Figure 2G.
A375 cells expressing doxycycline-inducible BRAF V600E or BRAF V600E/ L514V (or
GFP as control) were treated with dabrafenib (100nM) over a time course as shown.
Phospho-ERK (p-ERK) (detected by immunoblot, Figure 2G) was quantitated by
densitometry using Image J, and is shown as a percent of baseline (time = 0 hr) as a
function of time.
Fig. S8. Comparison of IC50, IC75 and IC90 of dabrafenib against A375 cells
expressing BRAF V600E and BRAF V600E/L514V, related to Figure 2H.
IC50, IC75 and IC90 values were calculated by CompuSyn software.
Fig. S9. The BRAF V600E/L514V double mutant promotes homodimerization,
related to Figure 3A and B.
SKBR3 cells expressing WT BRAF and indicated tagged BRAF mutants were treated with
DMSO (A) or lapatinib (B) for 1 hr. The interaction between V5-tagged and FLAG-tagged
BRAF mutants were determined by immunoprecipitation (IP), followed by immunoblotting
for the indicated proteins. Untransfected (UT); Whole cell lysate (WCL); Medium (M)
indicates medium level of tagged construct expression, as shown in Figure 3B. Relative
FLAG signal (IP/WCL) for BRAF V600E and V600E/L514V mutants in S9A was
quantitated by Image J and shown as bar graph with statistical analysis to indicate
replicate experiments.

Wang et al. Supplemental: Acquired resistance mutation in BRAF.
Fig. S10. BRAF L514V alone is hypoactive and associated with decreased ERK
signaling that is not sensitive to dabrafenib.
A-B. SKBR3 cells transiently transfected with the indicated plasmids were treated with
lapatinib (1 μM) for 1 hr (A and B) and then treated with dabrafenib (200nM) for 1 hr (B
only). Proteins as indicated were detected by immunoblotting. BRAF V600E (VE);
V600E/R509H (VEH); L514V (LV); L514V/R509H (LVH); V600E/L514V (VELV);
V600E/L514V/R509H (VELVH).
Fig. S11. BRAF V600E/L514V is inhibited by dabrafenib in a purified kinase assay,
indicating that it is not a gatekeeper mutation.
293H cells expressing V5-tagged BRAF V600E or V600E L514V were treated with
dabrafenib, doses as shown. BRAF mutants were immunoprecipitated from whole-cell
lysates and subjected to a kinase assay using an inactive MEK1 (K97R, kinase-dead) as
the substrate in the presence of ATP Kinase activity of BRAF mutants was determined by
immunoblotting with a phospho-MEK antibody.

Supplementary Figure S14.
Wang et al. Supplemental
30 1000
100
3000
300
0 10 1000
0
30 1000
100
3000
300
0 10 1000
0
30 1000
100
3000
300
0 10 1000
0
nM
pMEK MEK
DAB
PLX8
394
TAK
BGB3
245
BGB3
290
LY
VEVELV
VEVELV
VEVELV
VEVELV
VEVELV
VEVELV
V5
A.
log [dabrafenib], nM
Rel
ativ
e pE
RK
0
20
40
60
80
100
120
-1 0 321 4
VEVELV
VEVELV
VEVELV
log [PLX8394], nM-1 0 321 4
log [LY3009120], nM-1 0 321 4
Rel
ativ
e pE
RK
0
20
40
60
80
100
120
log [TAK632], nM-1 0 321 4
VEVELV
VEVELV
VEVELV
log [BGB3245], nM-1 0 321 4
log [BGB3290], nM-1 0 321 4
B.
Supplementary Figure S12. pMEK pERK
0
0.2
0.4
0.6
0.8
1.0
1.2
Rel
ativ
e ph
osph
oryl
atio
n le
vel
dabrafenibtrametinib
30 100 0 30 100- - + + +-
30 100 0 30 100- - + + +-
VEVELV
0 0
Supplementary Figure S15.
VEVELV
0
10
20
30
40
30 100 0 30 100- - + + +
dabrafenibtrametinib
*** ** * * **
Cel
l num
ber v
. DM
SO c
trl (%
)
Supplementary Figure S13.
Cell lineA375_VE
A375_VELV
IC75 IC90IC50
trametinib, nM
2.016.95
31.37115.78
0.130.42

Wang et al. Supplemental: Acquired resistance mutation in BRAF.
Fig. S12. Quantitation of p-MEK and p-ERK immunoblots, related to Figure 4B.
p-MEK and p-ERK signal intensity in Figure 4B was quantitated using densitometric
analysis, relative to DMSO control.
Fig. S13. Comparison of IC50, IC75 and IC90 of trametinib against A375 expressing
BRAF V600E and BRAF V600E/L514V, related to Figure 4C.
IC50, IC75 and IC90 values were calculated by CompuSyn software.
Fig. S14. The BRAF V600E/L514V mutant mediates resistance to dabrafenib that
cannot be completely overcome by trametinib or dabrafenib plus trametinib, related
to Figure 4D.
A375 transduced with BRAF VE or VELV were exposed to drug or to DMSO, and cell
counts were measured at 72 hr. Cells were seeded at a density of 60,000 cells/well in 6-
well plates for 24 hr in doxycycline-containing medium and then treated with the indicated
drugs for 72 hr, in triplicate for each condition shown. Doxycycline was replenished at 50%
every 24 hr. Cells were collected by trypsinization and counted using a BioRad TC20
Automated Cell Counter. Average number of viable cells at 72 hr is expressed as percent
relative to DMSO control for each cell line (data represent mean ± SEM, unpaired
Student’s t-test).
Fig. S15. V5, p-MEK, total MEK immunoblots, and quantitation of p-ERK
immunoblots, related to Figure 5A.
A. A375 cells expressing BRAF mutants (V600E or V600E/L514V) were treated with the
indicated compounds for 1 hr, doses as shown, then the cells were lysed and subjected
to immunoblotting. V5, phospho-MEK, and total MEK blots are shown, and correspond to
phospho-ERK and total ERK blots shown in Figure 5A. Dabrafenib (DAB); LY3009120
(LY); TAK-632 (TAK). B. p-ERK signal intensity in Figure 5A was quantitated using

Wang et al. Supplemental: Acquired resistance mutation in BRAF.
densitometric analysis and graphed as a function of compound dose, relative to DMSO
control.
log [SCH772984], nM-3 -2 -1 0 1 2
0
20
40
60
80
100
120
-2 -1 0 1 2
log [Vemurafenib], nM-3 -2 -1 0 1 2
Rel
ativ
e ce
ll vi
abilit
y (%
)
-3 -2 -1 0 1 2
VEVELV
0
20
40
60
80
100
120
Rel
ativ
e ce
ll vi
abilit
y (%
)
-3 -2 -1 0 1 2
0
20
40
60
80
100
120 VEVELV
Rel
ativ
e ce
ll vi
abilit
y (%
)
log [BGB3245], nM-3 -2 -1 0 1 2
VEVELV
log [BGB3290], nM-3 -2 -1 0 1 2
Supplementary Figure S16.
log [PLX8394], nM-3 -2 -1 0 1 2
Rel
ativ
e ce
ll vi
abilit
y (%
)
0
20
40
60
80
100
120
-3log [TAK632], nM
log [Dabrafenib], nM
log [Trametinib], nM
A.
B.
Wang et al. Supplemental
3 3
3 3
3 3
3 3
VEVELV
VEVELV
VEVELV
VEVELV
VEVELV
RatioIC50, nMCompound
VemurafenibDabrafenib
PLX8394TAK-632BGB3245BGB3290Trametinib
SCH772984
A375_VE52.47
18.9545.28
0.99
0.13
24.49127.29
10.21
A375_VELV1222.42
1025.681314.68
9.52
0.42
20.90149.95
7.58
VELV / VE23.30
9.6254.1329.030.851.183.230.74

Wang et al. Supplemental: Acquired resistance mutation in BRAF.
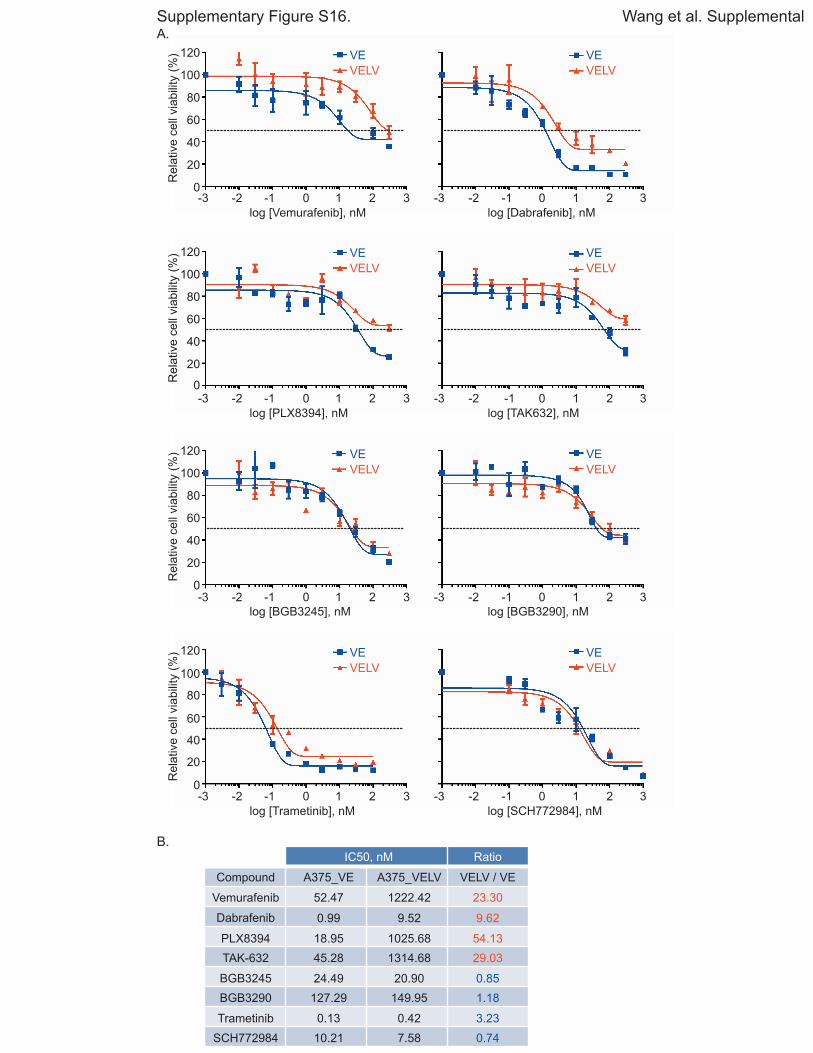
Fig. S16. Novel RAF dimer inhibitors, MEK inhibitor and ERK inhibitor equipotently
inhibit cell growth in BRAF V600E and V600E/L514V expressing cells.
A. A375 cells expressing doxycycline-inducible BRAF mutants (V600E or V600E/L514V)
were seeded in 96-well plates at a density of 1500 cells/well and cultured in medium
containing doxycycline (200 ng/ml and 150 ng/ml, respectively) for 24 hr. The following
day, the cells were treated with the indicated compounds at concentrations shown for
another 72 hr. The relative cell viability was quantitated using cell counting kit 8 (CCK-8)
on day 3, and are expressed relative to DMSO controls. Doxycycline was replenished at
50% every 24 hr. Data represent mean ± SEM. B. IC50 values of compounds against VE
and VELV cell growth were determined by CompuSyn software and are expressed as a
ratio of VELV / VE.

Supplementary Figure S18.
30 1000
100
3000
300
0 10 1000
0
30 1000
100
3000
300
0 10 1000
0
nMDAB
- dox + dox
BRAFV5pMEKpERKERK
30 1000
100
3000
300
0 10 1000
0
30 1000
100
3000
300
0 10 nMBGB3245
- dox + dox
LGX818
- - - - - - - -
- - - - - - - -
+ + + + + + + +
+ + + + + + + +
A. B.
log [Dabrafenib], nM-1 0 32 41
Rel
ativ
e pE
RK
(%)
0
20
40
60
80
100
120
Rel
ativ
e pE
RK
(%)
0
20
40
60
80
100
120
log [BGB3245], nM-1 0 32 41
VEVELV 2nd site
VEVELV 2nd site
Supplementary Figure S17.
1000
0
Wang et al. Supplemental A. B.
V5
pMEK
pERK
ERK
GAPDH
- + + + + + + + + +UT DMSO
DABBGB32
45
trameti
nib
lapatinbPD03
2590
1
MEK162
SCH7729
84
GDC0994
VELVVE
VELVVE
VELVVE
VELVVE
VELVVE
ERK
V5pMEKpERK
UT
VE VELV
DMSODAB
BGB3245
SCH7729
84
trameti
nib
DMSODAB
BGB3245
SCH7729
84
trameti
nib
BRAFV5pMEKpERKERK
LGX818
Wang et al. Supplemental: Acquired resistance mutation in BRAF.
Fig. S17. Novel RAF dimer inhibitor, MEK inhibitor and ERK inhibitor equipotently
inhibit ERK signaling in BRAF V600E and V600E/L514V expressing cells.
A. Transiently transfected SKBR3 cells expressing BRAF VE or VELV mutants were
pretreated with lapatinib for 1 hr and then treated with DMSO, RAF inhibitors (dabrafenib
and BGB3245), MEK inhibitors (trametinib, PD0325901 and MEK162) and ERK inhibitors
(SCH772984 and GDC-0994) for 1 hr. Untransfected (UT) cells treated with or without
lapatinib served as control. The indicated proteins were detected by immunoblotting. B.
DBTRG-05MG cells transfected with V5-tagged BRAF VE or VELV were treated with
DMSO or the indicated compounds for 1 hr, with untransfected (UT) cells as control. The
indicated proteins were evaluated by immunoblotting.
Fig. S18. BGB3245 binds mutant BRAF V600E monomer and second site of
V600E/L514V dimer with similar affinity.
A. A375 cells expressing doxycycline-inducible BRAF V600E/L514V, either with or without
exposure to doxycycline, were pretreated with 1 μM LGX818 (encorafenib) for 1 hr
followed by three washes with fresh drug-free medium, and then treated with increasing
doses of dabrafenib or BGB3245 for 1 hr. The indicated proteins were assessed by
immunoblot. B. p-ERK was quantitated by densitometry using Image J, and is shown as
a percent of baseline (DMSO control) as a function of drug dose.
Wang et al. Supplemental: Acquired resistance mutation in BRAF.
Supplementary Tables
Table S1. Mutations identified by WES of pre-dabrafenib and post-dabrafenib tumors.
Gene Alteration
Pre-treatment Post-treatment
Absolute reads
(variant/ total) Percent
Absolute reads
(variant/ total) Percent
BRAF V600E 40/103 38.8% 47/78 60.3%
BRAF L514V 0/151 0% 37/140 26.4%
SMAD4 G510R 58/167 34.7% 63/156 40.4%
FLT1 G1009S 11/55 20.0% 28/60 46.7%
CDK8 R40G 73/182 40.1% 79/184 42.9%
ATM E1428Kfs*23 25/43 58.1% 22/29 75.9%
ABL1 A366D 36/80 45% 29/66 43.9%
Table S2. Secondary mutations associated with acquired resistance and occurring in
residues homologous with L514 in BRAF.
Gene Primary
mutation
Secondary
mutation
Cancer
type
Resistant
to
Sensitive to Refs.
BRAF V600E L514V Brain
tumor
Dabrafenib BGB3245 Current
study
ABL1 BCR-ABL V299L CML Imatinib/
Bosutinib/
Dasatinib
Nilotinib (5-7)
ALK EML4-ALK V1180L in vitro
screen
Alectinib/
Crizotinib
Ceritinib/
Brigatinib
(8)
ERBB2 V659E S783P in vitro
screen
Lapatinib Tesevatinib (9)
KIT exon 11
exon 9
V654A GIST Imatinib Sunitinib (10-12)
NTRK1 LMNA-
NTRK1MPRIP-
NTRK1
V573M in vitro
screen
LOXO-101 Entrectinib (13, 14)
Chronic myelogenous leukemia (CML); Gastrointestinal stromal tumor (GIST)
Wang et al. Supplemental: Acquired resistance mutation in BRAF.
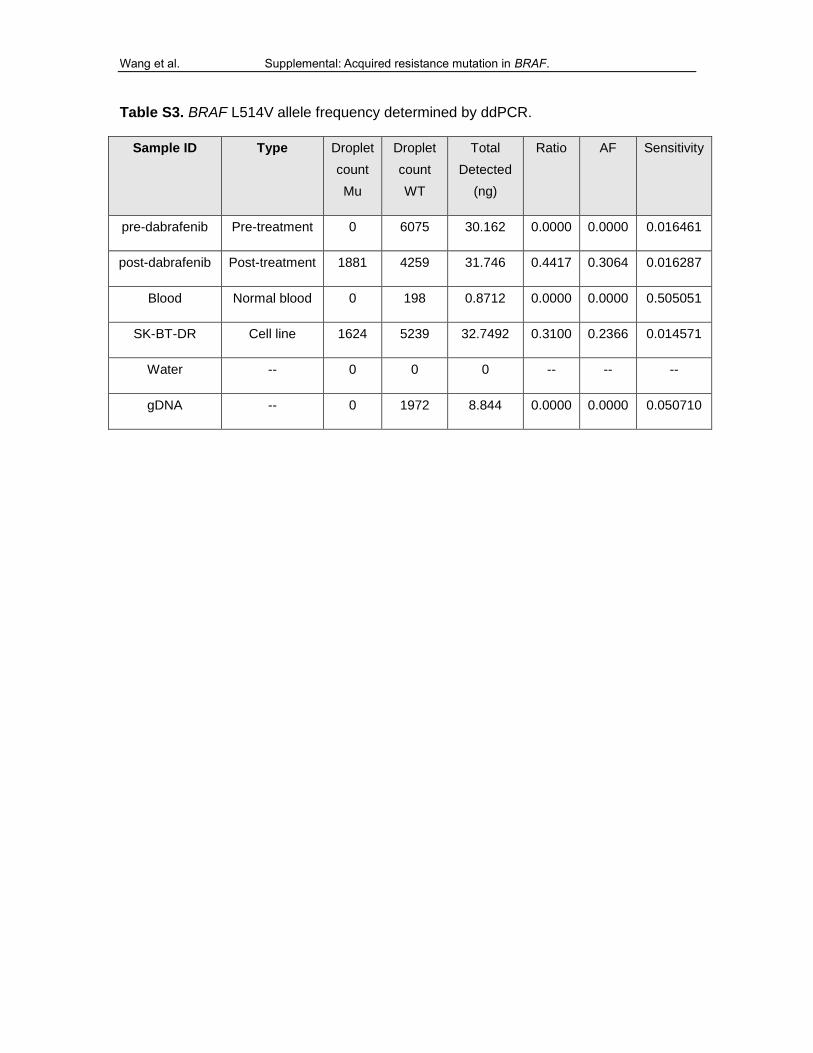
Table S3. BRAF L514V allele frequency determined by ddPCR.
Sample ID Type Droplet
count
Mu
Droplet
count
WT
Total
Detected
(ng)
Ratio AF Sensitivity
pre-dabrafenib Pre-treatment 0 6075 30.162 0.0000 0.0000 0.016461
post-dabrafenib Post-treatment 1881 4259 31.746 0.4417 0.3064 0.016287
Blood Normal blood 0 198 0.8712 0.0000 0.0000 0.505051
SK-BT-DR Cell line 1624 5239 32.7492 0.3100 0.2366 0.014571
Water -- 0 0 0 -- -- --
gDNA -- 0 1972 8.844 0.0000 0.0000 0.050710

Wang et al. Supplemental: Acquired resistance mutation in BRAF.
Supplementary Methods
Whole-exome sequencing. Sample preparation, processing, read alignment and variant
calling, were performed as previously described (1). Exome capture was performed using
SureSelect XT Human All Exon V4 (Agilent Technologies). Mean target coverage was in
the range of 119-139X for all sequenced specimens. Reads were aligned to the human
genome (hg19) with Burrows-Wheeler Aligner (BWA-MEM, version 0.7.15) (2) and
subsequently processed using the Picard and GATK suites for de-duplication and base
recalibration. Single-nucleotide variants and indels were detected using MuTect (version
2.7.1, https://github.com/broadinstitute/mutect) and scalpel (version 0.2.1,
https://github.com/fimad/scalpel), respectively. Putative artifacts were removed using
filters adapted to our sequencing pipeline (http://github.com/mskcc/ngs-filters). Allele-
specific DNA copy number analysis was performed using FACETS (3). Tumor purity and
ploidy estimates from FACETS analysis were used to infer the cancer cell fraction (CCF)
of mutations using a maximum-likelihood, as previously described (4).
Immunohistochemistry. The immunohistochemical detection of phospho-ERK was
performed by the Molecular Cytology Core Facility of Memorial Sloan Kettering Cancer
Center using Discovery XT processor (Ventana Medical Systems, Roche). Tissue
sections were blocked for 30 minutes in 10% normal goat serum. Slides were incubated
with primary antibody (rabbit monoclonal phospho-ERK antibody (Cell Signaling, #4370)
at 1 μg/ml in PBS with 2% BSA for 3 hours, followed by 60 minutes incubation with 5.75
μg/mL biotinylated goat anti-rabbit IgG (Vector Laboratories, cat# PK6101). Detection was
performed with Streptavidin-HRP D (DABMap kit, Ventana Medical Systems, Roche).
Fluorescence in situ hybridization. The short-term culture SK-BT-DR was harvested
and fixed in methanol: acetic acid (3:1) as per standard procedures. FISH was performed
on fixed single cell suspension and formalin fixed paraffin embedded (FFPE) sections
using an in-house 3-color BRAF/Cen7 probe. Bacterial artificial chromosome (BAC)

Wang et al. Supplemental: Acquired resistance mutation in BRAF.
clones were selected from the University of California–Santa Cruz genome browser and
purchased through Roswell Park Cancer Institute (RPCI). BAC clones mapping to 3’BRAF
(RP11-759K14, RP11-788O6) were labeled with Green dUTP and 5’BRAF (RP11-715H9,
RP11-133N19) were labeled with Red dUTP. A centromeric repeat plasmid for
chromosome 7 served as the control (clone p7t1; labeled with DEAC dUTP). Probe
labeling, tissue processing, hybridization, post-hybridization washing, and fluorescence
detection were performed according to standard laboratory procedures. Slides were
scanned using a Zeiss Axioplan 2i epifluorescence microscope equipped with a megapixel
CCD camera (CV-M4+CL, JAI) controlled by Isis 5.5.9 imaging software (MetaSystems
Group Inc). For the short-term cell culture SK-BT-DR, the entire hybridized area was
scanned through 63X or 100X objective, representative cells/regions imaged and a
minimum of 50 discrete nuclei and 20 metaphases analyzed. For paraffin tissue, marked
region(s) within the section was scanned under 63X or 100X objective and representative
regions imaged through the depth of the tissue (compressed/merged stack of 12 z-section
images taken at 0.5-micron intervals). At least five images per representative region were
captured and a minimum of 50 discrete nuclei analyzed. Amplification was defined as a
BRAF/Cen7 (control) ratio of ≥2.0, >10 copies of BRAF (independent of control locus) or
at least one small cluster of BRAF (≥4 signals resulting from tandem repeat/duplication).
Cells with 3~5 and 6~10 discrete copies of BRAF/Cen7 were considered to be polysomic
and high-polysomic, respectively.
Mutation status and allelic distribution of BRAF in SK-BT-DR cells by individual
clone sequencing. RNA was extracted from SK-BT-DR cells, and reverse transcribed
per standard protocols. BRAF coding sequences were amplified from the cDNA and the
PCR products were inserted into T-vector by TA cloning. Bacteria competent cells
(Agilent) were transformed by the plasmids carrying BRAF gene. 20 random individual
colonies were isolated and sequenced.

Wang et al. Supplemental: Acquired resistance mutation in BRAF.
Supplementary References
1. Al-Ahmadie HA, Iyer G, Lee BH, Scott SN, Mehra R, Bagrodia A, et al. Frequent
somatic CDH1 loss-of-function mutations in plasmacytoid variant bladder cancer. Nat
Genet. 2016;48(4):356-8.
2. Li H, Durbin R. Fast and accurate short read alignment with Burrows-Wheeler
transform. Bioinformatics. 2009;25(14):1754-60.
3. Shen R, Seshan VE. FACETS: allele-specific copy number and clonal heterogeneity
analysis tool for high-throughput DNA sequencing. Nucleic Acids Res. 2016;44(16):e131.
4. Hyman DM, Smyth LM, Donoghue MTA, Westin SN, Bedard PL, Dean EJ, et al. AKT
Inhibition in Solid Tumors With AKT1 Mutations. J Clin Oncol. 2017;35(20):2251-9.
5. Jabbour E, Morris V, Kantarjian H, Yin CC, Burton E, Cortes J. Characteristics and
outcomes of patients with V299L BCR-ABL kinase domain mutation after therapy with
tyrosine kinase inhibitors. Blood. 2012;120(16):3382-3.
6. Redaelli S, Piazza R, Rostagno R, Magistroni V, Perini P, Marega M, et al. Activity of
bosutinib, dasatinib, and nilotinib against 18 imatinib-resistant BCR/ABL mutants. J Clin
Oncol. 2009;27(3):469-71.
7. Khoury HJ, Cortes JE, Kantarjian HM, Gambacorti-Passerini C, Baccarani M, Kim
DW, et al. Bosutinib is active in chronic phase chronic myeloid leukemia after imatinib
and dasatinib and/or nilotinib therapy failure. Blood. 2012;119(15):3403-12.
8. Katayama R, Friboulet L, Koike S, Lockerman EL, Khan TM, Gainor JF, et al. Two
novel ALK mutations mediate acquired resistance to the next-generation ALK inhibitor
alectinib. Clin Cancer Res. 2014;20(22):5686-96.
9. Trowe T, Boukouvala S, Calkins K, Cutler RE, Jr., Fong R, Funke R, et al.
EXEL-7647 inhibits mutant forms of ErbB2 associated with lapatinib resistance and
neoplastic transformation. Clin Cancer Res. 2008;14(8):2465-75.
10. Roberts KG, Odell AF, Byrnes EM, Baleato RM, Griffith R, Lyons AB, et al.
Resistance to c-KIT kinase inhibitors conferred by V654A mutation. Mol Cancer Ther.
2007;6(3):1159-66.

Wang et al. Supplemental: Acquired resistance mutation in BRAF.
11. Gajiwala KS, Wu JC, Christensen J, Deshmukh GD, Diehl W, DiNitto JP, et al. KIT
kinase mutants show unique mechanisms of drug resistance to imatinib and sunitinib in
gastrointestinal stromal tumor patients. Proc Natl Acad Sci U S A. 2009;106(5):1542-7.
12. Heinrich MC, Corless CL, Blanke CD, Demetri GD, Joensuu H, Roberts PJ, et al.
Molecular correlates of imatinib resistance in gastrointestinal stromal tumors. J Clin Oncol.
2006;24(29):4764-74.
13. Wei G, Ardini E, Patel R, Cam N, Harris J, Vernier J-M, et al., editors. Entrectinib is
effective against the gatekeeper and other emerging resistance mutations in NTRK-,
ROS1- and ALK- rearranged cancers. Proceedings: AACR 107th Annual Meeting 2016;
New Orleans, LA; 2016.
14. Estrada-Bernal A, Le A, Tuch B, Kutateladze T, Doebele RC, editors. TRK kinase
domain mutations that induce resistance to a pan-TRK inhibitor. AACR-NCI-EORTC
International Conference: Molecular Targets and Cancer Therapeutics; 2015; Boston,
MA.