supplementary material for -...
TRANSCRIPT

www.sciencemag.org/content/343/6172/752/suppl/DC1
Supplementary Material for
Precise and Ultrafast Molecular Sieving through Graphene Oxide Membranes
R. K. Joshi, P. Carbone, F. C. Wang, V. G. Kravets, Y. Su, I. V. Grigorieva, H. A. Wu, A. K. Geim,* R. R. Nair*
*Corresponding author. E-mail: [email protected] (R.R.N.); [email protected]
(A.K.G.)
Published 14 February 2014, Science 343, 752 (2014) DOI: 10.1126/science.1245711
This PDF file includes:
Materials and Methods
Figs. S1 to S4
Table S1
Full Reference List

2
Materials and Methods
1. Fabrication of GO membranes Graphite oxide was prepared by exposing millimeter size flakes of natural graphite
to concentrated sulfuric acid, sodium nitrate and potassium permanganate (Hummers’ method) (31). Then, graphite oxide was exfoliated into monolayer flakes by sonication in water, which was followed by centrifugation at 10,000 rpm to remove remaining few-layer crystals. GO membranes were prepared by vacuum filtration of the resulting GO suspension through Anodisc alumina membranes that had straight pores with a diameter of 0.2 µm, length of 60 µm and porosity of ≈50%. By changing the volume of the filtered GO solution, we could control the thickness h of the resulting membranes, making them from 0.5 µm to more than 10 µm thick. For consistency, all the membranes described in this report were chosen to be 5 µm in thickness, unless a dependence on h was specifically investigated.
We normally left GO laminates on top of the Anodiscs because the latter added little to the permeation barrier but provided a valuable mechanical support for our membranes improving their stability. Nevertheless, we also checked influence of this porous support on the measured permeation and found the same properties for supported and free standing membranes (11).
Although graphite oxide is known to be soluble in water, the vacuum-filtered GO laminates were found to be highly stable in water, and it was practically impossible to re-disperse them without extensive sonication. No thinning of membranes was noticed in our filtration experiments lasting for many weeks. To quantify the solubility of GO laminates, we accurately measured their weight and thickness before and after immersing in water for two weeks. No weight or thickness loss could be detected within our accuracy of better than 1%. 2. Experimental setup
The permeation experiments were performed using a U-shaped device shown in Fig. 1B of the main text. It consisted of two tubular compartments fabricated either from glass or copper tubes (inner diameters of 25 mm), which were separated by the studied GO membranes. The membranes were glued to a Cu foil with an opening of 1 cm in diameter (see Fig. 1A of the main text). The copper foil was clamped between two O-rings, which provided a vacuum-tight seal between the two compartments. In a typical experiment, we filled one of the compartments (referred to as feed) with a salt or molecular solution up to a height of approximately 20 cm (0.1 L volume). The other (permeate) compartment was filled with deionized water to the same level. Note that the hydrostatic pressure due to level changes plays no role in our experiments where the permeation is driven by large concentration gradients. We used magnetic stirring in both feed and permeate compartments to avoid possible concentration gradients near the membranes (so-called concentration polarization effect).
The GO membranes including the entire assembly with the O-rings were thoroughly tested for any possible cracks and holes. In the first control experiment, GO membranes were substituted with a thin Cu film glued to the same Cu foil with all the other steps
3
remaining the same. Using a highly concentrated salt solution in the feed compartment, we could not detect any permeation. In the second experiment, we reduced GO membranes so that the interlayer separation decreased to ≈4 Å (11). No ionic permeation could be detected, which again proves the absence of pin holes in the original GO membrane. Finally and most conclusively, we used a helium-leak detector as described in ref. 11. No leak could be detected in our GO membranes both before and after permeation measurements.
We believe such extensive leak tests are very important for the following reasons. During the last two years, four groups (15-18) studied filtration properties of GO laminates and, although results varied widely due to different fabrication and measurement procedures, they reported appealing filtration characteristics including large water fluxes and notable rejection rates for certain salts. Unfortunately, large organic molecules were also found to pass through such GO filters (16-18). The latter observation is disappointing and would considerably limit interest in GO laminates as molecular sieves. However, this observation is also inconsistent with the known structure of GO laminates (20,21). Small ions can reasonably be expected to move between GO planes separated by d ≤13±1Å (19,22) but large molecules that do not fit within the available interlayer space must not. In this respect, we note that the emphasis of the previous studies was on high water rates that were comparable to the rates used for industrial desalination. Accordingly, a high water pressure was applied (16-18) and the GO membranes were intentionally prepared as thin as possible, 10–50 nm thick (16,17). This thickness corresponds to only a few dozens of GO layers that are made of randomly stacked µm-sized crystallites rather than being continuous graphene sheets. We speculate that such thin stacks contained holes and cracks, through which large organic molecules could penetrate.
3. Monitoring ion diffusion by electrical measurements
For a quick qualitative test of ion permeation through GO membranes, we have used the setup shown in the inset of Fig. S1. The feed and permeate compartments were again separated by GO membranes. We used an assembly similar to that described above but instead of the Cu foil GO membranes were glued to a glass slide with a 2 mm aperture. In addition, the liquid cell was small and made entirely from Teflon to avoid electrical shorting. The feed compartment was initially filled with a few mL of a concentrated salt solution, and the permeate compartment contained a similar volume of deionized water. Our typical feed solution was approximately a million times more electrically conducting than deionized water at room temperature. Therefore, if ions diffuse through the membrane, this results in an increase in conductivity of water at the permeate side (15). Permeation of salts in concentrations at a sub-µM level can be detected in this manner. Resistance of the permeate was monitored by using a Keithley source meter and platinum wires as electrodes.
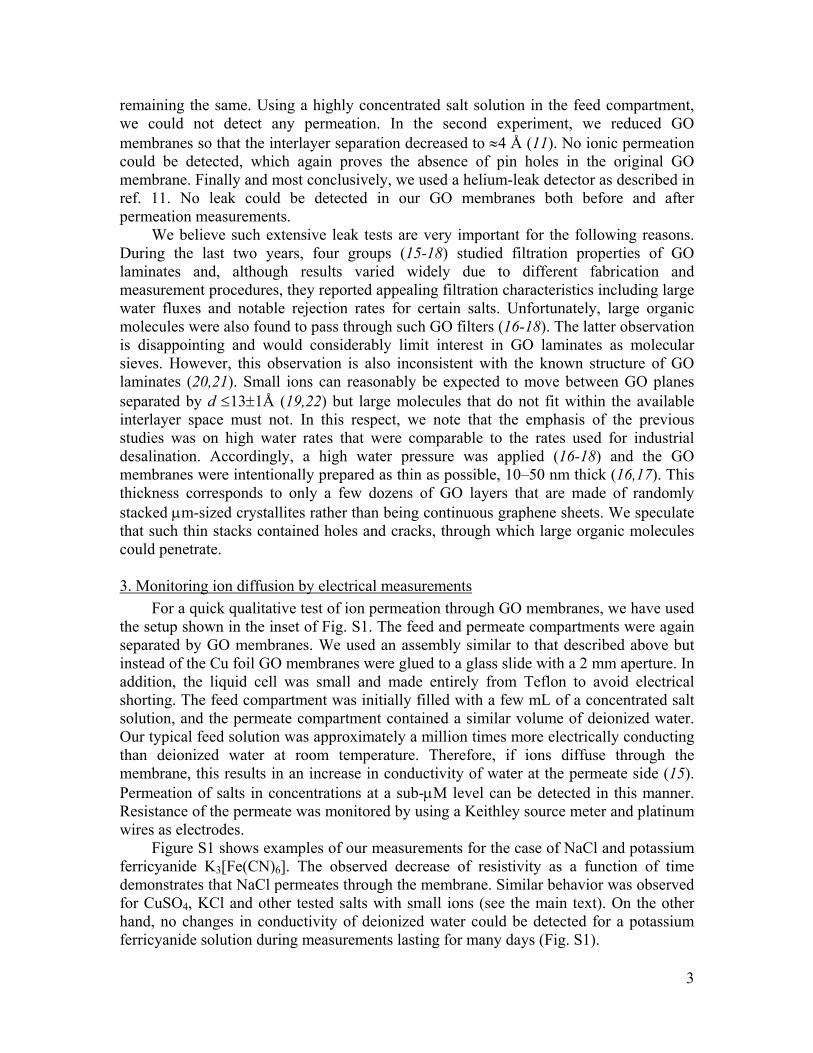
Figure S1 shows examples of our measurements for the case of NaCl and potassium ferricyanide K3[Fe(CN)6]. The observed decrease of resistivity as a function of time demonstrates that NaCl permeates through the membrane. Similar behavior was observed for CuSO4, KCl and other tested salts with small ions (see the main text). On the other hand, no changes in conductivity of deionized water could be detected for a potassium ferricyanide solution during measurements lasting for many days (Fig. S1).
4
Fig. S1. Permeation of salts through GO membranes can be detected by using electrical measurements. The inset shows the measurement setup, and the main figure plots relative changes in resistivity of deionized water with time in the permeate compartment. Changes are normalized to an initial value of the measured resistance. Note that for the case of NaCl, the feed and permeate levels did not change with time, that is, no water flow was observed. This means that the primary permeation process was ion diffusion rather than osmosis, in contrast to the classic osmosis for the K3[Fe(CN)6] case. 4. Quantitative analysis of ion and molecular permeation
The above electrical measurements show qualitatively that small ions can permeate through GO laminates whereas large ions such as [Fe(CN)6]3- cannot. The technique is not applicable for molecular solutes because they exhibit little electrical conductivity. To gain quantitative information about the exact amount of permeating ions as well as to probe permeation of molecular solutes, we carried out chemical analysis of water at the permeate side. Samples were taken at regular intervals from a few hours to a few days and, in some cases, after several weeks. Due to different solubility of different solutes, we used different feed concentrations. They varied from 0.01 to 2 M, depending on a solute. For each salt, we performed measurements at several different feed concentrations to ensure that we worked in the linear response regime where the permeation rate was proportional to the feed concentration (Fig. 1C of the main text) and there was no sign of the concentration polarization effect.
The ion chromatography (IC) and the inductively coupled plasma optical emission spectrometry (ICP-OES) are the standard techniques used to analyze the presence of chemical species in solutions (32-34). We have employed the IC for anionic species, and the ICP-OES for cations. The measurement techniques provided us with values for ion concentrations in the permeate water. Using the known volume of the permeate (~0.1 L) we calculated the number of ions diffused into the permeate compartment. For certain salts (those with low solubility), the obtained permeate solutions were first concentrated by evaporation to improve the measurement accuracy. Furthermore, we crosschecked the results of our chemical analysis by weighing the dry material left after evaporation of water in the permeate compartment. This also allowed us to find the amount of salts

5
permeated through GO membranes. The weight and chemical analyses were in good quantitative agreement.
To detect organic solutes such as glycerol, sucrose and propanol, we employed the total organic carbon (TOC) analysis (34,35). No traces of glycerol and sucrose could be found in our permeate samples after several weeks, but propanol could permeate, although at a rate much lower than small ions as shown in Fig. 2 of the main text. The detection limit of our TOC was about 50 µg/L, and this put an upper limit on permeation of the solutes that could not be detected. The corresponding limiting values are shown by arrows in Fig. 2 of the main text. The above techniques were calibrated using several known concentrations of the studied solutes (typically, 4-5), and the detection limits were identified by decreasing the concentration of the standard solution until the measured signal became five times the baseline noise.
The optical absorption spectroscopy is widely used to detect solutes with absorption lines in the visible spectrum (1,12). We employed this technique for large ions such as [Fe(CN)6]3-, [Ru(bipy)3]2+ of Tris(bipyridine)ruthenium(II) dichloride ([Ru(bipy)3]Cl2) and PTS4- of pyrenetetrasulfonic acid tetrasodium salt (Na4PTS). We could not detect any signatures of [Fe(CN)6]3- , [Ru(bipy)3]2+ and PTS4- on the permeate side, even after many weeks of running the analysis. The absorption spectra were taken with an empty container as a background reference. The detection limit was estimated by measuring a reference solution and gradually decreasing its concentration by a factor of 2-3 until the optical absorption peaks completely disappeared. The penultimate concentration was chosen as the corresponding detection limits in Fig. 2 of the main text.
To calculate the ion permeation rates, J, expected for the network of capillaries present inside GO laminates, we have used the classical diffusion equation
effeff LACDJ ×∆×= where D ≈10-5 cm2/s is the diffusion coefficient for small ions in water and ∆C the concentration gradient across the membrane (∆C ≈23g/L if a 1M solution of a Na salt is taken as an example). For a 5 micron thick GO membrane with an area of 1 cm2, the effective area Aeff of the water column through which the diffusion can occur is given by Aeff ≈1cm2×d/L ≈10-3 cm2. The effective length of this column is Leff ≈L×h/d ≈0.5 cm. Putting the numbers into the above equation, we find J ≈0.5 ng/s or ≈2×10⁻³ mg/h per square cm or ≈10-3 mol/h/m2. As discussed in the main text and ref. 11, the estimated space available for ion diffusion has been verified by other experiments and is likely to be an overestimate. Despite this, J is still ≈3,000 times smaller than the measured rate in Fig. 2. In fact, the observed ion permeability of our GO membranes is as large as the one we measured for a sheet of the standard filter paper.
Note that the ultrafast salt permeation does not contradict to the 20 to 60% rejection rates reported in refs 16 and 17. The rejection rates were measured with respect to a water flow driven by a large hydrostatic pressure. In this case, both salt and water move through the GO laminate with little impedance. Note that 50% rejection means the relative number of ions with respect to the number of water molecules is reduced only by a factor of 2 after the filtration. Furthermore, in our experiments with small salts, we did not observe any noticeable change in water levels, which indicates little osmotic pressure. Therefore, ions diffuse through a nearly static column of water inside GO capillaries.
6
5. Tested solutes and their hydrated radii Figure 2 of the main text summarizes the results of our experiments by plotting the
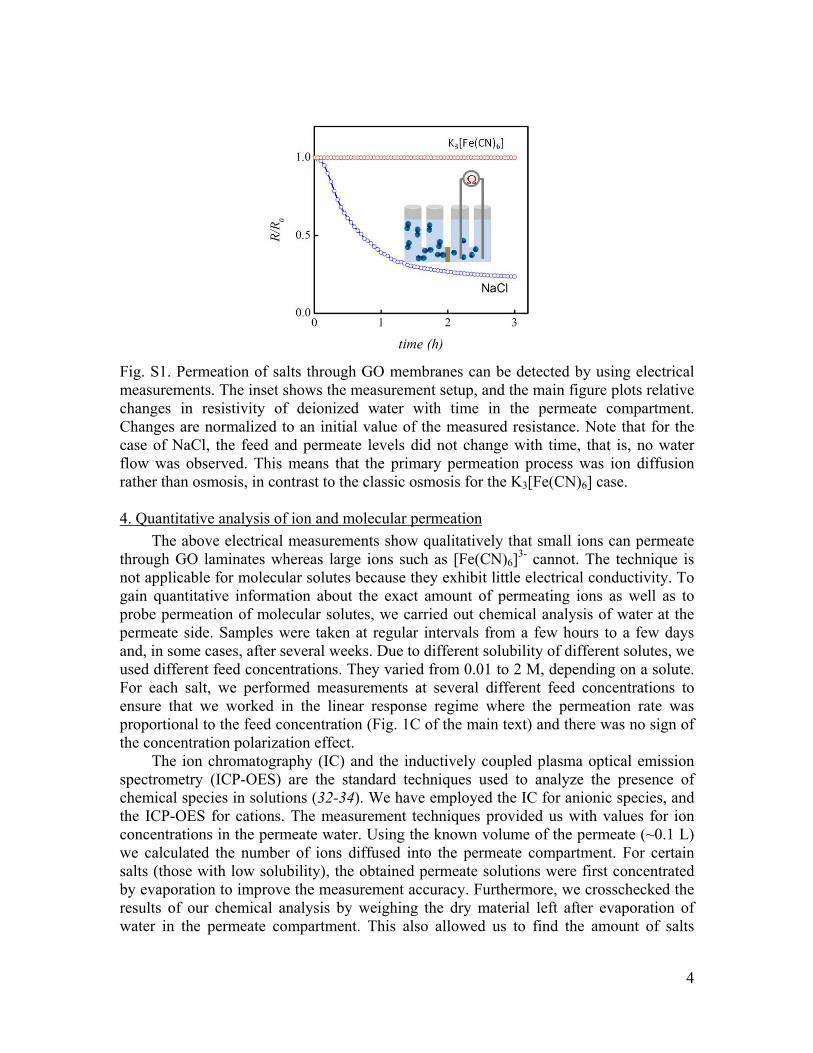
observed permeation rates as a function of the hydrated radius for all the solutes that have been analyzed quantitatively in our work. Values of the hydrated radius for eleven of them can be found in the literature (13,26,36,37) and are shown in Table S1. To the best of our knowledge, there exist no literature values for propanol, sucrose, glycerol and PTS4-. In the latter case, we have estimated their hydrated radii by using Stokes/crystal radii (26,38). To this end, we have plotted the known hydrated radii as a function of the known Stokes radii, which yields a simple linear dependence. Hydrated radii for the remaining 4 species can then be estimated by using this dependence and their known Stokes radii. The resulting hydrated radii are added to Table S1.
Ion/molecule Hydrated radius (Å)
K+ 3.31
Cl- 3.32
Na+ 3.58
CH3COO- 3.75
SO42- 3.79
AsO43- 3.85
CO32- 3.94
Cu2+ 4.19
Mg2+ 4.28
propanol 4.48
glycerol 4.65
[Fe(CN)6]3- 4.75
sucrose 5.01
(PTS)4- 5.04
[Ru(bipy)3]2+ 5.90
Table S1. List of analyzed species and their hydrated radii. In principle, one can also consider using the Stokes rather than hydrated radius as a
running parameter in Fig. 2 of the main text. In this case, the general trend of blocking large molecules and allowing small ones remains the same. However, the functional form in Fig. 2 would be no longer single-valued near the cutoff, which is why we have chosen heuristically (and for the physics reasons as well) to use the hydrated radius.
6. Salt absorption by graphene laminates
To test the absorbing efficiency of GO laminates with respect to salts, we have carried out the following experiments. Our GO membranes were accurately weighed and
7
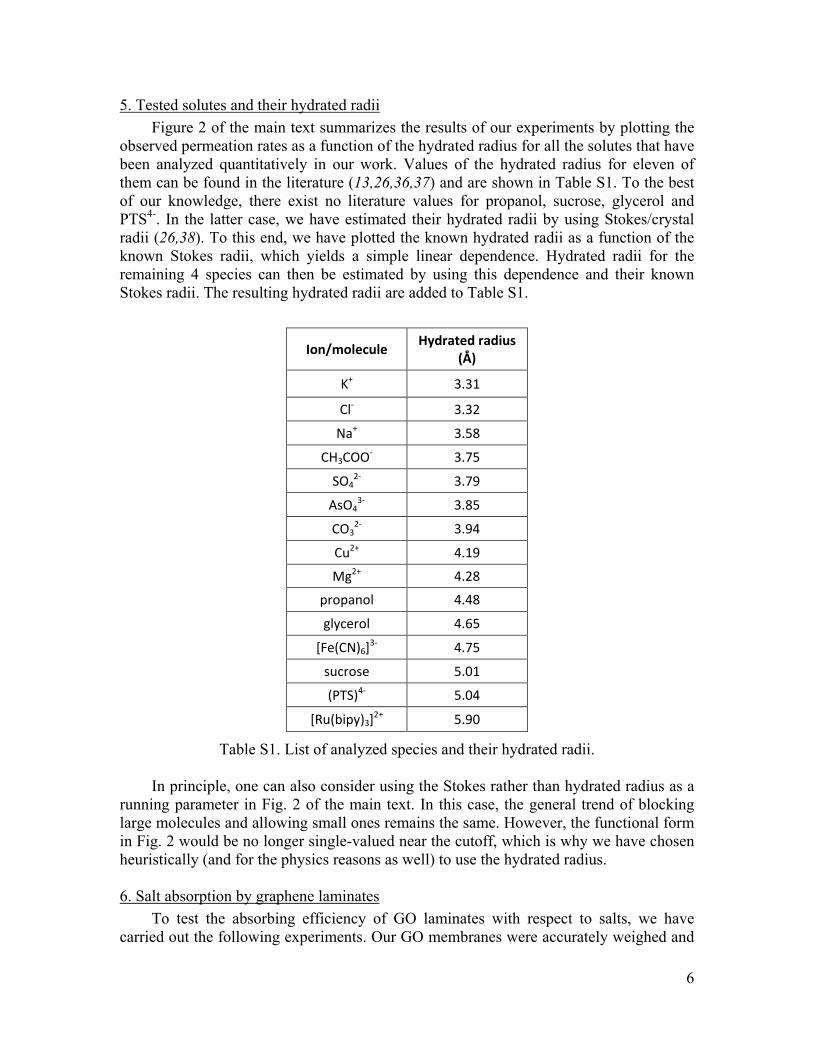
placed in a salt solution with concentration C (we used MgCl2, KCl and K3[Fe(CN)6]). After several hours, the laminates were taken out, rinsed with deionized water and dried. An intake of the salts was measured at a relative humidity of 50±10%, same as the initial weight measurements. Figure S2A shows that for the salt that cannot permeate through GO laminates, there was no increase in weight. On the other hand, for small salts that fit inside GO capillaries, we observed a massive intake that reached up to 25% in weight. The intake rapidly saturated at relatively small C of ≈0.1 M (see Fig. S2A).
Fig. S2. Salt intake by GO laminates. (A) Relative increase in weight for 5µm thick laminates soaked in different solutions. No intake could be detected for K3[Fe(CN)6] but it was large for small-radius salts. The dotted curves represent the best fit by the Langmuir isotherm. (B) X-ray diffraction for pristine GO, GO soaked in NaCl and GO soaked in KCl. All these measurements were carried out at a relative humidity of 50±10%. The blue curve shows the interlayer diffraction peak for GO immersed in water.
The mass intake in Figure S2A can be due to either dry salts or extra water accumulated inside the capillaries in the presence of the salts. We were able to separate the contributions by using the following complementary approaches. In the first one, a GO laminate was dried in zero humidity of a glove box for one week and accurately weighted. Then, the laminate sample was exposed to a 1M MgCl2 solution and dried again in zero humidity for a week. We found a mass intake of 13±2%, that is, notably smaller than that in Fig. S2A. The same result was confirmed by the second approach using chemical analysis. A sample of the same GO laminate exposed to a 1M MgCl2 solution was dissolved in a mixture of nitric, sulphuric and perchloric acids at 300°C, which effectively turned carbon into CO2 (chemical burning of graphene). After this, ICP-OES (using iCap 6300) was employed to measure the amount of Mg in the resulting solution. We found 3-3.2% of Mg in weight, which translates into ≈13% mass intake of MgCl2 from a 1M solution, in agreement with the above result based on weighing. This percentage means that more than a half of the intake in Fig. S2A was due to the dry salt with the rest being additional bound water.

8
The large salt intake proves that the permeating solutes accumulate inside GO capillaries, leading to highly concentrated solutions internally. Using the measured amount of absorbed salts and the known amount of water in fully hydrated GO laminates (see below), we estimate that internal concentrations can reach several molar, that is, can exceed external C by a factor of 10 or more. This highly-efficient absorption of small salts by GO laminates is in agreement with the absorbing properties reported previously for graphene and graphite-oxide powders (30) and sheds light on the mechanism behind those observations.
The accumulation of salts inside GO capillaries implies that there is an energy gain when ions move inside graphene capillaries from the bulk solution (39). Our MD simulations (below) confirm this effect and indicate that the energy gain is mostly due to interaction of ions with graphene walls. The ionic absorption is reminiscent of the standard capillary effect where water molecules gain energy by moving inside hydrophilic tubes. In our case, water plays a role of a continuous medium in which the capillary-like pressure acts on ions, sucking them inside capillaries from the bulk water. 7. X-ray analysis of GO laminates
We have also investigated our GO laminates by using X-ray diffraction. Figure S2B shows the diffraction peak for GO at a relative humidity of ≈50%. It corresponds to the interlayer separation d ≈8 Å. For GO laminates immersed in water, the peak is shifted to d ≈13 Å, in agreement with literature values (19,22). It is interesting to note that the peak in water has not become notably broader. This means that the layered structure of GO laminates is preserved in the fully immersed state, that is, the additional water is adsorbed as an extra layer with a rather uniform thickness of ≈5Å. Taking into account that d for reduced GO is ≈4Å, there is a free space of 9±1Å between graphene sheets, which is available for transport of water. The latter value is in agreement with the permeation cutoff observed both experimentally and in our MD simulations.
We have also measured the volume of taken-in water by weighing. GO laminates exposed to nearly 100% humidity exhibited a water intake that was equal to approximately h×S where S is the laminate area and h its thickness. This is the volume of graphene capillaries, which is used to estimate diffusion through the equivalent water column (see the main text). The found capillary volume is also consistent with alternative estimates reported in ref. 11.
When our GO laminates were soaked in NaCl or KCl solutions and then dried out at the same 50±10% humidity as above, d increased from 8 to 9 Å (see Fig. S2B). This increase in the interlayer spacing is consistent with the fact that a significant amount of salts is trapped within graphene capillaries. On the other hand, d for GO inside a concentrated salt solution was found similar to that for GO in clean water (13±1 Å). The latter observation is attributed to the fact that d is determined by the number of intercalating atomic layers of water and ions move inside this water layer, in agreement with our MD simulations.
8. Molecular dynamics simulations Our basic modeling setup consisted of two equal water reservoirs connected by a
capillary formed by parallel graphene sheets as shown in Fig. 3A of the main text. Sizes

9
of the reservoirs and capillaries varied in different modeling experiments. To analyze the absorption of salts and study ion diffusion in the confined geometry, we used reservoirs with a height of 51.2 Å, a length of 50 Å and a depth of 49.2 Å, which were connected by a 30 Å long capillary. A slightly smaller setup was used to assess sieving properties of graphene capillaries. It consisted of the reservoirs with a height of 23.6 Å, a length of 50 Å and a depth of 30.1 Å, which were connected by a 20 Å long capillary. For both setups, we varied the capillary width d from 7 to 13 Å (d is the distance between the centers of the graphene sheets). When the same property was modeled, both setups yielded similar behavior.
Periodic boundary conditions were applied in the Z direction, that is, along the capillary depth. Ions or molecules were added until the desired molar concentrations were reached. Water was modeled by using the simple point charge model (40,41). Sodium and chlorine ions were modeled by using the parameters from refs 42-43; magnesium and copper anions with the OPLS-AA parameters (44). Intermolecular interactions were described by the 12-6 Lennard-Jones (LJ) potential together with a Coulomb potential. Parameters for water-graphene interactions were reported in refs 45-46.
The system was initially equilibrated at 300 K with a coupling time of 0.1 ps-1 for 500 ps (47). In the modeling of sieving properties, our typical simulation runs were 100 ns long and obtained in the isobaric ensemble at the atmospheric pressure where the simulation box was allowed to change only in the X and Y direction with a pressure coupling time of 1 ps-1 (45) and a compressibility of 4.5×10⁻⁵ bar-1. The cutoff distance for nonbonding interactions was set up at 10 Å, and the particle mesh Ewald summations method was used to model the system’s electrostatics (48). During simulations, all the graphene atoms were held in fixed positions whereas other bonds were treated as flexible. A time step of 1 fs was employed.
To model sieving properties of graphene, the GROMACS software was used (49). At the beginning of each simulation run, water molecules rapidly filled the graphene capillary forming one, two or three layer structures, depending on d, in agreement with the previous reports (11,29). Then after a certain period of time, which depended on a solute in the feed reservoir, ions/molecules started enter the capillary and eventually reached the pure water reservoir for all the modeled solutes, except for toluene and octanol. The found permeation rates are shown in Fig. 3B of the main text. We have also noticed that cations and anions move through the capillary together and without noticeably changing their hydration shells.
9. Theoretical analysis of permeation for large molecules In the case of organic molecules (for example, propanol) our simulations showed
that the molecules entered the graphene capillary but then rapidly formed clusters that resided inside the capillary for a long time. The cluster formation is probably due to confinement. On the other hand, the long residence times can be attributed to van der Waals forces between the alcohol molecules and graphene (50). Toluene molecules exhibited even stronger interaction with graphene (due to π-π staking). In our simulations, toluene molecules entered the channel but never left it being adsorbed to graphene walls (Fig. S3). This adsorption is likely to be responsible for the experimentally undetectable level of toluene permeation. Therefore, despite our experimental data exhibit a rather simple sieving behavior that can be explained just by

10
the physical size effect, we believe that van der Waals interactions between solutes and graphene may also play a role in limiting permeation for those molecules and ions that have sizes close to the cutoff radius.
Fig. S3. Snapshot of our MD simulations for toluene in water. All toluene molecules are trapped inside the short graphene channel and none leaves it even after 100 ns.
To better understand the observed sieving effect with its sharp mechanical cutoff, we performed the following analysis. An artificial cluster was modeled as a truncated icosahedron and placed in the middle of the capillary as shown in the inset of Fig. 3B of the main text. The size of the cluster was varied by changing the distance between the constituent 60 atoms, and the interaction energy between the cluster and the graphene capillary was calculated. The energy was computed as the sum of interactions between all the atoms involved which were modeled with a 12-6 LJ potential. Positive and negative values of the calculated energy indicate whether the presence of the cluster in the capillary is energetically favorable or not, respectively. The minimum radius for which the spherical cluster was allowed into the graphene capillary obviously depended on the capillary size. For capillaries that allowed two layers of waters (d = 9 Å) this radius was found to be 4.7 Å. For capillaries containing three water layers (d = 13 Å), the radius was 5.8 Å. These values are shown in Fig. 3B of the main text as the blue bars.
10. Simulations of salt absorption
In this case, we employed a relatively long capillary (482 Å) such that its volume was comparable to that of the reservoirs (see Fig. S4A). The capillary width was varied between 9 and 11 Å, which corresponds to 2 and 3 atomic layers of water. MD simulations were carried out in a canonical ensemble using LAMMPS (51). The temperature was set at 300 K by using the Nose-Hoover thermostat. The equations of motion were integrated using a velocity-Verlet scheme with a time step of 1.0 fs. The snapshots obtained in these simulations (for example, see Fig. S4A) were processed by Atomeye (52).
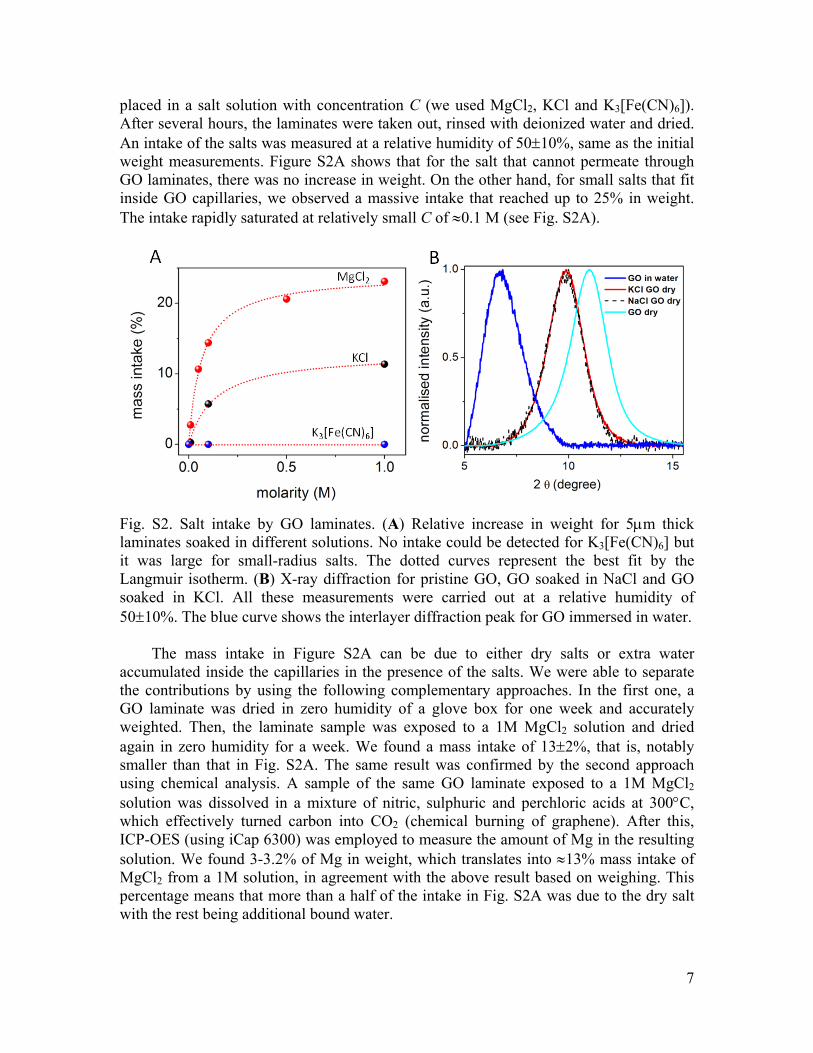
During the simulations, we counted the number of ions inside the capillary as a function of time (Fig. S4B). If the initial concentration C of NaCl was taken constant over the entire system (for example, C =1 M for the black curve in Fig. S4B), we found that the salt moved from the reservoirs into the capillary, that is, ions were attracted to the confined region. Then, we used smaller initial C inside the two reservoirs (0.1 and 0.5 M)

11
while keeping the same C =1 M inside the capillary. Despite the large concentration gradient, the salt still moved into the capillary rather than exited it (see Fig. S4B).
Fig. S4. Simulated salt-absorption effect. (A) Snapshot for the case of a 1M NaCl solution inside the capillary and 0.1 M in the reservoirs (water molecules are removed for clarity). Despite the large concentration gradient, ions move from the reservoirs into the capillary. (B) Number of ions inside a 9 Å wide capillary (two layers of water) as a function of simulation time. Initial concentrations of NaCl in the two reservoirs are 0.1, 0.5 and 1 M for the different curves. The initial NaCl concentration inside the capillary is 1 M for all the curves. (C) Comparison between graphene and GO capillaries. Evolution of the number of ions inside a capillary (11 Å wide) for initial C =1 M throughout the system.
In the next MD simulation experiment, we kept a low concentration of NaCl in the two reservoirs (C =0.1 M) and gradually increased C inside the graphene capillary up to 3 M. For C =2 M inside it, we still observed an influx of NaCl from the reservoirs. The salt started leaving the capillary only if C inside approached ∼3 M. This allows an estimate of the equilibrium concentration of NaCl inside the graphene capillary as close to 3 M, in agreement with the experimental results discussed in section #6. The concentration gradient corresponds to a capillary-like pressure of >50 bars, which acts on salt ions against the concentration gradient. To find an average speed of ionic flow caused by this pressure, further work is required, especially because the viscosity experienced by ion moving against graphene walls is likely to be different from that for water molecules (11).
We have also assessed the possibility that functionalized GO regions can play a notable role in salt absorption and, more generally, in molecular permeation through GO laminates. To this end, we used the same MD setups as described above but added

12
hydroxyl and epoxy groups to both walls of graphene capillaries. The epoxy group was modeled by binding an oxygen atom to two carbon atoms of graphene and the hydroxyl group (OH) by its oxygen bonded to a carbon atom. For simplicity, oxygen atoms were fixed in their positions whereas the O-H bond was treated as flexible. Figure S4C shows an example of the latter simulations. Both ion and water dynamics inside GO capillaries were found to be extremely slow, in agreement with the assumptions of our previous work (11) and a recent MD report by another group (29). In addition, we considered the case where only entrances of the graphene capillary were covered with hydroxyl and epoxy groups (Fig. S4C). These simulations again showed slow dynamics, similar to the case of fully-covered GO capillaries. Accordingly, we expect that in our observations functionalized regions play a lesser role than pristine capillaries.

References and Notes 1. K. B. Jirage, J. C. Hulteen, C. R. Martin, Nanotubule-based molecular-filtration membranes.
Science 278, 655–658 (1997). doi:10.1126/science.278.5338.655
2. N. B. McKeown, P. M. Budd, Polymers of intrinsic microporosity (PIMs): Organic materials for membrane separations, heterogeneous catalysis and hydrogen storage. Chem. Soc. Rev. 35, 675–683 (2006). doi:10.1039/b600349d Medline
3. D. L. Gin, R. D. Noble, Chemistry. Designing the next generation of chemical separation membranes. Science 332, 674–676 (2011). doi:10.1126/science.1203771
4. D. Cohen-Tanugi, J. C. Grossman, Water desalination across nanoporous graphene. Nano Lett. 12, 3602–3608 (2012). doi:10.1021/nl3012853 Medline
5. S. P. Koenig, L. Wang, J. Pellegrino, J. S. Bunch, Selective molecular sieving through porous graphene. Nat. Nanotechnol. 7, 728–732 (2012). doi:10.1038/nnano.2012.162 Medline
6. M. Ulbricht, Advanced functional polymer membranes. Polymer (Guildf.) 47, 2217–2262 (2006). doi:10.1016/j.polymer.2006.01.084
7. M. Elimelech, W. A. Phillip, The future of seawater desalination: Energy, technology, and the environment. Science 333, 712–717 (2011). doi:10.1126/science.1200488
8. J. K. Holt, H. G. Park, Y. Wang, M. Stadermann, A. B. Artyukhin, C. P. Grigoropoulos, A. Noy, O. Bakajin, Fast mass transport through sub-2-nanometer carbon nanotubes. Science 312, 1034–1037 (2006). doi:10.1126/science.1126298
9. M. Majumder, N. Chopra, R. Andrews, B. J. Hinds, Nanoscale hydrodynamics: Enhanced flow in carbon nanotubes. Nature 438, 44 (2005). doi:10.1038/438044a Medline
10. G. Hummer, J. C. Rasaiah, J. P. Noworyta, Water conduction through the hydrophobic channel of a carbon nanotube. Nature 414, 188–190 (2001). doi:10.1038/35102535 Medline
11. R. R. Nair, H. A. Wu, P. N. Jayaram, I. V. Grigorieva, A. K. Geim, Unimpeded permeation of water through helium-leak-tight graphene-based membranes. Science 335, 442–444 (2012). doi:10.1126/science.1211694
12. M. Majumder, N. Chopra, B. J. Hinds, Effect of tip functionalization on transport through vertically oriented carbon nanotube membranes. J. Am. Chem. Soc. 127, 9062–9070 (2005). doi:10.1021/ja043013b Medline
13. F. Fornasiero, H. G. Park, J. K. Holt, M. Stadermann, C. P. Grigoropoulos, A. Noy, O. Bakajin, Ion exclusion by sub-2-nm carbon nanotube pores. Proc. Natl. Acad. Sci. U.S.A. 105, 17250–17255 (2008). doi:10.1073/pnas.0710437105 Medline
14. L. Qiu, X. Zhang, W. Yang, Y. Wang, G. P. Simon, D. Li, Controllable corrugation of chemically converted graphene sheets in water and potential application for nanofiltration. Chem. Commun. (Camb.) 47, 5810–5812 (2011). doi:10.1039/c1cc10720h Medline
15. P. Sun, M. Zhu, K. Wang, M. Zhong, J. Wei, D. Wu, Z. Xu, H. Zhu, Selective ion penetration of graphene oxide membranes. ACS Nano 7, 428–437 (2013). doi:10.1021/nn304471w Medline

16. Y. Han, Z. Xu, C. Gao, Ultrathin graphene nanofiltration membrane for water purification. Adv. Funct. Mater. 23, 3693–3700 (2013). doi:10.1002/adfm.201202601
17. M. Hu, B. Mi, Enabling graphene oxide nanosheets as water separation membranes. Environ. Sci. Technol. 47, 3715–3723 (2013). doi:10.1021/es400571g Medline
18. H. Huang, Y. Mao, Y. Ying, Y. Liu, L. Sun, X. Peng, Salt concentration, pH and pressure controlled separation of small molecules through lamellar graphene oxide membranes. Chem. Commun. (Camb.) 49, 5963–5965 (2013). doi:10.1039/c3cc41953c Medline
19. K. Raidongia, J. Huang, Nanofluidic ion transport through reconstructed layered materials. J. Am. Chem. Soc. 134, 16528–16531 (2012). doi:10.1021/ja308167f Medline
20. D. A. Dikin, S. Stankovich, E. J. Zimney, R. D. Piner, G. H. Dommett, G. Evmenenko, S. T. Nguyen, R. S. Ruoff, Preparation and characterization of graphene oxide paper. Nature 448, 457–460 (2007). doi:10.1038/nature06016 Medline
21. G. Eda, M. Chhowalla, Chemically derived graphene oxide: towards large-area thin-film electronics and optoelectronics. Adv. Mater. 22, 2392–2415 (2010). doi:10.1002/adma.200903689 Medline
22. A. Lerf, A. Buchsteiner, J. Pieper, S. Schöttl, I. Dekany, T. Szabo, H. P. Boehm, Hydration behavior and dynamics of water molecules in graphite oxide. J. Phys. Chem. Solids 67, 1106–1110 (2006). doi:10.1016/j.jpcs.2006.01.031
23. D. W. Boukhvalov, M. I. Katsnelson, Y.-W. Son, Origin of anomalous water permeation through graphene oxide membrane. Nano Lett. 13, 3930–3935 (2013). doi:10.1021/nl4020292 Medline
24. S. You, S. M. Luzan, T. Szabó, A. V. Taluzin, A. V. Effect of synthesis method on solvation and exfoliation of graphite oxide. Carbon 52, 171–180 (2013). doi:10.1016/j.carbon.2012.09.018
25. Materials and methods are available as supplementary materials on Science Online.
26. B. Van der Bruggen, J. Schaep, D. Wilms, C. Vandecasteele, Influence of molecular size, polarity and charge on the retention of organic molecules by nanofiltration. J. Membr. Sci. 156, 29–41 (1999). doi:10.1016/S0376-7388(98)00326-3
27. N. R. Wilson, P. A. Pandey, R. Beanland, R. J. Young, I. A. Kinloch, L. Gong, Z. Liu, K. Suenaga, J. P. Rourke, S. J. York, J. Sloan, Graphene oxide: Structural analysis and application as a highly transparent support for electron microscopy. ACS Nano 3, 2547–2556 (2009). doi:10.1021/nn900694t Medline
28. D. Pacilé, J. C. Meyer, A. Fraile Rodríguez, M. Papagno, C. Gómez-Navarro, R. S. Sundaram, M. Burghard, K. Kern, C. Carbone, U. Kaiser, Electronic properties and atomic structure of graphene oxide membranes. Carbon 49, 966–972 (2011). doi:10.1016/j.carbon.2010.09.063
29. N. Wei, Z. Xu, Breakdown of fast water transport in graphene oxides. arXiv:1308.5367.
30. S. Wang, H. Sun, H. M. Ang, M. O. Tade, Adsorptive remediation of environmental pollutants using novel graphene-based nanomaterials. Chem. Eng. J. 226, 336–347 (2013). doi:10.1016/j.cej.2013.04.070

31. W. S. Hummers, Jr., R. E. Offeman, Preparation of graphitic oxide. J. Am. Chem. Soc. 80, 1339 (1958). doi:10.1021/ja01539a017
32. P. E. Jackson, Ion Chromatography in Environmental Analysis. Encyclopedia of Analytical Chemistry (Wiley, New York, 2006).
33. J. Yeo, S. Y. Kim, S. Kim, D. Y. Ryu, T. H. Kim, M. J. Park, Mechanically and structurally robust sulfonated block copolymer membranes for water purification applications. Nanotechnology 23, 245703 (2012). doi:10.1088/0957-4484/23/24/245703 Medline
34. N. T. Hancock, P. Xu, M. J. Roby, J. D. Gomez, T. Y. Cath, Towards direct potable reuse with forward osmosis: Technical assessment of long-term process performance at the pilot scale. J. Membr. Sci. 445, 34–46 (2013). doi:10.1016/j.memsci.2013.04.056
35. N. Ma, Y. Zhang, X. Quan, X. Fan, H. Zhao, Performing a microfiltration integrated with photocatalysis using an Ag-TiO2/HAP/Al2O3 composite membrane for water treatment: Evaluating effectiveness for humic acid removal and anti-fouling properties. Water Res. 44, 6104–6114 (2010). doi:10.1016/j.watres.2010.06.068 Medline
36. E. R. Nightingale Jr., Phenomenological theory of ion solvation. Effective radii of hydrated Ions. J. Phys. Chem. 63, 1381–1387 (1959). doi:10.1021/j150579a011
37. S. G. Schultz, A. K. Solomon, Determination of the effective hydrodynamic radii of small molecules by viscometry. J. Gen. Physiol. 44, 1189–1199 (1961). doi:10.1085/jgp.44.6.1189 Medline
38. D. S. Tawfik, R. E. Viola, Arsenate replacing phosphate: Alternative life chemistries and ion promiscuity. Biochemistry 50, 1128–1134 (2011). doi:10.1021/bi200002a Medline
39. G. Shi, Y. Ding, H. Fang, Unexpectedly strong anion-π interactions on the graphene flakes. J. Comput. Chem. 33, 1328–1337 (2012). doi:10.1002/jcc.22964 Medline
40. H. J. C. Berendsen, J. P. M. Postma, W. F. van Gunsteren, J. Hermans, in Intermolecular Forces (Springer, Netherlands, 1981) vol. 14, pp. 331–342.
41. H. J. C. Berendsen, J. R. Grigera, T. P. Straatsma, The missing term in effective pair potentials. J. Phys. Chem. 91, 6269–6271 (1987). doi:10.1021/j100308a038
42. D. E. Smith, X. D. Liem, Computer simulations of NaCl association in polarizable water. J. Chem. Phys. 100, 3757–3766 (1994). doi:10.1063/1.466363
43. S. Chowdhuri, A. Chandra, Molecular dynamics simulations of aqueous NaCl and KCl solutions: Effects of ion concentration on the single-particle, pair, and collective dynamical properties of ions and water molecules. J. Chem. Phys. 115, 3732–3741 (2001). doi:10.1063/1.1387447
44. W. L. Jorgensen, D. S. Maxwell, J. Tirado-Rives, Development and testing of the OPLS all-atom force field on conformational energetics and properties of organic liquids. J. Am. Chem. Soc. 118, 11225–11236 (1996). doi:10.1021/ja9621760
45. A. Cheng, W. A. Steele, Computer simulation of ammonia on graphite. I. Low temperature structure of monolayer and bilayer films. J. Chem. Phys. 92, 3858–3866 (1990). doi:10.1063/1.458562

46. T. Werder, J. H. Walther, R. L. Jaffe, T. Halicioglu, P. Koumoutsakos, On the water-carbon interaction for use in molecular dynamics simulations of graphite and carbon nanotubes. J. Phys. Chem. B 107, 1345–1352 (2003). doi:10.1021/jp0268112
47. H. J. C. Berendsen, J. P. M. Postma, W. F. V. Gunsteren, A. DiNola, J. R. Haak, Molecular dynamics with coupling to an external bath. J. Chem. Phys. 81, 3684–3690 (1984). doi:10.1063/1.448118
48. E. Ulrich et al., A smooth particle mesh Ewald method. J. Chem. Phys. 103, 8577–8593 (1995). doi:10.1063/1.470117
49. E. L. D. van der Spoel et al., Gromacs User Manual, version 4.5 (2011).
50. T. Marosi, I. Dékány, G. Lagaly, Displacement processes on hydrophilic/hydrophobic surfaces in 1-propanol-water mixtures. Colloid Polym. Sci. 272, 1136–1142 (1994). doi:10.1007/BF00652383
51. S. J. Plimpton, Fast parallel algorithms for short-range molecular dynamics. J. Comput. Phys. 117, 1–19 (1995). doi:10.1006/jcph.1995.1039
52. J. Li, AtomEye: An efficient atomistic configuration viewer. Model. Simul. Mater. Sci. Eng. 11, 173–177 (2003). doi:10.1088/0965-0393/11/2/305