supplementary information skn-1a/pou2f3 specifies taste ... · keiko abe methods differential...
TRANSCRIPT
Supplementary Information
Skn-1a/Pou2f3 specifies taste receptor cell lineage
Ichiro Matsumoto, Makoto Ohmoto, Masataka Narukawa, Yoshihiro Yoshihara &
Keiko Abe
METHODS
Differential screening of gene expression data. Candidate genes encoding
transcription factors and showing taste bud–specific expression in the tongue epithelium
were extracted from gene expression data obtained for isolated taste buds and
circumvallate epithelium after taste bud dissection, and non–gustatory tongue
epithelium, as described previously 1.
Histological study. In situ hybridization, immunohistochemistry, and their
combinatorial analyses were carried out as described previously 1-3. For
immunohistochemistry, goat anti–GFP antibody (Abcam, 1:500), rat anti–GFP antibody
(Nacalai, 1:500), rabbit anti–Skn-1a/i antibody (Santa Cruz, 1:1,000), rabbit anti–T1R3
antibody (1:300) 3, rabbit anti–Ggust antibody (Santa Cruz, 1:500), and rabbit
anti–KCNQ1 antibody (Chemicon, 1:3,000) were used.
skn1a–FinG transgenic mice. For the transgenic construct, approximately 5 kb of the
5’ upstream region of the ATG start codon of skn-1a was obtained from BAC clone
RP23–400E15 and used as the skn-1a regulatory sequence. The plasmid pires–nGFP,
which encodes enhanced GFP fused to the C-terminal nuclear localization signal of the
SV40 large T antigen, was generated by substituting the BsrG I–Afl II fragment of
pIRES2–EGFP (Clonetech) for the BsrG I–Afl II fragment of pECFP–Nuc (Clonetech).
Nature Neuroscience: doi:10.1038/nn.2820

Foxa2 cDNA was fused upstream of ires–nGFP. Transgenic mice were generated by
pronuclear injection from BDF1 (C57BL/6 x DBA/2 hybrids) embryos by pronuclear
injection, as described previously 3. Detailed phenotypic analyses of the skn1a–FinG
mice will be published elsewhere.
Gene targeting of skn-1. ES cells of 129SvEv origin were used for gene targeting, and
the targeting vector was derived from BAC clone RP22–526M22. Approximately 4 kb
of the skn-1 gene, including exons 7 to 9, was replaced with a tk–neo cassette. In
addition, 2 kb and 6 kb, respectively, of the homologous sequences flanking the 4–kb
skn-1 sequence at the 5’ and 3’ ends were included, and the 5’-homologous sequence
was flanked by a DT–A cassette for negative selection. Skn-1 knockout mice were
generated by homologous recombination following standard procedures 4,5. The mice
used for gene targeting were of a mixed 129 x C57BL/6J background.
Behavioral assays. Wild–type (B6) and skn-1–/– mice (male, 2 to 10 months-old, n =
10) were individually caged and given free 48-h access to two bottles: one contained
deionized water and the other a tastant solution. The taste solutions used were 300 mM
sucrose, 3 mM saccharin, 30 mM monosodium glutamate with 0.5 mM inosine
monophosphate (MSG (+IMP)), 1 mM denatonium benzoate, 0.1 mM quinine
hydrochloride (QHCl), 30 mM citric acid, and 100 mM sodium chloride. After 24 h, the
bottle positions were switched to control for positional effects. The ratio of tastant
volume to total liquid consumed was recorded, and the intake of each tastant solution
was expressed as the mean ± s.e.m. The differences in tastant preferences between
wild–type and skn-1–/– mice were statistically evaluated using Student’s t–test.
Nerve recordings. Whole–nerve responses to the lingual application of tastants were
recorded from the chorda tympani (CT) and glossopharyngeal (GL) nerves. Male mice
(n = 5 for skn-1–/–, n = 5–6 for wild–type) were anaesthetised by intraperitoneal
Nature Neuroscience: doi:10.1038/nn.2820

injection of sodium pentobarbital (50 mg/kg) and urethane (500 mg/kg). A tracheal
cannula was implanted in each animal, and each animal was then secured with a
headholder. The CT nerve was exposed at its exit from the lingual nerve by removal of
the internal pterygoid muscle, dissected free from surrounding tissues, and cut at the
point of its entry into the bulla. The GL nerve was exposed by removal of the
digastricus muscle and posterior horn of the hyoid bone, dissected free from underlying
tissues, and cut near its entrance into the jugular foramen. The entire nerve was placed
on a platinum wire electrode. An indifferent electrode was positioned nearby in the
wound. Whole–nerve activities were amplified, displayed on an oscilloscope, and
monitored with an amplifier (DAM50, World Precision Instruments, Inc., Sarasota,
Florida, USA). The amplified signal was passed through an integrator with a time
constant of 1 sec. The magnitude of the whole–nerve response was measured as the
height of the integrated response from baseline (before stimulation) approximately 5 sec
after the onset of stimulation to avoid the tactile effects of stimuli. The taste solution
was applied for 30 s, followed by a >30 s rinse with deionized water. Application of the
taste solution was repeated at least three times for each solution, and the mean response
was calculated. The taste solutions used were 300 mM sucrose, 30 mM monosodium
glutamate with 0.5 mM inosine monophosphate (MSG (+IMP)), 1 mM denatonium
benzoate, 30 mM citric acid, and 100 mM sodium chloride. The relative response
magnitude for each tastant was calculated by comparison with that of 100 mM
ammonium chloride as a control. The differences in nerve responses between wild–type
and skn-1–/– mice were statistically evaluated using Student’s t–test.
Nature Neuroscience: doi:10.1038/nn.2820
a
Skn-1a Skn-1iprobe a-2 probe i
1 kb
Skn-1i
Skn-1a
POU
probe a-1probe a-2
probe i
skn-1a/i locus
POU
ex1 ex5 ex7 ex8ex6ex6i
0.5 kb
ex13
b
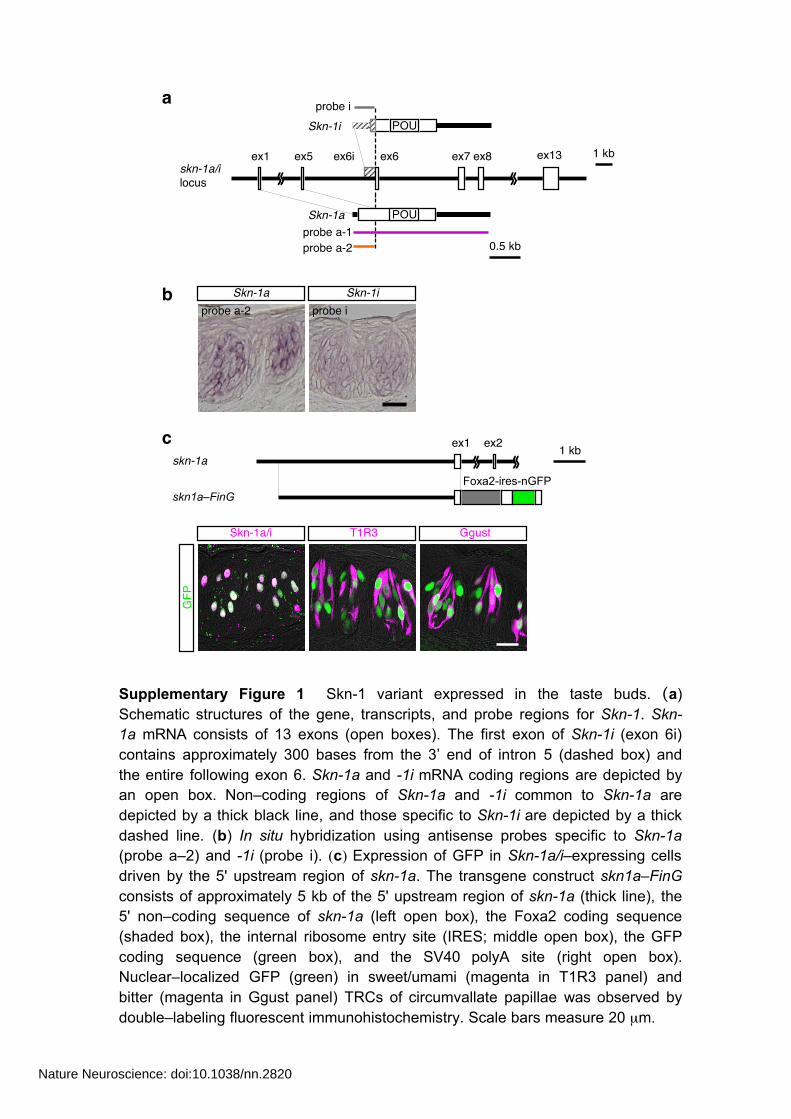
Supplementary Figure 1 Skn-1 variant expressed in the taste buds. (a) Schematic structures of the gene, transcripts, and probe regions for Skn-1. Skn-1a mRNA consists of 13 exons (open boxes). The first exon of Skn-1i (exon 6i) contains approximately 300 bases from the 3’ end of intron 5 (dashed box) and the entire following exon 6. Skn-1a and -1i mRNA coding regions are depicted by an open box. Non–coding regions of Skn-1a and -1i common to Skn-1a are depicted by a thick black line, and those specific to Skn-1i are depicted by a thick dashed line. (b) In situ hybridization using antisense probes specific to Skn-1a (probe a–2) and -1i (probe i). (c) Expression of GFP in Skn-1a/i–expressing cells driven by the 5' upstream region of skn-1a. The transgene construct skn1a–FinG consists of approximately 5 kb of the 5' upstream region of skn-1a (thick line), the 5' non–coding sequence of skn-1a (left open box), the Foxa2 coding sequence (shaded box), the internal ribosome entry site (IRES; middle open box), the GFP coding sequence (green box), and the SV40 polyA site (right open box). Nuclear–localized GFP (green) in sweet/umami (magenta in T1R3 panel) and bitter (magenta in Ggust panel) TRCs of circumvallate papillae was observed by double–labeling fluorescent immunohistochemistry. Scale bars measure 20 µm.
Skn-1a/i
GFP
T1R3 Ggust
cskn-1a
skn1a–FinGFoxa2-ires-nGFP
1 kbex1 ex2
Nature Neuroscience: doi:10.1038/nn.2820

Supplementary Figure 2 Gene–targeting strategy used for the skn-1a/i locus. Exons 7–9 encoding POU homeodomain and a part of the POU–specific domain were deleted in the targeted allele.
Targeting vector
skn-1a/i locus
Targeted locus
cDNA
tk-Neotk-DTA 1 kb
tk-Neo
skn-1a
ex5ex4 ex11ex10
POU
Nature Neuroscience: doi:10.1038/nn.2820

a
+/+ skn-1–/–Preference ratio (to water) p-value
Saccharin 0.90±0.01 0.48±0.02 4.20x10-120.95±0.01 1.58x10⁻⁶
0.49±0.02
Taste substances Concentration
Sucrose
Denatonium 0.09±0.00 0.47±0.05 1.58x10⁻⁶
0.68±0.06 3.28x10⁻³
0.52±0.02
MSG (+IMP)
Citric acid 0.11±0.01 0.15±0.02 0.0751
5.86x10⁻¹⁵
NaCl 0.38±0.06 0.50±0.04 0.0936
QHCl
3 mM300 mM
1 mM
30 mM
100 mM
0.1 mM
0.50±0.05
0.09±0.00
b
+/+ skn-1–/–Ratio to response to NH4Cl p-value
0.35±0.03 0.06±0.02 3.02x10-50.63±0.26 0.0591
0.26±0.07
Taste substances Concentration
Sucrose
Denatonium 0.17±0.05 0.03±0.01 0.0283
1.03±0.15 5.68x10⁻³
0.02±0.01
MSG (+IMP)
Citric acid 0.93±0.26 1.41±0.41 0.353
2.41x10⁻⁵
NaCl 1.10±0.13 0.77±0.12 0.106
300 mM
1 mM
30 mM
100 mM
0.06±0.03
1.32±0.15
Nerve
CTGL
CT
GL 0.13±0.030.19±0.05 0.326
CTGL
CT
GL
CTGL
1.56±0.16 1.38±0.17 0.451
1.02±0.08 0.79±0.13 0.157
30 mM
30 mM
Supplementary Figure 3 Altered behavior and nerve responses of Skn-1a–deficient mice. (a) Loss of behavioral responses to sweet, umami, and bitter taste solutions. Preference for each taste solution was indicated as a ratio to that for the control water intake. (b) Loss of electrophysiological responses of chorda tympani (CT) and glossopharyngeal (GL) nerves to sweet, umami, and bitter taste solutions. Nerve response to each taste solution was indicated as a ratio to that of the response to NH4Cl. Alterations in these ratios were evaluated using Student’s t–test. Data are means ± s.e.m.
Nature Neuroscience: doi:10.1038/nn.2820

PKD2L1PKD1L3
Supplementary Figure 4 Coexpression of PKD1L3, AADC, and SNAP-25 with PKD2L1 in the taste buds. Scale bar measures 20 µm.
+/+
SNAP-25AADC
skn-
1–/–
Nature Neuroscience: doi:10.1038/nn.2820

a KCNQ1 DAPI
b
+/+ skn-1–/–Ratio to KCNQ1+ cells (%) p-valueCell type Marker
PKD1L3Sour 16.0±0.5 44.6±1.4 4.81x10⁻⁵
PLC-β2Sweet/Umami/Bitter
29.8±0.7 0 1.86x10⁻⁶
Others 54.1±1.1 55.4±1.4 0.505
Supplementary Figure 5 Quantitative estimation of the altered composition of TRCs in the taste buds of Skn-1a–deficient mice. (a) The mRNA signals for PLC-β2 and PKD1L3 in conjunction with KCNQ1 immunoreactivity. Sections were counterstained with DAPI. Scale bar measures 20 µm. (b) Numbers indicating PLC-β2 and PKD1L3 mRNA signals and KCNQ1 immunoreactivity were counted in the taste buds of wild–type (n = 3) and Skn-1a–deficient mice (n = 3). Alteration of the ratios of PLC-β2 and PKD1L3 mRNA–positive cell populations to KCNQ1–positive cells were evaluated using Student’s t–test. Data are means ± s.e.m.
skn-
1–/–
PLC-β2 PKD1L3
+/+
Nature Neuroscience: doi:10.1038/nn.2820

GFP mRNA nGFP
skn-
1–/–
skn1
a-Fi
nG sk
n-1+
/–
Supplementary Figure 6 Loss of sweet, umami, and bitter TRCs in Skn-1a–deficient mice. Robust expression of GFP mRNA and GFP localized in the nuclei were observed in the taste buds of skn1a–FinG transgenic mice in the skn-1+/– heterozygous background (top panels) and in the wild–type background (Supplementary Fig. S1c). Substantial GFP mRNA expression was observed in the basal cells of the taste buds in skn1a–FinG transgenic mice in the skn-1–/– homozygous background (left, bottom), but no GFP was observed in the taste buds (right, bottom). Scale bar measures 20 µm.
Nature Neuroscience: doi:10.1038/nn.2820

References
1. Ohmoto, M., Matsumoto, I., Misaka, T. & Abe, K. Chem. Senses 31, 739-746
(2006).
2. Matsumoto, I., Emori, Y., Ninomiya, Y. & Abe, K. Brain Res. Mol. Brain Res.
93, 105-112 (2001).
3. Ohmoto, M., Matsumoto, I., Yasuoka, A., Yoshihara, Y. & Abe, K. Mol. Cell.
Neurosci. 38, 505-517 (2008).
4. Joyner, A. L. (ed.) Gene Targeting (Oxford University Press Inc., New York,
2000).
5. Kaneko-Goto, T., Yoshihara, S.-i., Miyazaki, H. & Yoshihara, Y. Neuron 57,
834-846 (2008).
Nature Neuroscience: doi:10.1038/nn.2820