supplementary information revision final10.1038/s41467-017... · densitometry of the western blots...
TRANSCRIPT

Supplementary Fig. 1. Analysis of beiging, mitochondrial and adipogenic markers in EpiWAT and BAT from Tgr5+/+ and Tgr5-/- mice exposed to cold. (A) Quantitative densitometry of the Western blots depicted in Figure 1h. (B and C) mRNA expression levels of beige remodeling and mitochondrial markers Pgc1a, Ucp1, Tbx1, Prdm16, Cidea, Cd137, Eva1, Dio2, Cpt1a, Pparg2 and Cebpb in the EpiWAT (B) and BAT (C) of TGR5 wild-type (Tgr5+/+) and germline TGR5 knock-out (Tgr5-/-) mice exposed to cold (8°C) for 7 days. n = 10 per group. (D and F) Representative (n = 10 per group) Western blot of PGC-1α, the mitochondrial marker VDAC1, and beiging markers TBX1 and UCP1 from the EpiWAT (D), and PGC-1α, PPARα, UCP1 and the mitochondrial marker VDAC1 from the BAT (F) of the mice described in B and C. GAPDH was used as loading control. (E and G) Quantitative densitometry of the Western blots showed in D (EpiWAT) and F (BAT). (H) Representative (n = 10 per group) Western blot of mitochondrial OXPHOS complexes (CII to CV) from the EpiWAT and BAT of the mice described in B and C. (I and J) Representative (n = 5 per group) hematoxylin and eosin stainings of EpiWAT (I) and BAT (J) sections from mice described in A and B. Scale bars = 50µm. Results represent mean ± SEM. * P ≤ 0.05 vs. Tgr5+/+ group by Student’s t-test.
Tgr5+/+ Tgr5 -/-
EpiWAT BAT
Tgr5+/+ Tgr5 -/-
CIV
CVCIII
CII
Tgr5+/+
Tgr5-/-
Tgr5+/+
Tgr5-/-
EpiWAT BAT
B
C
F G H
I J
PGC-1αPPARαUCP1
Tgr5+/+
Tgr5-/-
BAT
VDAC1GAPDH
PGC-1αTBX1UCP1VDAC1GAPDH
EpiWAT
PGC-1α/GAPDH
0.00.10.20.30.40.5
0.0
0.5
1.0
1.5
2.0
TBX1/GAPDH
PGC-1α/GAPDH
0.0
0.5
1.0
1.5PPAR
α/GAPDH
0.0
0.3
0.6
0.9
1.2
0.0
0.5
1.0
1.5
2.0
UCP1/GAPDH
0.00.51.01.52.02.5
VDAC1/GAPDH
0.0
0.5
1.0
1.5
Rel
ativ
e m
RN
A le
vels
Pgc1aUcp1
Eva1Prdm16
CideaDio2
Pparg2Cpt1a
** *
A
0
1
2
3
4
Complexes/GAPDH
p=0.06*
CIVCV CIII CII
0.0
0.5
1.0
1.5
Rel
ativ
e m
RN
A le
vels
*
Pgc1aUcp1
Tbx1Prdm16
CideaCd137
Pparg2Cebpb
*
D ETgr5
+/+
Tgr5-/-
0.00.10.20.30.40.5
VDAC1/GAPDH
37
37
37
50
100
37
37
37
50
100
25
37
50
Tgr5 +/+ Tgr5 -/-

Supplementary Fig. 2. Validation of WAT specific TGR5 knock-out (Tgr5Adipoq-/-) mice. (A to C) TGR5 mRNA expression levels in the indicated tissues of WAT specific TGR5 knock-out (Tgr5Adipoq-/-) mice and their controls (Tgr5Adipoq+/+) (n = 10 per group). Results represent mean ± SEM. ** P ≤ 0.01 and *** P ≤ 0.001 vs. Tgr5Adipoq+/+ group by Student’s t-test.
A
B
C
0.0
0.5
1.0
1.5
Kidney
Tgr5
mR
NA
leve
ls
0.0
0.5
1.0
1.5
Liver
Tgr5
mR
NA
leve
ls
0.0
0.5
1.0
1.5
2.0
HeartTg
r5 m
RN
A le
vels
0.0
0.5
1.0
1.5
Adrenal gland
Tgr5
mR
NA
leve
ls
0.0
0.5
1.0
1.5
Hypothalamus
Tgr5
mR
NA
leve
ls
0.0
0.5
1.0
1.5
BAT
Tgr5
mR
NA
leve
ls
Tgr5 Adipoq+/+ Tgr5 Adipoq-/-
0.0
0.5
1.0
1.5
EpiWAT
Tgr5
mR
NA
leve
ls
***
0.00.20.40.60.81.0
ScWAT
Tgr5
mR
NA
leve
ls ****

Supplementary Fig. 3. Analysis of beiging, mitochondrial and adipogenic markers in EpiWAT and BAT form Tgr5Adipoq+/+ and Tgr5Adipoq-/- mice exposed to cold. (A and B) mRNA expression levels of beige remodeling and mitochondrial markers Pgc1a,Ucp1, Tbx1, Prdm16, Cidea, Cd137, Eva1, Dio2, Cpt1a, Pparg2 and Cebpb in theEpiWAT (A) and BAT (B) of control mice (Tgr5Adipoq+/+) and WAT specific TGR5 knock-out (Tgr5Adipoq-/-) mice exposed to cold (8°C) for 7 days. n = 10 per group. (C and E)Representative (n = 10 per group) Western blot of PGC-1α, the mitochondrial markerVDAC1, and beiging markers TBX1 and UCP1 from the EpiWAT (C) and PGC-1α,PPARα, UCP1 and the mitochondrial marker VDAC1 from the BAT (E) of the micedescribed in A and B. GAPDH was used as loading control. (D and F) Quantitativedensitometry of the Western blots showed in C (EpiWAT) and E (BAT). (G and H)Representative (n = 5 per group) hematoxylin and eosin stainings of EpiWAT (G) andBAT (H) sections from mice described in A. Scale bars = 50µm. Results represent mean± SEM. * P ≤ 0.05 vs. Tgr5Adipoq+/+ group by Student’s t-test.
A
B
C
E F
G H
D
0.0
0.5
1.0
1.5R
elat
ive
mR
NA
leve
ls
Pgc1aUcp1
Eva1Prdm16
CideaDio2
Pparg2Cpt1a
0.0
0.5
1.0
1.5
Rel
ativ
e m
RN
A le
vels
Pgc1aUcp1
Tbx1Prdm16
CideaCd137
Pparg2Cebpb
0.00.10.20.30.40.5
PGC-1α/GAPDH
0.0
0.5
1.0
1.5
TBX1/GAPDH
0.0
0.1
0.2
0.3
0.4
UCP1/GAPDH
0.0
0.5
1.0
1.5
VDAC1/GAPDH
0.0
0.5
1.0
1.5
PGC-1α/GAPDH
0.0
0.5
1.0
1.5
PPAR
α/GAPDH
0
1
2
3
4
UCP1/GAPDH
Tgr5 Adipoq+/+
Tgr5 Adipoq-/-
PGC-1αTBX1UCP1VDAC1GAPDH
EpiWAT
Tgr5Adipoq+/+
Tgr5Adipoq-/-
PGC-1α
UCP1VDAC1GAPDH
BAT
PPARα
EpiWAT
Tgr5 Adipoq+/+ Tgr5 Adipoq-/-
BAT
Tgr5 Adipoq+/+ Tgr5 Adipoq-/-
0.00.51.01.52.02.5
VDAC1/GAPDH
*Tgr5Adipoq+/+
Tgr5Adipoq-/-
37
37
37
50
100
37
37
37
50
100
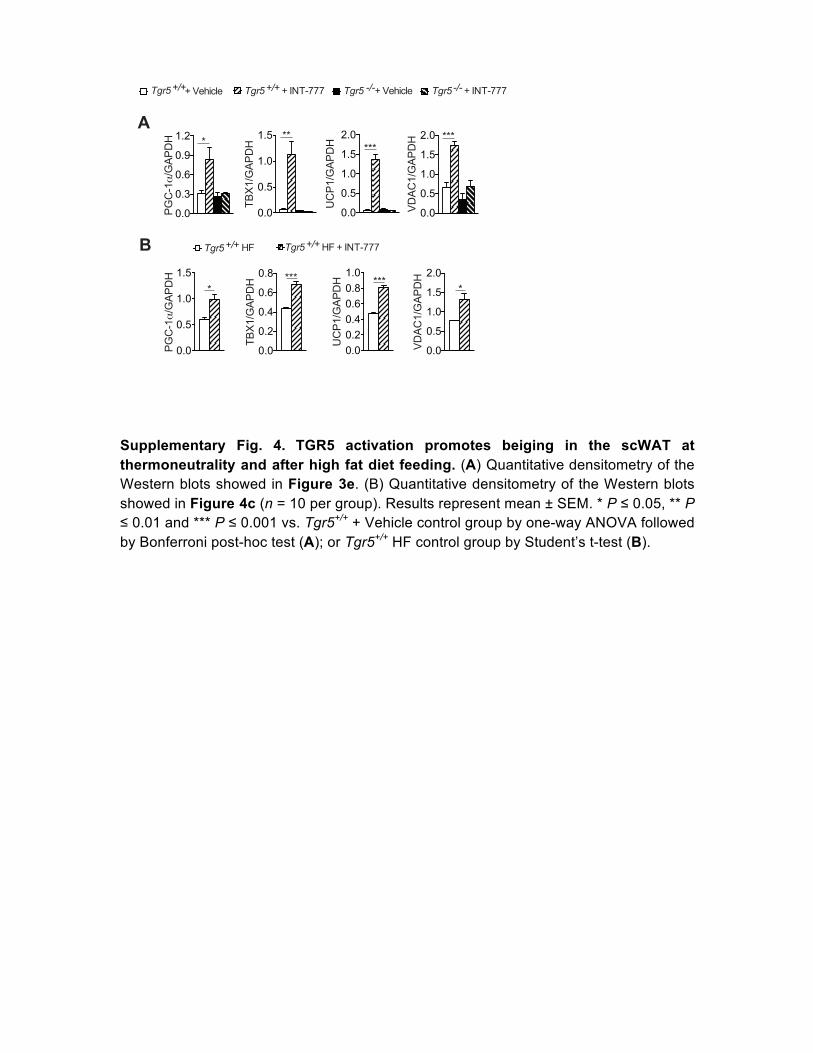
Supplementary Fig. 4. TGR5 activation promotes beiging in the scWAT at thermoneutrality and after high fat diet feeding. (A) Quantitative densitometry of the Western blots showed in Figure 3e. (B) Quantitative densitometry of the Western blots showed in Figure 4c (n = 10 per group). Results represent mean ± SEM. * P ≤ 0.05, ** P ≤ 0.01 and *** P ≤ 0.001 vs. Tgr5+/+ + Vehicle control group by one-way ANOVA followed by Bonferroni post-hoc test (A); or Tgr5+/+ HF control group by Student’s t-test (B).
A
B
PGC
-1α
/GAP
DH
*
0.0
0.5
1.0
1.5
0.0
0.2
0.4
0.6
0.8
TBX1
/GAP
DH ***
0.00.20.40.60.81.0
UC
P1/G
APD
H ***
0.0
0.5
1.0
1.5
2.0
VDAC
1/G
APD
H
*
Tgr5 +/+ + INT-777 Tgr5 -/- + INT-777Tgr5 +/+ + Vehicle Tgr5 -/- + Vehicle
PGC
-1α
/GAP
DH
0.0
0.3
0.6
0.9
1.2 *
0.0
0.5
1.0
1.5
TBX1
/GAP
DH
**
0.0
0.5
1.0
1.5
2.0
UC
P1/G
APD
H ***
0.0
0.5
1.0
1.5
2.0
VDAC
1/G
APD
H ***
Tgr5 +/+ HF + INT-777Tgr5 +/+ HF

Supplementary Fig. 5. TGR5 activation promotes beige adipocyte differentiation in vitro. (A and B) mRNA expression levels of Tgr5, and beige remodeling markers Pgc1a, Ucp1, Cidea, Pparg2 and Cebpb in differentiated 3T3-L1 cells in presence of the TGR5 agonists INT-777 (A), lithocholic acid (LCA) (B) or vehicle (DMSO). 3T3-L1 cells were transfected with either shRNA for TGR5 (sh-TGR5), control shRNA (sh-Co) or mouse TGR5 (mTGR5), as indicated in the Figure. n = 6 (C) Representative (n = 6 per group) images of UCP1 immunofluorescence (in green) on the cells described in A and B. Nuclei were stained with DAPI (in blue). Scale bars = 50μm. (D) Quantification of fluorescent intensity showed in C. Normalization of fluorescence was performed with cell count obtained by nuclei (DAPI) staining. (E) Representative (n = 6 per group) images of TOMM20 immunofluorescence (in green) of adipocytes differentiated from the stromal vascular fraction (SVF) of TGR5 wild-type (Tgr5+/+) and germline TGR5 knock-out (Tgr5-/-
) mice. SVF cells were differentiated for 7 days in presence or absence of the TGR5 agonist INT-777. n = 6. Nuclei were stained with DAPI (in blue). Scale bars = 25μm (F) Quantification of fluorescent intensity showed in E. Results represent mean ± SEM. * P ≤ 0.05, ** P ≤ 0.01 and *** P ≤ 0.001 vs. DMSO control group by Student’s t-test (A and B), or by one-way ANOVA followed by Bonferroni post-hoc test (D and F).
A
B C
DMSO INT-777 LCA
mTGR5sh-Co
sh-TGR5012
50
100Tg
r5 m
RN
A le
vels
*
0
1
2
3
4
Pgc1
a m
RN
A le
vels
mTGR5sh-Co
sh-TGR50
2
4
6
8
Ucp
1 m
RN
A le
vels *
*
mTGR5sh-Co
sh-TGR50.0
0.5
1.0
1.5
2.0
Cid
ea m
RN
A le
vels *
***
mTGR5sh-Co
sh-TGR5012345
Ppar
g2 m
RN
A le
vels
****
mTGR5sh-Co
sh-TGR5
P=0.08
***
mTGR5sh-Co
sh-TGR50
2
4
6
8
Ceb
pb m
RN
A le
vels
012
50
100
Tgr5
mR
NA
leve
ls
mTGR5sh-Co
sh-TGR50
1
2
3Pg
c1a
mR
NA
leve
ls
mTGR5sh-Co
sh-TGR5
*
*
0
1
2
3
4
Ucp
1 m
RN
A le
vels
*
mTGR5sh-Co
sh-TGR5
0
1
2
3
Cid
ea m
RN
A le
vels
*****
mTGR5sh-Co
sh-TGR50.0
0.5
1.0
1.5
Ppar
g2 m
RN
A le
vels
mTGR5sh-Co
sh-TGR5mTGR5
sh-Co
sh-TGR50
1
2
3
Ceb
pb m
RN
A le
vels
UCP1 DAPI MERGE
DMSO
INT-777
LCA
0
25000
50000
75000
100000
Rel
ativ
e Fl
uore
scen
ce In
tens
ity
(UC
P1
/ DA
PI) ****
D FE
0
10000
20000
30000
Rel
ativ
e Fl
uore
scen
t Int
ensi
ty(T
OM
M20
/ D
AP
I) *
c
Tgr5 +/+ Tgr5 -/-
DMSO INT-777
TOMM20DAPI
TOMM20DAPI
TOMM20DAPI
TOMM20DAPI
DMSO INT-777Tgr5 +/+ Tgr5 +/+ + INT-777Tgr5 -/- Tgr5 -/- + INT-777

Supplementary Fig. 6. TGR5 activation induces mitochondrial fission. (A) Quantitative densitometry of the Western blots showed in Figure 6e (n = 6 per group). (B) Quantitative densitometry of the Western blots showed in Figure 6f (n = 6 pergroup). Results represent mean ± SEM. * P ≤ 0.05, ** P ≤ 0.01 and *** P ≤ 0.001 vs.Tgr5+/+ group by one-way ANOVA followed by Bonferroni post-hoc test.
B0.00.51.01.52.02.5
pDR
P1S6
37/D
RP1
0.00.20.40.60.81.0
MFF
/PAR
P1
A
0.0
0.2
0.4
0.6
0.8
pDR
P1S6
37/D
RP1
Tgr5 +/+ Tgr5 +/+ + INT-777Tgr5 -/- Tgr5 -/- + INT-777
0.0
0.2
0.4
0.6
0.8pC
REB
/CR
EB *
0.00.20.40.60.81.0
MFF
/VD
AC1
*
0
1
2
3
4
pDR
P1S6
16/D
RP1 *
0.0
0.2
0.4
0.6
pER
K/ER
K
*
0.0
0.5
1.0
1.5
2.0
pDR
P1S6
16/D
RP1 *

Supplementary Fig. 7. Effect of TGR5 activation on downstream signaling components during beige differentiation (A, C, E and G) Representative (n = 6 per group) Western blots of mitochondrial protein VDAC1 and TGR5 downstream targets (phospho proteins) with their relative controls (ERK, DRP1 or CREB) from differentiated adipocytes (different time points indicated in the figure) derived from the stromal vascular fraction (SVF) of TGR5 wild-type (Tgr5+/+) and germline TGR5 knock-out (Tgr5-/-
) mice. PARP1 was used as a loading control. Cells were stimulated with the TGR5 agonist INT-777 or vehicle (DMSO). n = 6 (B) Quantitative densitometry of the Western blots showed in A. (D) Quantitative densitometry of the Western blots showed in C. (F) Quantitative densitometry of the Western blots showed in E. (H) Quantitative densitometry of the Western blots showed in G. Results represent mean ± SEM. * P ≤ 0.05, ** P ≤ 0.01 and *** P ≤ 0.001 vs. Tgr5+/+ DMSO group by one-way ANOVA followed by Bonferroni post-hoc test.
A C
E G
0.0
0.5
1.0
1.5
2.0
VDAC
1/PA
RP1
B
D
0
1
2
3
VDAC
1/PA
RP1
0.0
0.5
1.0
1.5
pDR
P1S6
16/D
RP1
0.0
0.5
1.0
1.5
2.0
pDR
P1S6
16/D
RP1
0.0
0.5
1.0
1.5
pER
K/ER
K
F
H
0
1
2
3
VDAC
1/PA
RP1
0.00.51.01.52.02.5
VDAC
1/PA
RP1
0.0
0.5
1.0
1.5
2.0
pER
K/ER
K *
0.0
0.5
1.0
1.5
2.0pD
RP1
S616
/DR
P1*
0.0
0.5
1.0
1.5
pDR
P1S6
16/D
RP1 ***
0.0
0.1
0.2
0.3
0.4
pER
K/ER
K
**
0.0
0.5
1.0
1.5
pER
K/ER
K
**
Tgr5 +/+ Tgr5 +/+ + INT-777Tgr5 -/- Tgr5 -/- + INT-777
+−
pERK
ERKpDRP1S616
DRP1VDAC1
INT-777DMSO+ + + − − − −
− − − + + ++
Tgr5+/+
Tgr5-/-
Tgr5+/+
Tgr5-/-
1d Diff.
PARP1
pCREBCREB
+−
pERK
ERK
pDRP1S616
DRP1VDAC1
INT-777DMSO+ + + − − − −
− − − + + ++
Tgr5+/+
Tgr5-/-
Tgr5+/+
Tgr5-/-
PARP1
3d Diff.
pCREBCREB
75
75
37
50
50
37
150
10050
50
+−
pERK
ERK
pDRP1S616
DRP1VDAC1
INT-777DMSO+ + + − − − −
− − − + + ++
Tgr5+/+
Tgr5-/-
Tgr5+/+
Tgr5-/-
PARP1
5d Diff.
pCREBCREB
+−
pERK
ERK
pDRP1S616
DRP1VDAC1
INT-777DMSO+ + + − − − −
− − − + + ++
Tgr5+/+
Tgr5-/-
Tgr5+/+
Tgr5-/-
PARP1
7d Diff.
pCREBCREB
75
75
37
50
50
37
150100
50
50
*
0.0
0.5
1.0
1.5
pCR
EB/C
REB
*
0.0
0.5
1.0
1.5
pCR
EB/C
REB
0.0
0.5
1.0
1.5
pCR
EB/C
REB
**
0.00
0.25
0.50
0.75
1.00
pCR
EB/C
REB
75
75
37
50
50
37
150
100
50
50
75
75
37
50
50
37
150
100
50
50

Supplementary Fig. 8. ERK activation is required for the TGR5-mediated mitochondrial fission. (A) Quantitative densitometry of the Western blots showed in Figure 7, a and b (n = 6 per group). (B) Quantification of mitochondrial (16S) versus nuclear (HK2) DNA ratio from differentiated adipocytes derived from the stromal vascular fraction (SVF) of TGR5 wild-type (Tgr5+/+) and germline TGR5 knock-out (Tgr5-/-) mice, differentiated in the presence or absence of the TGR5 agonist INT-777 and/or the ERK inhibitor FR180204. (C) Spare respiratory capacity calculated as the difference between maximal (FCCP-driven) and basal respiration measured in Figure 7d (n = 6 per group). Results represent mean ± SEM. * P ≤ 0.05, ** P ≤ 0.01 and *** P ≤ 0.001 vs. Tgr5+/+ cells by one-way ANOVA followed by Bonferroni post-hoc test.
A
B
Tgr5 -/-
0.0
0.5
1.0
1.5
2.0
TBX1
/PAR
P1
0.0
0.5
1.0
1.5
2.0
VDAC
1/PA
RP1
0.0
0.2
0.4
0.6
0.8
pDR
P1S6
37/D
RP1
Tgr5+/+ DMSO Tgr5+/+ DMSO + FR180204 Tgr5+/+ INT-777 + FR180204Tgr5+/+ INT-777
0.0
0.3
0.6
0.9
1.2
PGC
-1α
/PAR
P1
0.0
0.5
1.0
1.5
2.0
TBX1
/PAR
P1
0.0
0.3
0.6
0.9
1.2U
CP1
/PAR
P1
0.0
0.5
1.0
1.5
2.0
VDAC
1/PA
RP1
0.0
0.5
1.0
1.5
2.0
pCR
EB/C
REB
0.0
0.3
0.6
0.9
1.2
pER
K/ER
K
0.00.20.40.60.81.0
pDR
P1S6
16/D
RP1
0.0
0.2
0.4
0.6
0.8
pDR
P1S6
37/D
RP1
0.0
0.3
0.6
0.9
1.2
UC
P1/P
ARP1 *
0.00.20.40.60.81.0
pDR
P1S6
16/D
RP1 **
0.0
0.5
1.0
1.5
2.0
pCR
EB/C
REB
****
0.0
0.3
0.6
0.9
1.2
pER
K/ER
K
**
C
0
100
200
300
Spar
e re
spia
rtory
cap
acity
(F
CC
P-Ba
sal O
CR
)Tgr5 -/-
0
100
200
300
Spar
e re
spia
rtory
cap
acity
(F
CC
P-Ba
sal O
CR
)
Tgr5 +/+
*
Tgr5 +/+
*
0.00.51.01.52.02.5
16S/
HK2
*
0.00.51.01.52.02.5
16S/
HK2
0.0
0.3
0.6
0.9
1.2
PGC
-1α
/PAR
P1
****
Tgr5-/- DMSO Tgr5-/- DMSO + FR180204Tgr5-/- INT-777 Tgr5-/- INT-777 + FR180204

Supplementary Fig. 9. Uncropped scans of Western blots related to Figure 1. Scans of (A) peroxisome proliferator-activated receptor-coactivator-1 alpha (PGC1a), transcription factor T-box 1 (TBX1) and uncoupling protein 1 (UCP1), (B) voltage dependent anion channel 1 (VDAC1), and (C) glyceraldehyde 3-phosphate dehydrogenase (GAPDH) Western blots related to Figure 1f. Images represent three of more technical experiments.
VDAC1
GAPDH
100 kDa
50 kDa
75 kDa
37 kDa
25 kDa
25 kDa
37 kDa50 kDa
37 kDa
25 kDa
A
B
C
PGC1a
TBX1
UCP1

Supplementary Fig. 10. Uncropped scans of Western blots related to Figure 2. Scans of (A) peroxisome proliferator-activated receptor-coactivator-1 alpha (PGC1a), (B) transcription factor T-box 1 (TBX1), (C) uncoupling protein 1 (UCP1), (D) voltagedependent anion channel 1 (VDAC1), and (E) glyceraldehyde 3-phosphatedehydrogenase (GAPDH) Western blots related to Figure 2f. Images represent three ofmore technical experiments.
150 kDa
50 kDa
75 kDa
37 kDa
25 kDa
37 kDa
25 kDa
37 kDa
50 kDa
A
B
C
D
E
37 kDa
100 kDaPGC1a
TBX1
UCP1
VDAC1
GAPDH

Supplementary Fig. 11. Uncropped scans of Western blots related to Figure 3. Scans of (A) peroxisome proliferator-activated receptor-coactivator-1 alpha (PGC1a), (B) transcription factor T-box 1 (TBX1), (C) voltage dependent anion channel 1 (VDAC1)and uncoupling protein 1 (UCP1), and (D) glyceraldehyde 3-phosphate dehydrogenase(GAPDH) Western blots related to Figure 3e. Images represent three of more technicalexperiments.
TBX1
VDAC1
UCP1
GAPDH
100 kDa75 kDa
37 kDa
50 kDa
37 kDa
25 kDa
150 kDa
37 kDa
37 kDa
25 kDa
25 kDa
150 kDa
100 kDa75 kDa
A
B
C
D
PGC1a

Supplementary Fig. 12. Uncropped scans of Western blots related to Figure 4. Scans of (A) glyceraldehyde 3-phosphate dehydrogenase (GAPDH), peroxisome proliferator-activated receptor-coactivator-1 alpha (PGC1a) and voltage dependent anion channel 1 (VDAC1), (B) transcription factor T-box 1 (TBX1) and uncoupling protein 1 (UCP1) Western blots related to Figure 4c. Images represent three of more technical experiments.
25 kDa
25 kDa
37 kDa
37 kDa
50 kDa
37 kDa
37 kDa
25 kDa
100 kDaPGC1a
GAPDH
TBX1
VDAC1
UCP1
A
B
75 kDa

Supplementary Fig. 13. Uncropped scans of Western blots related to Figures 5 and 6. Scans of (A) peroxisome proliferator-activated receptor-coactivator-1 alpha (PGC1a), (B) poly(ADP-ribose) polymerase 1 (PARP1), (C) transcription factor T-box 1 (TBX1) and uncoupling protein 1 (UCP1), (D) phosphorylation of cyclic AMP response element binding protein (pCREB) and phosphorylation of extracellular signal-regulated kinase (pERK), and (E) cyclic AMP response element binding protein (CREB) and extracellular signal-regulated kinase (ERK) Western blots related to Figures 5d and 6e. Images represent three of more technical experiments.
100 kDa150 kDa
75 kDa
37 kDa
37 kDa
37 kDa
37 kDa
50 kDa
50 kDa
50 kDa
50 kDa
50 kDa
100 kDa150 kDa
PGC1a
PARP1
TBX1
pCREB
UCP1
CREB
pERK
ERK
A
B
C
D
E
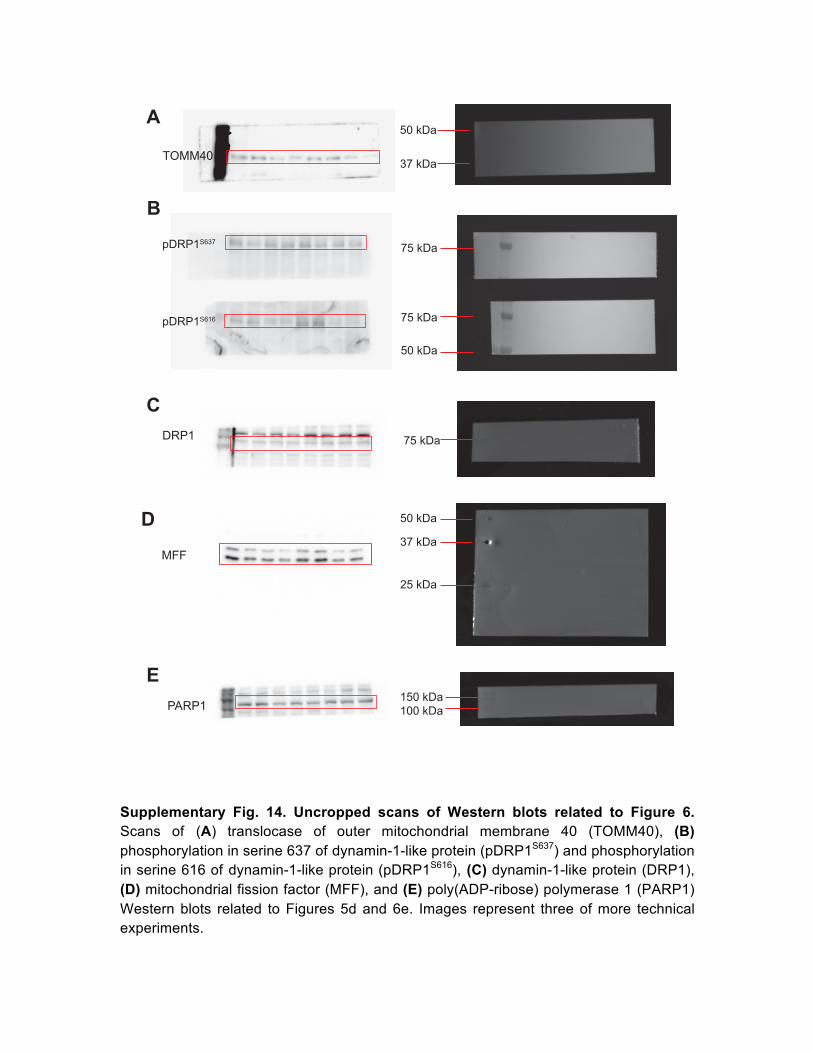
Supplementary Fig. 14. Uncropped scans of Western blots related to Figure 6. Scans of (A) translocase of outer mitochondrial membrane 40 (TOMM40), (B) phosphorylation in serine 637 of dynamin-1-like protein (pDRP1S637) and phosphorylation in serine 616 of dynamin-1-like protein (pDRP1S616), (C) dynamin-1-like protein (DRP1), (D) mitochondrial fission factor (MFF), and (E) poly(ADP-ribose) polymerase 1 (PARP1)Western blots related to Figures 5d and 6e. Images represent three of more technicalexperiments.
37 kDa
100 kDa
75 kDa
75 kDa
50 kDa
75 kDa
50 kDa
37 kDa
25 kDa
50 kDa
150 kDaPARP1
MFF
DRP1
TOMM40
E
D
B
C
A
pDRP1S637
pDRP1S616
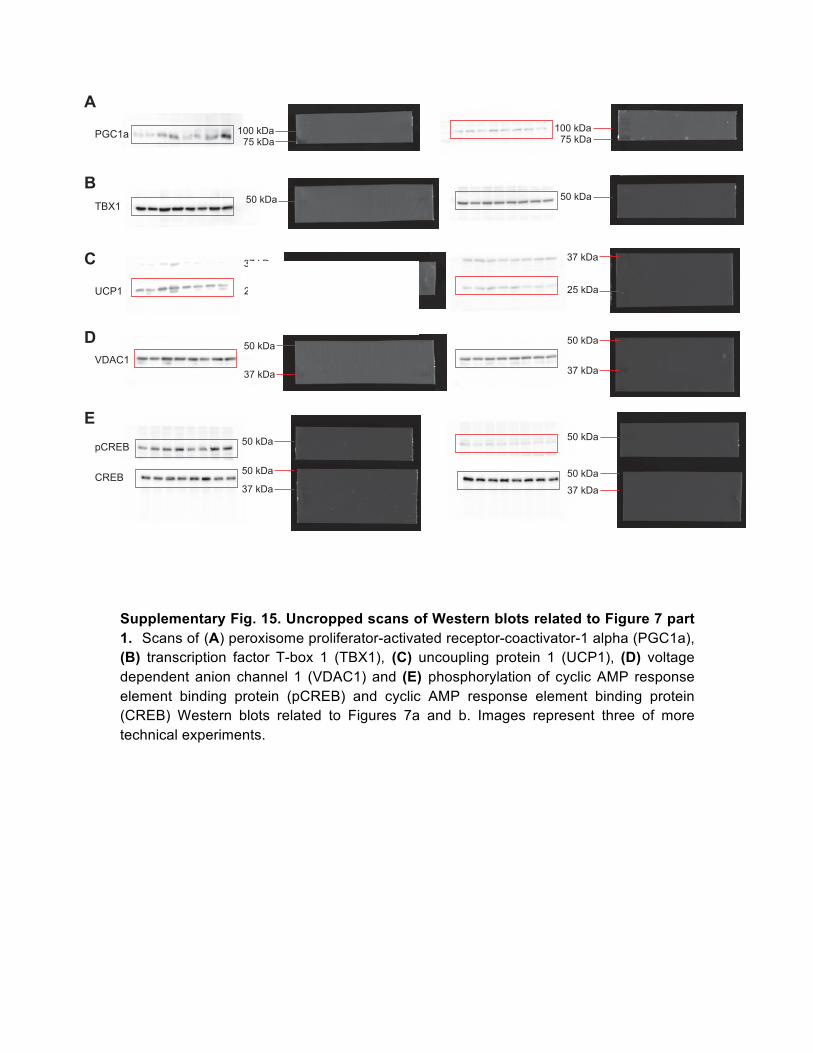
Supplementary Fig. 15. Uncropped scans of Western blots related to Figure 7 part 1. Scans of (A) peroxisome proliferator-activated receptor-coactivator-1 alpha (PGC1a),(B) transcription factor T-box 1 (TBX1), (C) uncoupling protein 1 (UCP1), (D) voltagedependent anion channel 1 (VDAC1) and (E) phosphorylation of cyclic AMP responseelement binding protein (pCREB) and cyclic AMP response element binding protein(CREB) Western blots related to Figures 7a and b. Images represent three of moretechnical experiments.
PGC1a
TBX1
UCP1
VDAC1
pCREB
CREB37 kDa
50 kDa
50 kDa
37 kDa
50 kDa
50 kDa
37 kDa
50 kDa
37 kDa
25 kDa
75 kDa
50 kDa
100 kDa75 kDa
100 kDa
50 kDa
37 kDa
25 kDa
37 kDa
50 kDa
A
B
C
D
E

Supplementary Fig. 16. Uncropped scans of Western blots related to Figure 7 part 2. Scans of (A) phosphorylation of extracellular signal-regulated kinase (pERK), (B)phosphorylation in serine 616 of dynamin-1-like protein (pDRP1S616), (C) phosphorylationin serine 637 of dynamin-1-like protein (pDRP1S637), (D) extracellular signal-regulatedkinase (ERK) and (E) poly(ADP-ribose) polymerase 1 (PARP1) Western blots related toFigures 7a and b. Images represent three of more technical experiments.
37 kDa
50 kDa
75 kDa100 kDa
37 kDa50 kDa
75 kDa100 kDa
75 kDa100 kDa75 kDa
100 kDa
37 kDa50 kDa
37 kDa50 kDa
pERK
ERK
PARP1
pDRP1S637
pDRP1S616
A
B
C
D
E150 kDa100 kDa75 kDa
100 kDa150 kDa
75 kDa
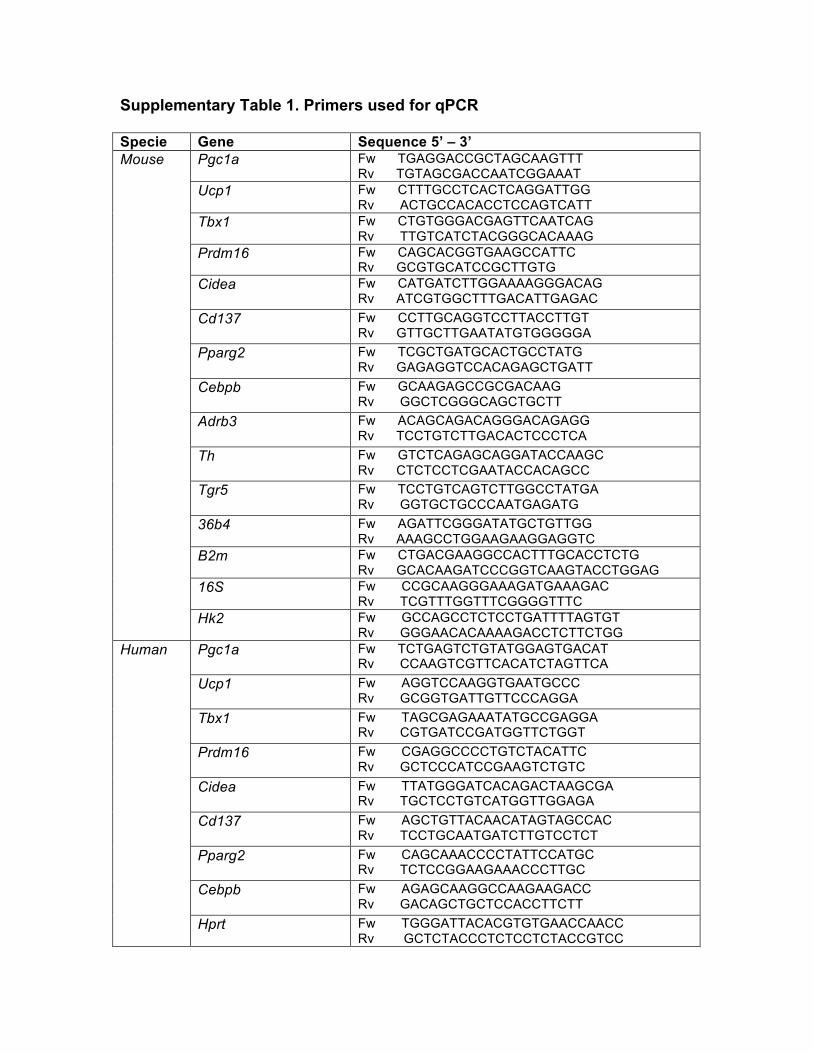
Supplementary Table 1. Primers used for qPCR
Specie Gene Sequence 5’ – 3’ Mouse Pgc1a Fw TGAGGACCGCTAGCAAGTTT
Rv TGTAGCGACCAATCGGAAAT Ucp1 Fw CTTTGCCTCACTCAGGATTGG
Rv ACTGCCACACCTCCAGTCATT Tbx1 Fw CTGTGGGACGAGTTCAATCAG
Rv TTGTCATCTACGGGCACAAAG Prdm16 Fw CAGCACGGTGAAGCCATTC
Rv GCGTGCATCCGCTTGTG Cidea Fw CATGATCTTGGAAAAGGGACAG
Rv ATCGTGGCTTTGACATTGAGAC Cd137 Fw CCTTGCAGGTCCTTACCTTGT
Rv GTTGCTTGAATATGTGGGGGA Pparg2 Fw TCGCTGATGCACTGCCTATG
Rv GAGAGGTCCACAGAGCTGATT Cebpb Fw GCAAGAGCCGCGACAAG
Rv GGCTCGGGCAGCTGCTT Adrb3 Fw ACAGCAGACAGGGACAGAGG
Rv TCCTGTCTTGACACTCCCTCA Th Fw GTCTCAGAGCAGGATACCAAGC
Rv CTCTCCTCGAATACCACAGCC Tgr5 Fw TCCTGTCAGTCTTGGCCTATGA
Rv GGTGCTGCCCAATGAGATG 36b4 Fw AGATTCGGGATATGCTGTTGG
Rv AAAGCCTGGAAGAAGGAGGTC B2m Fw CTGACGAAGGCCACTTTGCACCTCTG
Rv GCACAAGATCCCGGTCAAGTACCTGGAG 16S Fw CCGCAAGGGAAAGATGAAAGAC
Rv TCGTTTGGTTTCGGGGTTTC Hk2 Fw GCCAGCCTCTCCTGATTTTAGTGT
Rv GGGAACACAAAAGACCTCTTCTGG Human Pgc1a Fw TCTGAGTCTGTATGGAGTGACAT
Rv CCAAGTCGTTCACATCTAGTTCA Ucp1 Fw AGGTCCAAGGTGAATGCCC
Rv GCGGTGATTGTTCCCAGGA Tbx1 Fw TAGCGAGAAATATGCCGAGGA
Rv CGTGATCCGATGGTTCTGGT Prdm16 Fw CGAGGCCCCTGTCTACATTC
Rv GCTCCCATCCGAAGTCTGTC Cidea Fw TTATGGGATCACAGACTAAGCGA
Rv TGCTCCTGTCATGGTTGGAGA Cd137 Fw AGCTGTTACAACATAGTAGCCAC
Rv TCCTGCAATGATCTTGTCCTCT Pparg2 Fw CAGCAAACCCCTATTCCATGC
Rv TCTCCGGAAGAAACCCTTGC Cebpb Fw AGAGCAAGGCCAAGAAGACC
Rv GACAGCTGCTCCACCTTCTT Hprt Fw TGGGATTACACGTGTGAACCAACC
Rv GCTCTACCCTCTCCTCTACCGTCC
