supplementary information microrna-33b knock-in … · koyama, naoya sowa, naoya yahagi, hitoshi...
TRANSCRIPT
Supplementary Information
MicroRNA-33b knock-in mice for an intron of sterol regulatory
element-binding factor 1 (Srebf1) exhibit reduced HDL-C in vivo
Takahiro Horie, Tomohiro Nishino, Osamu Baba, Yasuhide Kuwabara, Tetsushi Nakao,
Masataka Nishiga, Shunsuke Usami, Masayasu Izuhara, Fumiko Nakazeki, Yuya Ide, Satoshi
Koyama, Naoya Sowa, Naoya Yahagi, Hitoshi Shimano, Tomoyuki Nakamura, Koji Hasegawa,
Noriaki Kume, Masayuki Yokode, Toru Kita, Takeshi Kimura, and Koh Ono
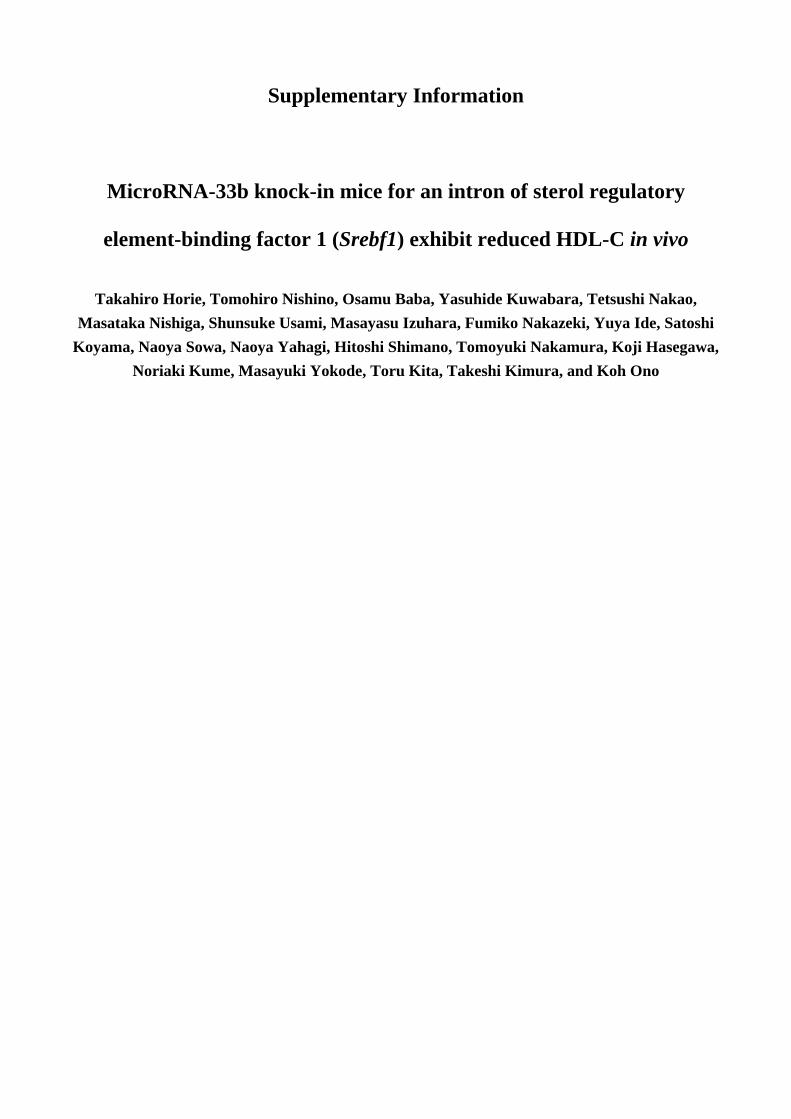
Supplementary Table S1
Serum lipid profiling of WT and miR-33b KI+/+ mice by HPLC
Lipoprotein
Major (Fraction No.)
Diameter Sub-class (Fraction No.) WT (n=4) KI+/+ (n=5)
TC (mg/dl) 72.71 ± 5.42 52.56 ± 3.91*
CM (1-2) >80nm 0.73 ± 0.14 0.36 ± 0.06*
VLDL (3-7) 30-80nm 3.93 ± 0.22 3.76 ± 0.41
LDL (8-13) 16-30nm 10.86 ± 0.60 9.85 ± 0.78
large LDL (8) 3.10 ± 0.09 3.39 ± 0.24
medium LDL (9) 2.85 ± 0.11 3.15 ± 0.21
small LDL (10) 1.77 ± 0.14 1.63 ± 0.18
very small LDL (11-13) 2.73 ± 0.60 1.68 ± 0.26
HDL (14-20) 8-16nm 57.20 ± 4.92 38.59 ± 3.23*
very large HDL (14-15) 2.30 ± 0.50 0.68 ± 0.14*
large HDL (16) 18.49 ± 2.44 8.89 ± 1.38**
medium HDL (17) 24.90 ± 1.46 18.97 ± 1.29*
small HDL (18) 8.45 ± 0.43 7.74 ± 0.47
very small HDL (19-20) 3.05 ± 0.25 2.32 ± 0.25
TG (mg/dl) 22.04 ± 2.48 19.27 ± 2.66
Values are mean ± SEM. Blood was obtained from chow-fed 8 weeks old male mice, after 4 h fasting.
The serum was analyzed by HPLC, as described in material and methods. *p<0.05, **p<0.01 compared with WT mice.
TC, total cholesterol; TG, triglyceride; CM, chylomicrons; VLDL, very low-density lipoprotein; LDL, low-density lipoprotein;
HDL, high-density lipoprotein.
Human SREBF1Mouse Srebf1
Human SREBF1Mouse Srebf1
Human SREBF1Mouse Srebf1
Human SREBF1Mouse Srebf1
Human SREBF1Mouse Srebf1
Human SREBF1Mouse Srebf1
Human SREBF1Mouse Srebf1
Exon 16
Exon 17
Exon 18
1 GAGAGACCCCTGCCCAGGGCAGCTCTGCACTCCTTCAAGGCTGCCCGGGCCCTGCTGGGC 601 GAGAGACCCCTGCCCAGGGCAGCTCTGTACTCCTTCAAGGCTGCCCGGGCTCTGCTGGAC 60
61 TGTGCCAAGGCAGAGTCTGGTCCAGCCAGCCTGACCATCTGTGAGAAGGCCAGTGGGTAC 12061 CACAGAAAGGTGGAATCTAGCCCAGCCAGCCTGGCCATCTGTGAGAAGGCCAGTGGGTAC 120
121 CTGCAGGACAGCCTGGCTACCACACCAGCCAGCAGCTCCATTGACAAGGCCGTGCAGCTG 180121 CTGCGGGACAGCTTAGCCTCTACACCAACTGGCAGTTCCATTGACAAGGCCATGCAGCTG 180
181 TTCCTGTGTGACCTGCTTCTTGTGGTGCGCACCAGCCTGTGGCGGCAGCAGCAGCCCCCG 240181 CTCCTGTGTGATCTACTTCTTGTGGCCCGTACCAGTCTGTGGCAGCGGCAGCAGTCACCA 240
241 GCCCCGGCCCCAGCAGCCCAGGGCACCAGCAGCAGGCCCCAGGCTTCCGCCCTTGAGCTG 300241 GCTTCAGTCCAGGTAGCTCACGGTACCAGCAATGGACCCCAGGCCTCTGCTCTGGAGCTG 300
301 CGTGGCTTCCAACGGGACCTGAGCAGCCTGAGGCGGCTGGCACAGAGCTTCCGGCCCGCC 360301 CGTGGTTTCCAACATGACCTGAGCAGCCTGCGGCGGTTGGCACAGAGCTTCCGGCCTGCT 360
361 ATGCGGAGG 369361 ATGAGGAGG 369
Srebf1 Srebf2Mouse
miR-33(a)SREBP-2SREBP-1
SREBF1 SREBF2Human
miR-33b miR-33aSREBP-2SREBP-1
miR-33a; GUGCAUUGUAGUUGCAUUGCAmiR-33b; GUGCAUUGCUGUUGCAUUGC
Ex.16 Ex.17miR-33b
166bp 201bp475bp
Ex.16 Ex.17
166bp 201bp410bp
Ex.15 Ex.18
133bp
HumanSREBF1
MouseSrebf1
204bp 112bp
Ex.18
112bp
Ex.15
133bp 168bp
89bp
98bp
a
b
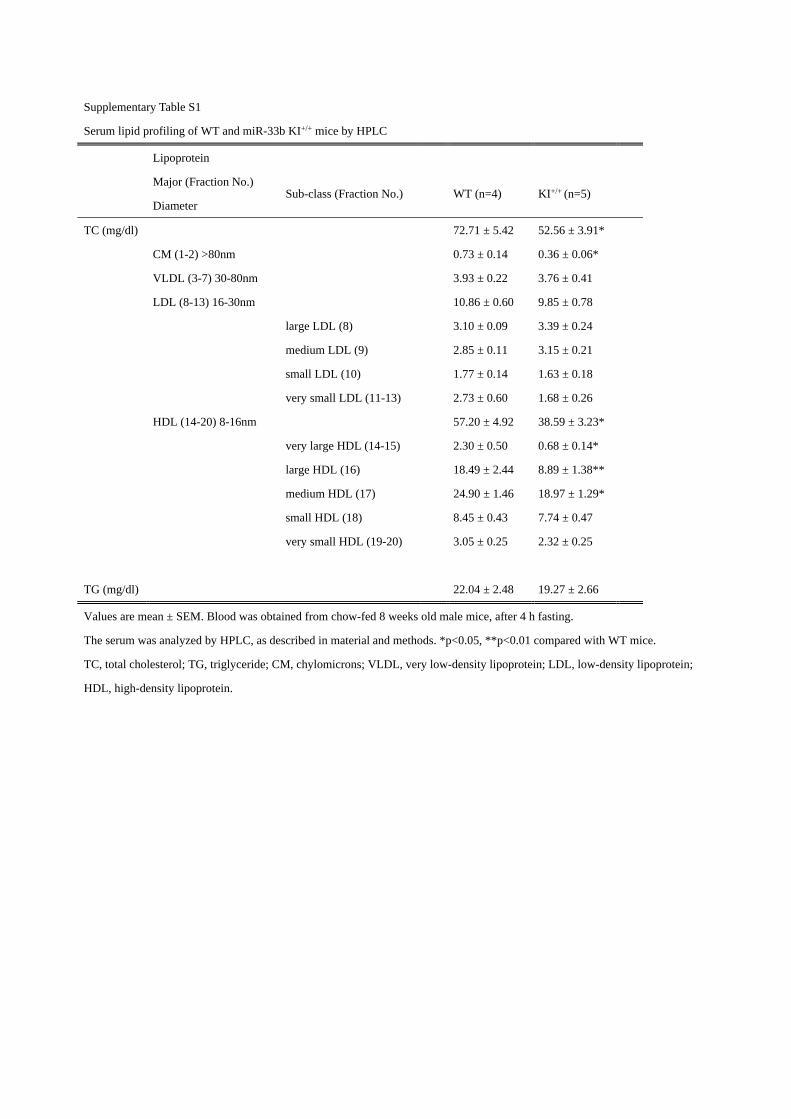
Supplementary Figure S1. Scheme of SREBFs and miR-33s and homologies in exons 16 and 17 of
SREBF1 between human and mouse. (a) miR-33b is lacking in intron of mouse Srebf1. Mature sequences
of miR-33a and miR-33b are indicated in the inset. (b) There are high homologies in exons 16 and 17 between
human SREBF1 and mouse Srebf1 (82.6% of nucleotides and 79.7% of amino acids).

a
bSr
ebf1
(A.U
.)
WT KI+/- KI+/+0.0
0.5
1.0
1.5
2.0c d
Sreb
f2 (A
.U.)
WT KI+/- KI+/+0.0
0.5
1.0
1.5
5’ probe
WT
3’ probe
Neo probe 6.6 kb
35.2 kb (WT allele)19.6 kb (Targeted allele)
10.7 kb (WT allele)
4.8 kb (Targeted allele)
ES clone for injection
ES clones
e f
miR
-33a
(A.U
.)
WT KI+/- KI+/+0.0
0.5
1.0
1.5
2.0
2.5***
*
Sreb
f1 (A
.U.)
Brain
Heart
Liver
Kidney
Sub WAT
Epi WAT
Gastro
cnem
ius0.0
0.5
1.0
1.5
miR
-33b
(A.U
.)
Brain
Heart
Liver
Kidney
Sub WAT
Epi WAT
Gastro
cnem
ius0.0
0.5
1.0
1.5
Supplementary Figure S2. Generation of miR-33b knock-in mice. (a) Southern blotting analysis of genomic DNA
from ES cells that were successfully targeted by a KI vector. Representative images are shown. (b-d) Quantitative
real-time PCR analysis of miR-33a (b), Srebf1 (c) and Srebf2 (d) in the liver of 8-wk-old WT, KI+/- and KI+/+ male
mice (n=6). Values are mean ± s.e.m. *p < 0.05 ***p < 0.001 by one-way analysis of variance. (e, f) Quantitative
real-time PCR analysis of Srebf1 (e) and miR-33b (f) in 8-wk-old KI+/+ male mice (n=3). Values are mean ± s.e.m.
Sub WAT indicates subcutaneous white adipose tissue. Epi WAT indicates epididymal white adipose tissue.
a b c d
miR
-33a
(A.U
.)
WT KI+/+0.0
0.5
1.0
1.5
miR
-33b
(A.U
.)
WT KI+/+0.0
0.5
1.0
1.5
N.D.
Sreb
f2 (A
.U.)
WT KI+/+0.0
0.5
1.0
1.5
Sreb
f1 (A
.U.)
WT KI+/+0.0
0.5
1.0
1.5
e f
ABC
A1 (%
)
WT KI+/+0
50
100
150
ABC
G1
(%)
WT KI+/+0
50
100
150
* *
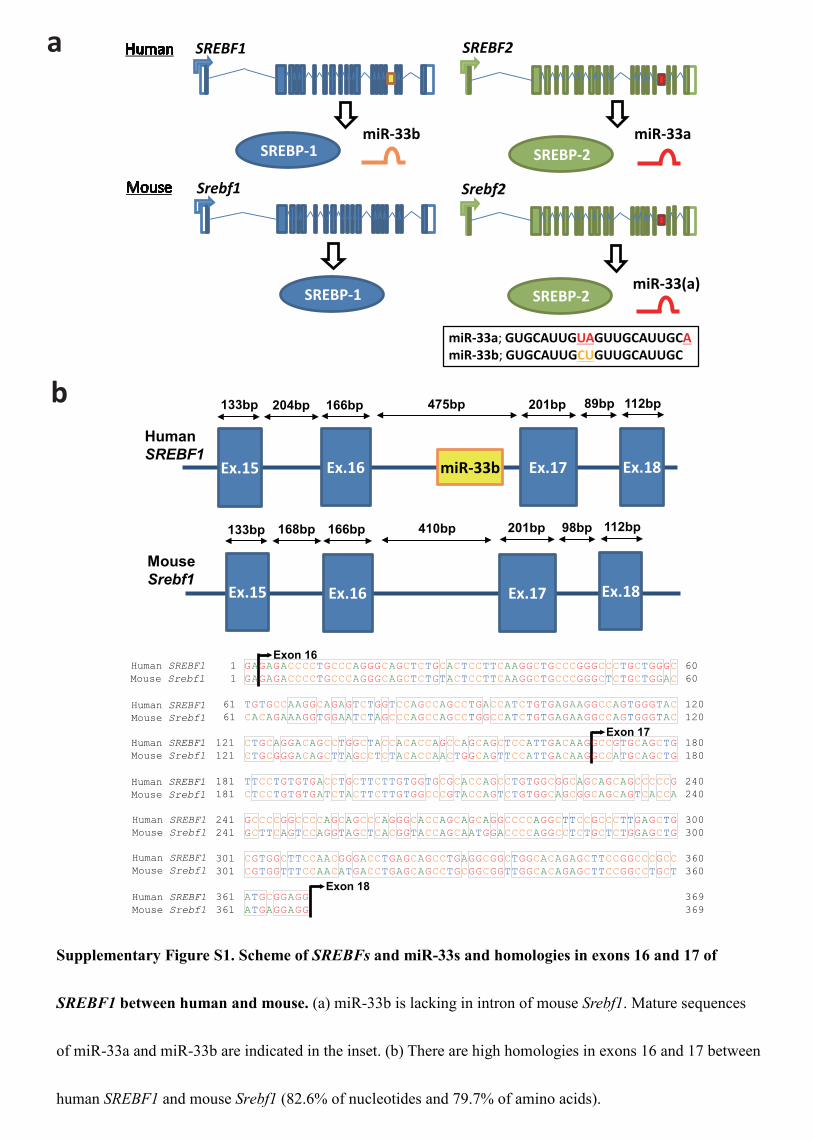
Supplementary Figure S3. The expression levels of miR-33s and Srebfs in KI macrophages. (a-d)
Quantitative real-time PCR analysis of miR-33b (a), miR-33a (b), Srebf1 (c) and Srebf2 (d) in peritoneal
macrophages from 8-wk-old WT and KI+/+ male mice (n=3). Values are mean ± s.e.m. N.D., not determined. (e,
f) Densitomeric analysis of ABCA1 (e) and ABCG1 (f) in peritoneal macrophages from 8-wk-old WT and KI+/+
male mice. (n = 4). Values are mean ± s.e.m. *p < 0.05 by Student’s t-test.
a b c**
Live
r w
eigh
t (g)
Vehicl
e
T0901
317
0.0
0.5
1.0
1.5
2.0
**Li
ver
wei
ght (
g)
Vehicl
e
T0901
317
0.0
0.5
1.0
1.5
2.0
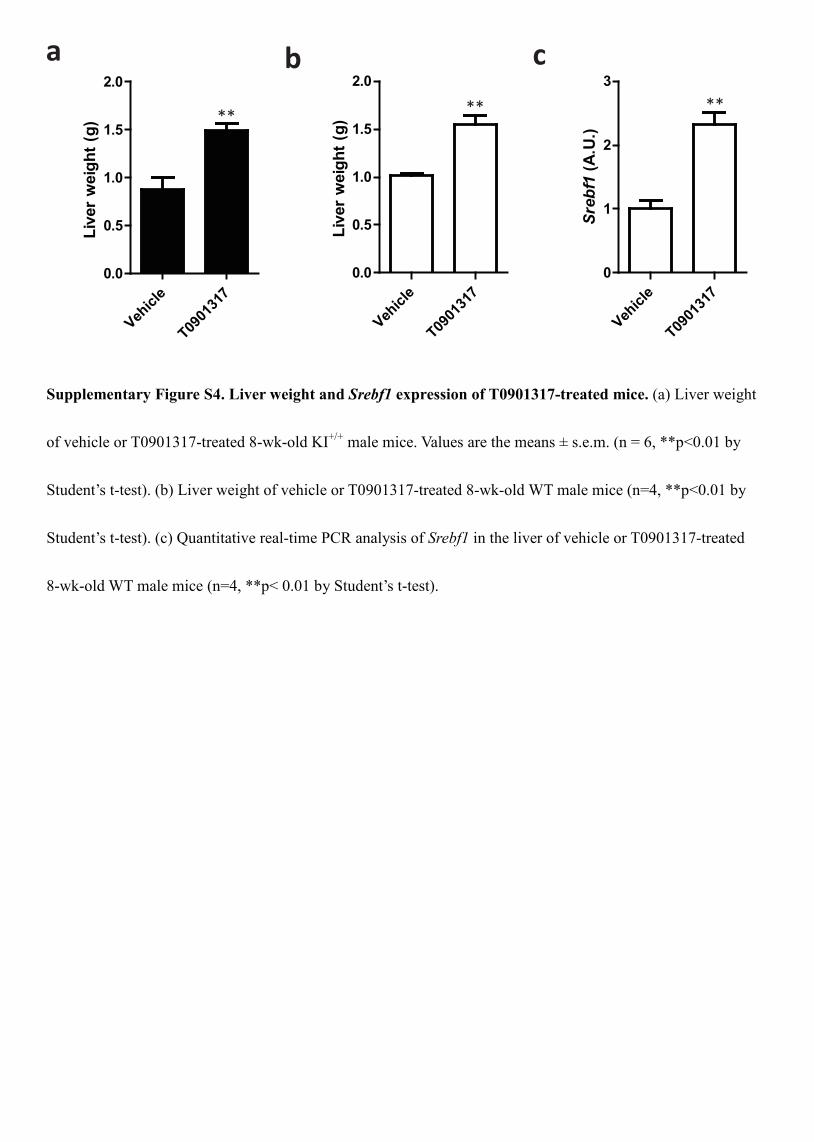
Supplementary Figure S4. Liver weight and Srebf1 expression of T0901317-treated mice. (a) Liver weight
of vehicle or T0901317-treated 8-wk-old KI+/+ male mice. Values are the means ± s.e.m. (n = 6, **p<0.01 by
Student’s t-test). (b) Liver weight of vehicle or T0901317-treated 8-wk-old WT male mice (n=4, **p<0.01 by
Student’s t-test). (c) Quantitative real-time PCR analysis of Srebf1 in the liver of vehicle or T0901317-treated
8-wk-old WT male mice (n=4, **p< 0.01 by Student’s t-test).
**
Sreb
f1 (A
.U.)
Vehicl
e
T0901
317
0
1
2
3
a b cAB
CA1
(%)
WT KI+/- KI+/+0
50
100
150
d e fM
atur
e SR
EBP-
1 (%
)
WT KI+/- KI+/+0
50
100
150
SRC
1 (%
)
WT KI+/- KI+/+0
50
100
150
200PC
K1
(%)
WT KI+/- KI+/+0
50
100
150
200C
REB
(%)
WT KI+/- KI+/+0
50
100
150
G6P
ase
(%)
WT KI+/- KI+/+0
50
100
150
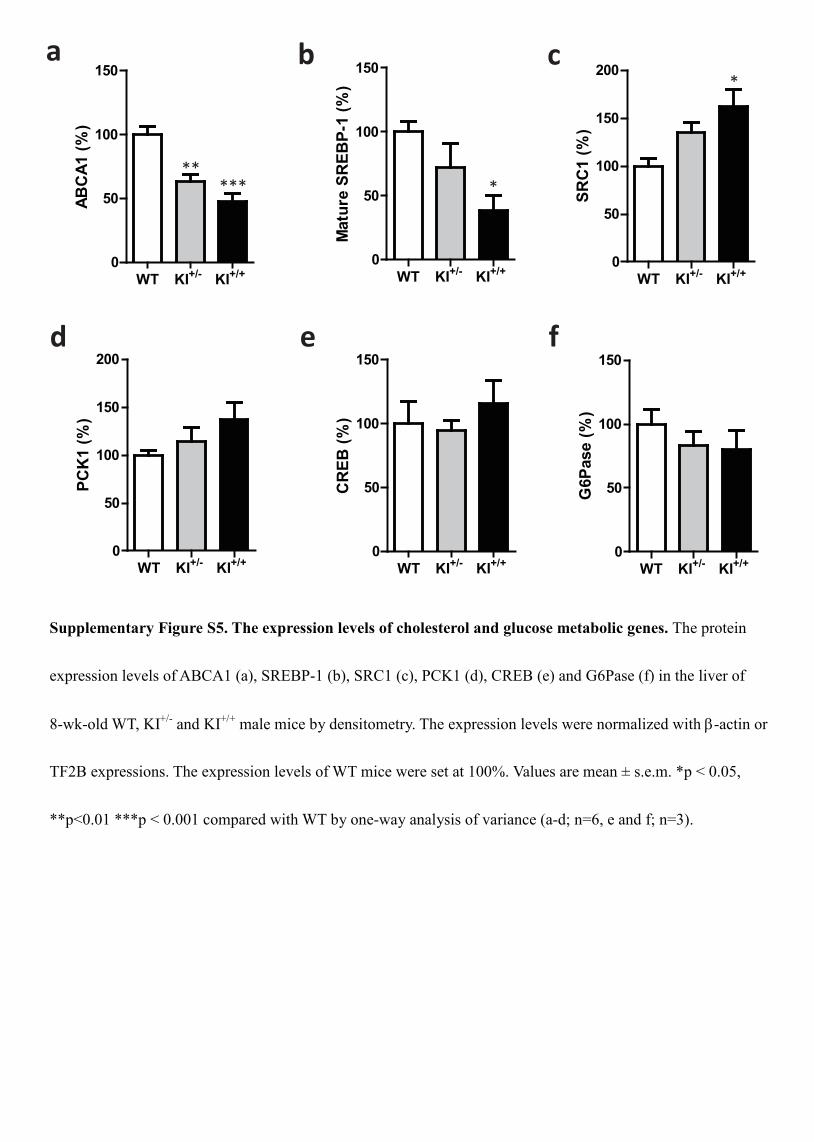
Supplementary Figure S5. The expression levels of cholesterol and glucose metabolic genes. The protein
expression levels of ABCA1 (a), SREBP-1 (b), SRC1 (c), PCK1 (d), CREB (e) and G6Pase (f) in the liver of
8-wk-old WT, KI+/- and KI+/+ male mice by densitometry. The expression levels were normalized with β-actin or
TF2B expressions. The expression levels of WT mice were set at 100%. Values are mean ± s.e.m. *p < 0.05,
**p<0.01 ***p < 0.001 compared with WT by one-way analysis of variance (a-d; n=6, e and f; n=3).
*** *
*
**

SRE SREBP-1 responsive gene
SREBF1c miR-33b
miR-33b
InsulinLXR ligand
SREBF1c mRNA
SRELXRE
FASN, ACC, SCD1
Supplementary Figure S6. Proposed feedback mechanism to regulate SREBP-1 level by intronic miR-33b.
2b
2c 2d
4a 4b
5a
S2a
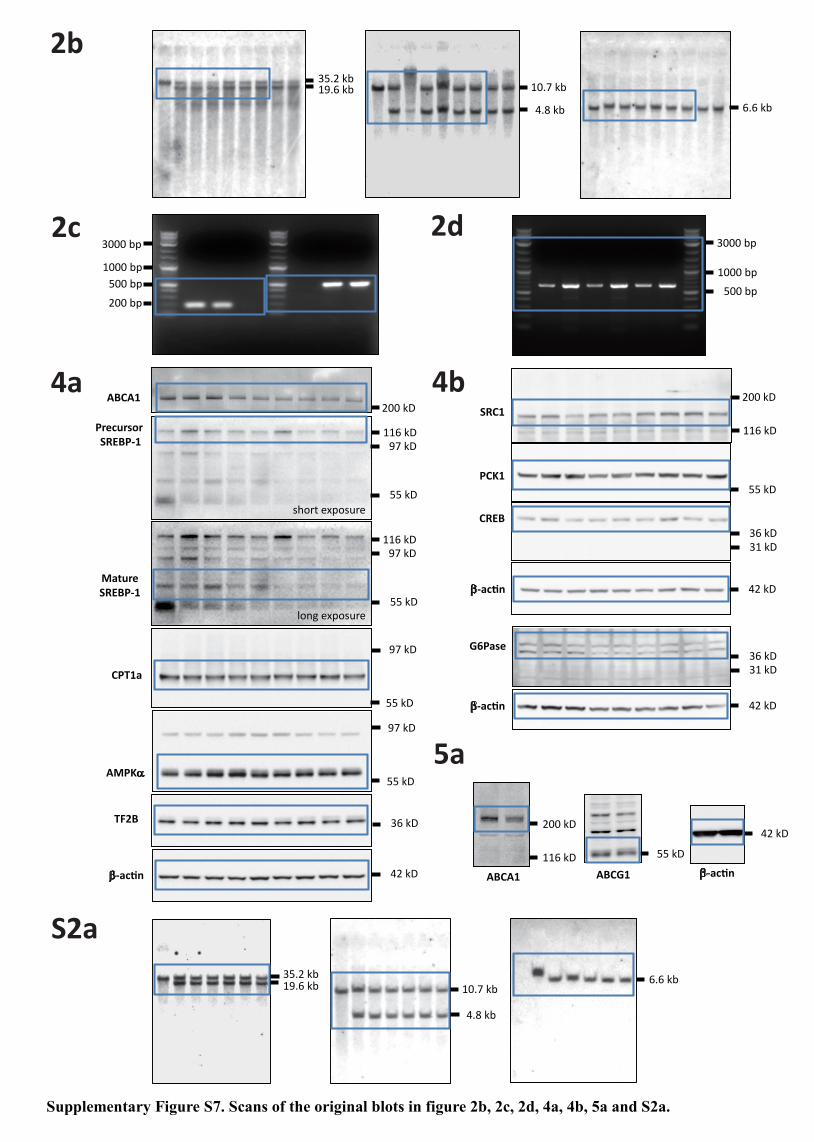
Supplementary Figure S7. Scans of the original blots in figure 2b, 2c, 2d, 4a, 4b, 5a and S2a.
200 kDABCA1
97 kD116 kD
55 kD
97 kD116 kD
55 kD
Precursor SREBP-1
short exposure
long exposure
MatureSREBP-1
AMPKα55 kD
97 kD
55 kD
97 kD
CPT1a
TF2B 36 kD
42 kDβ-actin
42 kDβ-actin
200 kD
116 kDSRC1
55 kDPCK1
36 kD31 kD
CREB
42 kDβ-actin
36 kD31 kD
G6Pase
200 kD
116 kD 55 kD
42 kD
β-actinABCG1ABCA1
10.7 kb
4.8 kb 6.6 kb
3000 bp
1000 bp500 bp
200 bp
3000 bp
1000 bp500 bp
6.6 kb
35.2 kb19.6 kb
35.2 kb19.6 kb 10.7 kb
4.8 kb