supplementary information - … et al., supplementary information doi:10.1038/nature11913 1....
TRANSCRIPT
W W W. N A T U R E . C O M / N A T U R E | 1
SUPPLEMENTARY INFORMATIONdoi:10.1038/nature11913
Diard et al., Supplementary information
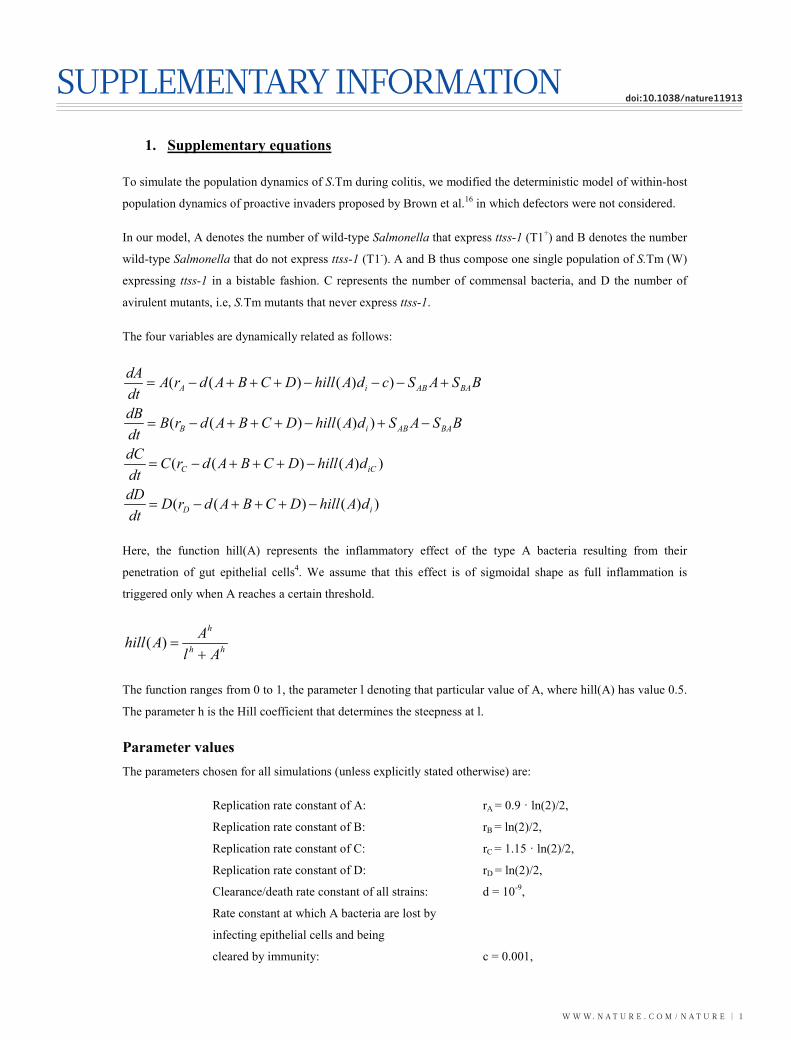
1. Supplementary equations
To simulate the population dynamics of S.Tm during colitis, we modified the deterministic model of within-host
population dynamics of proactive invaders proposed by Brown et al.16 in which defectors were not considered.
In our model, A denotes the number of wild-type Salmonella that express ttss-1 (T1+) and B denotes the number
wild-type Salmonella that do not express ttss-1 (T1-). A and B thus compose one single population of S.Tm (W)
expressing ttss-1 in a bistable fashion. C represents the number of commensal bacteria, and D the number of
avirulent mutants, i.e, S.Tm mutants that never express ttss-1.
The four variables are dynamically related as follows:
))()((
))()((
))()((
))()((
iD
iCC
BAABiB
BAABiA
dAhillDCBAdrDdtdD
dAhillDCBAdrCdtdC
BSASdAhillDCBAdrBdtdB
BSAScdAhillDCBAdrAdtdA
Here, the function hill(A) represents the inflammatory effect of the type A bacteria resulting from their
penetration of gut epithelial cells4. We assume that this effect is of sigmoidal shape as full inflammation is
triggered only when A reaches a certain threshold.
hh
h
AlAAhill )(
The function ranges from 0 to 1, the parameter l denoting that particular value of A, where hill(A) has value 0.5.
The parameter h is the Hill coefficient that determines the steepness at l.
Parameter values The parameters chosen for all simulations (unless explicitly stated otherwise) are:
Replication rate constant of A: rA = 0.9 · ln(2)/2,
Replication rate constant of B: rB = ln(2)/2,
Replication rate constant of C: rC = 1.15 · ln(2)/2,
Replication rate constant of D: rD = ln(2)/2,
Clearance/death rate constant of all strains: d = 10-9,
Rate constant at which A bacteria are lost by
infecting epithelial cells and being
cleared by immunity: c = 0.001,
SUPPLEMENTARY INFORMATION
2 | W W W. N A T U R E . C O M / N A T U R E
RESEARCH
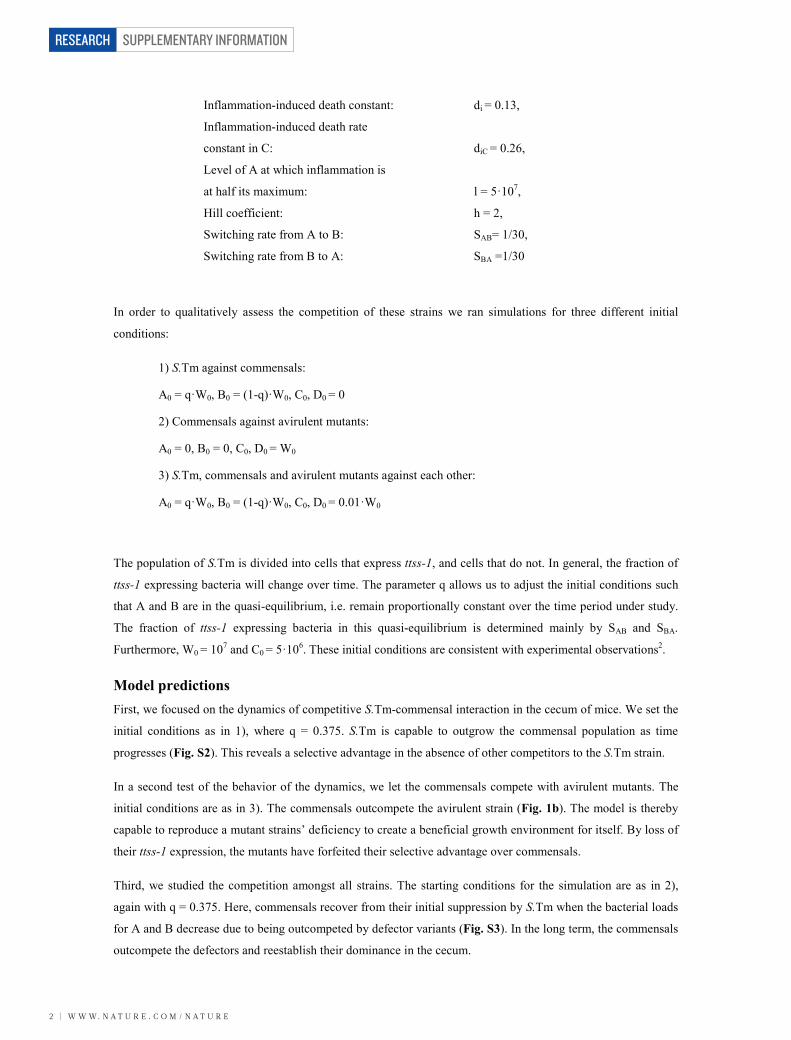
Inflammation-induced death constant: di = 0.13,
Inflammation-induced death rate
constant in C: diC = 0.26,
Level of A at which inflammation is
at half its maximum: l = 5·107,
Hill coefficient: h = 2,
Switching rate from A to B: SAB= 1/30,
Switching rate from B to A: SBA =1/30
In order to qualitatively assess the competition of these strains we ran simulations for three different initial
conditions:
1) S.Tm against commensals:
A0 = q·W0, B0 = (1-q)·W0, C0, D0 = 0
2) Commensals against avirulent mutants:
A0 = 0, B0 = 0, C0, D0 = W0
3) S.Tm, commensals and avirulent mutants against each other:
A0 = q·W0, B0 = (1-q)·W0, C0, D0 = 0.01·W0
The population of S.Tm is divided into cells that express ttss-1, and cells that do not. In general, the fraction of
ttss-1 expressing bacteria will change over time. The parameter q allows us to adjust the initial conditions such
that A and B are in the quasi-equilibrium, i.e. remain proportionally constant over the time period under study.
The fraction of ttss-1 expressing bacteria in this quasi-equilibrium is determined mainly by SAB and SBA.
Furthermore, W0 = 107 and C0 = 5·106. These initial conditions are consistent with experimental observations2.
Model predictions First, we focused on the dynamics of competitive S.Tm-commensal interaction in the cecum of mice. We set the
initial conditions as in 1), where q = 0.375. S.Tm is capable to outgrow the commensal population as time
progresses (Fig. S2). This reveals a selective advantage in the absence of other competitors to the S.Tm strain.
In a second test of the behavior of the dynamics, we let the commensals compete with avirulent mutants. The
initial conditions are as in 3). The commensals outcompete the avirulent strain (Fig. 1b). The model is thereby
capable to reproduce a mutant strains’ deficiency to create a beneficial growth environment for itself. By loss of
their ttss-1 expression, the mutants have forfeited their selective advantage over commensals.
Third, we studied the competition amongst all strains. The starting conditions for the simulation are as in 2),
again with q = 0.375. Here, commensals recover from their initial suppression by S.Tm when the bacterial loads
for A and B decrease due to being outcompeted by defector variants (Fig. S3). In the long term, the commensals
outcompete the defectors and reestablish their dominance in the cecum.

W W W. N A T U R E . C O M / N A T U R E | 3
SUPPLEMENTARY INFORMATION RESEARCH
In order to simulate a S.Tm strain with a lower fraction of ttss-1non-expressing cells (T1-) we can alter the
switching rates between the A and the B types. For the following simulations, we set these two rates to SAB=
0.06, SBA =0.1. The ratio between SAB and SBA is the most important determinant of the fraction of T1- cells,
which itself strongly influences the outcome of the competition between the bacterial strains in the cecum. In a
simulation with initial conditions as in 1), and q = 0.57, we find that this S.Tm strain producing a lower
proportion of T1- cells outcompetes the commensals faster (Fig. S4). This indicates that higher ttss-1 expression
confers a higher selective advantage over the commensal gut flora.
The situation changes if we alter the competitive setup to include the appearance of avirulent mutants. The
initial conditions are as in 2), with q = 0.57. Compared to the S.Tm strain with 63% T1- cells, the new strain
outcompetes the commensals faster, but is also replaced faster by avirulent mutants (Fig. S5). Once these
mutants have taken over the bacterial population, the inflammation wanes leading to the eventual fixation of the
commensals. This shows that higher levels of ttss-1 expression confer an advantage against commensals, but
also a disadvantage, i.e. an increased vulnerability to overgrowth by avirulent mutants.
The figure 1b was obtained by varying the proportion of T1- cells continuously from 0 to 100% through
alteration of the switching rates.

SUPPLEMENTARY INFORMATION
4 | W W W. N A T U R E . C O M / N A T U R E
RESEARCH
2. Supplementary table
Ancestor Re-isolated S.Tm* Ancestor Re-isolated S.Tm*hilE
SNPs/Indels position Gene/product Mutation SB300 S.Tm* I030 I032 H149 H150 S.Tm*hilE I034 I037
635606 putative PTS system mannose-specific enzyme IIAB
T->A Glu->Val + + + + + + + + +
1756092 yciT / Putative regulatory protein G->A Asp->Asn + + + + + + + + +
1227555 rne / ribonuclease E A->C Ile->leu + + + + +
231928 stfC / putative fimbrial outer membrane usher
G->GC (GC
repeat) + + +
3040571
hilD
T->C Cys->Phe + +
3041228 G->T Val->Phe + +
3041299 T->G Phe->Leu +
3041273 T->C Phe->Leu +
4811998
tsr / methyl-accepting chemotaxis protein I
T->G Ile->Ser +
4811835 G->T STOP +
4811097 GC->G + Comp Del Deletion + 1291339 intergenic region pliC (phage) - + 4328296 intergenic region metJ - + 2241504 stcD / Putative outermembrane
lipoprotein G->A
Ala->Thr +
Table S1. Convergent within-host evolution toward mutants in hilD (and tsr) revealed by full genome re-
sequencing of isolated clones. + stands for the presence of the corresponding mutation. SNP: Single Nucleotide
Polymorphism. Indels: Small Insertion or deletion (1 to 5 base pairs).
Clones described Table S1 were fully re-sequenced as described in Material and Methods. This included the
ancestral strains SB300, S.Tm* and S.Tm*hilE, and 6 clones re-isolated after 10 days of infection from the feces
of C57BL/6 mice. The re-isolated clones were picked based on their inability to secrete SipC, as determined by
the colony blot assay and Western blot (Figs. 2, S9). 4 of these clones (I030, I032, H149, H150) derived from
S.Tm* and were obtained from four different mice infected in two independent experiments. 2 other clones
(I034, I037) derived from two different mice infected in the same experiment with S.Tm*hilE.
Background mutations
The S.Tm* (SL1344 ssaV::aphT) and the S.Tm*hilE ancestors carried mutations respectively in rne (A->C; Ile-
>leu) and in stfC (Insertion G->GC) that were also found in their respective descendants (Table S1). The
mutation in rne was absent in the second S.Tm* (ssaV::cat) strain. This strain was as competitive as the
sequenced S.Tm* in vivo (Fig. 4a) and showed the same expression pattern of ttss-1 (Fig. S6c). The gene stfC is
part of the stf fimbrial operon. It was previously shown that the deletion of stfACDEFG did not change S.Tm
intestinal persistence in CBA mice44. Similarly, we observed that the deletion of stfC did not alter the
competitive ability of the intestinal populations of S.Tm* (Fig. S10). We concluded that the mutations in rne
and stfC were neutral in the context of this work and probably fixed by random genetic drift during
constructions steps.
Mutations (besides hilD) selected during within-host evolution
The gene tsr was mutated in all the variants descending from S.Tm*. Tsr is the chemotaxis transmembrane
receptor specific for serine and also involved in energy taxis45. Mutations observed across the entire tsr gene in
evolved T1+ S.Tm* clones (Table S1) suggested that no residual functions of the mutated Tsr could have been
selected during within-host evolution. In S.Tm, motility and chemotaxis play an important role as they allow
bacteria to reach nutrient rich niches deep inside the mucus layer of the inflamed intestine46. Altered chemotaxis
could therefore explain a competitive advantage of tsr mutants. Other mutations were also exclusively found in
one clone, in stcD and in intergenic regions (Table S1) implying the ongoing fixation of either secondary
beneficial mutations or of neutral mutations that hitchhiked during selective sweeps.

W W W. N A T U R E . C O M / N A T U R E | 5
SUPPLEMENTARY INFORMATION RESEARCHcompetitive ability of the intestinal populations of S.Tm* (Fig. S10). We concluded that the mutations in rne
and stfC were neutral in the context of this work and probably fixed by random genetic drift during
constructions steps.
Mutations (besides hilD) selected during within-host evolution
The gene tsr was mutated in all the variants descending from S.Tm*. Tsr is the chemotaxis transmembrane
receptor specific for serine and also involved in energy taxis45. Mutations observed across the entire tsr gene in
evolved T1+ S.Tm* clones (Table S1) suggested that no residual functions of the mutated Tsr could have been
selected during within-host evolution. In S.Tm, motility and chemotaxis play an important role as they allow
bacteria to reach nutrient rich niches deep inside the mucus layer of the inflamed intestine46. Altered chemotaxis
could therefore explain a competitive advantage of tsr mutants. Other mutations were also exclusively found in
one clone, in stcD and in intergenic regions (Table S1) implying the ongoing fixation of either secondary
beneficial mutations or of neutral mutations that hitchhiked during selective sweeps.
SUPPLEMENTARY INFORMATION
6 | W W W. N A T U R E . C O M / N A T U R E
RESEARCH
A
hill(
A)
0.0
0.2
0.4
0.6
0.8
1.0
106 107 108 109
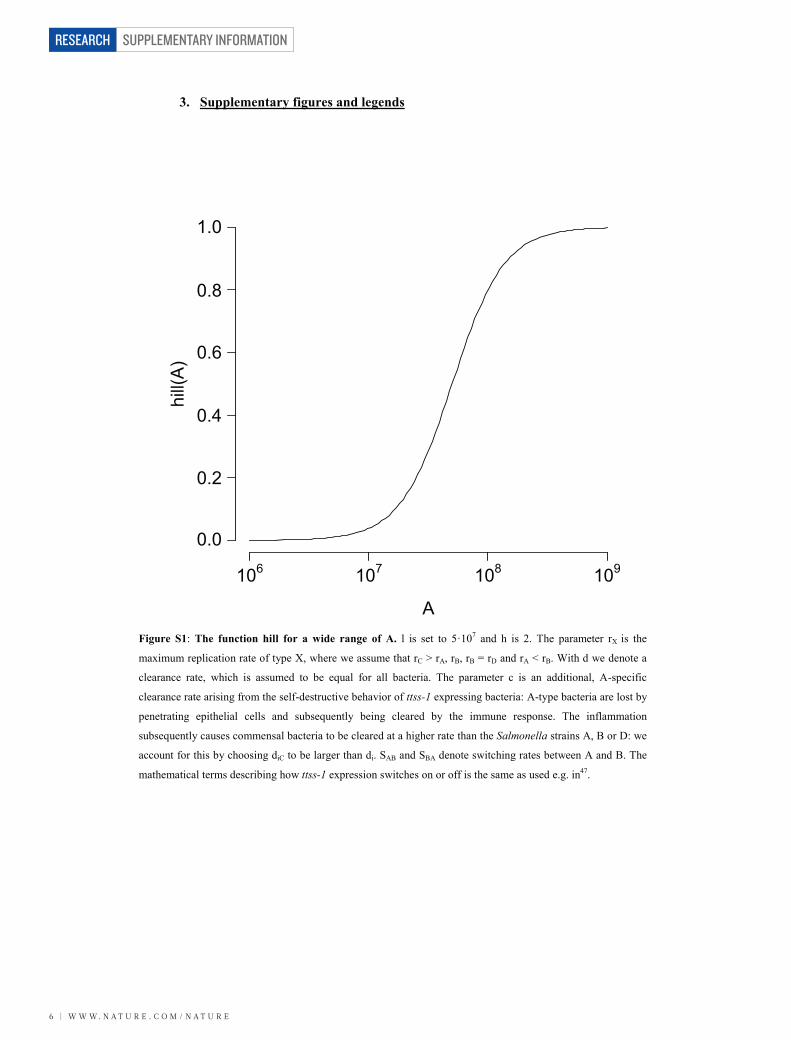
3. Supplementary figures and legends
Figure S1: The function hill for a wide range of A. l is set to 5·107 and h is 2. The parameter rX is the
maximum replication rate of type X, where we assume that rC > rA, rB, rB = rD and rA < rB. With d we denote a
clearance rate, which is assumed to be equal for all bacteria. The parameter c is an additional, A-specific
clearance rate arising from the self-destructive behavior of ttss-1 expressing bacteria: A-type bacteria are lost by
penetrating epithelial cells and subsequently being cleared by the immune response. The inflammation
subsequently causes commensal bacteria to be cleared at a higher rate than the Salmonella strains A, B or D: we
account for this by choosing diC to be larger than di. SAB and SBA denote switching rates between A and B. The
mathematical terms describing how ttss-1 expression switches on or off is the same as used e.g. in47.

W W W. N A T U R E . C O M / N A T U R E | 7
SUPPLEMENTARY INFORMATION RESEARCH
0 100 200 300 400 500
101
102
103
104
105
106
107
108
109
Cec
al p
opul
atio
n si
ze
Time (hours p.i.)
Figure S2: S.Tm strain (63% of T1- cells) vs. commensals. S.Tm outcompetes the commensals. The black line
denotes the total abundance of S.Tm cells. This figure is the same as figure 1a with dashed and dashed-dotted
lines denoting the abundance of A- and B-type bacteria, respectively. The red line shows the abundance of
commensals.

SUPPLEMENTARY INFORMATION
8 | W W W. N A T U R E . C O M / N A T U R E
RESEARCH
0 100 200 300 400
105
106
107
108
109
Cec
al p
opul
atio
n si
ze
Time (hours p.i.)500
Figure S3: Competitive dynamics between S.Tm (63% of T1- cells), commensal and avirulent mutant
bacteria. The black line denotes to the abundance of the S.Tm strain. This figure is identical to figure 1c with
the dashed and dashed-dotted lines denoting A- and B-type bacteria, respectively. The red line shows the
abundance of commensals, the blue line the abundance of the avirulent mutant. For a short time, the avirulent
mutants are the most abundant. Eventually, commensals rise because of waning inflammation.

W W W. N A T U R E . C O M / N A T U R E | 9
SUPPLEMENTARY INFORMATION RESEARCH
0 100 200 300 400 500
105
106
107
108
109
Cec
al p
opul
atio
n si
ze
Time (hours p.i.)
Figure S4: Competitive dynamics between S.Tm (43% of T1- cells) and commensals. The S.Tm strain
(black line) fixates rapidly as the commensals (red line) decrease. The dashed and dashed-dotted lines denote the
abundances of A- and B-type bacteria, respectively.

SUPPLEMENTARY INFORMATION
1 0 | W W W. N A T U R E . C O M / N A T U R E
RESEARCH
0 100 200 300 400 500
105
106
107
108
109
Cec
al p
opul
atio
n si
ze
Time (hours p.i.)
Figure S5. Competitive dynamics between S.Tm (43% of T1- cells), commensals and avirulent mutants. In
the first 200 hours of the dynamics the S.Tm strain (black line) outcompetes the avirulent mutants (blue line).
Then the avirulent mutants take over. After 500 hours the commensals (red line) have recovered and are
expected to extrude the avirulent mutants, analogous to the dynamics described in Figure S3. This figure is the
same as figure 1d with the dashed and dashed-dotted lines denoting A- and B-type bacteria, respectively.
W W W. N A T U R E . C O M / N A T U R E | 1 1
SUPPLEMENTARY INFORMATION RESEARCH
% G
FP-
(Ppr
gH::g
fp)
S.Tm* S.Tm*hilA
S.Tm*hilE
0 102
103
104
105
0 102
103
104
105
S.Tm*hilA(ssaV::aphT)
S.Tm*hilE(ssaV::aphT)
24.0% T1-
65.3% T1-
30.2% T1-
69.5% T1-
98.6% T1-
97.3% T1-
PsicA::gfp (pM972)
PsicA::gfp (pM972)
PsicA::gfp (pM972)
PprgH::gfp (Chromosome)
PprgH::gfp (Chromosome)
PprgH::gfp (Chromosome)
68.1% T1-
63.4% T1-
S.Tm*(ssaV::aphT)
S.Tm*(ssaV::cat)
PsicA::gfp (pM972)
PsicA::gfp (pM972)
Cou
nt
GFP-A (ttss-1 expression level)
a b
c
GFP-A (ttss-1 expression level)
24 hours p.i.
S.Tm*(ssaV::aphT)
T1- T1+
T1- T1+
0
20
40
60
80
100 *
Cou
nt
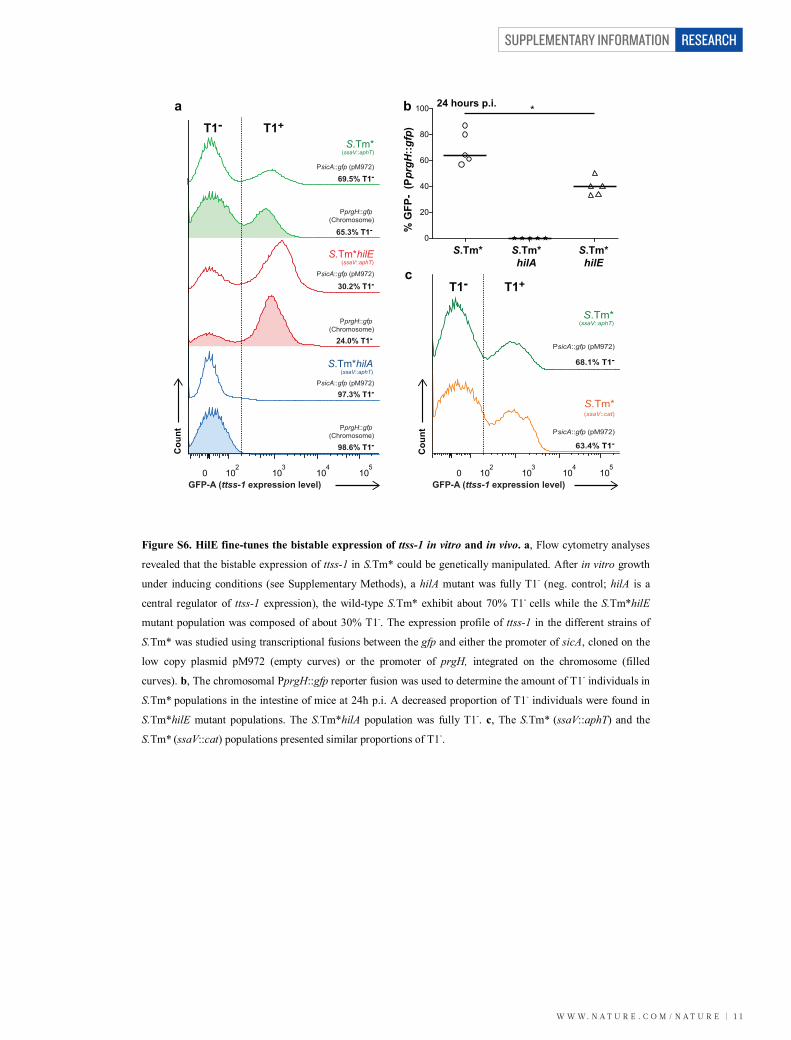
Figure S6. HilE fine-tunes the bistable expression of ttss-1 in vitro and in vivo. a, Flow cytometry analyses
revealed that the bistable expression of ttss-1 in S.Tm* could be genetically manipulated. After in vitro growth
under inducing conditions (see Supplementary Methods), a hilA mutant was fully T1- (neg. control; hilA is a
central regulator of ttss-1 expression), the wild-type S.Tm* exhibit about 70% T1- cells while the S.Tm*hilE
mutant population was composed of about 30% T1-. The expression profile of ttss-1 in the different strains of
S.Tm* was studied using transcriptional fusions between the gfp and either the promoter of sicA, cloned on the
low copy plasmid pM972 (empty curves) or the promoter of prgH, integrated on the chromosome (filled
curves). b, The chromosomal PprgH::gfp reporter fusion was used to determine the amount of T1- individuals in
S.Tm* populations in the intestine of mice at 24h p.i. A decreased proportion of T1- individuals were found in
S.Tm*hilE mutant populations. The S.Tm*hilA population was fully T1-. c, The S.Tm* (ssaV::aphT) and the
S.Tm* (ssaV::cat) populations presented similar proportions of T1-.
SUPPLEMENTARY INFORMATION
1 2 | W W W. N A T U R E . C O M / N A T U R E
RESEARCH
Loss
of p
AM
34(2
0h p
.i.; %
)
*
0.001
0.01
0.1
1
10
100
Lipo
calin
-220
h p.
i. (n
g/m
g of
fece
s)
T1- T1+
a bT1+T1-
FITC-H (prgH::gfp expression level)
c d
0 1020
S.Tm*(gate)
Background
coun
t
Alexa Fluor 700-H (Cy5-LPS staining)
1041030
coun
t
0 102 104103
InflammationRelative growth rate (plasmid loss)
40
60
80
100
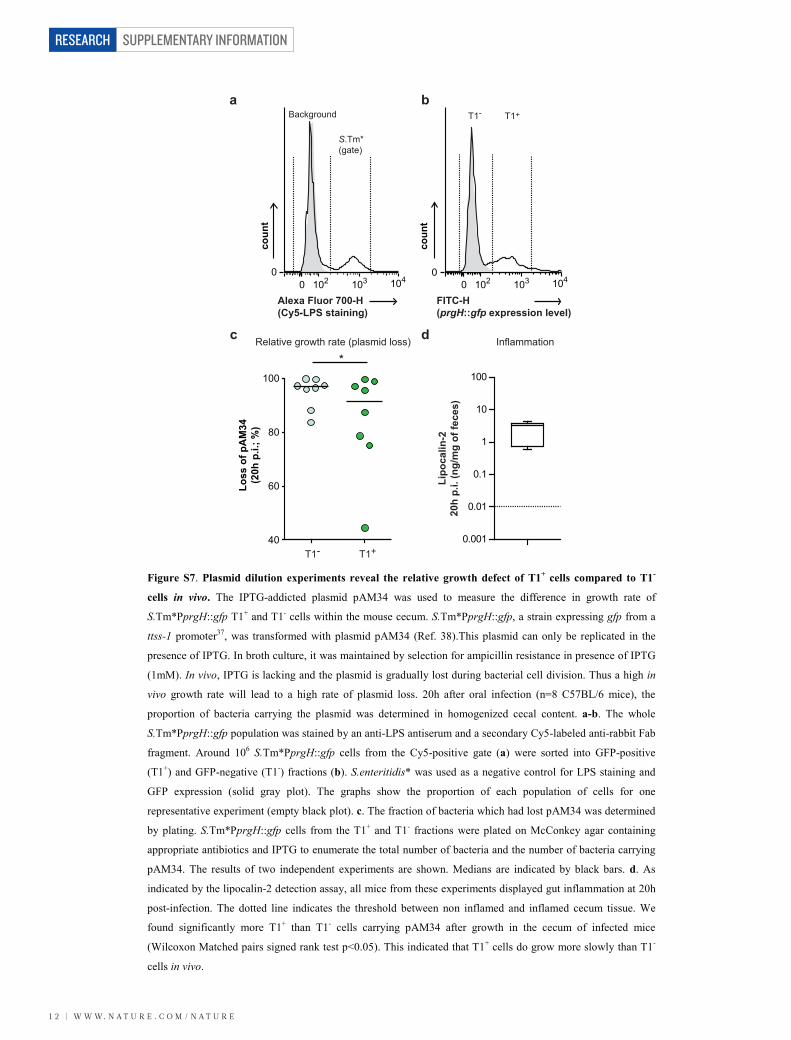
Figure S7. Plasmid dilution experiments reveal the relative growth defect of T1+ cells compared to T1-
cells in vivo. The IPTG-addicted plasmid pAM34 was used to measure the difference in growth rate of
S.Tm*PprgH::gfp T1+ and T1- cells within the mouse cecum. S.Tm*PprgH::gfp, a strain expressing gfp from a
ttss-1 promoter37, was transformed with plasmid pAM34 (Ref. 38).This plasmid can only be replicated in the
presence of IPTG. In broth culture, it was maintained by selection for ampicillin resistance in presence of IPTG
(1mM). In vivo, IPTG is lacking and the plasmid is gradually lost during bacterial cell division. Thus a high in
vivo growth rate will lead to a high rate of plasmid loss. 20h after oral infection (n=8 C57BL/6 mice), the
proportion of bacteria carrying the plasmid was determined in homogenized cecal content. a-b. The whole
S.Tm*PprgH::gfp population was stained by an anti-LPS antiserum and a secondary Cy5-labeled anti-rabbit Fab
fragment. Around 106 S.Tm*PprgH::gfp cells from the Cy5-positive gate (a) were sorted into GFP-positive
(T1+) and GFP-negative (T1-) fractions (b). S.enteritidis* was used as a negative control for LPS staining and
GFP expression (solid gray plot). The graphs show the proportion of each population of cells for one
representative experiment (empty black plot). c. The fraction of bacteria which had lost pAM34 was determined
by plating. S.Tm*PprgH::gfp cells from the T1+ and T1- fractions were plated on McConkey agar containing
appropriate antibiotics and IPTG to enumerate the total number of bacteria and the number of bacteria carrying
pAM34. The results of two independent experiments are shown. Medians are indicated by black bars. d. As
indicated by the lipocalin-2 detection assay, all mice from these experiments displayed gut inflammation at 20h
post-infection. The dotted line indicates the threshold between non inflamed and inflamed cecum tissue. We
found significantly more T1+ than T1- cells carrying pAM34 after growth in the cecum of infected mice
(Wilcoxon Matched pairs signed rank test p<0.05). This indicated that T1+ cells do grow more slowly than T1-
cells in vivo.
W W W. N A T U R E . C O M / N A T U R E | 1 3
SUPPLEMENTARY INFORMATION RESEARCH
0
200
400
600
800
0
2
4
6
8
***
b
c
T1+T1-
T1+T1-
Size
(μm
2 )
ttss-1 expression
ttss-1 expression
d ***
1.0 1.5 2.0 2.5 3.00
10
20
30
GFP content (Log10 a.u.)
Num
ber o
f val
ues
S.Tm* PprgH::gfp
T1+
T1-
Rib
osom
al c
onte
nt(r
ed fl
uore
scen
ce m
ean
inte
nsity
a.u
.)a
0.01 0.1 0.3 0.5 0.7 0.9 0.990
200
400
600
Obs
erve
d G
FP c
onte
nt
(gre
en fl
uore
scen
ce m
ean
inte
nsity
a.u
.)
Theoretical normal values
S.Tm* PprgH::gfpS.Tm* (no reporter)
T1+
T1-
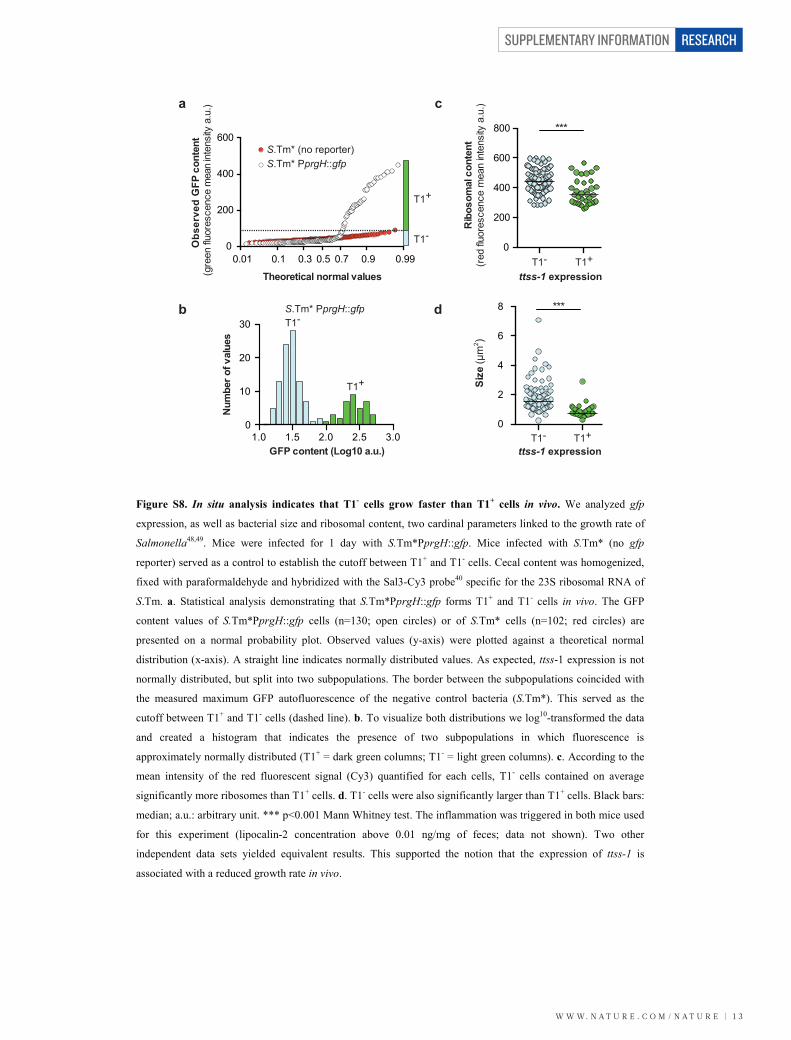
Figure S8. In situ analysis indicates that T1- cells grow faster than T1+ cells in vivo. We analyzed gfp
expression, as well as bacterial size and ribosomal content, two cardinal parameters linked to the growth rate of
Salmonella48,49. Mice were infected for 1 day with S.Tm*PprgH::gfp. Mice infected with S.Tm* (no gfp
reporter) served as a control to establish the cutoff between T1+ and T1- cells. Cecal content was homogenized,
fixed with paraformaldehyde and hybridized with the Sal3-Cy3 probe40 specific for the 23S ribosomal RNA of
S.Tm. a. Statistical analysis demonstrating that S.Tm*PprgH::gfp forms T1+ and T1- cells in vivo. The GFP
content values of S.Tm*PprgH::gfp cells (n=130; open circles) or of S.Tm* cells (n=102; red circles) are
presented on a normal probability plot. Observed values (y-axis) were plotted against a theoretical normal
distribution (x-axis). A straight line indicates normally distributed values. As expected, ttss-1 expression is not
normally distributed, but split into two subpopulations. The border between the subpopulations coincided with
the measured maximum GFP autofluorescence of the negative control bacteria (S.Tm*). This served as the
cutoff between T1+ and T1- cells (dashed line). b. To visualize both distributions we log10-transformed the data
and created a histogram that indicates the presence of two subpopulations in which fluorescence is
approximately normally distributed (T1+ = dark green columns; T1- = light green columns). c. According to the
mean intensity of the red fluorescent signal (Cy3) quantified for each cells, T1- cells contained on average
significantly more ribosomes than T1+ cells. d. T1- cells were also significantly larger than T1+ cells. Black bars:
median; a.u.: arbitrary unit. *** p<0.001 Mann Whitney test. The inflammation was triggered in both mice used
for this experiment (lipocalin-2 concentration above 0.01 ng/mg of feces; data not shown). Two other
independent data sets yielded equivalent results. This supported the notion that the expression of ttss-1 is
associated with a reduced growth rate in vivo.

SUPPLEMENTARY INFORMATION
1 4 | W W W. N A T U R E . C O M / N A T U R E
RESEARCH
S.Tm S.Tm*hilA S.Tm*
S.Tm ttss-1 S.Tm*hilE S.Tm invG
a b
SipCControl
Strain:
c
Day 2 p.i.
Day 10 p.i.
S.Tm*
I037
I030
S.T
m*h
ilD p
hilD
I030
phi
lD
I037
phi
lD
S.T
m*h
ilD
S.T
m*
Figure S9. The wild-type hilD allele restores the expression of ttss-1 in re-isolated clones. a. Control colony-
blot detecting the levels of SipC expression in different strains of S.Tm in a semi-quantitative fashion. The
levels of SipC detected corresponded well with the respective mutations which have well documented effects on
ttss-1 expression. S.Tm ttss-1 carried a complete deletion of SPI-1, S.Tm*hilA carried a deletion of a key
regulator of ttss-1 expression and S.Tm invG a deletion of an essential stuctural component of T1. All three
mutants did not secrete SipC. b, Colony blot performed on clones from feces of a mouse infected by S.Tm* after
2 (left panel) or 10 days (right panel) of within-host evolution. Blue and red arrows indicate SipC+ or SipC-
clones respectively. c, Western-blot analysis of SipC expression by S.Tm*,derivatives and re-isolated clones
verified the data obtained by the colony blot assay. I030 and I037 are re-isolated and re-sequenced hilD mutant
clones (Table S1) which were re-complemented with a hilD expression plasmid (philD) as indicated.

W W W. N A T U R E . C O M / N A T U R E | 1 5
SUPPLEMENTARY INFORMATION RESEARCH
1 2 3 5 10
104
C.I.
S.Tm
* vs.
S.T
m* s
tfC
Day p.i.
10-2
10-1
100
101
102
103
Figure S10. The deletion of stfC does not affect the intestinal fitness of S.Tm*. Competitive infection
experiments performed in streptomycin pretreated mice between S.Tm* and the S.Tm*stfC mutant. The C.I. was
calculated as described in Supplementary Methods and remained constant over 10 days of competition.

SUPPLEMENTARY INFORMATION
1 6 | W W W. N A T U R E . C O M / N A T U R E
RESEARCH
10-1
100
101
102
103
104
C.I.
A v
s. B
a
100
102
104
106
108
1010
Tota
l pop
ulat
ion
size
(C
FUs/
g of
fece
s )
b
d
0.001
0.01
0.1
1
10
100
Lipo
calin
-2(n
g/m
g of
fece
s)
S.Tm*(ssaV::aphT)
S.Tm*(ssaV::cat)
S.Tm*tsr
S.Tm*
Strain A
Strain B
vs. vs. vs.
0
5
10
13
Path
osco
re
c
open symbols: day 3 p.i.grey symbols: day 10 p.i.
**
n.s. n.s.
n.s. n.s.
n.s.
Figure S11. The tsr mutation confers a selective advantage during intestinal infection. Competitive
infection experiments performed in streptomycin pretreated mice between S.Tm* and its isogenic tsr derivative
(the left column shows co-infection between two differently marked S.Tm*, and serves as a control). a, The C.I.
was calculated after day 3 p.i. S.Tm*tsr outcompeted S.Tm*. b, Fecal population sizes at day 3 (open symbols)
and day 10 p.i. (gray symbols). The dashed line indicates the detection limit. c, Intestinal inflammation revealed
by Lipocalin-2 detection by ELISA on feces of streptomycin-pretreated mice infected for 3 (white bars) or 10
days (grey bars). Whiskers: minimum and maximum. d, Intestinal inflammation at day 10 p.i. revealed by
pathological scoring on stained cecal-cross sections. (c, d) Dashed lines delimit the threshold between healthy
and inflamed tissues. n.s. non-significant, ** p<0.01 Mann Whitney test. Medians are indicated by black bars.

W W W. N A T U R E . C O M / N A T U R E | 1 7
SUPPLEMENTARY INFORMATION RESEARCH
100
102
104
106
108
1010
0
5
10
13
0
20
40
60
80
100
0.001
0.01
0.1
1
10
100
Day p.i. 2 10
eDay 2 p.i. Day 10 p.i.
Tota
l pop
ulat
ion
size
(C
FUs/
g of
fece
s )
Lipo
calin
-2(n
g/m
g of
fece
s)Pa
thos
core
Day
10
p.i.
% tt
ss-1
exp
ress
ing
clon
es
a
b
c
d
n.s.
n.s.
*Day p.i. 10
Day p.i. 2 10
Day p.i. 2 10
Figure S12. The tsr mutation does not prevent the emergence of defectors. Within-host evolution of
S.Tm*tsr. a, Fecal shedding of S.Tm*tsr by infected streptomycin pretreated mice. The population size of the
S.Tm*tsr strain was stable, reaching the carrying capacity of 109 bacteria/g of feces for 10 days. The dashed line
indicates the detection limit. The inflammation in infected mice was revealed by measuring the amount of
lipocalin-2 in the feces (b) (whiskers: minimum and maximum) and by microscopic observation of cecal cross-
sections to determine the pathological scores at day 10 p.i. (c). (b, c). Dashed lines delimit the threshold between
healthy and inflamed tissues. d, Proportion of clones expressing ttss-1 in fecal populations. e, Representative
pictures of colony blots showing at day 2 (upper panel) or day 10 p.i. (lower panel) clones expressing or not ttss-
1 from a mouse infected by S.Tm*tsr. Blue and red arrows indicates SipC+ or SipC- clones respectively. n.s.
non-significant, * p<0.05 Mann Whitney test. Medians are indicated by black bars.

SUPPLEMENTARY INFORMATION
1 8 | W W W. N A T U R E . C O M / N A T U R E
RESEARCH
Figure S12. The tsr mutation does not prevent the emergence of defectors. Within-host evolution of
S.Tm*tsr. a, Fecal shedding of S.Tm*tsr by infected streptomycin pretreated mice. The population size of the
S.Tm*tsr strain was stable, reaching the carrying capacity of 109 bacteria/g of feces for 10 days. The dashed line
indicates the detection limit. The inflammation in infected mice was revealed by measuring the amount of
lipocalin-2 in the feces (b) (whiskers: minimum and maximum) and by microscopic observation of cecal cross-
sections to determine the pathological scores at day 10 p.i. (c). (b, c). Dashed lines delimit the threshold between
healthy and inflamed tissues. d, Proportion of clones expressing ttss-1 in fecal populations. e, Representative
pictures of colony blots showing at day 2 (upper panel) or day 10 p.i. (lower panel) clones expressing or not ttss-
1 from a mouse infected by S.Tm*tsr. Blue and red arrows indicates SipC+ or SipC- clones respectively. n.s.
non-significant, * p<0.05 Mann Whitney test. Medians are indicated by black bars.
W W W. N A T U R E . C O M / N A T U R E | 1 9
SUPPLEMENTARY INFORMATION RESEARCH
S.Tm
Day 10 p.i.
hilDStart
3040412
Stop 3041341
3040364I605 (S.Tm)-11 G to A
3040654I610 (S.Tm*)Base deleted
c
e
d
PhilD
S.T
m*
I610
I605
I605
I610
SipC
Control
Strain:
100
102
104
106
108
1010
Popu
latio
n si
ze
(CFU
s/g
of fe
ces)
a
Day p.i. 100
20
40
60
80
100
% tt
ss-1
exp
ress
ing
clon
es
Day p.i. 10
b
S.TmS.Tm*
S.TmS.Tm*
AraC type DNA binding domain
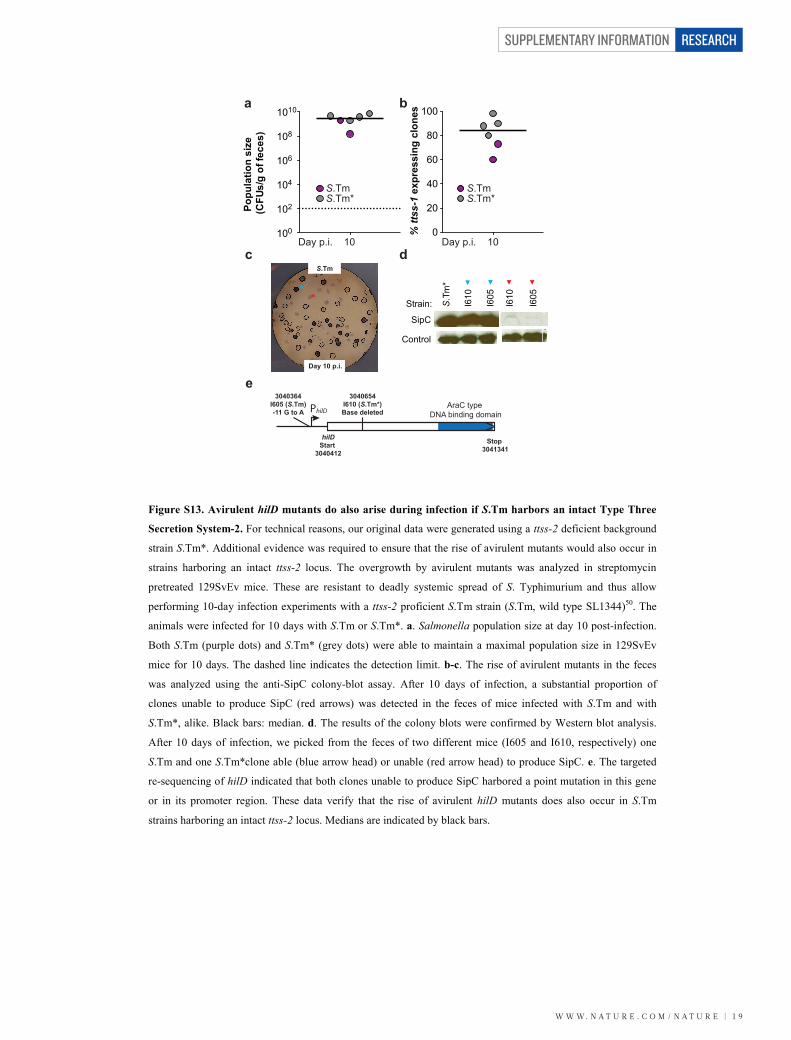
Figure S13. Avirulent hilD mutants do also arise during infection if S.Tm harbors an intact Type Three
Secretion System-2. For technical reasons, our original data were generated using a ttss-2 deficient background
strain S.Tm*. Additional evidence was required to ensure that the rise of avirulent mutants would also occur in
strains harboring an intact ttss-2 locus. The overgrowth by avirulent mutants was analyzed in streptomycin
pretreated 129SvEv mice. These are resistant to deadly systemic spread of S. Typhimurium and thus allow
performing 10-day infection experiments with a ttss-2 proficient S.Tm strain (S.Tm, wild type SL1344)50. The
animals were infected for 10 days with S.Tm or S.Tm*. a. Salmonella population size at day 10 post-infection.
Both S.Tm (purple dots) and S.Tm* (grey dots) were able to maintain a maximal population size in 129SvEv
mice for 10 days. The dashed line indicates the detection limit. b-c. The rise of avirulent mutants in the feces
was analyzed using the anti-SipC colony-blot assay. After 10 days of infection, a substantial proportion of
clones unable to produce SipC (red arrows) was detected in the feces of mice infected with S.Tm and with
S.Tm*, alike. Black bars: median. d. The results of the colony blots were confirmed by Western blot analysis.
After 10 days of infection, we picked from the feces of two different mice (I605 and I610, respectively) one
S.Tm and one S.Tm*clone able (blue arrow head) or unable (red arrow head) to produce SipC. e. The targeted
re-sequencing of hilD indicated that both clones unable to produce SipC harbored a point mutation in this gene
or in its promoter region. These data verify that the rise of avirulent hilD mutants does also occur in S.Tm
strains harboring an intact ttss-2 locus. Medians are indicated by black bars.

SUPPLEMENTARY INFORMATION
2 0 | W W W. N A T U R E . C O M / N A T U R E
RESEARCH
10-1
100
101
102
103
C.I.
(A v
s. B
)D
ay 3
p.i.
Strain A
Strain B
vs.
S.Tm*(ssaV::aphT)
S.Tm*(ssaV::cat)
vs.
S.TmmarT::cat
S.Tmvs.
S.TmhilD::cat
S.Tmvs.
intact ttss-2
S.Tm*hilD(ssaV::aphT)
vs.
S.Tm*(ssaV::cat)
***n.s.
**
Figure S14. Competitive infection experiments show the overgrowth of hilD mutants in both ttss-2
proficient and in ttss-2 deficient strain backgrounds. Mice were co-infected with mixtures of S.Tm (ttss-2
intact; red diamonds) or S.Tm* (black diamonds) and their respective hilD derivatives. The competitive index
calculated after 3 days of infection indicated that S.Tm hilD::cat overgrows S.Tm. Moreover, the growth
advantage of the hilD mutants was evident and of equivalent magnitude no matter whether ttss-2 was intact or
not (The data for the ssaV mutant background was taken from Fig.S19). As negative controls, we performed co-
infections between two differently marked S.Tm* (open black circles; data from Fig.S19) or wild-type S.Tm
strains (open red circles). The marT::cat mutation was chosen as a “silent” antibiotic resistance marker. We had
found that MarT did not affect the gut luminal growth of the pathogen. Black bars: median. In conclusion, these
data show that hilD mutants overgrow the isogenic wild-type strains within 3 days of infection. This was true for
S.Tm* and for S.Tm, alike in two independent experiments. n.s. non-significant, ** p<0.01, *** p<0.001 Mann
Whitney test. Medians are indicated by black bars.

W W W. N A T U R E . C O M / N A T U R E | 2 1
SUPPLEMENTARY INFORMATION RESEARCH
0 102
103
104
105
69.1% T1-
28.3% T1-
98.5% T1-
I030
99.9% T1-
I032
99.6% T1-
H149
99.5% T1-
H150
98.3% T1-
I034
97.9% T1-
I037
98.3% T1-coun
t
GFP-A (ttss-1 expression level)
T1- T1+
PprgH::gfp
S.Tm*(ssaV::aphT)
PprgH::gfp
S.Tm*hilE(ssaV::aphT)
PprgH::gfp
S.Tm*hilD(ssaV::aphT)
PprgH::gfp
PprgH::gfp
PprgH::gfp
PprgH::gfp
PprgH::gfp
PprgH::gfp
Figure S15. Mutations detected in hilD abrogate the expression of ttss-1 in re-isolated clones of S.Tm*. To
analyze the expression of ttss-1 at the single cell level, re-isolated clones of S.Tm* and S.Tm*hilE unable to
express SipC and carrying a mutation in hilD (Figs. 2, S9 and Table S1) were transduced with the
chromosomal reporter cassette PprgH::gfp. This reporter strain allows analyzing whether S.Tm expresses ttss-1
or not. FACS analysis of populations grown in vitro under inducing conditions (see Supplementary Methods)
revealed that all evolved clones are unable to express ttss-1. Control experiments with S.Tm*PprgH::gfp,
S.Tm*hilE PprgH::gfp and S.Tm*hilD PprgH::gfp show the reference levels of ttss-1 expression for the two
ancestral genetic backgrounds and the synthetic avirulent mutant.

SUPPLEMENTARY INFORMATION
2 2 | W W W. N A T U R E . C O M / N A T U R E
RESEARCH
Popu
latio
n si
ze(C
FU/g
of f
eces
)Pa
thos
core
a
b
0
2
4
6
8
10
12
Ancestor Re-isolated(ttss-1 deficient) Ancestor Re-isolated
(ttss-1 deficient)
I034I037
I030I032H150H149
107
108
109
1010 S.Tm*hilE S.Tm*(Day 2 p.i.) (Day 2 p.i.)
** **
Figure S16. Re-isolated ttss-1 deficient mutants are unable to trigger inflammation. a, Population size of
re-isolated (Table S1) and ancestral S.Tm* in the cecum of streptomycin pretreated mice at day 2 p.i. All ttss-1
deficient clones analyzed were able to colonize the intestine of the mice. b, Pathological scores observed in
cecal cross sections from the respective mice at day 2 p.i. Evolved clones unable to express ttss-1 triggered a
drastically reduced gut inflammation. The dashed line delimits the threshold between healthy and inflamed
tissues. Ancestor: Non-evolved ancestral strains of S.Tm*; Re-isolated: Isolated variants unable to express ttss-
1. ** p<0.01 Mann Whitney test. Medians are indicated by black bars.

W W W. N A T U R E . C O M / N A T U R E | 2 3
SUPPLEMENTARY INFORMATION RESEARCH
**
n.s.****
100
102
104
106
108
1010
0.001
0.01
0.1
1
10
100
100
102
104
106
108
1010
open symbols: day 3 p.i.grey symbols: day 10 p.i.
***
S.Tm* S.Tm*hilD S.Tm*hilDvs.
S.Tm*
Popu
latio
n si
ze(C
FUs/
g of
fece
s)Li
poca
lin-2
(ng/
mg
of fe
ces)
To
tal p
opul
atio
n si
ze
(CFU
s/g
of fe
ces
)
a
b
c
** * ***
Figure S17. Avirulent S.Tm*hilD mutants are defectors that exploit host inflammation triggered by
S.Tm* without contributing to it (extended version of Fig. 3). a, Population sizes of S.Tm* (circles) and
S.Tm*hilD (squares) during single (left two data sets) or co-infections (right data set) at day 3 (open symbols) or
day 10 p.i. (filled grey symbols). During co-infections, S.Tm*hilD overgrew S.Tm* (One tailed Wilcoxon
matched pairs signed rank tests p<0.05, dashed lines indicate paired data) and profited from inflammation to
reach a higher population size than alone after day 10 p.i. The dotted line indicates the detection limit. b,
Inflammation revealed by detection of lipocalin-2 in the feces sampled at day 3 (white bars) and day 10 (grey
bars). Dotted lines delimit the threshold between healthy and inflamed tissues. Whiskers: minimum and
maximum. c, The Salmonella population sizes shed by day 10 p.i. declined in mice infected with either
S.Tm*hilD alone or a mixture of S.Tm* and S.Tm*hilD. The dotted line indicates the detection limit. n.s. non-
significant, * p<0.05, ** p<0.01 Mann Whitney test. Medians are indicated by black bars.
SUPPLEMENTARY INFORMATION
2 4 | W W W. N A T U R E . C O M / N A T U R E
RESEARCH
10-1
100
101
102
10 0
10 2
10 4
10 6
10 8
10 10
S.Tm*hilDhilE(ssaV::aphT)
philAvs.
S.Tm*hilE(ssaV::cat)
S.Tm*hilDhilE(ssaV::aphT)
vs.S.Tm*hilE
(ssaV::cat)
S.Tm*hilDhilE(ssaV::aphT)
pBAD24vs.
S.Tm*hilE(ssaV::cat)
Strain A
Strain B
vs.
C.I.
A v
s. B
Day
1 p
.i.
Tota
l pop
ulat
ion
size
Day
1 p
.i.(C
FUs/
g of
fece
s)
a
b
c
Lipo
calin
-2D
ay 1
p.i.
(ng/
mg
of fe
ces)
0.001
0.01
0.1
1
10
100
**n.s.
**n.s.
95.1+/-4.116.5+/-10.7
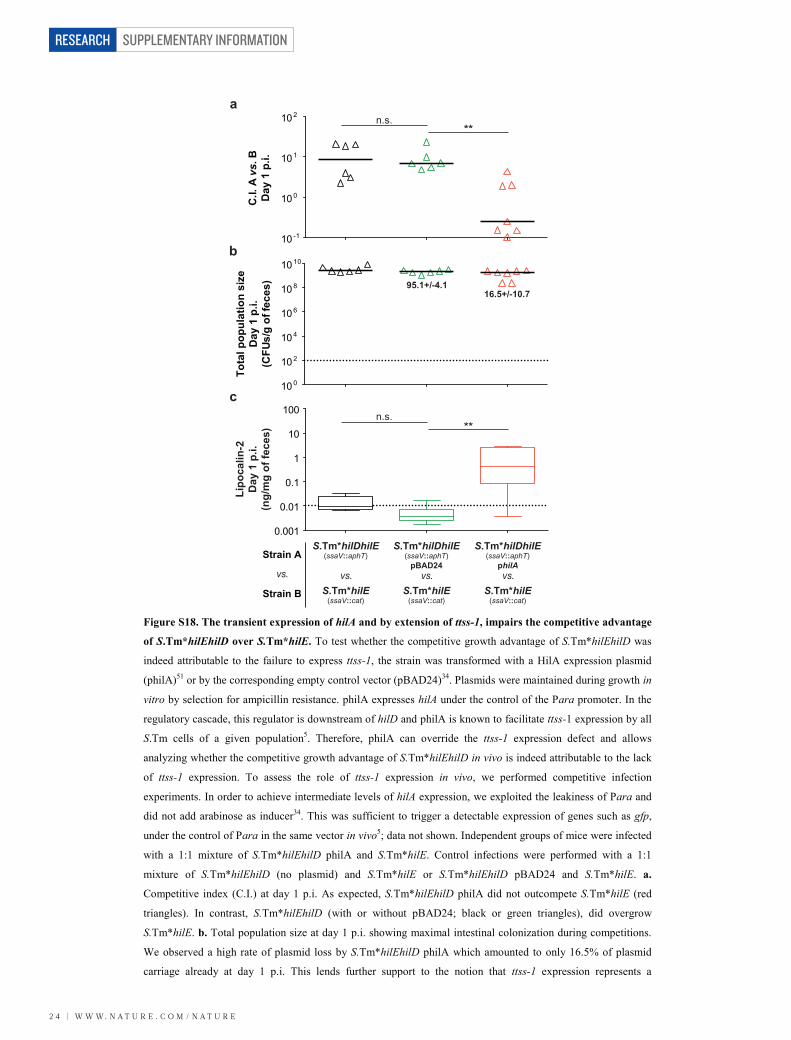
Figure S18. The transient expression of hilA and by extension of ttss-1, impairs the competitive advantage
of S.Tm*hilEhilD over S.Tm*hilE. To test whether the competitive growth advantage of S.Tm*hilEhilD was
indeed attributable to the failure to express ttss-1, the strain was transformed with a HilA expression plasmid
(philA)51 or by the corresponding empty control vector (pBAD24)34. Plasmids were maintained during growth in
vitro by selection for ampicillin resistance. philA expresses hilA under the control of the Para promoter. In the
regulatory cascade, this regulator is downstream of hilD and philA is known to facilitate ttss-1 expression by all
S.Tm cells of a given population5. Therefore, philA can override the ttss-1 expression defect and allows
analyzing whether the competitive growth advantage of S.Tm*hilEhilD in vivo is indeed attributable to the lack
of ttss-1 expression. To assess the role of ttss-1 expression in vivo, we performed competitive infection
experiments. In order to achieve intermediate levels of hilA expression, we exploited the leakiness of Para and
did not add arabinose as inducer34. This was sufficient to trigger a detectable expression of genes such as gfp,
under the control of Para in the same vector in vivo5; data not shown. Independent groups of mice were infected
with a 1:1 mixture of S.Tm*hilEhilD philA and S.Tm*hilE. Control infections were performed with a 1:1
mixture of S.Tm*hilEhilD (no plasmid) and S.Tm*hilE or S.Tm*hilEhilD pBAD24 and S.Tm*hilE. a.
Competitive index (C.I.) at day 1 p.i. As expected, S.Tm*hilEhilD philA did not outcompete S.Tm*hilE (red
triangles). In contrast, S.Tm*hilEhilD (with or without pBAD24; black or green triangles), did overgrow
S.Tm*hilE. b. Total population size at day 1 p.i. showing maximal intestinal colonization during competitions.
We observed a high rate of plasmid loss by S.Tm*hilEhilD philA which amounted to only 16.5% of plasmid
carriage already at day 1 p.i. This lends further support to the notion that ttss-1 expression represents a
significant growth burden to the bacterial cell. On the other hand, pBAD24 remained relatively stable (the
percentages of plasmid carriage are indicated under brackets). c. Intestinal inflammation was revealed by
analyzing the lipocalin-2 levels in the feces. In the presence of S.Tm*hilDhilE philA we observed significantly
higher levels of inflammation than in the control. This is in accordance with the presence of increased numbers
of cells expressing ttss-1, at least during the initial phase of the infection. The dashed line delimits the threshold
between healthy and inflamed tissues. In conclusion, these data indicate that the growth advantage of
S.Tm*hilEhilD is indeed attributable to its inability to express ttss-1. n.s. non-significant, ** p<0.01 Mann
Whitney test. Medians are indicated by black bars.

W W W. N A T U R E . C O M / N A T U R E | 2 5
SUPPLEMENTARY INFORMATION RESEARCH
Figure S18. The transient expression of hilA and by extension of ttss-1, impairs the competitive advantage
of S.Tm*hilEhilD over S.Tm*hilE. To test whether the competitive growth advantage of S.Tm*hilEhilD was
indeed attributable to the failure to express ttss-1, the strain was transformed with a HilA expression plasmid
(philA)51 or by the corresponding empty control vector (pBAD24)34. Plasmids were maintained during growth in
vitro by selection for ampicillin resistance. philA expresses hilA under the control of the Para promoter. In the
regulatory cascade, this regulator is downstream of hilD and philA is known to facilitate ttss-1 expression by all
S.Tm cells of a given population5. Therefore, philA can override the ttss-1 expression defect and allows
analyzing whether the competitive growth advantage of S.Tm*hilEhilD in vivo is indeed attributable to the lack
of ttss-1 expression. To assess the role of ttss-1 expression in vivo, we performed competitive infection
experiments. In order to achieve intermediate levels of hilA expression, we exploited the leakiness of Para and
did not add arabinose as inducer34. This was sufficient to trigger a detectable expression of genes such as gfp,
under the control of Para in the same vector in vivo5; data not shown. Independent groups of mice were infected
with a 1:1 mixture of S.Tm*hilEhilD philA and S.Tm*hilE. Control infections were performed with a 1:1
mixture of S.Tm*hilEhilD (no plasmid) and S.Tm*hilE or S.Tm*hilEhilD pBAD24 and S.Tm*hilE. a.
Competitive index (C.I.) at day 1 p.i. As expected, S.Tm*hilEhilD philA did not outcompete S.Tm*hilE (red
triangles). In contrast, S.Tm*hilEhilD (with or without pBAD24; black or green triangles), did overgrow
S.Tm*hilE. b. Total population size at day 1 p.i. showing maximal intestinal colonization during competitions.
We observed a high rate of plasmid loss by S.Tm*hilEhilD philA which amounted to only 16.5% of plasmid
carriage already at day 1 p.i. This lends further support to the notion that ttss-1 expression represents a
significant growth burden to the bacterial cell. On the other hand, pBAD24 remained relatively stable (the
percentages of plasmid carriage are indicated under brackets). c. Intestinal inflammation was revealed by
analyzing the lipocalin-2 levels in the feces. In the presence of S.Tm*hilDhilE philA we observed significantly
higher levels of inflammation than in the control. This is in accordance with the presence of increased numbers
of cells expressing ttss-1, at least during the initial phase of the infection. The dashed line delimits the threshold
between healthy and inflamed tissues. In conclusion, these data indicate that the growth advantage of
S.Tm*hilEhilD is indeed attributable to its inability to express ttss-1. n.s. non-significant, ** p<0.01 Mann
Whitney test. Medians are indicated by black bars.
SUPPLEMENTARY INFORMATION
2 6 | W W W. N A T U R E . C O M / N A T U R E
RESEARCH
10-1
100
101
102
103
100
102
104
106
108
1010
0.001
0.01
0.1
1
10
100
Strain A
Strain B
S.Tm*hilD S.Tm*hilEhilD
S.Tm* S.Tm*hilD
S.Tm*(ssaV::aphT)
S.Tm*(ssaV::cat)
vs. vs. vs.vs.
open symbols: day 3 p.i.grey symbols: day 10 p.i.
a
b
c
C.I.
A v
s. B
Tota
l pop
ulat
ion
size
(CFU
/g o
f fec
es)
Lipo
calin
-2(n
g/m
g of
fece
s)
** **
***n.s.
***
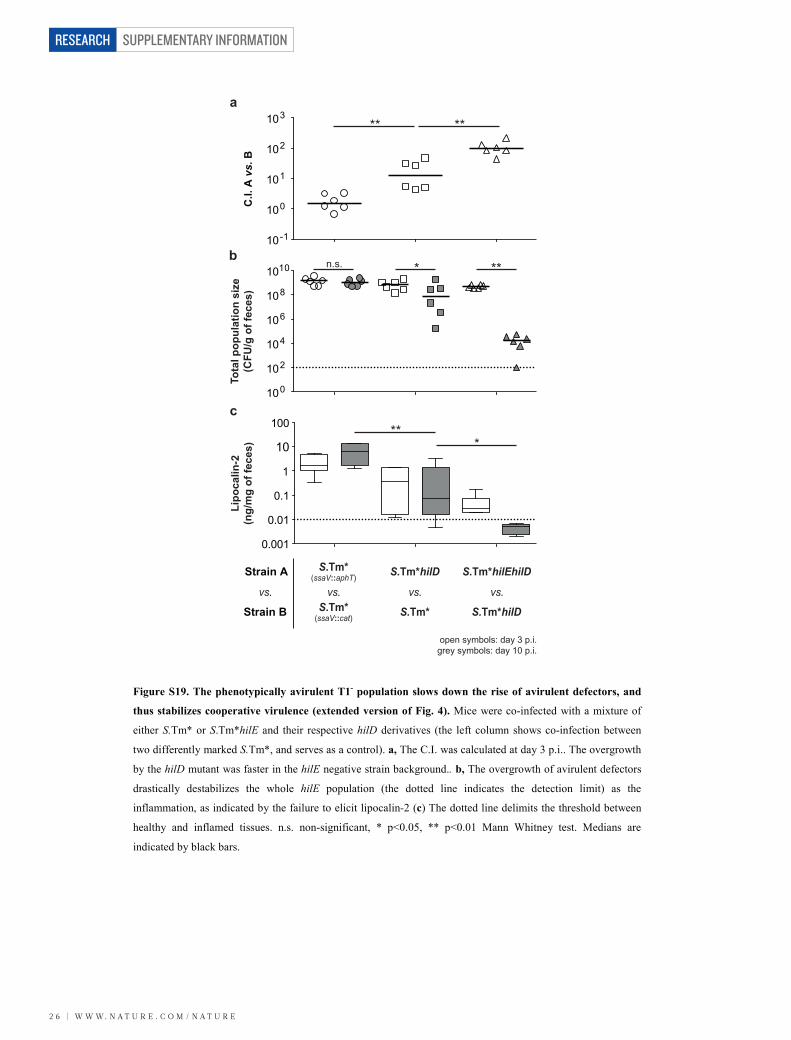
Figure S19. The phenotypically avirulent T1- population slows down the rise of avirulent defectors, and
thus stabilizes cooperative virulence (extended version of Fig. 4). Mice were co-infected with a mixture of
either S.Tm* or S.Tm*hilE and their respective hilD derivatives (the left column shows co-infection between
two differently marked S.Tm*, and serves as a control). a, The C.I. was calculated at day 3 p.i.. The overgrowth
by the hilD mutant was faster in the hilE negative strain background.. b, The overgrowth of avirulent defectors
drastically destabilizes the whole hilE population (the dotted line indicates the detection limit) as the
inflammation, as indicated by the failure to elicit lipocalin-2 (c) The dotted line delimits the threshold between
healthy and inflamed tissues. n.s. non-significant, * p<0.05, ** p<0.01 Mann Whitney test. Medians are
indicated by black bars.

W W W. N A T U R E . C O M / N A T U R E | 2 7
SUPPLEMENTARY INFORMATION RESEARCH
0.001
0.01
0.1
1
10
100
100
102
104
106
108
1010
5% DSS
S.Tm
*hilE
hilD
(CFU
/g o
f fec
es)
a
bLi
poca
lin-2
(ng/
mg
of fe
ces)
**
***
untreated
open symbols: day 1 p.i.closed symbols: day 6 p.i.
Figure S20. DSS-induced colitis rescues S.Tm*hilDhilE from commensal overgrowth. Our data suggested
that it was the failure of S.Tm*hilEhilD to trigger inflammation which finally allowed the re-growth of the
commensals and led to the decline of the total S.Tm population in the host’s intestine. In order to verify this, we
artificially triggered gut inflammation. This should restore the ability of S.Tm*hilEhilD to maintain a high
population density in the host’s intestine for extended periods of time. To test this hypothesis, we treated mice
with 5% DSS in the drinking water, a well-established procedure eliciting pronounced gut inflammation43. The
DSS-treated mice (and a non-treated control group) were subsequently infected with S.Tm*hilEhilD and we
analyzed gut inflammation (the dotted line delimits the threshold between healthy and inflamed tissues) (a) and
fecal shedding of S.Tm*hilEhilD (the dotted line indicates the detection limit) (b). As expected, the DSS treated
mice (but not the controls) displayed pronounced gut inflammation and high intestinal population densities were
maintained until the end of the experiment (day 6 p.i.). In the non-treated control group, the intestinal
S.Tm*hilEhilD population plummeted by day 6 p.i.. These data further support that it was the failure of
S.Tm*hilEhilD to trigger inflammation which finally allowed the re-growth of the microbiota, as observed in
Figure 4. ** p<0.01, *** p<0.001 Mann Whitney test. Medians are indicated by black bars.

SUPPLEMENTARY INFORMATION
2 8 | W W W. N A T U R E . C O M / N A T U R E
RESEARCH
4. Supplementary references
44 Weening, E. H. et al. The Salmonella enterica serotype Typhimurium lpf, bcf, stb, stc, std, and sthfimbrial operons are required for intestinal persistence in mice. Infect. Immun. 73, 3358-3366, (2005).
45 Rebbapragada, A. et al. The Aer protein and the serine chemoreceptor Tsr independently sense intracellular energy levels and transduce oxygen, redox, and energy signals for Escherichia colibehavior. Proc. Natl. Acad. Sci. U S A 94, 10541-10546, (1997).
46 Stecher, B. et al. Motility allows S. Typhimurium to benefit from the mucosal defence. Cell Microbiol10, 1166-1180, (2008).
47 Balaban, N. Q., Merrin, J., Chait, R., Kowalik, L. & Leibler, S. Bacterial persistence as a phenotypic switch. Science 305, 1622-1625, (2004).
48 Schaechter, M., Maaloe, O. & Kjeldgaard, N. O. Dependency on medium and temperature of cell size and chemical composition during balanced grown of Salmonella typhimurium. J. Gen. Microbiol. 19,592-606, (1958).
49 Ruimy, R., Breittmayer, V., Boivin, V. & Christen, R. Assessment of the state of activity of individualbacterial cells by hybridization with a ribosomal RNA targeted fluorescently labelled oligonucleotidic probe. FEMS microbiology ecology 15, 207-213, (1994).
50 Stecher, B. et al. Chronic Salmonella enterica serovar Typhimurium-induced colitis and cholangitis instreptomycin-pretreated Nramp1+/+ mice. Infect. Immun. 74, 5047-5057, (2006).
51 Lostroh, C. P., Bajaj, V. & Lee, C. A. The cis requirements for transcriptional activation by HilA, a virulence determinant encoded on SPI-1. Mol. Microbiol. 37, 300-315, (2000).