supplementary figures - nature · supplementary figures ... power factor comparison for hf, zr, ti...
TRANSCRIPT
Supplementary Figures
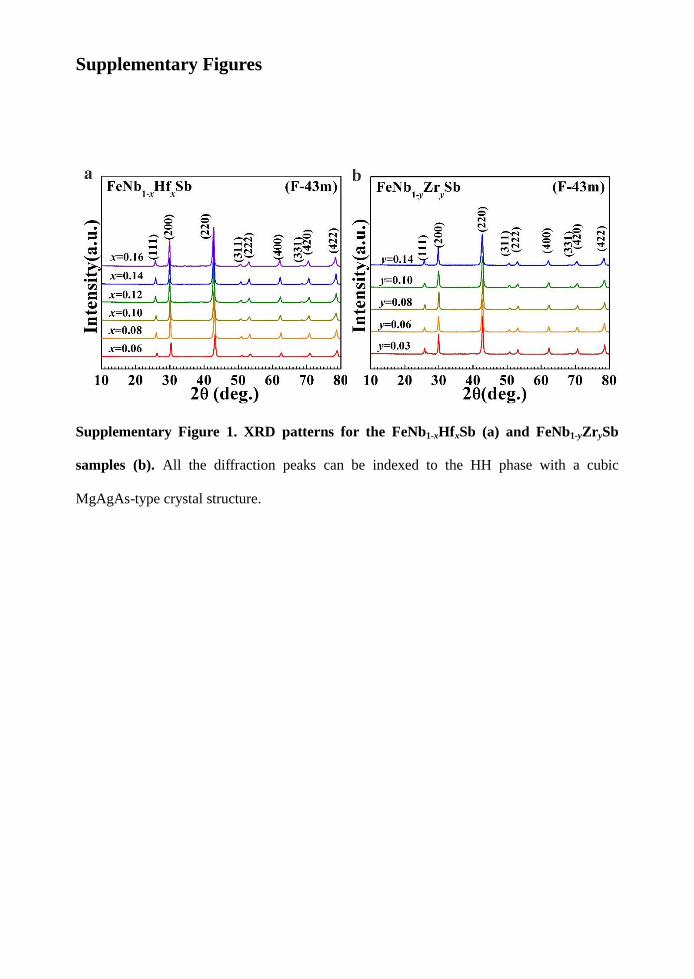
Supplementary Figure 1. XRD patterns for the FeNb1-xHfxSb (a) and FeNb1-yZrySb
samples (b). All the diffraction peaks can be indexed to the HH phase with a cubic
MgAgAs-type crystal structure.

Supplementary Figure 2. Thermoelectric properties of the n-type half-Heusler compound,
which was used for assembling the half-Heusler module.
Supplementary Figure 3. Hall carrier concentration of FeNb1-xHfxSb and FeNb1-yZrySb
samples as a function of temperature. The almost temperature independent of carrier
concentration indicates a heavily doped semiconductor character in these samples.

Supplementary Figure 4. a, Room carrier concentration versus doping content for FeNbSb,
ZrNiSn1 and ZrCoSb
2 HH compounds. The lines were calculated assuming that each doping
atom supplies exactly one carrier. b, Power factor comparison for Hf, Zr, Ti doped FeNbSb
samples under the similar carrier concentration of ~2×10²¹
cm-3
(purple ellipse in a). As
shown in a, Hf doping in FeNbSb is more efficient to supply carriers compared with that of
Zr/Ti dopants, but the carrier concentrations of all the doped FeNbSb samples are smaller
than the calculated values. Similar phenomenon is also found for Sn doped ZrCoSb HH
system2. However, for n-type ZrNiSn HH compound, Sb dopant is highly efficient to
provides electrons1. Therefore, for HH compounds, in order to optimize their electrical
properties, the doping efficacy of dopants should be carefully considered.

Supplementary Figure 5. Lattice parameter of FeNb1-xHfxSb and FeNb1-yZrySb as a
function of dopant content.
Supplementary Figure 6. SEM (a), EDX mapping (b) and TEM (c) images of sample
FeNb0.88Hf0.12Sb.

Supplementary Figure 7. Temperature dependences of thermal diffusive D (a) and specific
heat Cp (b) for FeNb1-xHfxSb and FeNb1-yZrySb samples. The dash lines in (b) represent the
Dulong-Petit estimation.
Supplementary Figure 8. The repeatability of measurement of FeNb0.88Hf0.12Sb sample
in Zhejiang University, (ZJU) and Shanghai Institute of Ceramics, Chinese Academy
of Science, (SICCAS). a, electrical conductivity σ. b, Seebeck coefficient α. c, Thermal
conductivity κ. d, zT values. The highest measurement temperature is limited by the used
equipments.

Supplementary Figure 9. Thermogravimetric analysis indicates the FeNb0.86Hf0.14Sb
compound keep stable when heating in the Ar atmosphere, while slight weight gain is found
when heating in the air atmosphere above 1000K, which may result from the surface
oxidation.
Supplementary Figure 10. The sketch map of radiation losses (a) and convection losses (b)
in TE module.

Supplementary Figure 11. Temperature distribution in TE module (a) and TE materials (b)
when contact resistance taken into account.
Supplementary Figure 12. Calculated TE module output properties when TH and TC are
respectively 718 oC and 63
oC with contact resistance taken into account.

Supplementary Tables
Supplementary Table 1. Comparison of different TE modules based on half-Heusler (HH),
Heusler and skutterudites compounds.
Materials Module size
(mm3)
ΔT
(K)
Pmax
(W)
Powder density
(W/cm2)
ZrNiSn/FeNbSb-based HH compounds
(this work) 20×20×10 655 8.9 2.2
ZrNiSn/ZrCoSb-based HH compounds3 16×16×3 527 2.8 1.1
Ti0.33Zr0.33Hf0.33NiSn unileg4
4 times
2×2×4 565 0.044 0.275
Fe2VAl-based Heusler compounds5 35×35×4.2 280 2.5 0.2
Skutterudites-based compounds6 50×50×7 460 11.5 0.46
Supplementary Table 2. The nominal composition and EPMA composition for FeNb1-
xHfxSb and FeNb1-yZrySb samples.
Nominal composition EPMA composition
FeNb0.94Hf0.06Sb Fe1.01Nb0.93Hf0.06Sb
FeNb0.92Hf 0.08Sb Fe1.02Nb0.91Hf0.08Sb0.99
FeNb0.9Hf 0.1Sb Fe1.01Nb0.9Hf0.09Sb
FeNb0.88Hf 0.12Sb Fe1.01Nb0.88Hf0.11Sb
FeNb0.86Hf 0.14Sb Fe1.02Nb0.85Hf0.14Sb0.99
FeNb0.84Hf0.16Sb Fe1.02Nb0.84Hf0.15Sb0.99
FeNb0.97Zr0.03Sb Fe1.01Nb0.97Zr0.03Sb0.99
FeNb0.94Zr0.06Sb Fe1.02Nb0.95Zr0.05Sb0.98
FeNb0.92Zr0.08Sb Fe1.01Nb0.92Zr0.07Sb
FeNb0.9Zr0.1Sb Fe1.01Nb0.9Zr0.1Sb0.99
FeNb0.86Zr0.14Sb Fe1.02Nb0.86Zr0.14Sb0.98

Supplementary Discussion
Error analysis for the discrepancy of the theoretical conversion efficiency and
the experimentally determined value
The conversion efficiency of a TE module can be calculated by using the equation
(1).
1 1
1 /
H C
H C H
T T ZT
T ZT T T
(1)
where TH, TC, ZT are hot-side temperature, cold-side temperature and dimensionless
of figure merit of the TE materials, respectively.
The TE module was measured using the commercial PEM-2 system. The efficiency
can be calculated using equation (2), where the Pout and Qout are the output power of
the TE module and the heat flow out of the TE module, respectively.
out
out out
P
P Q
(2)
2 3( )out
T T AQ
L
(3)
The heat flow out of the TE module Qout can be calculated from equation (3), where
is ,A are the thermal diffusivity of the heat sink (made of high purity copper) and
the area of the heat sink (which is closed to the area of the TE module). T2 and T3 are
the temperatures of the two different points in the middle of the heat sink. L is the
distance between T2 and T3.
Based on the measured TE materials properties, the ANSYS software is used to
simulate the temperature distribution, I-V curve, output power, and conversion

efficiency of the TE module, so that we can estimate the contribution of different
effects to the reduced measured efficiency, as described below.
The HH modules in the manuscript are not filled with thermal isolation. Furthermore,
the measurements are carried out under vacuum with little amount of Ar. When the
module was set up in a high temperature and a large temperature difference between
hot side and cold side, the convection and the radiation will take heat from the
module hot side to the module cold side (See Supplementary Fig. 10). In practice,
the measured heat flows Qout include the heat from the TE module, the convection
heat, and the radiation heat from the hot side to the cold side. In this case, the
measured heat flow will higher than that of the TE module, resulting in the
underestimated efficiency. Based on the equation (4), ΦH,C ≈ 7.77 / (1/εH + 1/εC - 1),
where ε= εC = 0.8. The radiation loss ΦH,C is about 5.18 W, corresponding to the
total heat flow of 134 W. Therefore, the contribution of radiation loss to reduced
efficiency is negligible, only ~0.2% underestimated efficiency. Meanwhile, the
simulated convection heat loss is about 37 W, which is higher than that of radiation
loss, and contributes to ~2.2% underestimation of efficiency.
4 4
,
( )
1/ 1/ 1
b H CH C
H C
A T T
(4)
In addition, Supplementary Fig. 11 shows the temperature distribution in the TE
module when the module hot side temperature (TH) and the module cold side
temperature (TC) are set at 718 oC and 63
oC, respectively. If the electrical and
thermal contact resistances are not taken into account, the temperature difference in
the TE materials is close to that of the TE module. The calculated theoretical

maximum output power and maximum conversion efficiency are 17.8 W and 11.3 %,
respectively.
In practice, there are contact electrical and thermal resistances at the interfaces
between electrode and TE materials, isolate substrate and electrode, and module and
heat sink. Based on the measured contact conductivity of 20 cm2, the calculated
temperature distribution of TE materials is shown in Supplementary Fig. 11b.
Actually, the contact electrical and thermal resistance will cause a reduced
temperature difference across the TE materials. The real hot side temperature and the
cold side temperature of the TE materials are about 616.7 oC
and 129.3
oC,
respectively. The actually temperature difference in TE material is only about 487.4
oC and it is much lower than that of ideal case (655
oC). Therefore, the contact
electrical and thermal resistance will cause a dramatically fall of output power and
conversion efficiency. The calculated maximum output power and conversion
efficiency are 8.9 W and 8.1 %, respectively. (See Supplementary Fig. 12),
significantly lower than the ideal case of 11.3 %. Therefore, based on the simulation
results, the maximum possible contribution to the reduced conversion efficiency is
poor contact properties in the TE module.
In summary, the reduced value between theoretical and experimental efficiency is
due to the radiation loss, convection loss and contact resistance. The contact and
convection heat loss play key roles in the reduction of the measured efficiency.
Further improvement in contact and using thermal isolation in the module will
significantly increase the conversion efficiency.

Supplementary References
1. Xie, H. H. et al. The intrinsic disorder related alloy scattering in ZrNiSn half-Heusler
thermoelectric materials. Sci. Rep. 4, 6888 (2014).
2. Sekimoto, T., Kurosaki, K., Muta, H. & Yamanaka, S. High-thermoelectric figure of merit
realized in p-type half-Heusler compounds: ZrCoSnxSb1-x. Jpn. J. Appl. Phys. 46, L673-
L675 (2007).
3. Populoh, S., Brunko, O. C., Galazka, K., Xie, W. & Weidenkaff, A. Materials 6, 1326-
1332 (2013).
4. Bartholomé, K. et al. Thermoelectric modules based on half-Heusler materials produced
in large quantities. J. Electron. Mater. 43, 1775-1781 (2014).
5. Mikami, M., Kobayashi, K. & Tanaka, S. Power generation performance of
thermoelectric module consisting of Sb-doped Heusler Fe2VAl sintered alloy. Mater.
Trans. 52, 1546-1548 (2011).
6. Salvador, J. R. et al. Conversion efficiency of skutterudite-based thermoelectric modules.
Phys. Chem. Chem. Phys. 16, 12510-12520 (2014).