supplementary figures - nature · 8 supplementary figure 3 the reducing end of the aa13 products is...
TRANSCRIPT

2
Supplementary Figures

3
Supplementary Figure 1. Unrooted circular phylogram showing the distinction between the
various families of LPMOs. Bootstrap values are indicated for the two internal nodes separating
the families. The two enzymes studied here are shown as An and Ao for the A.
nidulans (GenBank accession: EAA62623) and the A. oryzae (GenBank accession
BAE61982.1) AA13 enzymes, respectively. AA9 enzymes are shown in blue, AA11 in red,
AA10 in purple and AA13 in green for those that are appended to a CBM20 module and in black
for those made only of an AA13 module.
4
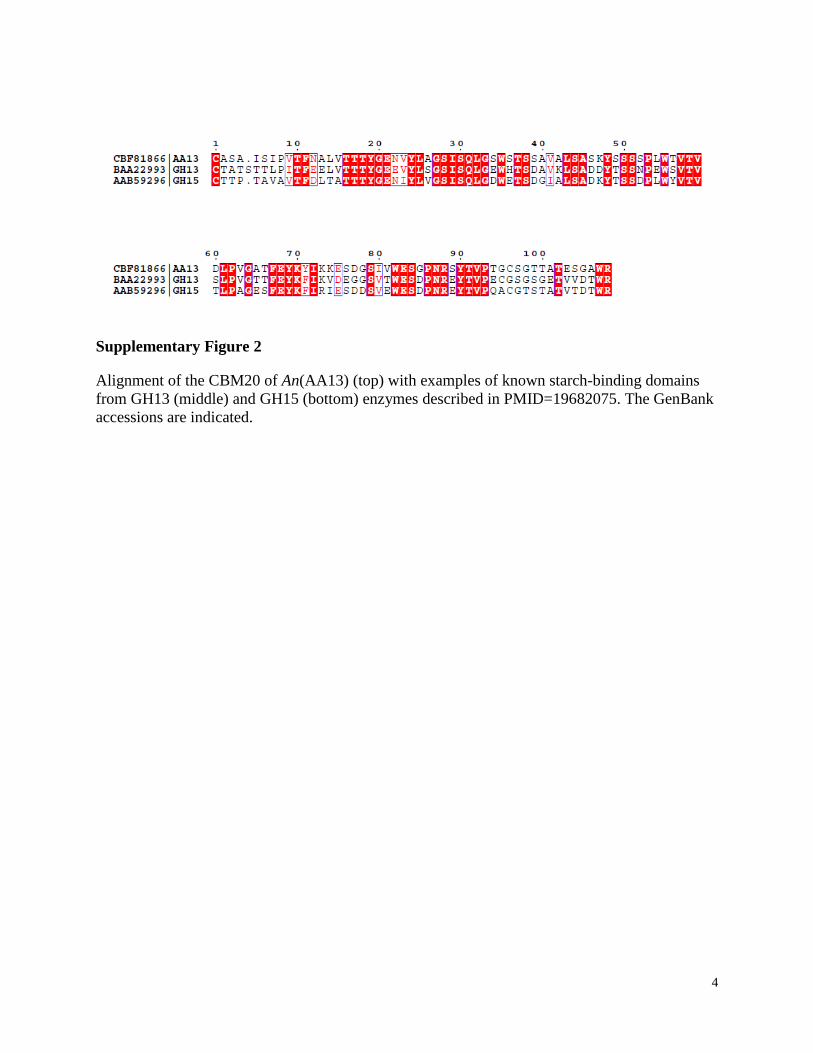
Supplementary Figure 2
Alignment of the CBM20 of An(AA13) (top) with examples of known starch-binding domains
from GH13 (middle) and GH15 (bottom) enzymes described in PMID=19682075. The GenBank
accessions are indicated.

5
3a)

6
3b)

7
3c)
8
Supplementary Figure 3
The reducing end of the AA13 products is oxidised to gluconic acid. a,b) MALDI-ToF/ToF-
MS/MS of per-methylated oligosaccharides. Chemical diagrams show the origin of the observed
fragmentation ions. A fragmentation spectrum of a maltohexaose standard is shown in a). The
fragmentation spectrum of the DP6 product of An(AA13) with L-cysteine on retrograded starch
is shown in b). The series of 1,5
X and Y ions of the An(AA13) product species are 30 Da larger
than those of maltohexaose. Since these ions comprise the reducing end of the oligosaccharide,
this confirms that the reducing end is modified. Two independent experiments. c) overleaf
twice. HPAEC showing generation of gluconic acid by the action of An(AA13) on retrograded
starch. Ethanol soluble products of An(AA13) with cysteine and retrograded starch were
hydrolysed by TFA and analysed by HPAEC-PAD. The Gluconic acid:Glc molar ratio is the
mean ± SEM. n=4 independent experiments.

9
Supplementary Figure 4
PACE gel showing maltose released from retrograded starch over 4 h at 25 °C by action of β-
amylase and as boosted by An(AA13) in the presence of various reducing co-factors (4 mM). β-
amylase stimulation is approximately four-fold higher with Cys compared to Asc as reducing
cofactors and twice as high compared to when pyrogallol is used as a co-factor. Under the same
conditions the use of cysteine releases 36.8 nmol of maltose, corresponding to 2.5 mol% of
available starch. Accordingly, absolute release of maltose with the individual reducing agents
can be estimated as follows: GSH, glutathione (10 nmol); DTT, dithiothreitol (10 nmol); Asc,
ascorbate (10 nmol); NR, no reductant; FC, ferrocyanide (< 5 nmol); PG, pyrogallol (20 nmol).
+/-, with and without An(AA13); Cys, cysteine; GSH, glutathione; DTT, dithiothreitol; Asc,
ascorbate; NR, no reductant; FC, ferrocyanide; PG, pyrogallol.
10
a) b)
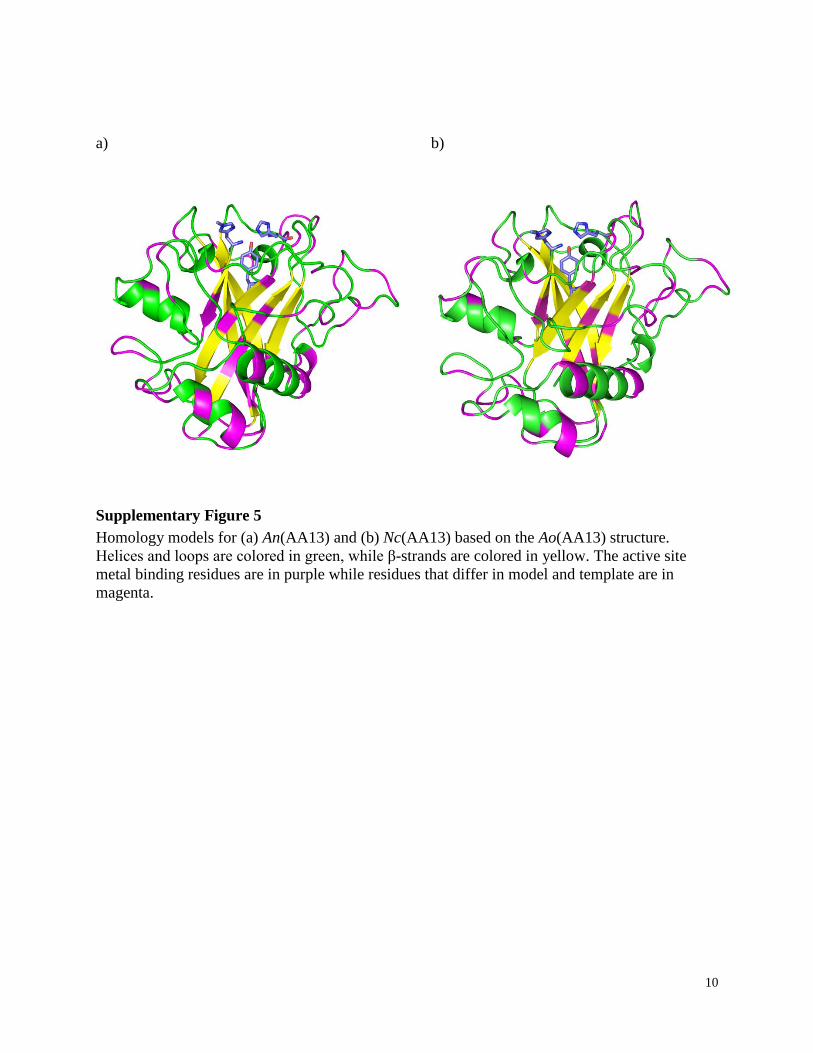
Supplementary Figure 5
Homology models for (a) An(AA13) and (b) Nc(AA13) based on the Ao(AA13) structure.
Helices and loops are colored in green, while β-strands are colored in yellow. The active site
metal binding residues are in purple while residues that differ in model and template are in
magenta.

11
a) b) c)
d) An_AA13 HGYLTVPASRTRLGFEAGIDTCPECSILEPVSAWPDLTAAQVGRSGPCGYNARVSVDYNQ 60
Nc_AA13 HGYLTIPFSRTRLGAEAGLDTCPECSILEPVTAWPNVTEAKVGRSGPCGYNARVSIDYNQ 60
Ao_AA13 HGYMYIPSSRTRLGHEAGIDSCPECAILEPVSSWPDLDAAPVGRSGPCGYNARDSIDYNQ 60
***: :* ****** ***:*:****:*****::**:: * ************ *:****
β1 α1 α2
An_AA13 PGDYWGNEPVVSYTAGDVVEVQWCVDHNGDHGGMFTYGICQNQTLVDLFLTPGYLPTNEE 120
Nc_AA13 PATNWGNSPVVTYTAGDTVDVQWCVDHNGDHGGMFSYRICQDQELVNKFLTPGYLPTEAE 120
Ao_AA13 PTTNWGSDAVQSYSPGEEIEVQWCVDHNGDHGGMFTYRICQDQSIVDKFLDPSYLPTNDE 120
* **...* :*:.*: ::***************:* ***:* :*: ** *.****: *
β2 β3 α3 α4
An_AA13 KQAAEDCFLEGELSCLHVPGQTCNYNPDCSAGEPCYQNDWFTCNAFQADNNRACQGVDGA 180
Nc_AA13 KQAAEDCFEKGTLPCTDVNGQSCDFSPDCQQGQACWRNDWFTCNAFQADSRRGCQGVDNA 180
Ao_AA13 KQAAEDCFDAGLLPCTDVSGQECGYSADCTEGEACWRNDWFTCNGFEASDRPKCQGVDNA 180
******** * *.* .* ** *.:..** *:.*::*******.*:*... *****.*
α4 α5 α6
An_AA13 ALNSCMTTIAGGYTVTKKIKIPDYSSSHTLLRFRWNSFQTAQVYLHCADIAIV------- 233
Nc_AA13 ALGSCFTTIAGGYTVTKKIKIPNYISGHTLLSFRWNSFQTAQVYLSCADIAIV------- 233
Ao_AA13 ELNSCYTSIAGGYTVTKKVKLPEYTSNHTLISFKWNSFQTGQIYLSCADIAIQ------- 233
*.** *:**********:*:*:* *.***: *:******.*:** ******
β4 β5 β6
Supplementary Figure 6 Structural elements contributing to AA13 putative substrate binding
groove. a) Colored version of surface groove across the active site, showing the distinct regions
contributing to it: N-terminus, end of α2 and following residues (1, 25-31) is shown in cyan; part
of the loop region preceding β2 (42-45 and 49-55) in blue; loop between β2 and β3 (85-92) in
red; part of the long loop region between β3 and β4 including α6 (166-176) in orange; loop
region immediately preceding β4 and beginning of β4 (178-180, 189, 193) in yellow; loop
region between β5 and β6 (219-224) in magenta. The N-methylated histidine of the active site is
indicated (Me-His1). b) and c) show the same view of the surface groove, but with the groove
region highlighted in cyan and residues differing between An(AA13) and Ao(AA13) (b) or
Nc(AA13) and Ao(AA13) (c) in magenta. Differences are localized at the periphery of the

12
substrate binding groove. d) overleaf. Sequence alignment of catalytic domains of An(AA13) and
Nc(AA13) with Ao(AA13) (ClustalX). Identical residues in the three sequences are indicated by
asterisks below the alignment. Regions contributing to the putative substrate binding groove are
colored as in a). Secondary structure elements as observed in the structure of Ao(AA13) are
shown below the alignment.

13
7a)
β1 α1 α2
AoAA13 1 HGYMYIP......SSRTRLGHEAG...................IDSCPEC 3ZUD_AA9 1 HGFVQNIVIDGKNYGGYLVNQYPY....MSNP..PEVIAWSTTA...TDL 4MAI_AA11 1 HMMMAQP..............................VPYGKDT...LNN 2YOY_AA10 1 HGYIKEP......VSRAYMGALEKQTMGWTAAAQK.....YGSVIDNPQS
AoAA13 26 AILEPVSSWPDLDAAPVGRSGPCGYNA...RDSIDYNQ....PTTNWGSD 3ZUD_AA9 42 GFVDG.........TGYQTPDIICHRG.........AKP...G.....AL 4MAI_AA11 18 SPLAA.........DG...SDFPCKLRSN.......TYQ...V.....TE 2YOY_AA10 40 VEGPK.....GFPAAGPPDGRIASANGGSGQIDFGLDKQTADH.....WV
β2 β3 α3
AoAA13 69 AVQSYSPGEEIEVQWCVDHNG.DHGGMFTYRICQDQSIV.DKFLDPSYLP 3ZUD_AA9 66 TAPVSP..GGTVELQWTPW.PDSHHGPVINYLAPCNGDCSTVD....... 4MAI_AA11 41 ENTAAI..GQSMPLSFIGS.AVHGGGSCQVSLTTD......RE....... 2YOY_AA10 80 KQNIRG..GFNTFTWHYTA.P.HATSKWHYYITKKNWNP.NKP.......
α4 α5
AoAA13 117 TNDEKQAA.EDCFDAGLLPCTDVSGQECGYSADCTEGEACWRNDWFT... 3ZUD_AA9 106 ......KT.QLEF..FKIA.........................ESGLIN 4MAI_AA11 75 ......PTKDSKW..IVIK.........................SIE... 2YOY_AA10 118 ......LS.RDEF..ELIG.........................TVN...
α6
AoAA13 163 .......CNGFEASDRPKCQG...............VDNAELNSCYTSIA 3ZUD_AA9 122 DDNPPGIWAS......DNLIA...............AN............ 4MAI_AA11 89 .........G......GCPANVDGNLSGGPTSTGASK............. 2YOY_AA10 131 .......HDG......SKADT...............N.............
β4 β5 β6
AoAA13 191 GGYTVTKKVKLPE.YTSNHTLISFKWNSFQT......GQIYLSCADIAIQ 3ZUD_AA9 139 ....NSWTVTIPTTIAPGNYVLRHEIIALHSAQNQDGAQNYPQCINLQVT 4MAI_AA11 111 ......FTYTIPEGIEPGKYTLAWTWFNRIG.....NREMYMNCAPLTVT 2YOY_AA10 140 ....LTHKIFVPT.DRSGYHIILGVWDVADT......SNAFYNVIDVNLT
AoAA13
3ZUD_AA9 185 GGGSDNPAGTLGTALYHDTDPGILINIYQKLSSYIIPGPPLYTG 4MAI_AA11 150 GSSSKRDEVPKEKTVEKRSANFPPMFVANVNGCTTKEGVDIRFPNPGSIV 2YOY_AA10
AoAA13
3ZUD_AA9
4MAI_AA11 200 EYAGDKSNLAAEGSQAC 2YOY_AA10

14
7b)
Supplementary Figure 7
Overall structural comparison of LPMO families a) Structure-based sequence alignment
(STRAP) of the same enzymes, with strands indicated in yellow and helices in orange. Residues
around the catalytic copper are in red font. b) Stereo view of overall overlay of representatives
of AA9, AA10, AA11 and AA13. For clarity, all strands are represented in yellow for all
structures. Ao(AA13) is colored with helices in red and loop regions in green. AA9 (PDB code
3zud) is in cyan, AA10 (PDB code 2yoy) is in dark grey and AA11 (PDB code 4mai) is in
magenta. The active site copper is shown as an orange sphere. The figure clearly shows, that
beyond the core β-structure, conservation of loops and additional secondary structure elements is
low across these AA families.

15
Supplementary Figure 8
‘Unique’ β3-α3-α4 region in AA13, a) Cartoon representation of Ao(AA13) with marked β3-α3-
α4 region. The copper ion is shown as an orange sphere. The equivalent region (in grey) of
AA10 (PDB 2yoy) is also shown, representing the other LPMO families for which structures are
known. None of the other structures (AA9-AA11) has comparably extended α-regions. b) The
equivalent regions of AA9 (PDB 3zud), AA10 (PDB 2yoy), AA11 (PDB 4mai) are
superimposed and shown in cyan, grey, and magenta, respectively, showing high structural
similarity.

16
Supplementary figure 9.
Stereoviews of the substrate binding grooves of a Bacillus GH13 amylase (PDB code 1wpc, in
yellow) and representatives of families AA10 from Bacillus amyloliquefaciens (PDB code 2yoy,
in orange) and AA11 from Aspergillus oryzae (4mai, in purple). The terminal histidine is shown
in blue, copper ion shown in light orange.

17
Supplementary Figure 10
a) Stereoview of putative electron transfer pathway from active site tyrosine (Y224) to distal
surface-exposed cysteine, generated from Ao(AA13) structure. All residues are fully conserved
in AA13 sequences save for the occasional substitution of a phenylalanine for a tyrosine, or
tryptophan for phenylalanine or lysine. Minimum aromatic C…C or aromatic C…S distances
between each adjacent pairs: Y224…W215 3.45, W215…W83 3.39, W83…F95 3.38,
F95…F161 3.71, F161…C135 3.48 Å b) overall structure of Ao(AA13) showing placement of
putative electron transfer pathway.

18
Supplementary Figure 11
ITC thermograms of copper binding. Thermograms for a) An(AA13) and b) Ao(AA13) showing
tight binding of copper to both enzymes as observed for other LPMOs.

19
Field/G Field/G
Supplementary Figure 12
X band EPR spectra (frequency ~9.3 GHz, black experiment, red simulation) at 155 K of a)
Cu(II)-An(AA13) at pH 5, 10% v/v glycerol. Cu(II)-Ao(AA13) has identical simulation
parameters. b) Cu(II)-An(AA13) at pH 8.5 with 100 equivalents of azide, 10% v/v glycerol.

20
Supplementary Figure 13.
SDS-PAGE gel of An(AA13) and Ao(AA13), lane 1 molecular weight markers, lane 2
An(AA13), lane 3 Ao(AA13).

21
Supplementary Tables
Supplementary Table 1. Table of RMSDs (in Å) between all atoms of active site residues of
AA13 and other LPMO containing families.
AA9 2VTC
(32 atoms)
H1-H89-Y176
3EJA
(32 atoms)
H1-H68-Y153
3ZUD
(33 atoms)
H1-H86-Y175
4EIR
(33 atoms)
H1-H84-Y168
4EIS
(33 atoms)
H1-H82-Y171
4B5Q
(32 atoms)
H1-H76-Y160
Ao(AA13)
(33 atoms)
H1-H91-
Y224
32 atoms
0.96
32 atoms
1.04
33 atoms
0.73
33 atoms
1.05
33 atoms
1.04
32 atoms
0.53
AA10 2BEM
(31 atoms)
H28-H114-
F187
4ALS
(31 atoms)
H29-
H114-
F185
3UAM
(31 atoms)
H19-
H122-
F205
2YOY
(31
atoms)
H28-
H125-
F196
2XWX
(31
atoms)
H24-
H121-
F193
4OY6
(32 atoms)
H43-H150-
Y219
4OY7
(31 atoms)
H35-H144-
F219
4GBO
(32 atoms)
H37-H144-
Y213
Ao(AA13)
(33 atoms)
H1-H91-
Y224
31 atoms
0.58
31 atoms
0.52
31 atoms
1.72
31 atoms
0.53
31 atoms
1.01
32 atoms
0.87
31 atoms
0.61
32 atoms
1.09
AA11 4MAI
(32 atoms)
H1-H60-Y140
Ao(AA13)
(33 atoms)
H1-H91-
Y224
32 atoms
0.60

22
Supplementary Table 2. EPR spin Hamiltonian parameters for Cu-An(AA13)
Sample gx gy gz Ax
Ay Az Strains
Cu-An(AA13) pH 5 Line widths 0.6, 0.5
2.0473 2.0767 2.259 27 G (77.78 MHz) N shf, 37, 38, 38, 36, 37, 36 MHz
33 G (97.6 MHz)
162 G (513 MHz)
A/G 100, 130, 10 g 0.008, 0.009, 0.025
Cu-An(AA13) pH 8 + excess azide Line widths 0.6, 0.5
2.038 2.075 2.235 15.7 G (45 MHz) N shf 36, 38 38, 35 35, 35
24.1 G (70 MHz)
172.5 (540 MHz)
A/G 40, 160 20 g 0.008 0.006 0.02
Supplementary Table 3. Known spin Hamiltonian parameters for LPMOs with CAZy
classification
CAZy classification (substrate)
gx gy gz Az /G Deviation from axial type 2
Source
met-Cu-AA9 T. aurantiacus (cellulose)
2.06
2.06
2.27
153
None
Ref1
met-Cu-AA10 B. amyloliquefaciens (chitin)
2.05
2.08
2.23
125
reduced Az value some rhombicity in gx,y
Ref2
met-Cu-AA11 A. oryzae (chitin)
2.04
2.10
2.28
157
rhombicity in gx,y,
Ref3
met-Cu-AA13 A. nidulans (starch)
2.05 2.08 2.26 162 some rhombicity in gx,y resolution of nitrogen SHF

23
Supplementary Discussion
Structural features and comparison with other LPMO families
The structure of Ao(AA13) consists of six β-strands (β1-β6), arranged as two anti-parallel β-
sheets (formed by strands β1-β2-β4 and β3-β5-β6) forming an immunoglobulin-like β-sandwich
domain, with the β-strands intercalated by loops occasionally containing helical stretches. The
AA13 structure lacks one of the core -strands, between β3 and β4 in the current numbering,
found in the other three LPMO families (AA9, AA10 and AA11), which is instead replaced by a
unique motif composed by two helices and a long loop region (Supplementary Fig. 7 and
Supplementary Fig. 8). This motif starts with β3, which is relatively short compared to the
equivalent β-strand of AA9/AA10/AA11, leading to two α-helices separated by a short loop (α3-
α4).
The Ao(AA13) structure was structurally aligned with available AA9, AA10 and AA11
structures. For AA9 family members (PDB codes 3ZUD, 3EJA, 2VTC, 4EIR, 4EIS, 4B5Q) 114-
134 residues could be structurally aligned to Ao(AA12) with Cα rmsd between 2.5 -3.0 Å and
sequence identity between 10.4% and 16.7%. For AA11 (PDB code 4MAI) 123 residues could
be aligned with Cα 2.0 Å rmsd and 13.8% sequence identity. The overall structural similarities
with family AA10 are slightly higher. For AA10 family members (PDB codes 4ALS, 3UAM,
2YOY, 2XWX, 2BEM) 137-150 residues could be aligned with Cα rmsd between 2.2 -2.3 Å and
sequence identity between 13.1% and 17.3%.
Substrate binding surface
A shallow groove runs across the active site. Supplementary Fig. 6 shows in more detail which
part of the groove is contributed by which region. These regions are also color coded on a
sequence alignment of Ao(AA13), An(AA13) and Nc(AA13). This groove is shallower than
those often observed for α-amylases but deeper than any surface contour seen in the known
structures of AA9, AA10 and AA11 LPMOs (see stereoviews in figure 5 and Supplementary
figure 9), leading us to speculate that AA13 LPMOs can bind effectively glucan chains partly
embedded in crystalline/amorphous regions. Simple docking models (not shown) indicate that a
single glucan chain is spatially accommodated within the surface groove of Ao(AA13), although
given the complexity of the surface of retrograded starch such modelling cannot account for the
wide range of possible surface profiles that will be present on the substrate.

24
References
1 Quinlan, R. J. et al. Insights into the oxidative degradation of cellulose by a copper
metalloenzyme that exploits biomass components. Proceedings of the National Academy
of Sciences 108, 15079-15084 (2011).
2 Glyn R. Hemsworth, E. J. T., Robbert Q. Kim, Rebecca C. Gregory, Sally J. Lewis,
Johan P. Turkenburg, Alison J. Parkin, Gideon J. Davies and Paul H. Walton. The copper
active site of CBM33 polysaccharide oxygenases. J Am Chem Soc 135, 6069-6077
(2013).
3 Hemsworth, G. R., Henrissat, B., Davies, G. J. & Walton, P. H. Discovery of a new
family of lytic polysaccharide mono-oxygenases. Nature Chemical Biology 10, 122-126
(2014).