supplementary detailed report
TRANSCRIPT

The University of Queensland Surat Deep Aquifer
Appraisal Project (UQ-SDAAP)
Scoping study for material carbon abatement via
carbon capture and storage
Supplementary Detailed Report
Flow modelling of the managed aquifer recharge areas
30 April 2019

UQ-SDAAP | Flow Modelling of the managed aquifer recharge areas 2
Authors
Dr Mohammad Sedaghat, The University of Queensland
Dr Julie Pearce, The University of Queensland
Prof Jim Underschultz, The University of Queensland
Dr Phil Hayes, The University of Queensland
Acknowledgements
This working document was prepared for The University of Queensland Surat Deep Aquifer Appraisal Project (UQ-SDAAP),
a 3-year, $5.5 million project funded by the Australian Government through the Carbon Capture and Storage Research Development
and Demonstration (CCS RD&D) programme, by Coal 21, and The University of Queensland.
Citation
Sedaghat M, Pearce J, Underschultz J & Hayes P (2019), Flow modelling of the managed aquifer recharge areas, The University of
Queensland Surat Deep Aquifer Appraisal Project – Supplementary Detailed Report, The University of Queensland.
Referenced throughout the UQ-SDAAP reports as Sedaghat et al. 2019.
Publication details
Published by The University of Queensland © 2019 all rights reserved. This work is copyright. Apart from any use as permitted under
the Copyright Act 1968, no part may be reproduced by any process without prior written permission from The University of Queensland.
ISBN: 978-1-74272-256-6
Disclaimer
The information, opinions and views expressed in this document do not necessarily represent those of The University of Queensland, the Australian Government or Coal 21. Researchers within or working with the UQ-SDAAP are bound by the same policies and procedures as other researchers within The University of Queensland, which are designed to ensure the integrity of research. The Australian Code for the Responsible Conduct of Research outlines expectations and responsibilities of researchers to further ensure independent and rigorous investigations.

UQ-SDAAP | Flow Modelling of the managed aquifer recharge areas 3
Contents
1. Executive summary........................................................................................................................... 5
2. Introduction ....................................................................................................................................... 6
3. MAR sector static reservoir modelling ........................................................................................... 6
3.1 Model structure .................................................................................................................................... 7
3.2 Property modelling .............................................................................................................................. 8
4. Petrophysics versus MAR inversion derived permeability......................................................... 10
5. Model initialisation .......................................................................................................................... 10
5.1 Distribution of permeability ................................................................................................................ 11
5.2 Pressure response prediction ........................................................................................................... 12
5.3 Sensitivities and modifications .......................................................................................................... 14
6. References ....................................................................................................................................... 19
Tables
Table 1 A list of the permeability maps considered for the MAR sector dynamic model sensitivity analysis. ...................................................................................................................................... 14
Figures
Figure 1 Map of the Surat Basin showing the location of the Managed Aquifer Recharge (MAR) sector model area. ................................................................................................................................... 7
Figure 2 (A) 192 wells within the MAR area. (B) Faults used in the MAR static model, derived from the SEES Faults and Fractures Project. ............................................................................................. 8
Figure 3 Comparison of stratigraphic nomenclature, zones, lithology, wireline log signature, stratal stacking patterns, and seismic stratigraphy that form the basis of the UQ-SDAAP project framework...................................................................................................................................... 8
Figure 4 (A) Reservoir flow unit designation for the model of the MAR sector area. (B) Net-to-Gross model for the MAR sector area. (C) Arithmetic mean of permeability for the MAR sector area. (D) Harmonic mean of permeability for the MAR sector area. ...................................................... 9
Figure 5 (A) Porosity (B) Net-to-gross distributions for MAR sector area. ................................................ 10
Figure 6 Water injection rate into the MAR sector model (MAR area) for Reedy Creek and Spring Gully combined. .................................................................................................................................... 11
Figure 7 MAR sector permeability distributions provided by (A) petrophysical analysis and (B) groundwater model inversion of MAR observation well data. ..................................................... 12
Figure 8 MAR Sector dynamic model pressure increase due to MAR injection at Reedy Creek and Spring Gully. ........................................................................................................................................... 13
Figure 9 The distribution of the pressure increase (dp) due to MAR injection in MAR sector area. (A) based on petrophysical analysis permeability distribution and (B) based on groundwater model inversion permeability distribution. .............................................................................................. 14
Figure 10 Permeability modifications in the MAR sector area sensitivity analysis: (A) increasing the permeability determined by petrophysics moderately in Spring Gully, Reedy Creek, Charlie, Charlotte, Woleebee Creek; (B) increasing the permeability significantly in Spring Gully, however decreasing it moderately in the Reedy Creek, Charlie, Charlotte, Woleebee Creek areas; (C) sealing the modelled faults in the upper Spring Gully and southern Condabri areas;

UQ-SDAAP | Flow Modelling of the managed aquifer recharge areas 4
and (D) modifying the permeability of the groundwater model inversion by using more data as input. ............................................................................................................................................ 15
Figure 11 Sensitivity analysis results: pressure increase due to MAR injection in the MAR sector area. .. 16
Figure 12 Sensitivity analysis: the distribution of the pressure increase (dp) due to MAR injection in the MAR sector area. ........................................................................................................................ 18

UQ-SDAAP | Flow Modelling of the managed aquifer recharge areas 5
1. Executive summary
Managed Aquifer Recharge (MAR) was investigated as it could provide The project (UQ-SDAAP) a
significant dynamic data set that could be used to history match dynamic simulation. A static reservoir model
was required to simulate fluid flow in the MAR sector.
A permeability map for the MAR Sector could be determined by either analysing well data where log
permeability was derived from the porosity versus permeability regression calibrated to core plug measured
values, or from a groundwater model inversion based on the MAR history match.
Having determined two separate permeability maps, water injection was performed for each model and the
fluid pressure was monitored across the model. Initial and boundary conditions were identical for all models
and simulations.
Having obtained an idea about the local trends of the change in fluid pressure across the model, permeability
was updated regionally in order to match the pressure prediction with the pressure data (history match). Of
the four permeability maps, three were derived from the map obtained by petrophysical analysis and the
other came from the groundwater model inversion by using additional input data.
In general, the updated groundwater model inversion gave the best prediction of pressure. A notable
exception was in the Condabri area, where predictions of the pressure at the well “Contabri-Well-ING2-P”
were poor.
UQ-SDAAP | Flow Modelling of the managed aquifer recharge areas 6
2. Introduction
The northern ‘depositional centre’ of the Blocky Sandstone Reservoir (BSR) was one of the first regions for
which a geological model was defined (see La Croix et al. 2019a, 2019b, 2019c). This area was the best
constrained by core, well logs, and seismic data compared to areas to the south. It also was the location of a
coal seam gas industry, managed aquifer recharge (MAR) activity, which provided UQ-SDAAP a significant
dynamic data set that could be used to history match dynamic simulation. As a result, MAR sector model
simulations were the first to be performed in UQ-SDAAP’s overall workflow. Note that at the time these
simulations were performed, concepts of two different BSR depositional centres were still forming (ibid).
In order to simulate fluid flow in the MAR sector, a static reservoir model was required. Having characterised
the model, we then proceeded to the dynamic flow model and simulated different scenarios. This report
starts with discussing the preparation of the static flow model. Different sources of permeability are then
used for initialisation and single phase flow is simulated under different scenarios in order to match the field
data (history match) across the MAR sector model.
3. MAR sector static reservoir modelling
Regional-scale static reservoir models are the framework upon which simulations of fluid flow behavior in
CO2 storage applications are based. A regional-scale static model was built as part of UQ-SDAAP to improve
understanding of the large-scale flow and pressure transmission characteristics of the northern portion of the
Surat Basin due to CO2 injection.
The major data inputs necessary to constrain static reservoir modelling include:
• A stratigraphic framework
• The distribution of facies and/or lithology
• A determination of reservoir properties such as porosity and permeability
• A structural framework describing faults and fractures
These components are essential for understanding the distribution of flow units, as well as their vertical and
lateral connectivity relationships. However, data tends to be clustered, and there are commonly large
distances between individual wells or groups of wells. This has resulted in a large degree of uncertainty in
tracing geological units from location to location across the basin, as well as uncertainty in the most
appropriate rock properties (porosity and permeability) to assign grid cells of the model.
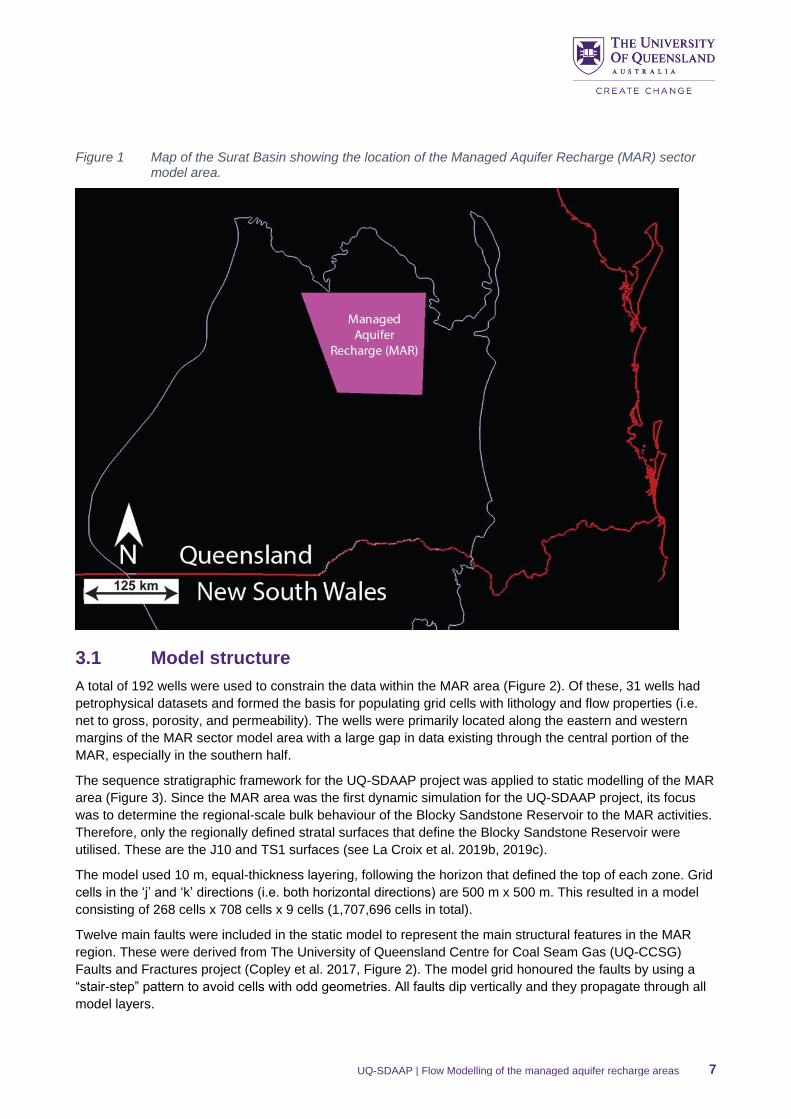
The main strategy employed to mitigate uncertainty was to characterise regions with better data constraints
and then to use these findings to trace the stratigraphy, facies / lithology, and reservoir properties across the
MAR area (Figure 1). The MAR sector area was selected to include the large region where monitoring wells
completed in the Precipice Sandstone have shown a pressure response to the MAR injection activities.
UQ-SDAAP | Flow Modelling of the managed aquifer recharge areas 7
Figure 1 Map of the Surat Basin showing the location of the Managed Aquifer Recharge (MAR) sector model area.
3.1 Model structure
A total of 192 wells were used to constrain the data within the MAR area (Figure 2). Of these, 31 wells had
petrophysical datasets and formed the basis for populating grid cells with lithology and flow properties (i.e.
net to gross, porosity, and permeability). The wells were primarily located along the eastern and western
margins of the MAR sector model area with a large gap in data existing through the central portion of the
MAR, especially in the southern half.
The sequence stratigraphic framework for the UQ-SDAAP project was applied to static modelling of the MAR
area (Figure 3). Since the MAR area was the first dynamic simulation for the UQ-SDAAP project, its focus
was to determine the regional-scale bulk behaviour of the Blocky Sandstone Reservoir to the MAR activities.
Therefore, only the regionally defined stratal surfaces that define the Blocky Sandstone Reservoir were
utilised. These are the J10 and TS1 surfaces (see La Croix et al. 2019b, 2019c).
The model used 10 m, equal-thickness layering, following the horizon that defined the top of each zone. Grid
cells in the ‘j’ and ‘k’ directions (i.e. both horizontal directions) are 500 m x 500 m. This resulted in a model
consisting of 268 cells x 708 cells x 9 cells (1,707,696 cells in total).
Twelve main faults were included in the static model to represent the main structural features in the MAR
region. These were derived from The University of Queensland Centre for Coal Seam Gas (UQ-CCSG)
Faults and Fractures project (Copley et al. 2017, Figure 2). The model grid honoured the faults by using a
“stair-step” pattern to avoid cells with odd geometries. All faults dip vertically and they propagate through all
model layers.

UQ-SDAAP | Flow Modelling of the managed aquifer recharge areas 8
Figure 2 (A) 192 wells within the MAR area. (B) Faults used in the MAR static model, derived from the SEES Faults and Fractures Project.
Figure 3 Comparison of stratigraphic nomenclature, zones, lithology, wireline log signature, stratal stacking patterns, and seismic stratigraphy that form the basis of the UQ-SDAAP project framework.
3.2 Property modelling
Flow unit terminology was used for cell classification to help control the distribution of porosity and
permeability. Three classifiers were modelled: Blocky Sandstone, Other Sandstone, and Less Flow. The
Blocky Sandstone classifier corresponds to the wireline log facies SA (La Croix et al. 2019c). The Other
Sandstone classifier consisted of wireline log facies SB, SC, SD, SMA, and SMB (La Croix et al. 2019c).
Finally, the Less Flow classifier comprised wireline log facies MA, MB, OA, and OB (La Croix et al. 2019c).
UQ-SDAAP | Flow Modelling of the managed aquifer recharge areas 9
By and large, the reservoir model consisted predominantly of Blocky Sandstone, with subordinate Other
Sandstone, and rare Less Flow. Flow units were derived from well data, and then distributed throughout the
model using Sequential Indicator Simulation (SIS; Journel, 1983, Journel and Issaks, 1984, Journel and
Alabert, 1988, Deutsch, 2006).
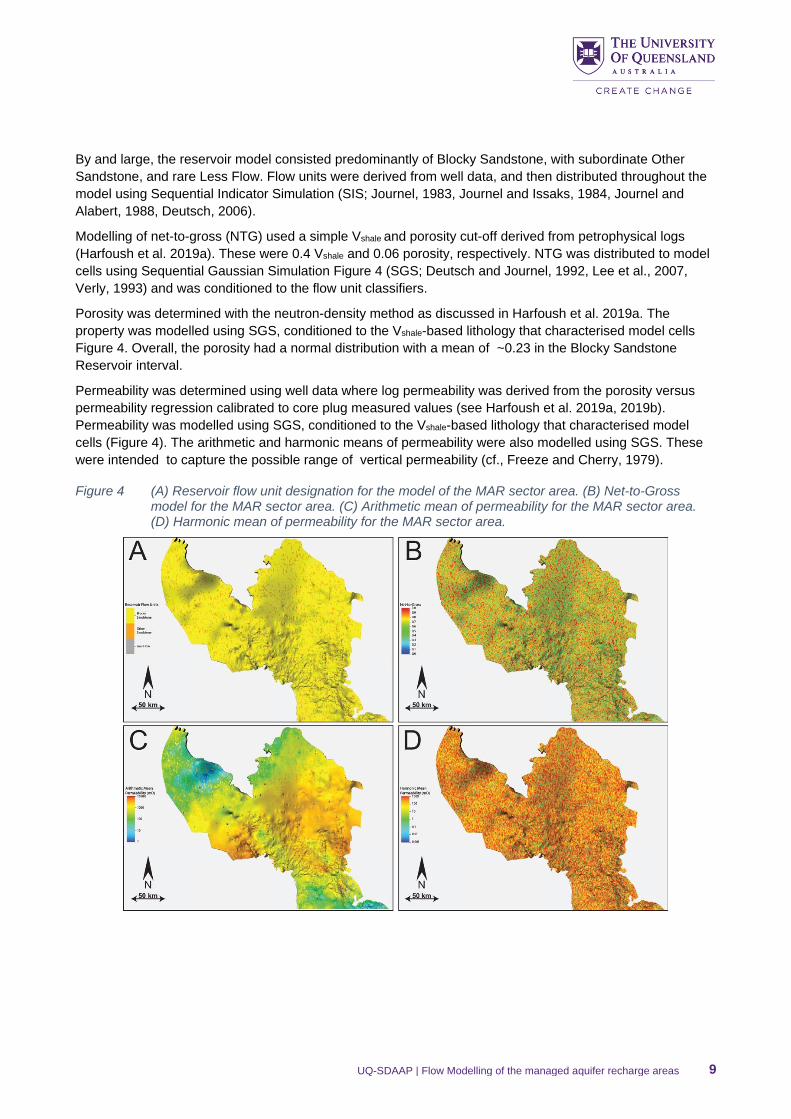
Modelling of net-to-gross (NTG) used a simple Vshale and porosity cut-off derived from petrophysical logs
(Harfoush et al. 2019a). These were 0.4 Vshale and 0.06 porosity, respectively. NTG was distributed to model
cells using Sequential Gaussian Simulation Figure 4 (SGS; Deutsch and Journel, 1992, Lee et al., 2007,
Verly, 1993) and was conditioned to the flow unit classifiers.
Porosity was determined with the neutron-density method as discussed in Harfoush et al. 2019a. The
property was modelled using SGS, conditioned to the Vshale-based lithology that characterised model cells
Figure 4. Overall, the porosity had a normal distribution with a mean of ~0.23 in the Blocky Sandstone
Reservoir interval.
Permeability was determined using well data where log permeability was derived from the porosity versus
permeability regression calibrated to core plug measured values (see Harfoush et al. 2019a, 2019b).
Permeability was modelled using SGS, conditioned to the Vshale-based lithology that characterised model
cells (Figure 4). The arithmetic and harmonic means of permeability were also modelled using SGS. These
were intended to capture the possible range of vertical permeability (cf., Freeze and Cherry, 1979).
Figure 4 (A) Reservoir flow unit designation for the model of the MAR sector area. (B) Net-to-Gross model for the MAR sector area. (C) Arithmetic mean of permeability for the MAR sector area. (D) Harmonic mean of permeability for the MAR sector area.

UQ-SDAAP | Flow Modelling of the managed aquifer recharge areas 10
4. Petrophysics versus MAR inversion derived permeability
This section compares the results of the MAR Sector flow analysis between static models parameterised
either from the petrophysics workflow described previously, or from a groundwater model inversion based on
the MAR history match (Hayes et al. 2019a). Both models have identical physical geometries for the MAR
sector static geological model (Figure 4). The models also have identical initial and boundary conditions;
however, the assigned permeability values are different in between them. The permeability map in the first
model is generated based on the log analysis of several wells in MAR sector as previously described (details
in Harfoush et al. 2019a, 2019b, 2019c and 2019d). However, permeability in the second model is generated
based on the analysis of the water level data gathered at various monitoring wells (completed in the
Precipice Sandstone) during the MAR operations at Reedy Creek and Spring Gully areas (see Hayes et al.
2019a). Having compared the pressure response of both models with the data at the bores across the model
(i.e. in the Spring Gully, Coochiemudlo, Woleebee Creek, Charlotte, Charlie, and Condabri areas), a few
sensitivity cases for permeability were analysed in order to match the observed water level data.
5. Model initialisation
The UQ-SDAAP used the well log and facies analysis (La Croix et al. 2019a, 2019c) along with the SGS
techniques to distribute porosity and net-to-gross over the entire Surat Basin (see Harfoush et al. 2019d and
Gonzalez et al. 2019b). The porosity and net-to-gross maps of the MAR section were clipped form the
regional Surat Basin model, shown in Figure 5 (A) and Figure 5 (B), respectively.
Figure 5 (A) Porosity (B) Net-to-gross distributions for MAR sector area.
Using ECLIPSE software, we initialised the model with the equilibrium pressure of 134.12 bar at the depth of
1106 m. We assigned infinite aquifer (constant water pressure) to the edge of the Blocky Sandstone
Reservoir, so the boundary is open unless it geologically pinches out. We assumed the Blocky Sandstone
Reservoir is sealed at the top and bottom. We assume the model is fully saturated with water, having a
salinity of 800 mg/L at its initial state. Injecting water with an average rate of 21,000 m3/day, we modelled the
resulting single phase flow. Starting from January 2015, for 28 months, water was injected via eleven wells in
the Reedy Creek area and three wells in the Spring Gully area. The total flow rate is shown in Figure 6.
(a) (b)

UQ-SDAAP | Flow Modelling of the managed aquifer recharge areas 11
Assuming isothermal conditions, we ignore the thermal effects from relatively cold water being injected into a
relatively hot formation.
Figure 6 Water injection rate into the MAR sector model (MAR area) for Reedy Creek and Spring Gully combined.
5.1 Distribution of permeability
As mentioned earlier, two permeability distribution maps were available from different sources. One was
derived from petrophysical log analysis calibrated with measured core data and DST analysis and the other
was derived from inverse groundwater modelling of the MAR observation bore data, shown in Figure 7 (A)
and 4b, respectively. The maps are entirely different, not only regarding the magnitude of permeability values
but also regarding its distribution. In the map provided sourced from petrophysical analysis, the maximum
permeability is less than 5 Darcy, and the highest permeability values occur in the in Reedy Creek area. The
permeability distribution from the groundwater inversion model of the MAR observation wells (Figure 7 (B))
shows a broad region of high permeability of up to 200 Darcy around Spring Gully. There is also a narrow
but long region (~40 km long) of high permeability from West Wandoan to southern Woleebee Creek. It is
speculated that the presence of natural fractures is an explanation for the discrepancy of the two methods
since the petrophysical analysis would only “see” the matrix permeability while the groundwater inversion
model will “see” the bulk permeability at a larger scale (see Harfoush et al. 2019d for details).

UQ-SDAAP | Flow Modelling of the managed aquifer recharge areas 12
Figure 7 MAR sector permeability distributions provided by (A) petrophysical analysis and (B) groundwater model inversion of MAR observation well data.
5.2 Pressure response prediction
The MAR sector dynamic simulation was run using each of the two alternative permeability distributions
described in the previous section. Figure 8 shows the prediction of fluid pressure as well as the available
pressure data (history) at five locations in MAR area as a comparison for each permeability distribution
scenario. According to the results, using the permeability distribution calculated from the petrophysical
analysis has led to a better prediction of pressure in Condabri (south-east), Coochiemudlo (north-east), and
Charlie (middle) areas of the MAR sector model. However, the permeability map determined from the
groundwater inversion model gives a better prediction of pressure in Spring Gully (North-West) and Charlotte
(middle-north) areas of the MAR sector model. The highest increase in pressure (dp) happens at the Charlie
area, where the pressure is 1.9 and 3 bar for the petrophysics and groundwater inversion models,
respectively. However, both values are far above the field data (history) which is only 0.5 bar change.
(a) (b)
Charlie
Woleebee Creek
Charlotte
Spring Gully
Coochiemudlo
West Wandoan
Condabri
Reedy Creek Woleebee Creek
Charlie
Charlotte
Spring Gully
Coochiemudlo
West Wandoan
Condabri
Reedy Creek

UQ-SDAAP | Flow Modelling of the managed aquifer recharge areas 13
Figure 8 MAR Sector dynamic model pressure increase due to MAR injection at Reedy Creek and Spring Gully.
Looking at the distribution of pressure change (dp), the MAR sector dynamic model based on the
petrophysical analysis, permeability gives a more homogenous dp over the MAR sector model area (Figure
9). For this model, dp gradually decreases with distance from the main injection location at Reedy Creek
(Figure 9 (A)). However, in the model based on the groundwater inversion permeability (Figure 9 (B)), results
in a dp distribution chiefly localised in Reedy Creek area, where it gradually decreases along the North-East
direction towards Charlie, Charlotte, and Coochiemudlo areas. It significantly drops along the North-West
and South-West directions towards Spring Gully and Condabri, respectively.
0
0.05
0.1
0.15
0.2
0.25
0.3
0.35
0.4
30-Jan-15 18-Aug-15 05-Mar-16 21-Sep-16 09-Apr-17
dp
(b
ar)
Date
(a)Condabri_Groundwater
Condabri_Petrophysics
History
0
0.2
0.4
0.6
0.8
1
1.2
1.4
1.6
1.8
30-Jan-15 18-Aug-15 05-Mar-16 21-Sep-16 09-Apr-17
dp
(b
ar)
Date
(b)Coochiemudlo_Groundwater
Coochiemudlo_Petrophysics
History
0
0.1
0.2
0.3
0.4
0.5
0.6
30-Jan-15 18-Aug-15 05-Mar-16 21-Sep-16 09-Apr-17
dp
(b
ar)
Date
(c)Spring Gully_Groundwater
Spring Gully_Petrophysics
History
0
0.2
0.4
0.6
0.8
1
1.2
1.4
1.6
1.8
30-Jan-15 18-Aug-15 05-Mar-16 21-Sep-16 09-Apr-17
dp
(b
ar)
Date
(d)Charlotte_Groundwater
Charlotte_Petrophysics
History
0
0.5
1
1.5
2
2.5
3
3.5
30-Jan-15 18-Aug-15 05-Mar-16 21-Sep-16 09-Apr-17
dp
(b
ar)
Date
(e)Charlie_Groundwater
Charlie_Petrophysics
History

UQ-SDAAP | Flow Modelling of the managed aquifer recharge areas 14
Figure 9 The distribution of the pressure increase (dp) due to MAR injection in MAR sector area. (A) based on petrophysical analysis permeability distribution and (B) based on groundwater model inversion permeability distribution.
5.3 Sensitivities and modifications
Figure 8 demonstrates that neither model was able to completely history match the pressure prediction with
the observed monitoring well data during MAR operations. Thus, a few sensitivity analysis cases on
permeability were defined to get a general idea about the trend of the change in pressure prediction as we
changed the permeability locally. Comparing the permeability maps determined from petrophysics and
groundwater model inversion (Figure 6) reveals that the north-west (Spring Gully) and the middle regions
(Charlie/Charlotte) of the MAR sector model have the most discrepancies. We changed the permeability of
these two regions for the first map (determined by petrophysics), and compared it with the second one
(determined from groundwater model inversion). In one case we multiplied the permeability of Spring Gully
and Charlie/Charlotte/Reedy Creek regions to five (Figure 10 (A)), and in the other case we multiplied the
permeability of Spring Gully to 10, however we halved the permeability of the middle areas, i.e. Charlie,
Charlotte, and Reedy Creek (Figure 10 (B)). Since there might be faults located beyond the Spring Gully and
Condabri region to the east (see Gonzalez et al. 2019b), we also defined a case for which the model is
sealed in these regions (Figure 10(C)). Adding more pressure field data for further analyses, the
hydrogeologists provided an updated permeability map (Figure 10(D)). This is considered as another case.
Table 1 A list of the permeability maps considered for the MAR sector dynamic model sensitivity analysis.
Case Source of the model (UQ-SDAAP team)
Notation Remarks Figure
1 petrophysics petrophysics Original Figure 7 (a)
2 petrophysics petrophysics _Modified_1 Permeability in Spring Gully, Charlie, Charlotte, Reedy Creek is multiplied to 5
Figure 10 (a)
3 petrophysics petrophysics _Modified_2 Permeability in Spring Gully is multiplied to 10. However, permeability in Charlie, Charlotte, Reedy Creek is multiplied to 0.5
Figure 10 (b)
4 petrophysics petrophysics _Modified_3 The model is sealed in upper Spring Gully and lower Condabri
Figure 10 (c)
5 Groundwater Groundwater Original Figure 10 (d)
6 Groundwater Groundwater_2 Updated by the hydrogeologists by including more pressure field data
Figure 7 (a)
Woleebee Creek
Charlie Charlotte
Spring Gully Coochiemudlo
West Wandoan
Condabri (a)
Woleebee Creek
Charlie Charlotte
Spring Gully Coochiemudlo
West Wandoan
Condabri (b)
Reedy Creek Reedy Creek

UQ-SDAAP | Flow Modelling of the managed aquifer recharge areas 15
Figure 10 Permeability modifications in the MAR sector area sensitivity analysis: (A) increasing the permeability determined by petrophysics moderately in Spring Gully, Reedy Creek, Charlie, Charlotte, Woleebee Creek; (B) increasing the permeability significantly in Spring Gully, however decreasing it moderately in the Reedy Creek, Charlie, Charlotte, Woleebee Creek areas; (C) sealing the modelled faults in the upper Spring Gully and southern Condabri areas; and (D) modifying the permeability of the groundwater model inversion by using more data as input.
Figure 11 shows the results of the sensitivity analysis done on the MAR sector area at the same locations as
before. At Condabri-Well-INJ2-P, the first modified permeability map gives the closest prediction to the actual
measured history at observation bores. However, the original permeability map gives a better trend. Both
original and updated models provided by the groundwater model inversion gave the worst prediction of
pressure. At Coochiemudlo-Well-GW2, the updated permeability map (Figure 10 (D)) gave the best
prediction in terms of both pressure values and its general trend with time at specific well locations (Figure
11 (B)). The original groundwater model inversion gave the worst prediction. At Spring Gully-Well-Precipice
Bore-1, none of the cases could predict the observed pressure history accurately. In early time the first
modified map of the petrophysics determined that permeability gives a good prediction. However, in late
time, the original model of the groundwater model inversion gives a better prediction (Figure 11 (C)). In
general, increase in pressure in the Spring Gully area is low (<0.8 bar) and the inclusion of a long sealing
K×5
Spring Gully K×5
Charlie
(a) petrophysics _Modified_1
K×10
Spring Gully
K×0.5
Charlie
(b) petrophysics _Modified_2
Sealed
Upper Spring Gully
(c) petrophysics _Modified_3 (d) Groundwater _2
Sealed
Sealed

UQ-SDAAP | Flow Modelling of the managed aquifer recharge areas 16
fault did not improve the prediction of pressure. In the Charlotte area, neither the original nor the
modifications of the petrophysics determined permeability models gave good results (Figure 11 (D)). Here,
the original groundwater model inversion gave a good prediction of pressure in early time, however, the
modified groundwater model inversion gave a better trend in late time. In the Charlie area (at Charlie-Well-
GW2), quite like in the Coochiemudlo area, the difference between the predictions made by the original and
the updated models of the groundwater model inversion was huge. However, the original and the modified
petrophysics models gave similar results (Figure 11 (E)). The best prediction of pressure has been achieved
by the updated groundwater model inversion (Figure 10 (E)).
In conclusion, among all the cases, the updated groundwater model inversion (Figure 10 (D)) gave the best
prediction of pressure. It only failed to closely predict the pressure in the Condabri area (at Contabri-Well-
ING2-P). Low values of dp in this location could be related to the open boundary condition. This could be
improved by assigning a closed boundary condition. The results could also be improved if we sealed the
north-west boundary at Spring Gully. However, sealing a wider area of the model boundary would also lead
to a general increase in pressure across the model, and this might lead to a deterioration of the history
match in the central areas.
Figure 11 Sensitivity analysis results: pressure increase due to MAR injection in the MAR sector area.
0
0.1
0.2
0.3
0.4
0.5
0.6
0.7
0.8
30-Jan-15 18-Aug-15 05-Mar-16 21-Sep-16 09-Apr-17
dp
(b
ar)
Date
(a)Condabri_GroundwaterCondabri_Groundwater_2Condabri_PetrophysicsCondabri_Petrophysics_ModifiedCondobri_Petrophysics_Modified_2Condobri_Petrophysics_Modified_3History
0
0.2
0.4
0.6
0.8
1
1.2
1.4
1.6
1.8
30-Jan-15 18-Aug-15 05-Mar-16 21-Sep-16 09-Apr-17
dp
(b
ar)
Date
(b)Coochiemudlo_GroundwaterCoochiemudlo_Groundwater_2Coochiemudlo_PetrophysicsCochiemudlo_Petrophysics_ModifiedCochiemudlo_Petrophysics_Modified_2Cochiemudlo_Petrophysics_Modified_3History
0
0.1
0.2
0.3
0.4
0.5
0.6
30-Jan-15 18-Aug-15 05-Mar-16 21-Sep-16 09-Apr-17
dp
(b
ar)
Date
(c) Spring Gully_GroundwaterSpring Gully_Groundwater_2Spring Gully_PetrophysicsSpring Gully_Petrophysics_ModifiedSpringGully_Petrophysics_Modified_2Spring Gully_Petrophysics_Modified_3History
0
0.2
0.4
0.6
0.8
1
1.2
1.4
1.6
1.8
2
30-Jan-15 18-Aug-15 05-Mar-16 21-Sep-16 09-Apr-17
dp
(b
ar)
Date
(d)Charlotte_GroundwaterCharlotte_Groundwater_2Charlotte_PetrophysicsCharlotte_Petrophysics_ModifiedCharlotte_Petrophysics_Modified_2Charlotte_Petrophysics_Modified_3History
0
0.5
1
1.5
2
2.5
3
3.5
30-Jan-15 18-Aug-15 05-Mar-16 21-Sep-16 09-Apr-17
dp
(b
ar)
Date
(e) Charlie_GroundwaterCharlie_Groundwater_2Charlie_PetrophysicsCharlie_Petrophysics_ModifiedCharlie_Petrophysics_Modified_2Charlie_Petrophysics_Modified_3History

UQ-SDAAP | Flow Modelling of the managed aquifer recharge areas 17
The distribution of dp across the MAR sector model area is similar between the petrophysics derived
permeability scenario models (Figure 12 (A-D)). In general, the highest dp is achieved in the third
modification of the petrophysics derived permeability model. The dp distribution is totally different between
the groundwater model inversion and the updated groundwater model inversion scenarios where dp is high
in the middle and the north-east, but it is low in the north-west and the south-east (Figure 12 (E-F)). The
updated groundwater model inversion gives high dp values in a wider area in the middle of the MAR sector
area and increase in fluid pressure in eastern areas such as West Wandoan which has become ten times
higher (Figure 12 (E)).

UQ-SDAAP | Flow Modelling of the managed aquifer recharge areas 18
Figure 12 Sensitivity analysis: the distribution of the pressure increase (dp) due to MAR injection in the MAR sector area.
Woleebee Creek
Charlie
Charlotte
Spring Gully Coochiemudlo
West Wandoan
Condabri
(a) petrophysics
Woleebee Creek
Charlie
Charlotte
Spring Gully Coochiemudlo
West Wandoan
Condabri (b) petrophysics _ Modified_1
Woleebee Creek
Charlie
Charlotte
Spring Gully Coochiemudlo
West Wandoan
Condabri (c) petrophysics _ Modified_2
Woleebee Creek
Charlie
Charlotte
Spring Gully Coochiemudlo
West Wandoan
Condabri (d) petrophysics _Modified_3
Woleebee Creek
Charlie
Charlotte
Spring Gully Coochiemudlo
West Wandoan
Condabri (e) Groundwater
Woleebee Creek
Charlie
Charlotte
Spring Gully Coochiemudlo
West Wandoan
(f) Groundwater_2 Condabri
UQ-SDAAP | Flow Modelling of the managed aquifer recharge areas 19
6. References
Copley J, Mukherjee S, Babaahmadi A, Zhou F, Barbosa S, Hurter S, Tyson S (2017), Faults and Fractures
in the Surat Basin Relationships with Permeability, Centre for Coal Seam Gas confidential report.
Deutsch CV (2006), A Sequential Indicator Simulation Program For Categorical Variables With Point And
Block Data: Blocksis, Computers And Geosciences, vol 32, pp 1669-1681.
Deutsch CV & Journel AG (1992), Gslib: Geostatistical Software Library And User’s Guide, New York,
Oxford University Press.
Freeze RA & Cherry JA (1979), Groundwater, Englewood Cliffs, New Jersey, Prentice-Hall.
Gonzalez S, Harfoush A, La Croix A, Underschultz J & Garnett A (2019), Regional static model, The
University of Queensland Surat Deep Aquifer Appraisal Project – Supplementary Detailed Report, The
University of Queensland.
Hayes P, Nicol C & Underschultz J (2019), Precipice sandstone hydraulic property estimation from observed
MAR responses, The University of Queensland Surat Deep Aquifer Appraisal Project – Supplementary
Detailed Report, The University of Queensland.
Harfoush H, Altaf I & Wolhuter A (2019), Wireline log analysis, The University of Queensland Surat Deep
Aquifer Appraisal Project – Supplementary Detailed Report, The University of Queensland.
Harfoush A, Pearce J & Wolhuter A (2019), Core data analysis, The University of Queensland Surat Deep
Aquifer Appraisal Project – Supplementary Detailed Report, The University of Queensland.
Harfoush A, Hayes P, La Croix A, Gonzalez S & Wolhuter A (2019), Integrating petrophysics into modelling,
The University of Queensland Surat Deep Aquifer Appraisal Project – Supplementary Detailed Report, The
University of Queensland.
Harfoush A, Gonzalez S, Ribeiro A & Wolhuter A (2019), Fluid substitution for seismic detection of plume,
The University of Queensland Surat Deep Aquifer Appraisal Project – Supplementary Detailed Report, The
University of Queensland.
Journel AG (1983), Nonparametric Estimation Of Spatial Distribution, Mathematical Geology, vol 15, pp 445-
468.
Journel AG & Alabert FG (1988), Focusing On Spatial Connectivity Of Extreme Valued Attributes: Stochastic
Indicator Models Of Reservoir Heterogeneities. Spe, Paper 18324.
Journel AG & Issaks EH (1984), Conditional Indicator Simulation: Application To A Saskatchewan Uranium
Deposit, Mathematical Geology, vol 16, pp 685-718.
La Croix A, Wang J & Underschultz J (2019), Integrated facies analysis of the Precipice Sandstone and
Evergreen Formation in the Surat Basin, The University of Queensland Surat Deep Aquifer Appraisal Project
– Supplementary Detailed Report, The University of Queensland.
La Croix A, Wang J, Gonzalez S, He J, Underschultz J & Garnett A (2019), Sequence stratigraphy of the
Precipice Sandstone and Evergreen Formation in the Surat Basin, The University of Queensland Surat Deep
Aquifer Appraisal Project – Supplementary Detailed Report, The University of Queensland.
La Croix A, He J, Wang J & Underschultz J (2019), Facies prediction from well logs in the Precipice
Sandstone and Evergreen Formation in the Surat Basin, The University of Queensland Surat Deep Aquifer
Appraisal Project – Supplementary Detailed Report, The University of Queensland.
Lee SY, Carle SF & Fogg GE (2007), Geologic Heterogeneity And A Comparison Of Two Geostatistical
Models: Sequential Gaussian And Transition Probability-Based Geostatistical Simulation, Advances In Water
Resources, vol 30, pp 1914-1932.

UQ-SDAAP | Flow Modelling of the managed aquifer recharge areas 20
Verly G (1993), Sequential Gaussian Simulation: A Monte Carlo Method For Generating Models Of Porosity
And Permeability, In: Spencer, A. M. (Ed.) Generation, Accumulation And Production Of Europe’s
Hydrocarbons Iii. Berlin, Heidelberg: Springer.

UQ-SDAAP | Flow Modelling of the managed aquifer recharge areas 21
CRICOS Provider Number 00025B