supplementary data: table of contents
TRANSCRIPT

Supplementary Data: Table of Contents
1) Materials and Methods for Supplemental Figures: pg 2
2) Supplemental Figures
Supplement to Figure 1: pg 4
Supplement to Figure 2: pg 5
Supplement to Figure 3: pg 6
Supplement to Figure 4: pg 8
Supplement to Figure 5: pg 10
Supplement to Figure 6: pg 11

2
MATERIALS AND METHODS FOR SUPPLEMENTAL FIGURES
Transfections and Infections
Retroviral infection and selection procedures were performed essentially as described (77).
Briefly, 293T cells were transfected by calcium phosphate coprecipitation. About 16 hours after
transfection virus-containing media was collected, passed through a 0.45-μm syringe filter,
and combined with polybrene (hexadimethrine bromide; Sigma-Aldrich, St. Louis,
MO) to a final concentration of 8 μg/ml. This media was then applied to subconfluent (25-40%
confluent) 3T3-L1 preadipocytes. The infection protocol was repeated every 12 hours until
cells were approximately 80% confluent. 3T3-L1 cells were then split 1:5 in Dulbecco's
modified Eagle's medium (GIBCO) supplemented with 10% calf serum and appropriate
selection agents (400 μg/ml neomycin or 2 μg/ml puromycin). Once fully selected, stably
infected cells were used for the appropriate assays.
Localization of Sfrp5
Mouse 3T3-L1 and human embryonic kidney 293T cells were maintained in Dulbecco's
modified Eagle's medium (Invitrogen, GIBCO®; Carlsbad, CA) containing 10% calf serum
(Atlanta Biologicals; Laurenceville, GA). 293T cells were transiently transfected with
pcDNA3.1+ (Sfrp5-Myc) using the Lipofectamine Plus reagent (Invitrogen) according to the
manufacturer’s instructions. Separation of whole cell, extracellular matrix (ECM), and
conditioned media fractions was performed as previously described (Finch et al., 1997; Lee et
al., 2004; Uren et al., 2000; Zhong et al., 2007). Briefly, 293T cells were treated with or without
50 μg/ml heparin (Sigma-Aldrich, St. Louis MO) for 3 hours. The conditioned media were then
concentrated by centrifuging at 3000 x g for 20 min using Amicon® Ultra-15 Centrifugal filter
devices (Millipore, Billerica, MA). Cells were released from the culture dishes by incubating
with 10 mM EDTA in PBS. The ECM components remaining on the culture dishes were
washed and extracted with SDS Laemmli sample buffer with 5% -mercaptoethanol. 3T3-L1
adipocytes stably expressing Sfrp5-Myc or control vector cells were induced to differentiate
into adipocytes two days after confluence as described in Materials and Methods for the main
text. On day 6 after differentiation, cells were treated with or without heparin, and then
released from the culture dishes by EDTA. The subsequent methods were as described for
HEK293T cells.

3
Total body fat content
Total body fat content was determined using a dual energy X-ray absorptiometry (DEXA)
scanner (GE Medical Systems Lunar) according to the manufacturer’s instructions.
Measurement of Adipocyte Volume
Following quantification of cross-sectional adipocyte area with ImageJ as discussed in
Materials and Methods for the main text, we assumed that adipocytes are spherical and thus
calculated the volume of each adipocyte using the formula 4/3r3.
Microarray Analysis
RNA was isolated from gWAT of male control and Sfrp5Q27stop mice. cDNA was amplified and
purified using the WT Pico assay (NuGen Inc.) following the manufacturer’s standard protocol.
Four micrograms of cDNA was converted to sense orientation using the Exon Module (NuGen
Inc.) and subsequently fragmented and biotinylated using the Ovation FL Module (NuGen Inc.)
following the manufacturers standard protocol. The probe was then hybridized to Affymetrix
Mouse Gene ST 1.0 GeneChips for 20 hours at 45ºC, stained, and washed using a Fluidics
FS450 instrument, and then scanned with the Affymetrix 7G Scanner 3000. Data were
analyzed using Ingenuity Pathway Analysis software (Ingenuity Systems, Redwood City, CA)
to identify relevant biological networks. Gene profiling data are available from the GEO
database (http://ncbi.nlm.nih.gov/geo) with the accession number: GSE37514.

4
Supplement to Figure 1
(A) Sfrp5 mRNA expression is induced during adipocyte differentiation in vitro. RNA was
isolated from day-two post-confluent 3T3-L1 cells (Day 0) and at the indicated time points after
induction of differentiation. Values normalized to Tbp mRNA are expressed as percent
maximum expression (n = 3). (B) Increased Sfrp5 mRNA expression in eWAT from Lepob/ob
mice. Sfrp5 mRNA levels in eWAT were measured by real-time RT-PCR in 12-week-old
Lepob/ob and control mice (Lep+/+). Average Ct = 21.8 from Leprob/ob eWAT and = 24.58 from
control mice. Values normalized to 18S mRNA are expressed relative to control mice. (Lep+/+
;
n = 5; Lepob/ob, n = 3). (C) Sfrp5 is suppressed in eWAT from mice that are resistant to
HFD-induced obesity. Sfrp5 mRNA levels in eWAT from control or LxrKO mice under HFD for
six months were measured by real-time RT-PCR. Values were normalized to 18S mRNA and
are expressed relative to control mice (n = 4 per genotype). (D) Increased Sfrp5 expression is
associated with elevated adiposity. The graph shows relationship between % body fat
measured by DEXA and Sfrp5 mRNA levels in WAT from OVX or sham-operated female mice
(shown in Figure 1C). For panels (B) and (C), values are mean ± s.e.m. *p<0.05.

5
Supplement to Figure 2
(A) Diagram depicting the full-length Sfrp5 protein and the predicted protein fragment in
Sfrp5Q27stop mice. CRD, cysteine-rich domain; NTR, netrin domain. (B) Decreased Sfrp5 in
adipocytes of Sfrp5Q27stop mice. Sfrp5 mRNA expression levels in the adipocyte fraction of
eWAT from control or Sfrp5Q27stop mice under HFD were measured by real-time RT-PCR.
Values were normalized to Tbp mRNA and are expressed relative to control mice (n = 8). (C)
Compensatory increased Sfrp1 mRNA in Sfrp5Q27stop gWAT. mRNA for Sfrp5 (left panel) and
other Sfrp family members (right panels) in gWAT from control or Sfrp5Q27stop mice under HFD.
Values were normalized to Tbp mRNA and are expressed relative to control mice. (n = 17). (D)
Reduction in weight of WAT in Q27stop mice can be attributed to decreased size of adipocytes.
The correlation coefficient for the combined data is 0.89, indicating that most variation in
weight of adipose tissue can be explained by differences in adipocyte volume. Thus changes
in total number of adipocytes per WAT depot will be negligible between genotypes. Adipocyte
volume was calculated from cross-sectional area, and is plotted relative to weight of ovarian
WAT.
6

7
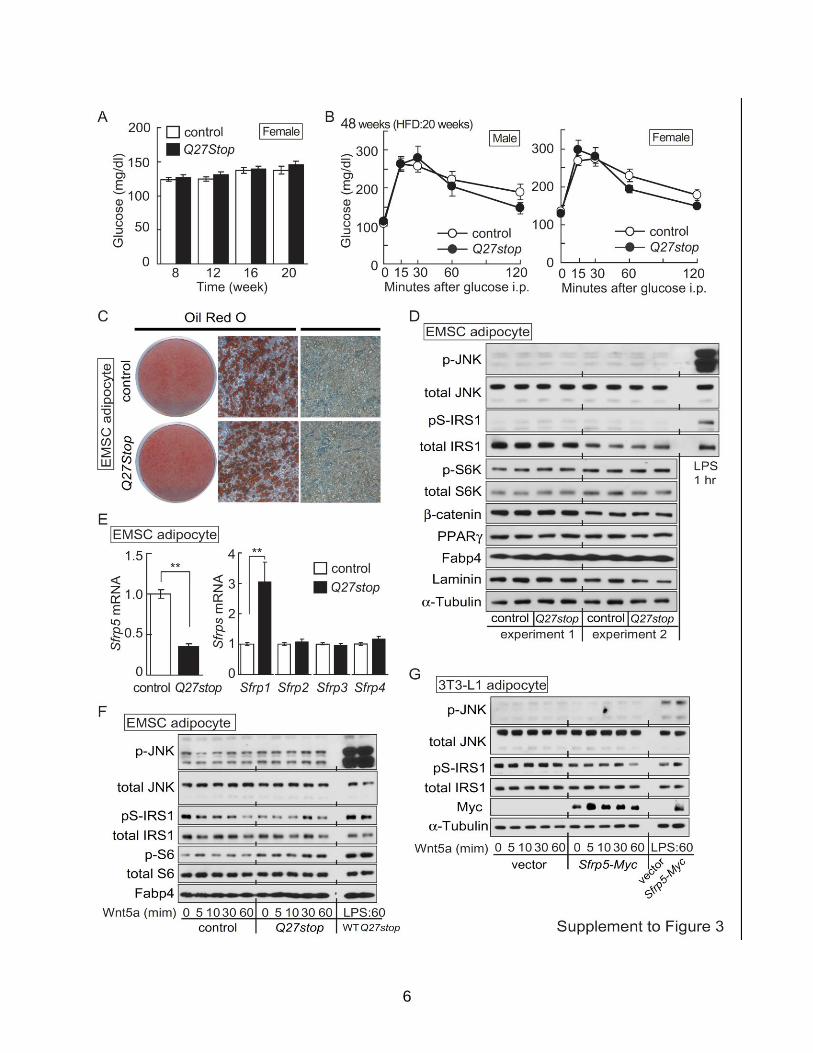
Supplement to Figure 3
(A) Blood glucose levels in ad libitum-fed female Sfrp5Q27stop and control mice (n = 13-19). (B)
No change in glucose tolerance in female Sfrp5Q27stop mice under HFD. Blood glucose levels
after intraperitoneal (i.p.) injection of glucose (1 g/kg body weight) in 48-week-old female mice
(n = 8 per each gender and per genotype). (C) SFRP5-deficiency does not affect adipocyte
differentiation. Pictures of Oil Red-O (ORO) staining (left), photomicrographs of ORO (middle)
and phase-contrast pictures (right) from control and Sfrp5Q27stop EMSC adipocytes (Day 12
after differentiation). (D) No change in expression of adipocyte markers in Sfrp5Q27stop EMSC
adipocytes. Immunoblot analysis of markers of adipocytes (PPAR and FABP4), insulin
signaling components (pS-IRS1, p-S6K) or other proteins in Sfrp5Q27stop and control EMSC
adipocytes (Day 12 after differentiation). Laminin and -tubulin were used as loading controls.
Experiment 1 and 2 are two independent experiments. EMSC adipocytes stimulated with LPS
were used as a control for p-JNK and pS-IRS1. (E) Decreased Sfrp5 and increased Sfrp1 in
Sfrp5Q27stop adipocytes. Sfrp5 (left panel) and other Sfrp mRNAs (right panel) in Sfrp5Q27stop
EMSC adipocytes (Day 12). Values were normalized to Tbp mRNA and are expressed relative
to control mice (n = 22/genotype). Values are expressed as mean ± s.e.m. *p<0.01. (F)
Ablation of SFRP5 does not affect phosphorylation of JNK or S-IRS1 in EMSC adipocytes after
WNT5a treatment. Immunoblot analyses of control and Sfrp5Q27stop EMSC adipocytes (Day12)
after treatment with recombinant WNT5A (100 ng/mL). EMSC adipocytes stimulated with LPS
were used as a positive control. (G) Ectopic SFRP5 does not affect phosphorylation of JNK or
S-IRS1 in 3T3-L1 adipocytes after WNT5a treatment. Immunoblot analysis using indicated
antibodies after recombinant WNT5a treatment of 3T3-L1 adipocytes (Day 6) stably
expressing either Sfrp5-Myc or Ad–-gal (vector). EMSC adipocytes in (A-D) were at day 12
post-induction. In (B), (D) and (E), adipocytes stimulated with LPS were used as a control for
p-JNK and pS-IRS1. For all panels, Sfrp5Q27stop is represented as Q27Stop.

8

9
Supplement to Figure 4
(A) Metabolic rate in control and Sfrp5Q27stop mice. Male control and Sfrp5Q27stop mice (n = 8
each) were placed in a comprehensive lab animal monitoring system (CLAMS) for three days.
Oxygen consumption rate, as normalized to lean mass (LBM, left panel) and body weight
(right), is shown. (B) Sfrp5 is a secreted protein tightly associated with the extracellular matrix.
HEK293T cells were transiently transfected with pcDNA3.1+ empty vector or vector containing
a Sfrp5-Myc fusion construct. Twenty four hours after transfection, cells were treated with or
without 10 μg/ml heparin for six hours. Cell lysates, conditioned medium (C. Media), and
extracellular matrix (ECM) were then collected. Samples were analyzed by SDS-PAGE
followed by immunoblotting with anti-MYC and anti-SFRP5 antibody. (C) 3T3-L1
preadipocytes stably expressing Sfrp5-Myc or control vector were induced to differentiate into
adipocytes. On day 6 after differentiation, cells were treated with or without heparin (10 μg/ml),
then released from the culture dishes by EDTA. The subsequent methods were the same as
for HEK 293T cells. (D) Schema of eWAT transplantation from control and Sfrp5Q27stop mice to
Leprdb/db
mice, as described in Figures 4C and 4D and in Materials and Methods for the main
text. eWAT from control or Sfrp5Q27stop donors (n = 6 each) was transplanted subcutaneously
into Leprdb/dbrecipients (n = 3) at four weeks of age. To control for host differences in
hyperphagia, vasculature formation, or other variables, two pieces of tissue (100 mg) were
transplanted from each genotype into each Leprdb/db recipient. This panel was produced using
Servier Medical Art. (E) Ten weeks after transplantation, the donor tissues had grown as
shown in this picture. Sfrp5Q27stop is represented as Q27Stop.

10
Supplement to Figure 5
(A) Table showing results of ingenuity pathway analysis for gene profiling of WAT from control
and Sfrp5Q27stop mice on a HFD. (B) Increased mitochondrial OXPHOS complex genes in
Sfrp5Q27stop WAT under HFD. NADH dehydrogenase subunit 1 (Nadh1), NADH
dehydrogenase subunit 2 (Nadh2), NADH dehydrogenase subunit 5 (Nadh5) and ATP
synthase FO subunit 6 (Atp6) mRNA in eWAT from control or Sfrp5Q27stop mice under HFD for
12 weeks were measured by real-time RT-PCR; these were from the same sample set as used
for gene profiling. Values normalized to Hprt mRNA are expressed relative to control mice (n =
6).

11
Supplement to Figure 6
Sfrp5 regulates mitochondrial function. (A) Mitochondria from Sfrp5Q27stop adipocytes have
higher maximal OCR. Isolated mitochondria (5 g) from control or Sfrp5Q27stop EMSC
adipocytes were seeded to XF24 Capture Microplates. Succinate (2.5 mM) + Rotenone (1 M)
were used to assay for complex-II-dependent respiration (left panel). Malate (2.5 mM) plus
pyruvate (2.5 mM) were used to assay complex-I-dependent respiration (right panel). Data
show basal OCR and OCR after serial injection of ADP (1 mM), Oligomycin (2 µM), FCCP (4
µM) and Antimycin A (1.5 µg/mL). (B) Mitochondria from Sfrp5Q27stop gWAT show higher
maximal OCR. Mitochondria were isolated from gWAT of control or Sfrp5Q27stop mice under
HFD for 12 weeks. Mitochondria were then seeded to XF24 Capture Microplates and assayed
as described in (A).