supplemental material: suicide and ambient temperature in ... file3 . table s1. city-specific...
TRANSCRIPT

Environ Health Perspect DOI: 10.1289/ehp.1409392 Note to Readers: EHP strives to ensure that all journal content is accessible to all readers. However,
some figures and Supplemental Material published in EHP articles may not conform to 508 standards due
to the complexity of the information being presented. If you need assistance accessing journal content,
please contact [email protected]. Our staff will work with you to assess and meet your accessibility
needs within 3 working days.
1
Supplemental Material
Suicide and Ambient Temperature in East Asian Countries: A
Time-Stratified Case-Crossover Analysis
Yoonhee Kim, Ho Kim, Yasushi Honda, Yue Leon Guo, Bing-Yu Chen, Jong-Min Woo, and
Kristie L. Ebi
Table of Contents
Table S1. City-specific characteristics of suicide cases and population size.
Table S2. Weather characteristics by season in fifteen cities.
Table S3. The associations for temperature or sunshine duration.
Table S4. City-specific associations between same-day temperature and suicide according to gender and age group.
Figure S1. Yearly trend of suicide rates on national levels by gender in Korea, Japan, and Taiwan. Suicide and population data were obtained from Statistics Korea, Ministry of Strategy and Finance in South Korea, Ministry of Health, Labor and Welfare (for suicide) and Statistics Bureau, Ministry of Internal Affairs and Communications (for population) in Japan, and Department of Statistics, Ministry of Health and Welfare (for suicide) and Department of Statistics, Ministry of the Interior (for population) in Taiwan.
Figure S2. Yearly trend of suicide rates on national levels by age groups in Korea, Japan, and Taiwan. Suicide and population data were obtained from Statistics Korea, Ministry of Strategy and Finance in South Korea, Ministry of Health, Labor and Welfare (for suicide) and Statistics Bureau, Ministry of Internal Affairs and Communications (for population) in Japan, and

Environ Health Perspect DOI: 10.1289/ehp.1409392
2
Department of Statistics, Ministry of Health and Welfare (for suicide) and Department of Statistics, Ministry of the Interior (for population) in Taiwan.
Figure S3. Monthly trend of suicide in fifteen cities. Study period varied depending on the country: Korea (1992–2010), Japan (1972–2010), and Taiwan (1994–2007). Suicide data were obtained from Statistics Korea, Ministry of Strategy and Finance in South Korea, Ministry of Health, Labor and Welfare in Japan, and Department of Statistics, Ministry of Health and Welfare in Taiwan.
Figure S4. Trends for day of the week of suicide in fifteen cities. Study period varied depending on the country: Korea (1992–2010), Japan (1972–2010), and Taiwan (1994–2007). Suicide data were obtained from Statistics Korea, Ministry of Strategy and Finance in South Korea, Ministry of Health, Labor and Welfare in Japan, and Department of Statistics, Ministry of Health and Welfare in Taiwan.
Figure S5. Lagged effect estimates for sunshine on suicide according to single lags. PC indicates percent change of suicide risk corresponding to a SD/2-increase of mean sunshine, adjusting for temperature, relative humidity, atmospheric pressure, long-term time-trend, and month.
Figure S6. Lagged effect estimates for sunshine on suicide according to moving averages. Moving average 90 indicates the average of sunshine for a week on previous ninety days. PC indicates percent change of suicide risk corresponding to a SD/2-increase of mean sunshine, adjusting for temperature, relative humidity, atmospheric pressure, long-term time-trend, and month.
Figure S7. Lagged effect estimates for temperature on suicide according to single lags. PC indicates percent change of suicide risk corresponding to a SD/2-increase of mean temperature, adjusting for sunshine duration, relative humidity, atmospheric pressure, long-term time-trend, and month.
Figure S8. Lagged effect estimates for temperature on suicide according to moving averages. PC indicates percent change of suicide risk corresponding to a SD/2-increase of mean temperature, adjusting for sunshine duration, relative humidity, atmospheric pressure, long-term time-trend, and month.

3
Table S1. City-specific characteristics of suicide cases and population size.
Country City Study period Population sizea Total suicide cases
Yearly suicide cases (mean ± SD)
Monthly suicide cases (mean ± SD)
Daily suicide cases (mean ± SD)
Suicide rate (per 100,000)
Korea Seoul 1992-2010 9 935 227 28 134 1480.7 ± 651.0 123.4 ± 13.8 4.1 ± 2.8 14.9 Busan 1992-2010 3 603 935 12 922 680.1 ± 291.6 56.7 ± 7.0 1.9 ± 1.6 19.0 Inchoen 1992-2010 2 494 279 8 889 467.8 ± 214.9 39 ± 4.9 1.3 ± 1.3 18.8 Daegu 1992-2010 2 460 241 7 631 401.6 ± 198.5 33.5 ± 3.0 1.1 ± 1.2 16.3 Daejeon 1992-2010 1 396 261 4 622 243.3 ± 117.0 20.3 ± 2.7 0.7 ± 0.9 17.3 Gwangju 1992-2010 1 375 974 3 826 201.4 ± 112.5 16.8 ± 2.4 0.6 ± 0.8 14.5 Japan Sapporo 1972-2010 1 653 862 11 598 297.4 ± 103.9 24.8 ± 2.5 0.8 ± 1.0 18.0 Sendai 1972-2010 868 688 5 671 145.4 ± 59.0 12.1 ± 0.9 0.4 ± 0.7 16.6 Tokyo 1972-2010 8 381 781 60 184 1543.2 ± 286.7 128.6 ± 8.0 4.2 ± 2.3 18.4 Nagoya 1972-2010 2 155 189 15 231 390.5 ± 63.3 32.5 ± 2.2 1.1 ± 1.1 18.2 Osaka 1972-2010 2 647 817 24 955 639.9 ± 151.5 53.3 ± 3.5 1.8 ± 1.4 24.1 Fukuoka 1972-2010 1 247 447 9 066 232.5 ± 71.0 19.4 ± 1.3 0.6 ± 0.8 18.7 Taiwan Taipei 1994-2007 6 188 566 9 480 677.1 ± 296.2 56.4 ± 3.8 1.9 ± 1.6 10.8 Taichung 1994-2007 2 444 636 3 350 239.3 ± 90.5 19.9 ± 1.3 0.7 ± 0.8 9.7 Kaohsiung 1994-2007 2 706 618 5 049 360.6 ± 133.6 30.1 ± 2.9 1.0 ± 1.1 13.2 aCity-specific population size were averaged by using five-year census for Korea and Japan, and single-year for Taiwan, over the entire study period.
Suicide and population data were obtained from Statistics Korea, Ministry of Strategy and Finance in South Korea, Ministry of Health, Labor and Welfare
(for suicide) and Statistics Bureau, Ministry of Internal Affairs and Communications (for population) in Japan, and Department of Statistics, Ministry of
Health and Welfare (for suicide) and Department of Statistics, Ministry of the Interior (for population) in Taiwan.

4
Table S2. Weather characteristics by season in fifteen cities.
Characteristic Country City Spring (mean ± SD)
Summer (mean ± SD)
Autumn (mean ± SD)
Winter (mean ± SD)
Ambient temperature (°C)
Korea Seoul 12.2 ± 6.0 24.4 ± 2.7 14.6 ± 6.7 -0.1 ± 4.4 Busan 13.4 ± 4.5 23.6 ± 3.1 17.4 ± 5.3 5.0 ± 3.8
Inchoen 11.2 ± 5.5 23.5 ± 2.8 14.8 ± 6.5 0.2 ± 4.1
Daegu 14.0 ± 5.6 25.2 ± 3.2 15.8 ± 6.1 2.6 ± 3.5
Daejeon 12.4 ± 5.9 24.4 ± 2.7 14.4 ± 6.4 0.5 ± 3.8
Gwangju 13.0 ± 5.6 24.8 ± 2.7 15.8 ± 6.1 2.4 ± 3.6
Japan Sapporo 6.5 ± 5.9 19.8 ± 3.5 11.4 ± 6.3 -2.7 ± 3.4
Sendai 10.0 ± 5.2 21.6 ± 3.7 15.0 ± 5.4 2.6 ± 3.0
Tokyo 14.2 ± 5.0 25.0 ± 3.5 18.4 ± 5.1 6.9 ± 2.7
Nagoya 13.8 ± 5.1 25.5 ± 3.1 17.9 ±5.6 5.4 ± 2.8
Osaka 14.6 ± 5.1 26.5 ± 3.0 19.0 ± 5.4 6.9 ± 2.8
Fukuoka 14.8 ± 4.6 26.0 ± 3.1 18.9 ± 5.1 7.5 ± 3.0
Taiwan Taipei 22.1 ± 4.1 28.9 ± 1.8 24.5 ± 3.2 17.2 ± 3.1
Taichung 23.3 ± 3.7 28.3 ± 1.5 25.1 ± 2.7 17.9 ± 2.8
Kaohsiung 25.4 ± 2.9 28.8 ± 1.4 26.4 ± 2.1 20.4 ± 2.5 Sunshine (hour) Korea Seoul 6.2 ± 4.0 4.6 ± 4.0 5.6 ± 3.4 5.2 ± 3.2
Busan 6.6 ± 4.2 5.7 ± 4.4 6.2 ± 3.6 6.4 ± 3.2
Inchoen 7.0 ± 4.1 5.7 ± 4.4 6.3 ± 3.5 5.9 ± 3.2
Daegu 7.0 ± 4.1 5.2 ± 4.1 5.9 ± 3.5 6.3 ± 3.1
Daejeon 6.9 ± 4.0 5.4 ± 4.1 5.9 ± 3.4 5.5 ± 3.1
Gwangju 6.6 ± 4.1 5.0 ± 4.0 5.9 ± 3.4 5.3 ± 3.1
Japan Sapporo 6.5 ± 3.8 6.7 ± 4.3 5.2 ± 3.3 3.8 ± 2.5
Sendai 7.3 ± 3.8 6.1 ± 4.0 5.7 ± 3.2 5.5 ± 2.6
Tokyo 7.0 ± 3.8 6.1 ± 3.9 5.7 ± 3.3 6.7 ± 2.8
Nagoya 7.7 ± 3.8 6.5 ± 3.9 6.4 ± 3.4 6.3 ± 2.8
Osaka 7.0 ± 3.8 6.9 ± 3.8 6.0 ± 3.3 5.4 ± 2.7
Fukuoka 7.0 ± 4.0 6.7 ± 4.0 6.1 ± 3.5 4.5 ± 3.0
Taiwan Taipei 3.3 ± 3.5 5.8 ± 3.6 4.3 ± 3.8 2.7 ± 3.2
Taichung 5.1 ± 3.7 6.4 ± 3.7 6.5 ± 3.2 5.3 ± 3.3 Kaohsiung 6.4 ± 3.5 6.5 ± 4.0 5.9 ± 3.0 5.6 ± 3.0 Relative humidity (%)
Korea Seoul 57.5 ± 14.6 72.9 ± 11.7 63.8 ± 12.3 57.2 ± 13.5 Busan 62.4 ± 16.8 80.2 ± 10.2 63.8 ± 14.3 47.9 ± 15.8
Inchoen 65.2 ± 14.2 78.4 ± 10.3 67.2 ± 12.6 60.5 ± 13.5
Daegu 52.7 ± 16.0 69.3 ± 11.3 63.7 ± 12.7 51.8 ± 14.2
Daejeon 58.7 ± 14.3 74.8 ± 10.6 70.9 ± 10.3 64.0 ± 12.4
Gwangju 61.5 ± 13.8 75.6 ± 9.6 68.4 ± 10.5 64.9 ± 12.2
Japan Sapporo 65.1 ± 12.5 75.0 ± 8.7 68.9 ± 9.9 69.8 ± 9.2
Sendai 65.3 ± 14.8 81.4 ± 9.8 72.5 ± 11.6 65.2 ± 9.8
Tokyo 60.2 ± 15.4 72.4 ± 9.0 65.5 ± 13.2 50.5 ± 14.2
Nagoya 61.7 ± 14.6 72.4 ± 10.7 68.8 ± 11.4 63.7 ± 11.0
Osaka 60.1 ± 12.4 68.1 ± 9.1 65.4 ± 9.8 61.0 ± 9.9
Fukuoka 66.0 ± 13.1 73.9 ± 9.2 69.2 ± 9.9 63.4 ± 10.9
Taiwan Taipei 77.4 ± 9.4 74.1 ± 8.0 75.3 ± 9.0 77.7 ± 9.5
Taichung 75.8 ± 7.8 76.5 ± 6.9 72.7 ± 7.0 74.3 ± 8.2
Kaohsiung 75.2 ± 6.2 80.2 ± 6.6 75.6 ± 6.4 72.9 ± 7.1
5
Characteristic Country City Spring (mean ± SD)
Summer (mean ± SD)
Autumn (mean ± SD)
Winter (mean ± SD)
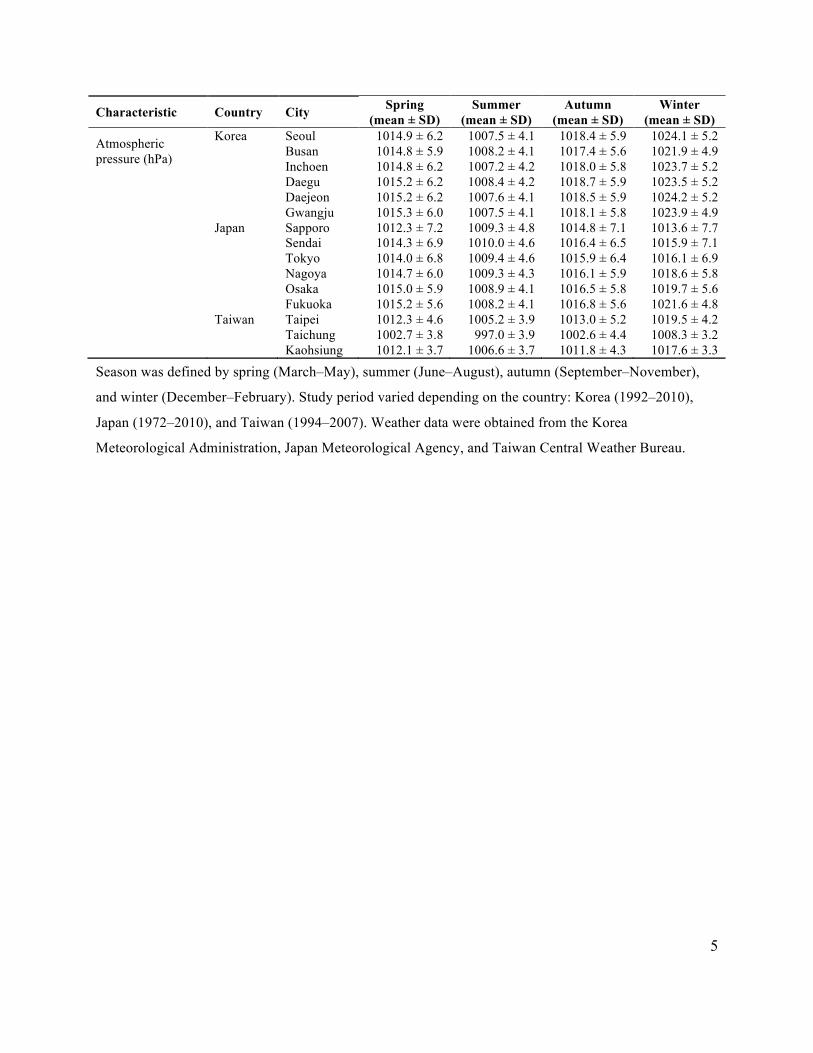
Atmospheric pressure (hPa)
Korea Seoul 1014.9 ± 6.2 1007.5 ± 4.1 1018.4 ± 5.9 1024.1 ± 5.2 Busan 1014.8 ± 5.9 1008.2 ± 4.1 1017.4 ± 5.6 1021.9 ± 4.9 Inchoen 1014.8 ± 6.2 1007.2 ± 4.2 1018.0 ± 5.8 1023.7 ± 5.2
Daegu 1015.2 ± 6.2 1008.4 ± 4.2 1018.7 ± 5.9 1023.5 ± 5.2
Daejeon 1015.2 ± 6.2 1007.6 ± 4.1 1018.5 ± 5.9 1024.2 ± 5.2
Gwangju 1015.3 ± 6.0 1007.5 ± 4.1 1018.1 ± 5.8 1023.9 ± 4.9
Japan Sapporo 1012.3 ± 7.2 1009.3 ± 4.8 1014.8 ± 7.1 1013.6 ± 7.7
Sendai 1014.3 ± 6.9 1010.0 ± 4.6 1016.4 ± 6.5 1015.9 ± 7.1
Tokyo 1014.0 ± 6.8 1009.4 ± 4.6 1015.9 ± 6.4 1016.1 ± 6.9
Nagoya 1014.7 ± 6.0 1009.3 ± 4.3 1016.1 ± 5.9 1018.6 ± 5.8
Osaka 1015.0 ± 5.9 1008.9 ± 4.1 1016.5 ± 5.8 1019.7 ± 5.6
Fukuoka 1015.2 ± 5.6 1008.2 ± 4.1 1016.8 ± 5.6 1021.6 ± 4.8
Taiwan Taipei 1012.3 ± 4.6 1005.2 ± 3.9 1013.0 ± 5.2 1019.5 ± 4.2
Taichung 1002.7 ± 3.8 997.0 ± 3.9 1002.6 ± 4.4 1008.3 ± 3.2
Kaohsiung 1012.1 ± 3.7 1006.6 ± 3.7 1011.8 ± 4.3 1017.6 ± 3.3
Season was defined by spring (March–May), summer (June–August), autumn (September–November),
and winter (December–February). Study period varied depending on the country: Korea (1992–2010),
Japan (1972–2010), and Taiwan (1994–2007). Weather data were obtained from the Korea
Meteorological Administration, Japan Meteorological Agency, and Taiwan Central Weather Bureau.

6
Table S3. The associations for temperature or sunshine duration.
Country City ΔT (°C)a
PCb of Temperature without Sunshine
(95% CI)
ΔS (hour)c
PCb of Sunshine with Temperature
(95% CI)
PCb of Sunshine without Temperature
(95% CI) Korea Seoul 5.1 7.3 (5.2, 9.4) 1.9 0.5 (-0.3, 1.4) 0.8 (-0.1, 1.7) Busan 4.0 7.4 (4.5, 10.5) 2.0 -0.2 (-1.4, 1.1) 0.8 (-0.4, 2.0) Inchoen 4.9 6.1 (2.2, 10.2) 1.9 -0.1 (-1.4, 1.3) 0.1 (-1.3, 1.5) Daegu 4.7 5.0 (1.1, 9.1) 1.9 -1.0 (-2.7, 0.8) -0.4 (-2.1, 1.3) Daejeon 4.9 9.8 (4.2, 15.7) 1.9 1.9 (-0.4, 4.2) 2.5 (0.2, 4.8) Gwangju 4.6 5.4 (-0.5, 11.6) 1.9 1.7 (-0.6, 4.2) 2.0 (-0.3, 4.4) Japan Sapporo 4.8 3.4 (0.1, 6.8) 1.9 -0.3 (-1.6, 1.1) -0.1 (-1.4, 1.3) Sendai 4.1 6.4 (1.8, 11.3) 1.8 -0.1 (-2.0, 1.9) 0.3 (-1.6, 2.2) Tokyo 3.9 5.2 (3.8, 6.6) 1.8 0.5 (-0.2, 1.1) 1.0 (0.4, 1.6) Nagoya 4.2 2.4 (-0.6, 5.5) 1.8 0.2 (-1.0, 1.5) 0.4 (-0.8, 1.6) Osaka 4.1 5.4 (3.0, 7.9) 1.7 0.1 (-0.9, 1.0) 0.6 (-0.4, 1.5) Fukuoka 3.9 4.3 (0.6, 8.2) 1.9 0.2 (-1.2, 1.7) 0.5 (-0.9, 1.9) Taiwan Taipei 2.6 6.5 (3.6, 9.5) 1.9 -0.5 (-2.1, 1.2) 1.1 (-0.4, 2.6) Taichung 2.4 8.1 (3.4, 12.9) 1.8 -0.7 (-3.2, 1.9) 1.1 (-1.2, 3.6) Kaohsiung 1.9 8.3 (4.7, 11.9) 1.7 -0.6 (-2.6, 1.4) 1.7 (0.0, 3.5) aPercent change indicates suicide risks corresponding to a ΔT (or ΔS)-increase adjusting for relative humidity,
atmospheric pressure, long-term time-trend, and month, with or without adjustment of sunshine duration (or
temperature). bΔT indicates a SD/2 of mean temperature, equal to standard deviation divided by two in mean
temperature in each city. Similarly, cΔS indicates a SD/2 of sunshine duration, equal to standard deviation divided
by two in sunshine duration in each city.

7
Table S4. City-specific associations between same-day temperature and suicide according to gender and age group.
Characteristic Category Korea Japan Taiwan city estimatea p-valueb city estimatea p-valueb city estimatea p-valueb
Gender Male K01 7.9 (5.5, 10.3) ref. J01 3.8 (-0.3, 8.0) ref. T01 6.2 (2.6, 9.9) ref. Female 5.9 (2.9, 9.0) 0.26 3.2 (-2.2, 8.8) 0.85 8.6 (4.0, 13.3) 0.31 Age 10-24 years 3.5 (-1.3, 8.5) 0.01 1.7 (-6.8, 11.0) 0.44 5.0 (-3.1, 13.8) 0.66 25-64 years 6.5 (4.2, 8.9) 0.01 3.3 (-0.6, 7.4) 0.49 7.1 (3.5, 10.8) 0.99 65≤ 11.7 (7.8, 15.9) ref. 6.0 (-1.1, 13.6) ref. 7.1 (1.8, 12.7) ref. Gender Male K02 7.5 (4.0, 11.1) ref. J04 7.4 (1.4, 13.8) ref. T02 10.2 (4.4, 16.2) ref. Female 7.7 (3.2, 12.5) 0.92 4.3 (-3.5, 12.7) 0.49 5.3 (-1.9, 13.1) 0.25 Age 10-24 years 11.6 (3.5, 20.3) 0.81 5.9 (-5.8, 19.1) 0.58 4.6 (-8.7, 19.9) 0.33 25-64 years 5.7 (2.4, 9.2) 0.02 5.6 (-0.3, 11.8) 0.40 7.9 (2.3, 13.7) 0.32 65≤ 12.8 (7.0, 18.8) ref. 10.4 (0.0, 21.8) ref. 12.9 (3.6, 23.0) ref. Gender Male K03 6.7 (2.3, 11.3) ref. J13 5.0 (3.0, 7.0) ref. T03 9.3 (4.7, 14.1) ref. Female 4.9 (-0.7, 10.9) 0.59 4.0 (1.6, 6.5) 0.46 8.2 (2.2, 14.5) 0.73 Age 10-24 years 3.4 (-6.0, 13.7) 0.39 4.5 (0.4, 8.7) 0.27 6.1 (-0.5, 18.5) 0.91 25-64 years 5.8 (1.4, 10.3) 0.48 3.9 (2.0, 5.9) 0.04 9.9 (5.3, 14.7) 0.42 65≤ 8.4 (1.7, 15.5) ref. 7.2 (4.2, 10.3) ref. 6.9 (0.1, 14.1) ref. Gender Male K04 6.4 (1.8, 11.1) ref. J23 3.6 (-0.2, 7.6) ref. Female 3.8 (-1.9, 9.8) 0.43 1.1 (-3.5, 5.9) 0.34 Age 10-24 years 6.1 (-3.4, 16.5) 0.57 4.1 (-4.2, 13.1) 0.67 25-64 years 4.4 (0.0, 9.0) 0.20 1.3 (-2.4, 5.1) 0.10 65≤ 9.5 (2.0, 17.6) ref. 6.3 (0.6, 12.3) ref. Gender Male K05 9.8 (3.5, 16.6) ref. J27 5.2 (2.2, 8.4) ref. Female 7.6 (-0.2, 16.1) 0.63 5.0 (1.2, 9.0) 0.92 Age 10-24 years 15.7 (2.1, 31.0) 0.69 6.4 (-0.6, 13.9) 0.68 25-64 years 7.1 (1.0, 13.6) 0.33 5.2 (2.2, 8.3) 0.85 65≤ 12.3 (2.5, 23.1) ref. 4.7 (0.2, 9.4) ref. Gender Male K06 7.0 (0.4, 14.0) ref. J40 2.1 (-2.5, 6.9) ref. Female 0.4 (-7.5, 9.0) 0.15 9.2 (2.9, 16.0) 0.04 Age 10-24 years 12.0 (-0.8, 26.4) 0.97 13.2 (2.2, 25.4) 0.25 25-64 years 2.1 (-4.1, 8.7) 0.13 3.0 (-1.5, 7.7) 0.56 65≤ 11.6 (-0.2, 24.8) ref. 5.4 (-2.3, 13.8) ref. aA percent change of suicide risk corresponding to a SD/2-increase of mean temperature. bp-value for the difference in the
association between suicide and temperature between men and women, or in those age 10–24 or 25–64 year compared with
≥65 years.
The abbreviations of cities stand for Seoul (K01), Busan (K02), Inchoen (K03), Daegu (K04), Daejeon (K05), Gwangju
(K06), Sapporo (J01), Sendai (J04), Tokyo (J13), Nagoya (J23), Osaka (J27), Fukuoka (J40), Taipei (T01), Taichung (T02),
and Kaohsiung (T03).

8
Figure S1. Yearly trend of suicide rates on national levels by gender in Korea, Japan, and Taiwan. Suicide and
population data were obtained from Statistics Korea, Ministry of Strategy and Finance in South Korea, Ministry of
Health, Labor and Welfare (for suicide) and Statistics Bureau, Ministry of Internal Affairs and Communications (for
population) in Japan, and Department of Statistics, Ministry of Health and Welfare (for suicide) and Department of
Statistics, Ministry of the Interior (for population) in Taiwan.

9
Figure S2. Yearly trend of suicide rates on national levels by age groups in Korea, Japan, and Taiwan. Suicide and
population data were obtained from Statistics Korea, Ministry of Strategy and Finance in South Korea, Ministry of
Health, Labor and Welfare (for suicide) and Statistics Bureau, Ministry of Internal Affairs and Communications (for
population) in Japan, and Department of Statistics, Ministry of Health and Welfare (for suicide) and Department of
Statistics, Ministry of the Interior (for population) in Taiwan.

10
Figure S3. Monthly trend of suicide in fifteen cities. Study period varied depending on the country: Korea (1992–
2010), Japan (1972–2010), and Taiwan (1994–2007). Suicide data were obtained from Statistics Korea, Ministry of
Strategy and Finance in South Korea, Ministry of Health, Labor and Welfare in Japan, and Department of Statistics,
Ministry of Health and Welfare in Taiwan.

11
Figure S4. Trends for day of the week of suicide in fifteen cities. Study period varied depending on the country:
Korea (1992–2010), Japan (1972–2010), and Taiwan (1994–2007). Suicide data were obtained from Statistics
Korea, Ministry of Strategy and Finance in South Korea, Ministry of Health, Labor and Welfare in Japan, and
Department of Statistics, Ministry of Health and Welfare in Taiwan.

12
Figure S5. Lagged effect estimates for sunshine on suicide according to single lags. PC indicates percent change of
suicide risk corresponding to a SD/2-increase of mean sunshine, adjusting for temperature, relative humidity,
atmospheric pressure, long-term time-trend, and month.
13
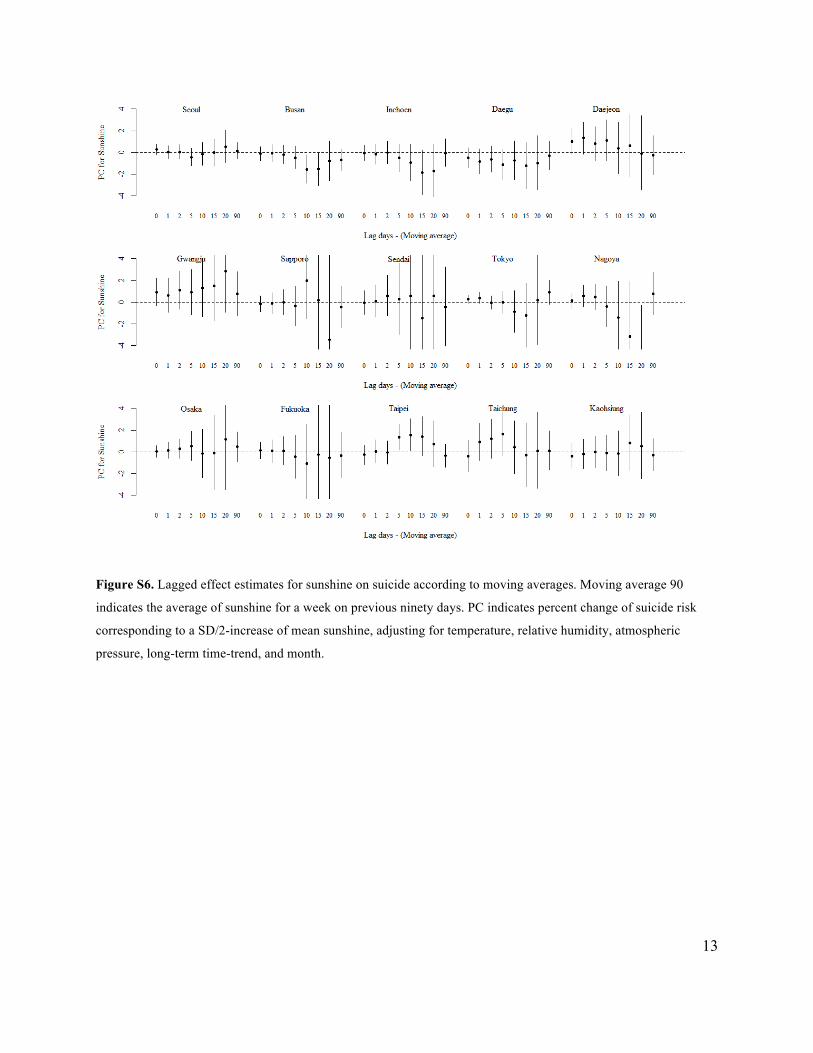
Figure S6. Lagged effect estimates for sunshine on suicide according to moving averages. Moving average 90
indicates the average of sunshine for a week on previous ninety days. PC indicates percent change of suicide risk
corresponding to a SD/2-increase of mean sunshine, adjusting for temperature, relative humidity, atmospheric
pressure, long-term time-trend, and month.

14
Figure S7. Lagged effect estimates for temperature on suicide according to single lags. PC indicates percent change
of suicide risk corresponding to a SD/2-increase of mean temperature, adjusting for sunshine duration, relative
humidity, atmospheric pressure, long-term time-trend, and month.

15
Figure S8. Lagged effect estimates for temperature on suicide according to moving averages. PC indicates percent
change of suicide risk corresponding to a SD/2-increase of mean temperature, adjusting for sunshine duration,
relative humidity, atmospheric pressure, long-term time-trend, and month.