supplemental information - the royal society of … information measurement of cancer cell nuclei...
TRANSCRIPT

Supplemental Information Measurementofcancercellnucleidispersion
Segmentation of the cancer cell nuclei was accomplished by first 3D
interpolation since the x, y and z resolutions are not equal. After interpolation,
one voxel in our image stack represents a volume of 30.90 µm3. In order to
reduce noise, a 3D Gaussian kernel of 5 pixel radius with ( is the
standard deviation of the Gaussian function) is convolved to the original
image stack, estimating that the radius of a cancer cell nucleus is ~5-7 pixels
(~10-14 microns). To enhance the edges between closely packed nuclei, a
Laplacian kernel of 5 pixel radius with is then convolved on the
denoised image stack. After edge enhancement, a 3D binary image is created
based on its histogram. An ance transformation is applied to the binary image
and then the scale invariant seed finding approach45 is applied to detect the
center of the cell nuclei. Finally, the Evolving Generalized Voronoi Diagram46
was used to segment the nuclei based on the detected seeds. Once the
nuclei are segmented, the number of nuclei (N) and their locations (xi) can be
determined.
In our computation, numbers of spheroids are first determined before
calculating the dispersion. After the nuclei are segmented, we produce the 3D
histogram of nuclei distribution in the 3D spatial domain. The binning is done
by a volume of 17x17x5 voxel grids. Then we apply a Gaussian kernel of 5
pixel radius with *. We find the local maximum in the 3D histogram and
decide how many spheroids in a given images. The situation of one spheroid
and two spheroids (Fig. S3). A mask is created based on the convolved
image, shown by the blue contours (Fig. S3). Any dots outside of the 3D mask
will be considered as outlier. The grouping of nuclei to different clusters in 3D
is also illustrated (Fig. S4).
Once the nuclei are segmented, we need to measure the dispersion of
a given spheroid. First, we need to determine the center of spheroid. If there
are N nuclei in a given spheroid, the geometric centers of nuclei are
1.0
1.5
2.5
Electronic Supplementary Material (ESI) for Integrative BiologyThis journal is © The Royal Society of Chemistry 2013

rep
sph
sph
num
resented
heroid cent
Then w
heroid cent
At last,
The ab
mber of nuc
by ( , ,
ter:
we compu
ter, which i
, we may d
bove formu
clei; howev
)
ute the st
is given by
determine t
ulation is
ver, it is se
. We m
tandard de
y:
the dispers
not sensit
ensitive to
may calcul
eviation of
sion of a g
ive to the
the outliers
late their
f nuclei c
iven spher
shape of
s.
mean as
centers to
roid by:
spheroid
the
the
and
Electronic Supplementary Material (ESI) for Integrative BiologyThis journal is © The Royal Society of Chemistry 2013

Supplemental figure legends Fig. S1 A549 cells were grown in microwells on 2D from a sparse density of
800 cells/cm2 and cultured in the presence of concentration of control
(DMSO), 0.04μM, 0.16μM, 0.63μM, 2.5μM, 10μM. Cells were imaged after 72
h incubation using 10x objective (Olympus IX51). A. AZD 0530 B. A83-01.
Fig. S2 A549 cells were grown on 2D from a sparse density of 800 cells/cm2
and cultured in the presence of 2.5 M test compounds mixed in culture
medium. Cells were imaged after 72 h incubation using 10x objective
(Olympus IX51). A. DMSO control. B. MK-2206. C. A83-01. D. LY 364947. E.
SB 431542. F. SD-208. G. BMS-599626, H. CI-1033. I. Gefitinib. J. BMS-
536924. K. PD 0325901. L. Masitinib. M. AZD 0530. N. PP1.
Fig. S3 Projection of 3D histogram into X-Y plane. Purple dots in the left
images are detected local maxima. A. One spheroid is detected. B. Two
spheroids are detected. The blue contours in the right images show the
boundary of the mask used to determine if a nucleus is an outlier.
Fig. S4 Detection of two spheroids in image analysis. A. Two clusters are
detected at 0 h and marked with red and blue to represent the nuclei from two
different spheroids. The outliers are represented by black nuclei. B.
Segmentation of two spheroids at 12 h.
Fig. S5 Evaluation of drug effects on HUVEC monolayer growth. A and B.
Representative fluorescence images of HUVEC monolayers in the presence
of drug LY 364947 at 0 h and 36 h, respectively. C. Plots of normalized
HUVEC cell number for each compound at the highest dose used in this
study. Normalized cell number is the ratio of cell number at 36 h to that at 0 h.
Electronic Supplementary Material (ESI) for Integrative BiologyThis journal is © The Royal Society of Chemistry 2013

Supplemental figures
Fig. S1
Electronic Supplementary Material (ESI) for Integrative BiologyThis journal is © The Royal Society of Chemistry 2013
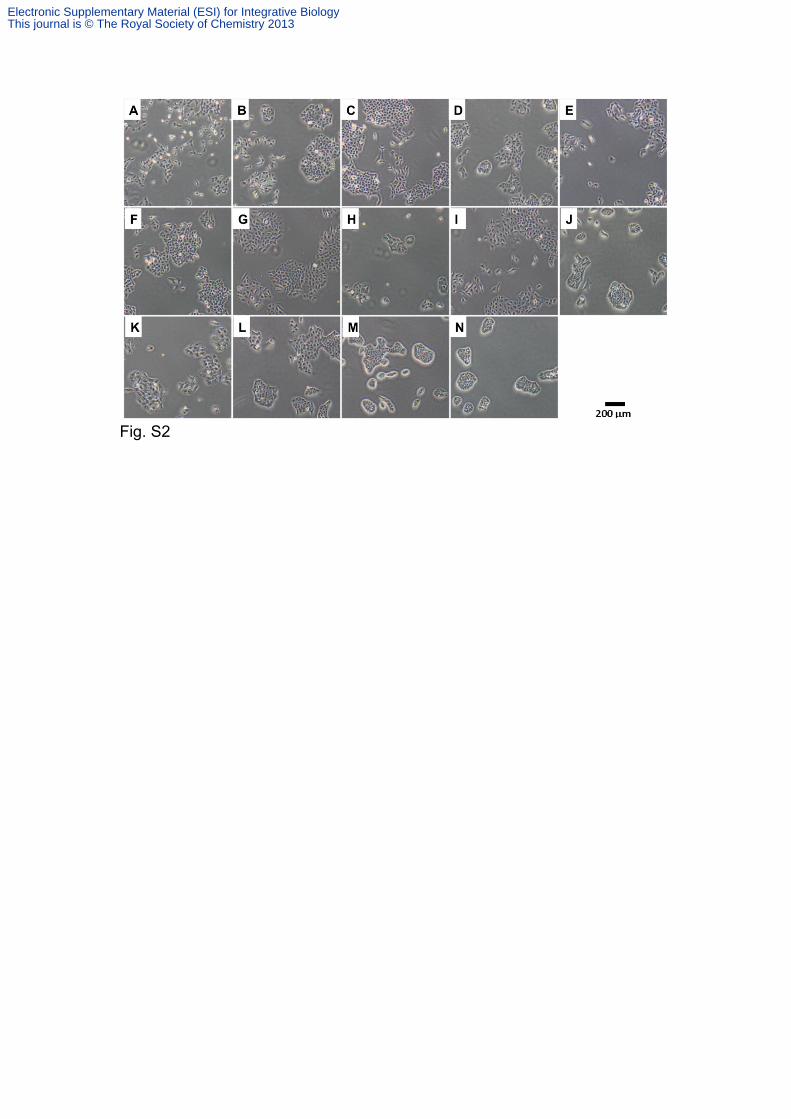
Fig. S2
Electronic Supplementary Material (ESI) for Integrative BiologyThis journal is © The Royal Society of Chemistry 2013

Fig. S3
Electronic Supplementary Material (ESI) for Integrative BiologyThis journal is © The Royal Society of Chemistry 2013

Fig. S4
Electronic Supplementary Material (ESI) for Integrative BiologyThis journal is © The Royal Society of Chemistry 2013

Fig. S5
Electronic Supplementary Material (ESI) for Integrative BiologyThis journal is © The Royal Society of Chemistry 2013