supplemental information - home: cell press · 2015-05-29 · supplemental information . ......
TRANSCRIPT

Cell Metabolism, Volume 21
Supplemental Information
Diet-Induced Obese Mice Retain Endogenous Leptin Action
Nickki Ottaway, Parinaz Mahbod, Belen Rivero, Lee Ann Norman, Arieh Gertler, David A. D’Alessio,
and Diego Perez-Tilve

Supplemental data.
Figure S1
0 1 2 3 4 5 6 70
10
20
30
40
Time (days)
Ene
rgy
Inta
ke (k
cal)
db/db Vehdb/db PLA
ob/ob Vehob/ob PLA
wt/wt Vehwt/wt PLA
**
0 1 2 3 4 5 6 70
10
20
30
Time (days)
Ene
rgy
Inta
ke (k
cal)
Lean VehLean PLA 1
DIO VehDIO PLA 1
0 1 2 3 4 5 6 70
10
20
30
Time (days)
Ene
rgy
Inta
ke (k
cal)
Mc4r+/+ Veh Mc4r-/- VehMc4r+/+ LA Mc4r-/- LA
**
0 1 2 3 4 5 6 70
10
20
30
Time (days)
Ene
rgy
Inta
ke (k
cal)
Lean PLA 3Lean Veh
DIO PLA 3DIO Veh
* **
* * * *
0 1 2 3 4 5 6 70
10
20
30
Time (days)
Ene
rgy
Inta
ke (k
cal) Lean Veh
Lean LA
DIO VehDIO LA
*#*
#
*#
*#
0 1 2 3 4 5 6 70
10
20
30
Time (days)
Ene
rgy
Inta
ke (k
cal)
Mc4r-/- PLAMc4r-/- Veh
Mc4r+/+ PLAMc4r+/+ Veh
0 1 2 3 4 5 6 70
10
20
30
Time (days)
Ene
rgy
Inta
ke (k
cal)
Lean VehLean PLA 10
DIO VehDIO PLA 10
******
# #
a b c
d e f g
0 1 2 3 4 5 6 70
10
20
30
40
50
Time (days)
BW
(g) Mc4r-/- PLA
Mc4r-/- VehMc4r+/+ PLAMc4r+/+ Veh
0 1 2 3 4 5 6 70
10
20
30
Time (days)
Ene
rgy
Inta
ke (k
cal)
*
0 1 2 3 4 5 6 7-6
-3
0
3
6
Time (days)
ΔB
W (g
) * * **#
0 1 2 3 4 5 6 70
50
100
150
200
Time (days)
Ene
rgy
Inta
ke (k
cal)
**
*
h i j
k

Figure S1 (related to Figures 1-3): (a) Effect on daily energy intake of peripheral
administration of 20K-PEG leptin antagonist (PLA, 3 mg/kg, ip, once daily) in chow fed
db/db, ob/ob or lean wildtype control mice.
(b,c) Effect on daily energy intake of peripheral administration of 20K-PEG leptin
antagonist (PLA, 3 nmol/kg, ip, once daily, b) or Icv infusion of leptin antagonist (LA,
8ug/day, icv, c) in chow fed obese Mc4r-/- or wildtype littermate control male mice.
(d-g) Effect on daily energy intake of peripheral administration of 20K-PEG leptin
antagonist (PLA, 3 nmol/kg, ip, once daily) in chow fed lean (5-14 week old) Mc4r-/- or
wildtype littermate control male mice.
(h-j) Effect on daily energy intake of peripheral administration of 20K-PEG leptin
antagonist (PLA, 1 (h), 3 (i) or 10 (j) nmol/kg, ip, once daily) in lean and DIO mice.
(k) Effect on daily energy intake of Icv infusion of a leptin antagonist (LA, 8 ug/day) in
lean and DIO mice.
(a) * P<0.05 wt/wt Veh vs. wt/wt PLA; (b, c) *P<0.05 Mc4r+/+ Veh vs. Mc4r+/+ PLA.
(d-g) *P<0.05 Mc4r+/+ Veh vs. Mc4r+/+ PLA; # P<0.05 Mc4r-/- Veh vs. Mc4r-/- PLA;
(f), P<0.05 treatment x time, Mc4r-/- Veh vs. Mc4r-/- PLA.
(h-k) *P<0.05 Lean Veh vs. Lean PLA or LA; # P<0.05 DIO Veh vs. DIO PLA or LA.
Data are presented as mean ± SEM. n=8-5; 2-way RM ANOVA followed by Sidak test.

Figure S2.
0
10
20
30E
nerg
y In
take
(kca
l)
*#*
# *#
*#
##
#
-1.0
-0.5
0.0
0.5
1.0
ΔB
W (g
)
*Veh PLA
DIO
a b
0
10
20
30E
nerg
y In
take
(kca
l)Veh PLA
DIO
c d
0
50
100
150
Ene
rgy
Inta
ke (k
cal) Lean Veh
DIO VehLean LA
DIO LA*#
*#
*#
##
0 1 2 3 4 5 6 7-6
-3
0
3
6
Time (days)
ΔB
W (g
)
****### #
#
0 1 2 3 4 5 6 720
30
40
50
60
70
Time (days)
BW
(g)
e f

Figure S2 (related to Figure 4): (a,b) Effect on energy intake (a) and body weight
change (b) of a single peripheral injection of 20K-PEG leptin antagonist (PLA, 3 mg/kg,
ip, -12h) in DIO mice; (c-f) Effect of 7-day icv infusion of a leptin antagonist (LA, 8
ug/day) in lean and DIO mice on energy intake (c and d, cumulative and daily values,
respectively), total BW (e) or BW change (f). Levels of pSTAT3 levels in the ARC of
these mice are shown in Figure S3 and represented in Figure 4e,f.
(b) * P<0.05. (c-f) *P<0.05 Lean Veh vs. Lean LA; #P<0.05 DIO Veh vs. DIO LA. (a,b)
n=12-13, t-Student test; (c-f). Data are presented as mean ± SEM. n=6, 2-way RM
ANOVA, followed by Sidak test.
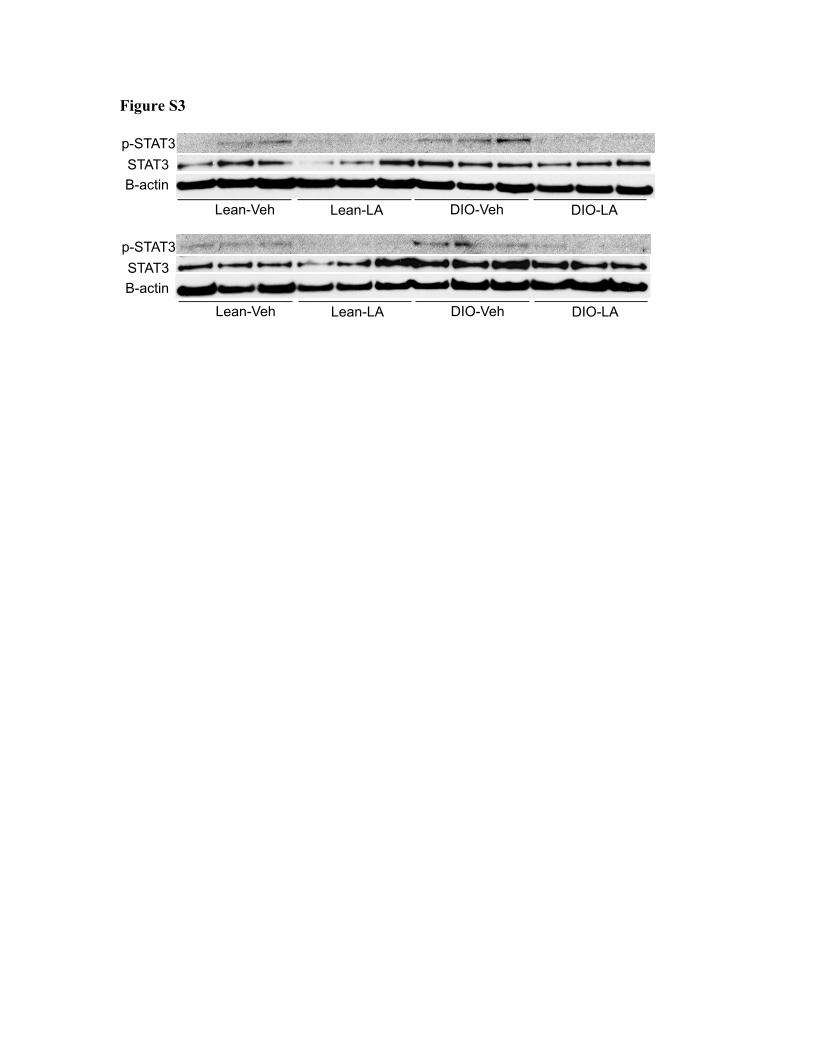
Figure S3
Lean-Veh Lean-LA DIO-Veh DIO-LA
Lean-Veh Lean-LA DIO-Veh DIO-LA
p-STAT3 STAT3 B-actin
p-STAT3 STAT3 B-actin

Figure S3 (related to Figure 4): Inmunoblots showing p-STAT3 (first and fourth lane),
total STAT3 (second and fifth lane) and beta actin (third and sixth lane) levels in the
ARC of lean and DIO mice treated icv with vehicle or LA (8ug/day, 7-d). The
densitometric analysis of the bands is depicted in Figure 4e, f. The impact of the
treatment on energy intake and body weight is depicted in Figure S2c-f.
Supplemental Experimental Procedures.
Mice: All mice were purchased from Jackson Laboratories (Bar Harbor, ME) and were
acclimated for at least one week before the study. Mice were single-housed during the
study and placed in a 12-h light, 12-h dark cycle at 22 °C with free access to food and
water. (See extended experimental procedures)
C57/B6 male mice were obtained from Jackson Laboratories (Bar Harbor, ME) at 8-
weeks of age and maintained on a standard chow 17% fat (Teklad; Harlan) or a high-
sucrose diet with 58% kcal from fat (Research Diets #D12331, New Brunswick, NJ), for
8 months. LoxTbMc4r (KO) mice were ordered from Jackson Laboratory (Stock
#006414), bred in-house as heterozygotes to obtain homozygous mutants and wildtype
littermates and maintained on standard chow. Leptin receptor deficient (db/db) (Stock
#000642), leptin deficient (ob/ob) (Stock #000632) and wildtype controls of ob/ob mice
were ordered at 10 weeks of age from Jackson Laboratory and were maintained on
standard chow.
Leptin antagonists: Native (LA) and 20k-pegylated (PLA) mouse PLA (mutant
D23L/L39A/D40A/F41A) were synthetized and characterized as previously described
The D23L mutation in the antagonist increases the affinity of the antagonists toward
LEPR by 60-fold and has a 10 to 30-fold higher in vivo weight-gain effect compared to
MLA (Shpilman et al., 2011), and pegylation prolongs the half-life in circulation, which
greatly improves its efficacy when administered peripherally (Chapnik et al., 2013;
Shpilman et al., 2011; Solomon et al., 2014)
Intracerebroventricular Infusions: Mice were anesthetized with 2% isoflurane in oxygen.
Stainless steel cannulas were stereotaxically placed in the lateral cerebral ventricle using
the following coordinates: 0.7 mm posterior to bregma, 1.2 mm lateral to the mid-sagittal
suture, and 2.5 mm ventrally from the surface of the brain. The cannula was connected to
an osmotic minipump (1007D; Alzet, Cupertino, CA) filled with vehicle (PBS) or LA
placed subcutaneously through a polyvinyl tube. The cannulas were secured to the skull
and the skin was closed using Vetbond (3M. St. Paul, MN). The animals received a single
s.c. dose of 5 mg/kg of meloxiocam (Metacam, Boehringer Ingelheim, Ingelheim,
Germany).
Gene expression analysis: The arcuate nucleus was dissected from the frozen
hypothalamic block and the RNA was extracted (RNAqueous-Micro kit). An aliquot of
RNA was run in 1% agarose gel to confirm the integrity. cDNA was synthetized with
SuperScript® III First-Strand Synthesis kit (Invitrogen, Life Technologies) after DNAse I
treatment (Invitrogen, Life Technologies) and qPCR was performed using commercially
available gene-specific Taqman® probes following manufacturer instructions
(Invitrogen, Life Technologies). Water-blank samples from the cDNA synthesis were
included in the qPCR reaction. Beta actin was used as housekeeping gene and the relative
quantification was performed using the Q-gen software (Muller et al., 2002)
Inmunoblot: The arcuate nucleus was dissected immediately after euthanasia and frozen
in liquid nitrogen. The tissue was homogenized in lysis buffer containing Halt protease
and phosphatase inhibitor cocktail (Thermo Fisher Scientific Inc., Rockford, IL USA),
0.5mM PMSF and 0.1mM benzamidine (Sigma-Aldrich, St. Louis, MO, USA) using a
Tissuelyser (Quiagen). The samples were rocked at 4 C for 30 min, passed through a 28-g
syringe neddle, centrifuged for 15 min at 4 C and 23,000 × g, and the supernatants
collected in a fresh tube. Protein concentrations were measured using a Pierce BCA
method protein assay kit (Thermo Fisher Scientific Inc). 45ug separated by
electrophoresis in denaturing conditions using 10% Bis-Tris gels pre-cast polyacrylamide
gels (Invitrogen, Life Technologies) and the proteins were transferred overnight to
polyvinylidene difluoride (PVDF) membranes previously incubated in methanol for 3
minutes. The membranes were cut, blocked in 5% nonfat dried milk (20 mm Tris, pH 7.6;
0.9% NaCl; 0.1% Tween 20) and independently incubated overnight at 4C with p-STAT3
(1:1000, Cell Signaling Technology, MA) or beta actin antibody (1:5000, Cell Signaling).
Membranes were then washed and incubated with secondary antibodies (antirabbit-
horseradish peroxidase coupled, 1:10,000; Cell Signaling), washed and developed by
enhanced chemiluminescence (ECL2 Plus, Thermo Fisher Scientific Inc) and x-ray films
(Denville Scientific). The membrane containing p-STAT3 was then washed three times,
blocked and incubated overnight at 4C with an antibody against total STAT3 (Cell
Signaling, 1:2000) and revealed as described above. Films were scanned and
densitometry was assessed using ImageJ 1.48v (http://imagej.nih.gov/ij).