supplemental information accurate high … volume 21 supplemental information accurate...
TRANSCRIPT
Structure, Volume 21
Supplemental Information
Accurate High-Throughput Structure Mapping
and Prediction with Transition Metal Ion FRET
Xiaozhen Yu, Xiongwu Wu, Guillermo A. Bermejo, Bernard R. Brooks, and Justin W.
Taraska
Inventory of Supplemental Information
Supplementary Figure S1, related to Figure 2. Anisotropy values for fluorophore-labled
MBP. Anisotropy measured for MBP proteins labeled with mBBr (filled bars) or F5M
(open bars) without and with 14 μM maltose.
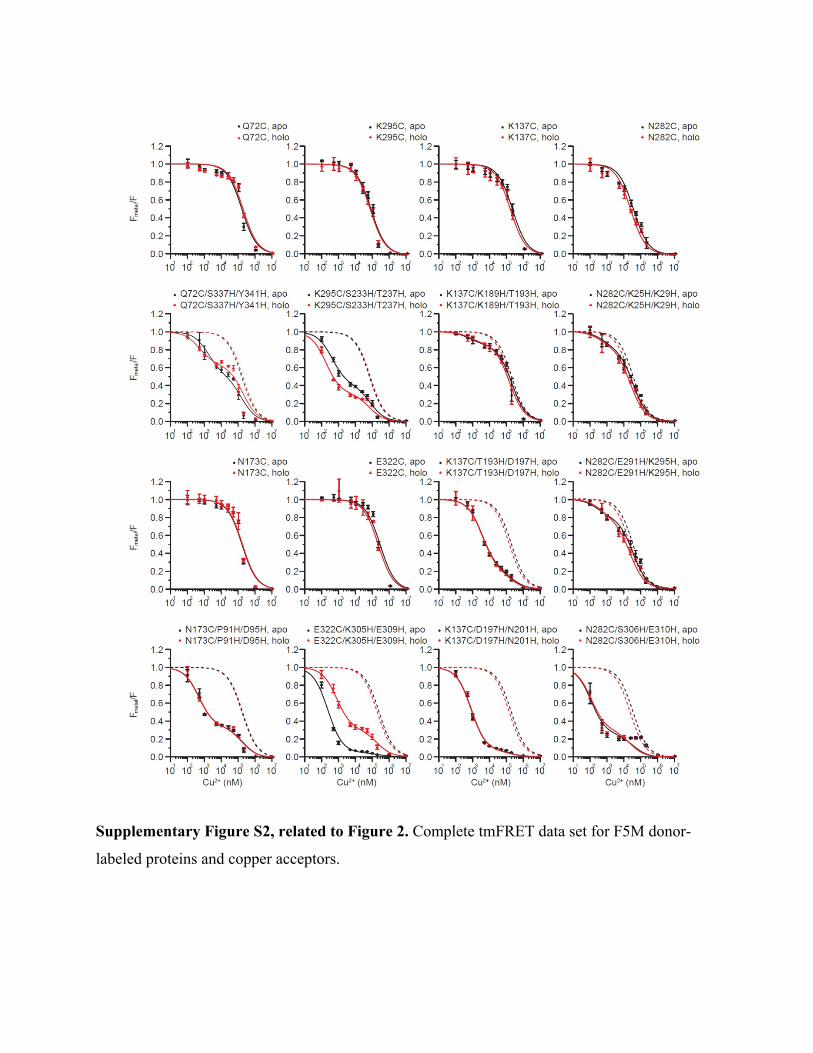
Supplementary Figure S2, related to Figure 2. Complete tmFRET data set for F5M donor-
labeled proteins and copper acceptors.
Supplementary Figure S3, related to Figure 2. Complete tmFRET data set for F5M donor-
labeled proteins and nickel acceptors.
Supplementary Figure S4, related to Figure 2. Complete tmFRET data set for mBBr
donor-labeled proteins and copper acceptors.
Supplementary Figure S5, related to Figure 2. Complete tmFRET data set for mBBr
donor-labeled proteins and nickel acceptors.
Supplementary Figure S6, related to Figure 3. Lifetime measurements of transition metal
ion induced-quenching. (a) Fluorescence lifetime of the K137C/K189H/T193H mutant
labeled with mBBr without (black) and with (red) 100 μM copper. (b) Fluorescence lifetime
of K137C/D197H/N201H mutant labeled with mBBr without (black) and with (red) 100 μM
copper. (c) Metal-dependent changes in liftetime for both mutants. (d) Comparison of

FRET values obtained from steady-state measurements and values generated from the
lifetime measurements.
Supplementary Figure S7, related to Figure 3. Ligand-binding titration curve with
increasing concentrations of maltose while keeping protein (E322C/K305H/E309H) and
copper concentration (10 mM) constant.
Supplementary Figure S8, related to Figure 4. Simulations of MBP conformational
transitions. A total of 6 simulations were performed under different conditions: with FRET
constraints and guiding force both off (green), FRET constraints on and guiding force off
(red), FRET constraints off and guiding force on (black), FRET constraints and guiding
force both on, with different guiding factors (0.5 - blue, 1.0 - cyan and 1.5 - magenta). The
RMSD between the simulated structures and the APO state crystal structure (protein data
bank:1OMP) is plotted.
Supplementary Figure S9, related to Figure 4. Simulations of MBP conformational
transitions. 100 structures generated with Xplor-NIH using rigid body/torsion angle
simulated annealing. Simulations without or with 4 tmFRET derived FRET constraints are
shown. The RMSD between the simulated structures and the APO state crystal structure
(protein data bank:1OMP) is plotted.

Supplementary Figure S1, related to Figure 2. Anisotropy values for fluorophore-labled MBP.
Anisotropy measured for MBP proteins labeled with mBBr (filled bars) or F5M (open bars)
without and with 14 M maltose.
Supplementary Figure S2, related to Figure 2. Complete tmFRET data set for F5M donor-
labeled proteins and copper acceptors.

Supplementary Figure S3, related to Figure 2. Complete tmFRET data set for F5M donor-
labeled proteins and nickel acceptors.

Supplementary Figure S4, related to Figure 2. Complete tmFRET data set for mBBr donor-
labeled proteins and copper acceptors.

Supplementary Figure S5, related to Figure 2. Complete tmFRET data set for mBBr donor-
labeled proteins and nickel acceptors.

Supplementary Figure S6, related to Figure 3. Lifetime measurements of transition metal ion
induced-quenching. (a) Fluorescence lifetime of the K137C/K189H/T193H mutant labeled with
mBBr without (black) and with (red) 100 μM copper. (b) Fluorescence lifetime of
K137C/D197H/N201H mutant labeled with mBBr without (black) and with (red) 100 μM
copper. (c) Metal-dependent changes in liftetime for both mutants. (d) Comparison of FRET
values obtained from steady-state measurements and values generated from the lifetime
measurements.

Supplementary Figure S7, related to Figure 3. Ligand-binding titration curve with increasing
concentrations of maltose while keeping protein (E322C/K305H/E309H) and copper
concentration (10 mM) constant.

Supplementary Figure S8, related to Figure 4. Simulations of MBP conformational
transitions. A total of 6 simulations were performed under different conditions: with FRET
constraints and guiding force both off (green), FRET constraints on and guiding force off (red),
FRET constraints off and guiding force on (black), FRET constraints and guiding force both on,
with different guiding factors (0.5 - blue, 1.0 - cyan and 1.5 - magenta). The RMSD between the
simulated structure and the APO state crystal structure (protein data bank:1OMP) is plotted.

Supplementary Figure S9, related to Figure 4. Simulations of MBP conformational
transitions. 100 structures generated with Xplor-NIH using rigid body/torsion angle simulated
annealing. Simulations without or with 4 tmFRET derived FRET constraints are shown. The
RMSD between the simulated structures and the APO state crystal structure (protein data
bank:1OMP) is plotted.