supplemental figure 1 - nature research...supplemental figure 1 0 0.05 0.1 0.15 0.2 0.25 0.3 01 23 4...
TRANSCRIPT

Supplemental figure 1
0
0.05
0.1
0.15
0.2
0.25
0.3
0 1 2 3 4
Copy
num
ber ratio re
lativ
e to beta‐actin
Series1
Series2
Series3
PC3 BP DU145 BP PC3 CMV DU145 CMV
Supplemental figure 1. qPCR to quantify the relative copy number of TMEM135‐CCDC67 breakpoint and pCMV vector sequence in the genome of transformed cancer cells. One microgram of genome DNA of PC3 BP (PC3 cells transformed with pCMV‐TMEM135int13‐CCDC67int9), or DU145 BP (DU145 cells transformed with pCMV‐TMEM135int13‐CCDC67int9), or PC3 CMV (PC3 cells transformed with pCMVscript) or DU145 CMV (DU145 cells transformed with pCMVscript) was quantified for ‐actin or TMEM135‐CCDC67 breakpoint through qPCR using the primers listed in Supplemental table 2. The copy numbers of BP and ‐actin were fitted with standard curves generated with serial titrations of known copy numbers of BP and ‐actin, respectively. The BP/‐actin ratios were plotted. The CMV/β‐actin ratios were plotted similarly.
Nature Biotechnology: doi:10.1038/nbt.3843
TMEM135 int 13 CCDC67 int 9
1025 bp 1234 bp
CMV IE94
TMEM intron 13 EGFP‐tk CCDC67 intron 9
Splice acceptor Splice donor
584 bp 561 bp
CMV IE94 TMEM intron 13 EGFP‐tk CCDC67 intron 9
967 bp 1211 bp
+
Pre‐integration
Post‐integration
Genome
Virus
Genome
Pre‐integration
Post‐integration
ASupplemental figure 2
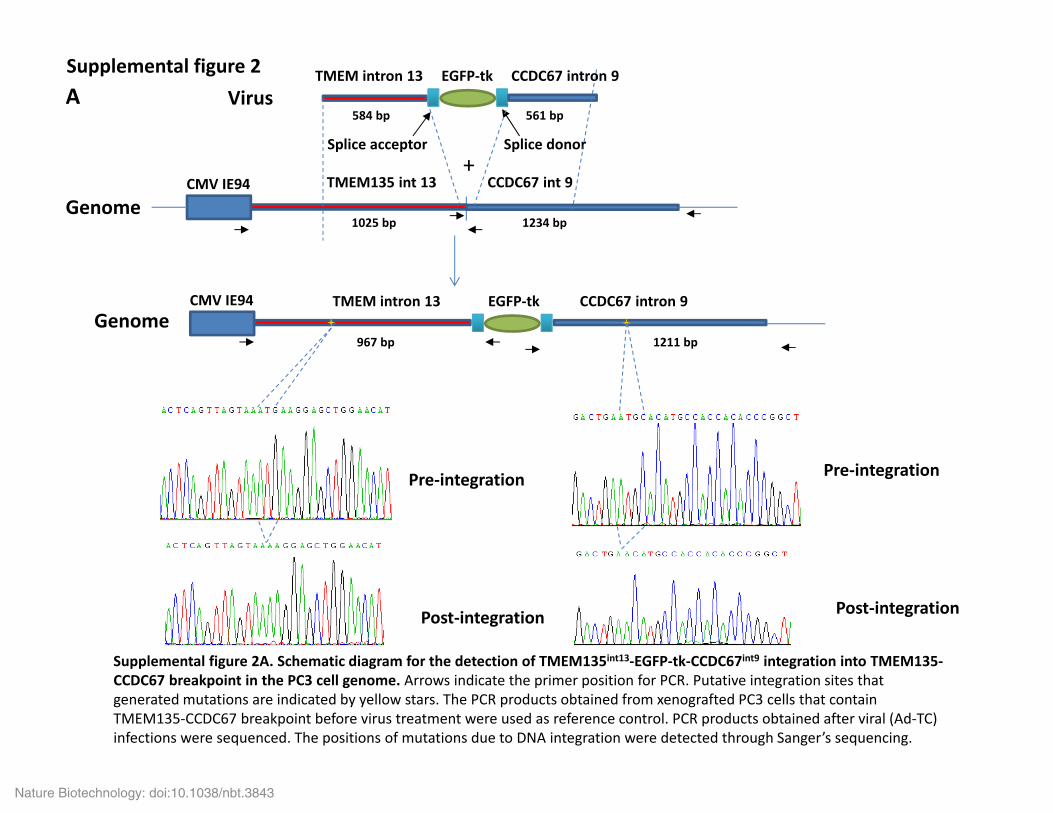
Supplemental figure 2A. Schematic diagram for the detection of TMEM135int13‐EGFP‐tk‐CCDC67int9 integration into TMEM135‐CCDC67 breakpoint in the PC3 cell genome. Arrows indicate the primer position for PCR. Putative integration sites that generated mutations are indicated by yellow stars. The PCR products obtained from xenografted PC3 cells that contain TMEM135‐CCDC67 breakpoint before virus treatment were used as reference control. PCR products obtained after viral (Ad‐TC) infections were sequenced. The positions of mutations due to DNA integration were detected through Sanger’s sequencing.
Nature Biotechnology: doi:10.1038/nbt.3843
PC3 BP + Ad‐TC PC3 CMV + Ad‐TC DU145 BP + Ad‐TC DU145 CMV + Ad‐TC
Cas9D10A‐RFP
EGFP‐tk
B
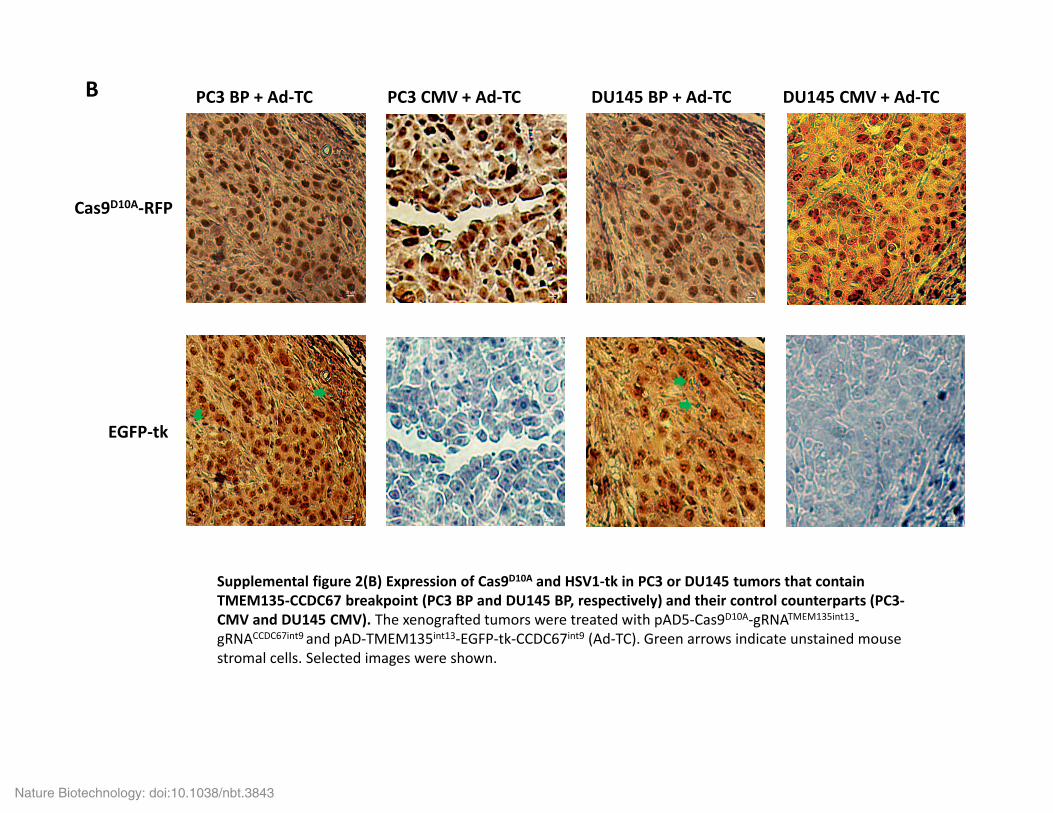
Supplemental figure 2(B) Expression of Cas9D10A and HSV1‐tk in PC3 or DU145 tumors that contain TMEM135‐CCDC67 breakpoint (PC3 BP and DU145 BP, respectively) and their control counterparts (PC3‐CMV and DU145 CMV). The xenografted tumors were treated with pAD5‐Cas9D10A‐gRNATMEM135int13‐gRNACCDC67int9 and pAD‐TMEM135int13‐EGFP‐tk‐CCDC67int9 (Ad‐TC). Green arrows indicate unstained mouse stromal cells. Selected images were shown.
10 µM 10 µM 10 µM
10 µM 10 µM 10 µM 10 µM
10 µM
Nature Biotechnology: doi:10.1038/nbt.3843

HUH7 + Ad‐MF + G HEP3B + Ad‐MF + G HUH7 + Ad‐MF + PBS HUH7 + Ad‐TC + G
Cas9D10A‐RFP
EGFP‐tk
C
Supplemental figure 2C. Expression of Cas9D10A and HSV1-tk in HUH7 or HEP3B tumors treated with Ad-TC or pAD5-Cas9D10A-gRNAMAN2A1int13-gRNAFERint14/pAD-MAN2A1int13-EGFP-tk-FERint14 (Ad-MF). Green arrows indicate unstained mouse stromal cells. Selected images were shown.
10 µM 10 µM 10 µM 10 µM
10 µM 10 µM 10 µM 10 µM
Nature Biotechnology: doi:10.1038/nbt.3843

Tumor: PC3 CMV DU145 CMV HUH7Virus: Ad‐TC Ad‐TC Ad‐TC
Tumor: PC3 BP DU145 BP HUH7Virus: Ad‐TC Ad‐TC Ad‐MF
D
Supplemental figure 2D. Genome therapy induced apoptosis of xenografted cancers that contain fusion gene breakpoints. Terminal deoxynucleotidyl transferase (TdT) dUTP Nick-End Labeling (TUNEL) assays were performed on the PC3 BP, DU145 BP, PC3 CMV, DU145 CMV, or HUH7 xenografted cancers treated with either Ad-TC or Ad-MF.
10 µM 10 µM 10 µM
10 µM 10 µM 10 µM
Nature Biotechnology: doi:10.1038/nbt.3843

‐100 bp
MAN2A1‐FER‐FER‐
‐100 bp
MAN2A1‐FER‐
Β‐actin‐ GAPDH‐
HUH7
HEP
3B
HUH7
HEP
3B
‐200 bp
‐1600 bp
‐500 bp
‐100 bp
TMEM135‐CCDC67 GBP‐
Genome Β‐actin‐
TMEM135‐CCDC67 BP‐
Β‐actin‐
A BPC
3 BP
DU14
5 BP
PC3 CM
VDU14
5 CM
V
PC3 BP
DU14
5 BP
PC3 CM
VDU14
5 CM
V
Supplemental figure 3: Full view of figures 2B and 5B. (A) Full view of figure 2B. (B) Full view of figure 5B.
Supplemental figure 3
‐113 Kd
‐33 Kd
Nature Biotechnology: doi:10.1038/nbt.3843
1
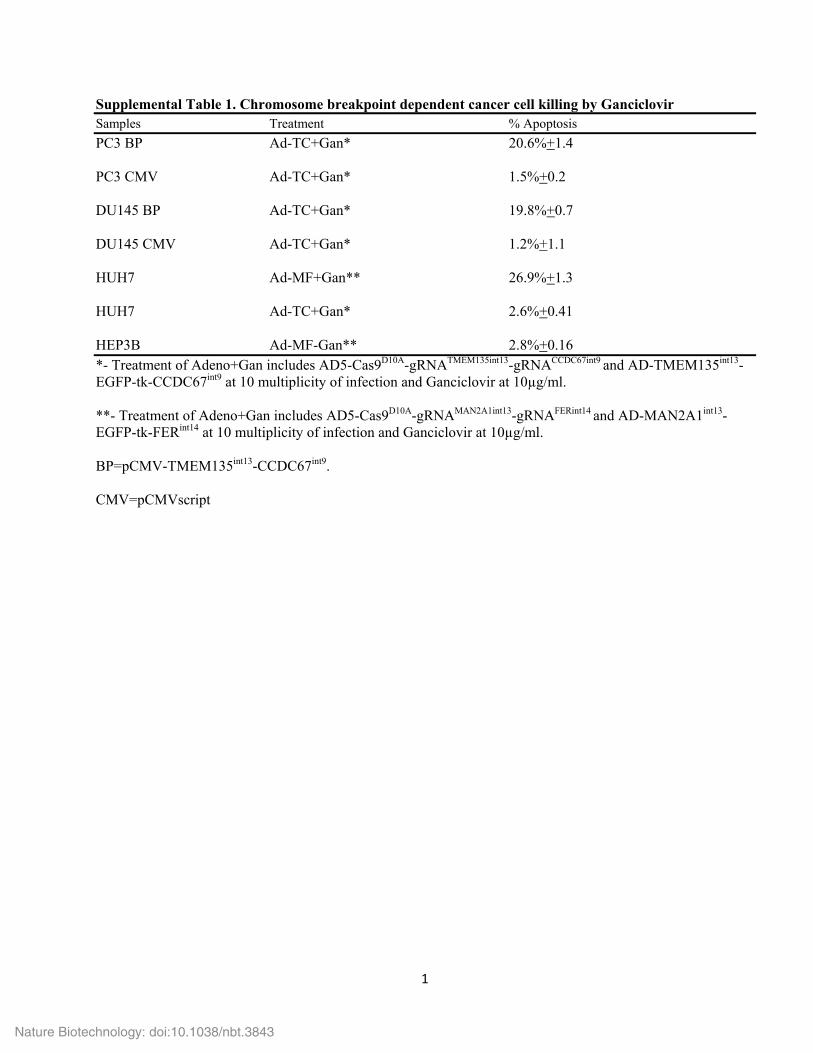
Supplemental Table 1. Chromosome breakpoint dependent cancer cell killing by Ganciclovir Samples Treatment % Apoptosis PC3 BP Ad-TC+Gan* 20.6%+1.4 PC3 CMV Ad-TC+Gan* 1.5%+0.2 DU145 BP Ad-TC+Gan* 19.8%+0.7 DU145 CMV Ad-TC+Gan* 1.2%+1.1 HUH7 Ad-MF+Gan** 26.9%+1.3 HUH7 Ad-TC+Gan* 2.6%+0.41 HEP3B Ad-MF-Gan** 2.8%+0.16 *- Treatment of Adeno+Gan includes AD5-Cas9D10A-gRNATMEM135int13-gRNACCDC67int9 and AD-TMEM135int13-EGFP-tk-CCDC67int9 at 10 multiplicity of infection and Ganciclovir at 10µg/ml. **- Treatment of Adeno+Gan includes AD5-Cas9D10A-gRNAMAN2A1int13-gRNAFERint14 and AD-MAN2A1int13-EGFP-tk-FERint14 at 10 multiplicity of infection and Ganciclovir at 10µg/ml. BP=pCMV-TMEM135int13-CCDC67int9. CMV=pCMVscript
Nature Biotechnology: doi:10.1038/nbt.3843
2
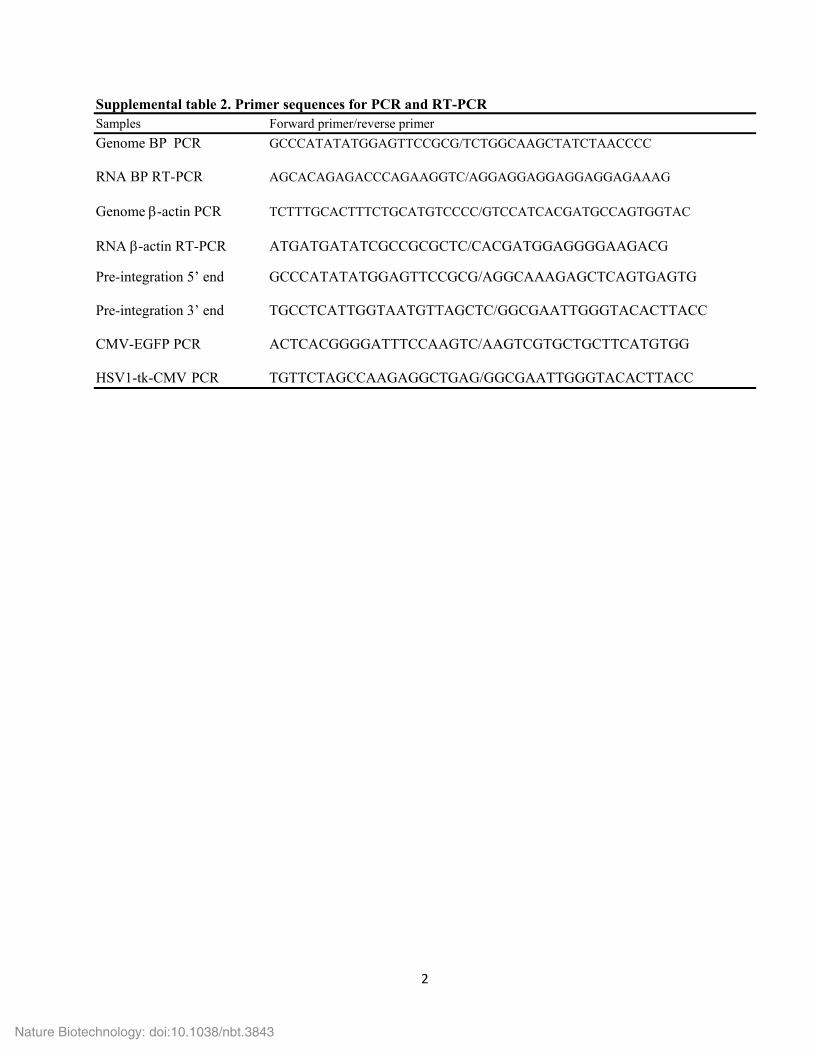
Supplemental table 2. Primer sequences for PCR and RT-PCR Samples Forward primer/reverse primer Genome BP PCR GCCCATATATGGAGTTCCGCG/TCTGGCAAGCTATCTAACCCC RNA BP RT-PCR AGCACAGAGACCCAGAAGGTC/AGGAGGAGGAGGAGGAGAAAG Genome -actin PCR TCTTTGCACTTTCTGCATGTCCCC/GTCCATCACGATGCCAGTGGTAC RNA -actin RT-PCR ATGATGATATCGCCGCGCTC/CACGATGGAGGGGAAGACG Pre-integration 5’ end GCCCATATATGGAGTTCCGCG/AGGCAAAGAGCTCAGTGAGTG Pre-integration 3’ end TGCCTCATTGGTAATGTTAGCTC/GGCGAATTGGGTACACTTACC CMV-EGFP PCR ACTCACGGGGATTTCCAAGTC/AAGTCGTGCTGCTTCATGTGG HSV1-tk-CMV PCR TGTTCTAGCCAAGAGGCTGAG/GGCGAATTGGGTACACTTACC
Nature Biotechnology: doi:10.1038/nbt.3843

3
Supplemental table 3 On- and off-target sequences
Fusion gene gRNA target Sequences Chr. Position** TMEM135-CCDC67 On target CACTCACTGAGCTCTTTGCC 11 93392884 Human Off-target 1 CACTGACTGAGCTCTCTGAC 8 91349869 Human Off-target 2 CACTCACTGTCCTCTTTGCC 8 96221899 Human Off-target 3 AACTCAGCGAGCTCTTTGCC 8 139832573 Human Off-target 4 CACTCACTGAGATCTGTGCC 8 141885129 Human Off-target 5 GACTCACTGAACTCTTTGGC 12 3670848 Human Off-target 6 CCCTGAATGAGCTCTTTGCC 12 48777427 Mouse Off-target 1 CACTGACTCAGTTCTTTGCC 3 6691415 Mouse Off-target 2 CACTCCATCAGCTCTTTGCC 3 89547973 Mouse Off-target 3 CACTCACTGGCCCCTTTGCC 7 143419761 Mouse Off-target 4 TACCCACTGAGCTCTTTCCC 4 30920272 Mouse Off-target 5 CACTCACTGAGCACTGTGTC 4 124329371 Mouse Off-target 6 CACTGACTGAGTCCTTTGCC 4 129431496 MAN2A1-FER On target TAGCATTAAGGGCCCCCTAA 5 109041116 Human Off-target 1 TAGCACTGAAGGCCCCCTAA 8 132195439 Human Off-target 2 TAGCATTAAGGGCCCACTTG 4 146731371 Human Off-target 3 TAGCACTGAGGGCCCCCAAA 22 36767388 Human Off-target 4 TAGTATTCAGGGCCCACTAA 14 84999796 Human Off-target 5 TGGGATTAGGGGCCCCCTAA 11 71081076 Mouse Off-target 1 TAGCTTTAAGTGCCTCCTAA 7 12534542 Mouse Off-target 2 TACCATTAAGTGCCCCCAAA 4 37770804 Mouse Off-target 3 TGGCATTAAGGGCCCATTAA 4 98401470 Mouse Off-target 4 TTGCATTCAGGGTCCCCTAA 5 36160205 Mouse Off-target 5 TAGCATTAAGTGCCCTCTTA 16 53887183
** Alignment to GRCh38.p7 primary assembly database for human genome or to GRCm38.p4 C57BL/6J for mouse genome.
Chr – Chromosome.
Nature Biotechnology: doi:10.1038/nbt.3843

4
Supplemental table 4 On- and off-target sequencing primers for Illumina HiSeq2500
Fusion gene Genome sequencing primer Sequence Chr Position** TMEM135-CCDC67 On target CCCTGTTTTACATATGAGGAAAC 11 87320212 Human Off-target 1 CCCACAAAAAGGGTACATGCC 8 92362003 Human Off-target 2 TTTGGATTCAGCACAGTGGCC 8 96221823 Human Off-target 3 AGGAGGACCATGCCATTTCCC 8 139832521 Human Off-target 4 AGAGGCTCCAGACGCATTGTG 8 141885030 Human Off-target 5a TCAGTGCCCTGCTCAAAACAG 12 3670781 Human Off-target 5b CTCAGTCAGTATCCCTGCCAG 12 3670938 Human Off-target 6a TGGGAAGGAATTGGAGGGAAG 12 48777257 Human Off-target 6b GCTGTCATCTACAGCATCCTG 12 48777515 Mouse Off-target 1 CAGGGAAGCTGCTTTAGAATG 3 6691355 Mouse Off-target 2a TGAAATCCCTGACCCCCAATC 3 89547888 Mouse Off-target 2b CAGACTGGACAAGGTGCTGCG 3 89548055 Mouse Off-target 3a CACAGAGTATGCTAGGGGAAG 7 143419665 Mouse Off-target 3b GTGAATGCCCTCTCTCTTTGC 7 143419851 Mouse Off-target 4 AGGGTATTGTGGAGGTCACAG 4 30920176 Mouse Off-target 5 CTTACTACTTAAGCCGCCCAG 4 124329281 Mouse Off-target 6 ATCATCTAAGGGGAGTCTTGG 4 129431411 EGFP-tk CAGCTCCTCGCCCTTGCTCAC N/A N/A MAN2A1-FER On target GACAGTCTGGCAGAGTTATGC 5 109816105 Human Off-target 1a GAGCACGGGAGGCAAATAAAC 8 132195341 Human Off-target 1b GTGAAGGGCACACTCTTCCAG 8 132195532 Human Off-target 2 GGAGGAGGTATTGGAGGGTTG 4 146731272 Human Off-target 3 AAGGCATCACTCACCACACTG 22 36767292 Human Off-target 4a TCTATGATGTAGCCTCAGCTC 14 84999745 Human Off-target 4b GTGGCATTTGCTTACCCTGGA 14 84999892 Human Off-target 5a ATGGGGCTGTATGTGAAGAGG 11 71081020 Human Off-target 5b CTGCATCTTCACAGGGTCGTC 11 71081153 Mouse Off-target 1a AGAGCTTTCAGGTGTGCTGTC 7 12534489 Mouse Off-target 1b TTGCCCACCTGCGACTAGAGA 7 12534619 Mouse Off-target 2a TGGGTTGATCTAGCTGATGGAG 4 37770705 Mouse Off-target 2b CTCAACCAACCTCTAATACTGTAC 4 37770882 Mouse Off-target 3a GTCTGCTCCCTAAACGAGATG 4 98401370 Mouse Off-target 3b CCAAACCAAAGAGTGGTGGAG 4 98401543 Mouse Off-target 4a AAGGGATGCTACAGCCTGTCC 5 36160146 Mouse Off-target 4b TGGGCACGGAGATAGGTTGTC 5 36160275 Mouse Off-target 5a GCTTCTGTTAGGGCTTTCATGC 16 53887121 Mouse Off-target 5b CACAGCATAGCCAAACTTATGG 16 53887237 EGFP-tk CAGCTCCTCGCCCTTGCTCAC N/A N/A TMEM135-CCDC67 BP Primer 1 GCCTCATTGGTAATGTTAGCTC 11 87320809 Primer 2 AGCATGGCACACTCAGTGAAC 11 93392861 MAN2A1-FER BP Primer 1 CTCCTGACCCCGTGATCCACCT 5 109818361 Primer 2 AAACCATAATCATGCTGACTG 5 109041166 ** Alignment to GRCh38.p7 primary assembly database for human genome or to GRCm38.p4 C57BL/6J for mouse genome.
Chr – chromosome.
N/A – Not applicable; Chr – Chromosome.
Nature Biotechnology: doi:10.1038/nbt.3843

5
Supplemental table 5 Quantification of on and off targets reads of TMEM135‐CCDC67 and MAN2A1‐FER genome therapy in vitro
and in vivo Therapy target Target cells total reads On‐target Off‐targets Off/On TMEM135‐CCDC67 DU145 BP in vitro 3101148 88256 1 <0.1% PC3 BP in vitro 6566408 134573 12 <0.1% DU145 BP tumor 3495728 140292 6 <0.1% PC3 BP tumor 3080992 146217 0 <0.1% MAN2A1‐FER HUH7 in vitro 1180122 84241 116 0.14% HUH7 tumor 1312056 240178 522 0.22% DU145 BP – DU145 cell line harboring TMEM135‐CCDC67 breakpoint. PC3 BP – PC3 cell line harboring TMEM135‐CCDC67 breakpoint. DU145 BP in vitro ‐ DU145 BP cell culture treated with Ad‐TC. PC3 BP in vitro ‐ PC3 BP cell culture treated with Ad‐TC. DU145 BP tumor ‐ DU145 BP xenografted tumor treated with Ad‐TC. PC3 BP tumor – PC3 BP xenografted tumor treated with Ad‐TC. HUH7 in vitro – HUH7 cell culture treated with Ad‐MF. HUH7 tumor – HUH7 xenografted tumor treated with Ad‐MF. On‐target – Pair‐end reads mapped to the correct on‐target genome sequence at one end and EGFP‐tk sequence at the paired end. Off‐target – Pair‐end reads mapped to the off‐target genome sequence at one end and EGFP‐tk sequence at the paired end. Off/On: % Off‐target rate. Total reads – Total number of reads including unmapped and mapped reads.
Nature Biotechnology: doi:10.1038/nbt.3843
6
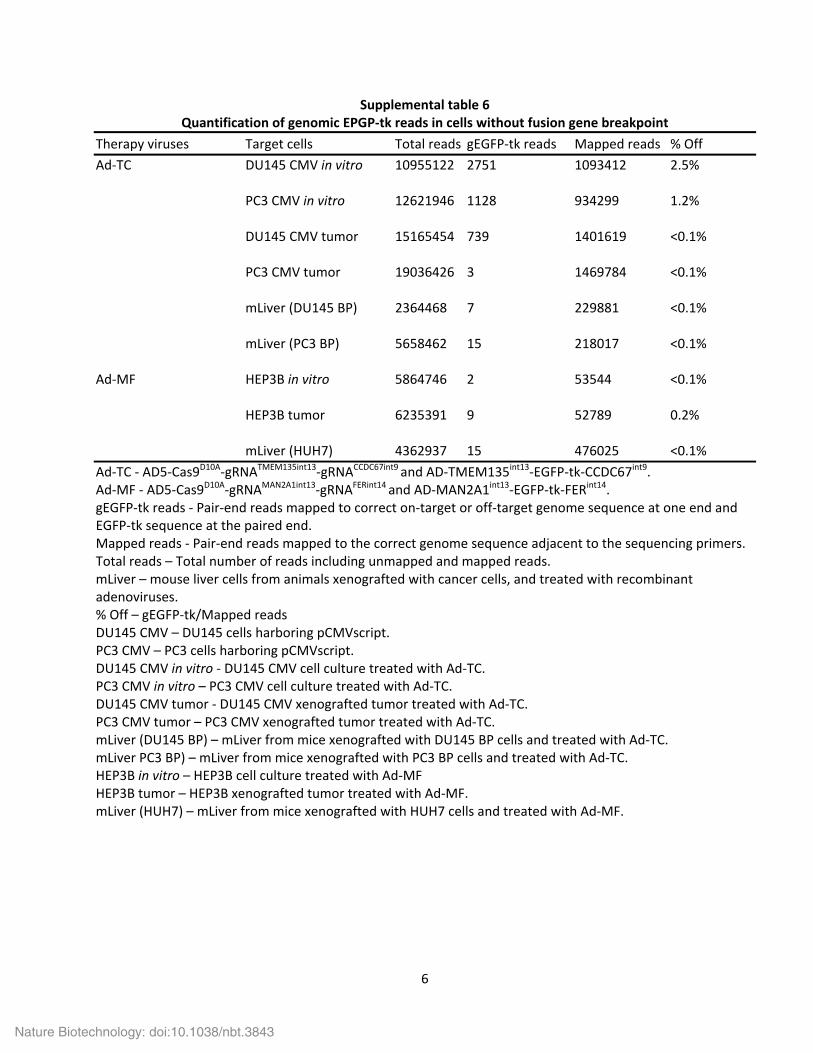
Supplemental table 6 Quantification of genomic EPGP‐tk reads in cells without fusion gene breakpoint
Therapy viruses Target cells Total reads gEGFP‐tk reads Mapped reads % Off Ad‐TC DU145 CMV in vitro 10955122 2751 1093412 2.5% PC3 CMV in vitro 12621946 1128 934299 1.2% DU145 CMV tumor 15165454 739 1401619 <0.1% PC3 CMV tumor 19036426 3 1469784 <0.1% mLiver (DU145 BP) 2364468 7 229881 <0.1% mLiver (PC3 BP) 5658462 15 218017 <0.1% Ad‐MF HEP3B in vitro 5864746 2 53544 <0.1% HEP3B tumor 6235391 9 52789 0.2% mLiver (HUH7) 4362937 15 476025 <0.1% Ad‐TC ‐ AD5‐Cas9D10A‐gRNATMEM135int13‐gRNACCDC67int9 and AD‐TMEM135int13‐EGFP‐tk‐CCDC67int9. Ad‐MF ‐ AD5‐Cas9D10A‐gRNAMAN2A1int13‐gRNAFERint14 and AD‐MAN2A1int13‐EGFP‐tk‐FERint14. gEGFP‐tk reads ‐ Pair‐end reads mapped to correct on‐target or off‐target genome sequence at one end and EGFP‐tk sequence at the paired end. Mapped reads ‐ Pair‐end reads mapped to the correct genome sequence adjacent to the sequencing primers. Total reads – Total number of reads including unmapped and mapped reads. mLiver – mouse liver cells from animals xenografted with cancer cells, and treated with recombinant adenoviruses. % Off – gEGFP‐tk/Mapped reads DU145 CMV – DU145 cells harboring pCMVscript. PC3 CMV – PC3 cells harboring pCMVscript. DU145 CMV in vitro ‐ DU145 CMV cell culture treated with Ad‐TC. PC3 CMV in vitro – PC3 CMV cell culture treated with Ad‐TC. DU145 CMV tumor ‐ DU145 CMV xenografted tumor treated with Ad‐TC. PC3 CMV tumor – PC3 CMV xenografted tumor treated with Ad‐TC. mLiver (DU145 BP) – mLiver from mice xenografted with DU145 BP cells and treated with Ad‐TC. mLiver PC3 BP) – mLiver from mice xenografted with PC3 BP cells and treated with Ad‐TC. HEP3B in vitro – HEP3B cell culture treated with Ad‐MF HEP3B tumor – HEP3B xenografted tumor treated with Ad‐MF. mLiver (HUH7) – mLiver from mice xenografted with HUH7 cells and treated with Ad‐MF.
Nature Biotechnology: doi:10.1038/nbt.3843

7
Supplemental table 7 Integration rates of EGFP‐tk in genome therapy in vitro and in vivo
Therapy target Samples genome‐EGFP‐tk reads BP reads Integration rates TMEM135‐CCDC67 DU145 BP in vitro 56245 297751 15.9% DU145 BP tumor 67779 164207 29.2% PC3 BP in vitro 58961 255898 18.7% PC3 BP tumor 77464 289594 21.1% MAN2A‐FER HUH7 in vitro 21884 63838 25.5% HUH7 tumor 19074 37920 33.5% DU145 BP in vitro ‐ DU145 BP cell culture treated with Ad‐TC. DU145 BP tumor ‐ DU145 BP xenografted tumor treated with Ad‐TC. PC3 BP in vitro ‐ PC3 BP cell culture treated with Ad‐TC. PC3 BP tumor – PC3 BP xenografted tumor treated with Ad‐TC. HUH7 in vitro – HUH7 cell culture treated with Ad‐MF. HUH7 tumor – HUH7 xenografted tumor treated with Ad‐MF. genome‐EGFP‐tk reads ‐ Pair‐end reads mapped to the correct on‐target genome sequence at one end and EGFP‐tk sequence at the paired end. BP reads ‐ Pair‐end reads mapped to the left side of the chromosome breakpoint at one end and the right side of the chromosome breakpoint at the paired end, or any mapped read containing the chromosomal breakpoint. Integration rate ‐ genome‐EGFP‐tk reads/BP reads
Nature Biotechnology: doi:10.1038/nbt.3843