supplement to soil organic matter and labile fractions
TRANSCRIPT

1
Supplement to Soil organic matter and labile fractions depend on
specific local parameter combinations
Malte Ortner1, Michael Seidel2, Sebastian Semella2, Thomas Udelhoven3, Michael Vohland2, Sören
Thiele-Bruhn1
1Soil Science Department, University of Trier, Trier, 54296, Germany 5 2Geoinformatics and Remote Sensing, Institute for Geography, Leipzig University, Leipzig, 04103, Germany 3Department of Remote Sensing & Geoinformatics, University of Trier, Trier, 54296, Germany
Correspondence: Malte Ortner ([email protected]), Sören Thiele-Bruhn ([email protected])
.

2
Supporting information 10
Table S1. Ranges (min to max) of analyzed parameters for the entire dataset and identified clusters.
Dataset
(n=199)
DCS
(n= 50)
LBS
(n=50)
DLS
(n=50)
PSS
(n=49)
Sandy soils
(n=54)
Loamy soils
(n=98)
Silty soils
(n=42)
Arable
(n=150)
Grassland
(n=49)
SOC [%] 0.38-5.23 1.38-5.23 0.54-2.69 0.38-3.15 0.65-2.11 0.65-2.35 0.55-4.79 0.38-4.52 0.38-4.07 0.54-5.23
N [%] 0.06-0.55 0.14-0.55 0.06-0.24 0.09-0.30 0.07-0.26 0.07-0.20 0.06-0.52 0.06-0.49 0.06-0.47 0.06-0.55
H [%] 0.12-1.51 0.36-1.51 0.12-0.49 0.24-0.92 0.13-0.63 0.16-0.51 0.12-1.51 0.16-1.22 0.12-1.51 0.16-1.29
O [%] 0.91-14.60 4.59-9.72 1.39-4.56 0.91-14.60 1.61-4.37 1.39-4.40 1.87-8.41 0.91-14.60 0.91-14.60 1.38-9.72
HWEC [µg/g] 237-1889 438-1889 447-1146 386-1202 237-1711 263-1146 237-1889 386-1631 237-1304 317-1889
HWEN [µg/g] 6.08-237 53.9-221 18.5-146 35.5-220 6.08-237 13.5-144 6.08-237 35.5-220 6.08-237 26.0-221
MBC [µg/g] 52.4-810 126-798 52.4-242 177-810 59.8-599 52.4-344 83.1-810 135-629 52.4-558 114-810
MBN [µg/g] 3.60-139 10.4-117 3.60-43.3 18.2-139 12.6-87.1 3.60-54.5 7.98-139 20.02-99.7 3.60-99.7 16.26-139
Respiration [µg CO2 /g] 0.08-0.71 0.10-0.71 0.10-0.34 0.12-0.70 0.08-0.43 0.10-0.43 0.08-0.71 0.12-0.50 0.08-0.51 0.10-0.71
MBC/SOC 0.40-5.47 0.53-1.81 0.40-4.44 1.03-5.47 0.53-3.37 0.40-2.66 0.53-4.44 0.67-5.47 0.40-5.47 0.84-3.37
SOC/N 4.21-18.7 8.50-13.2 9.93-18.7 4.21-16.4 8.06-13.0 8.06-18.7 8.34-16.7 4.21-15.6 4.21-18.7 9.47-18.2
HWE-C/N 2.22-45.5 4.20-18.7 6.31-28.2 2.86-17.8 2.22-45.4 3.28-32.8 2.22-45.5 2.87-15.0 2.22-45.5 4.61-27.44
MB-C/N 2.86-23.3 4.12-19.2 3.22-23.3 4.98-13.5 2.86-10.1 2.86-23.3 2.98-19.2 4.41-13.5 2.86-23.3 4.49-13.5
IC [%] 0.00-6.80 - - 0.00-6.80 - - 0.00-4.09 0.00-6.80 0.00-6.80 0.00-4.50
pH 3.81-7.43 4.10-6.41 3.81 -6.71 5.03-7.43 4.78-7.09 3.81-6.68 4.10-7.41 4.92-7.43 3.81-7.43 4.22-7.41
ECEC [mmolc/kg] 14.0-147 28.8-110 14.0-86.4 46.9-147 34.9-108 14.0-61.4 24.9-135 27.9-147 14.0-147 20.2-142
Ca + MgECEC [mmolc/kg] 6.27-134 18.0-107 6.27-81.6 34.5-134 28.1-91.0 6.27- 57.8 18.0-127 22.41-134 6.27-134 12.21-132
Feo [g/kg] 0.54-6.43 2.34-6.43 0.54-2.29 1.37-5.22 0.80-4.54 0.54-2.01 0.88-5.29 1.37-5.22 0.54-5.29 0.84-6.43
Fed-Feo [g/kg] 0.15-11.7 2.02-11.7 1.40-7.63 1.12-8.70 0.15-8.45 0.55-6.26 0.15-11.24 1.12-11.7 0.15-11.7 0.55-9.70
Alo [g/kg] 0.11-5.23 1.25-5.23 0.21-1.98 0.11-1.53 0.23-1.10 0.23-1.98 0.11-5.23 0.13-3.71 0.13-5.01 0.11-5.23
Sand [%] 12.7-91.9 13.4-39.8 33.4-91.9 12.7-42.9 31.2-82.8 52.4-91.9 18.3-76.4 12.7-35.0 12.7-91.9 12.9-86.9
cSilt+ mSilt [%] 0.32-57.8 20.8-39.3 0.32-44.7 31.9-57.8 7.87-40.9 0.32-33.8 7.92-44.3 29.9-57.8 0.32-55.8 5.33-57.8
fSilt + clay [%] 6.27-53.3 33.4-53.3 6.27-23.0 16.7-44.8 8.51-40.6 6.27-20.9 13.7-53.3 16.7-47.1 6.27-53.3 7.78-51.0
Stones [%] 0.00-45.9 7.44-45.0 0.60-41.4 0.00-45.9 0.52-43.5 0.60-20.2 0.00-45.00 0.93-45.9 0.53-45.9 0.00-41.4

3
Table S2 Intercepts and regression coefficient of selected mixed effect models for the content SOC, HWEC and MBC as response variable for the complete dataset as well as for the
cluster of DCS, sandy soils and arable soils (n according to Table 1). 15
Respon Random Intercept Parameters and multipliers variable factor Feo Fed- Alo Sand cSilt+mSi fSilt+Clay (Ca+Mg)ECEC pH stones
Dataset SOC Parent material A:2.41 B: 2.29 C: 2.37 D: -0.07 0.51 -0.01 0.02 0.02 -0.25 -0.01
Land use E: 1.17 F: 1.30
-0.06 0.52 0.01 0.02 0.01 -0.26 Texture G: 2.26 H: I: 2.26 J: 2.26
-0.06 0.55 -0.01 0.02 0.02 -0.31 -0.01
HWEC Parent material* A:42.9 B: 42.2 C: 41.3 D: 39.8 0.96 -0.69 1.86 0.16 -4.23 -0.07 Land use* E: 35.1 F: 38.2 1.02 -0.54 1.92 0.12 -3.16 Texture* G: 42.4 H: I: 42.6 J: 42.6 0.80 -0.63 2.39 0.16 -4.59 -0.06 MBC Parent material* A: 20.4 B: 20.3 C: 20.4 D: 20.4 -0.53 0.20 0.11 -2.45 -0.05 Land use* E: 7.24 F: 11.5 0.55 -0.30 0.03 0.15 0.04 Texture* G: 20.2 H: I: 20.6 J:20.5 -0.53 0.20 0.11 -2.43 -0.05
Arable soils cluster SOC Parent material A: 0.77 B: 0.81 C: 0.84 D: 0.34 0.45 0.01 0.02 0.01 -0.19 -0.01 Texture G: 2.44 H: 2.44 I: 2.44 J: 2.44 0.50 0.02 -0.36 -0.01 HWEC Parent material A: 32.0 B: 32.4 C: 31.2 D: 28.9 0.94 -0.46 1.26 0.10 -2.17 Texture G:1221 H: 1222 I: 1227 J: 1223 -19.6 114 6.56 -167 MBC Parent material A: 17.2 B: 17.2 C: 17.2 D: 17.2 -0.07 0.06 -0.63 Texture G: 17.1 H: 17.1 I: 17.2 J: 17.1 -0.07 0.06 -0.63
DCS cluster SOC Land use E: 1.13 F: 1.90 0.32 -0.07 0.31 Texture H: 4.03 I: 3.98 J: 4.45 0.30 -0.10 0.32 0.02 -0.72 HWEC Land use E: 1568 F: 2094 141 8.30 -320 Texture H: 2779 I: 2834 J: 3086 133 -59.4 14.2 -464 -9.2 MBC Land use E: 26.0 F: 315 56.8 Texture H: 948 I: 959 J: 1115 52.2 -26.5 5.29 -156 -5.10
Sandy soils cluster SOC Parent material B: -0.43 D: -1.09 0.39 0.24 0.02 0.01 Land use E: 1.22 F: 1.22 0.59 -0.02 HWEC Parent material B; 1413 D: 1264 195 111 -22 11 -217 -9.95 Land use E; 1481 F: 1481 207 -18.2 10.6 -214 -10.4 MBC Parent material B: 28.9 D: 28.9 1.23 -0.14 -0.42 0.11 -1.31 Land use E: 16.9 D: 19.9 2.68 -0.08 -0.32
*Response variable was square root transformed; Intercepts of Random effect factors: a = DCS, b = LBS, c = DLS, d= PSS, e = arable, f = grassland, g= sand, h = silt, I = loam, j = clay.

4
Table S3. R² for implementation of the global dataset to local clusters for HWEC and MBC.
HWEC
Parent material Land use Texture
Sample subgroups Model Global model
to local cluster Model
Global model
to local cluster Model
Global model
to local cluster
Dataset 0.63 0.66 0.61
DCS - 0.78 0.66 0.60 0.48
LBS - 0.34 0.21 0.29 0.15
DLS - 0.35 0.37 0.35 0.36
PSS - 0.55 0.54 0.55 0.52
Sandy soils 0.61 0.52 0.50 0.4 -
Silty soils 0.75 0.57 0.64 0.54 -
Loamy soils 0.59 0.57 0.64 0.62 -
Arable 0.59 0.57 0.53 0.53
Grassland 0.75 0.73 0.75 0.71
MBC
Parent material Land use Texture
Sample subgroups Model Global model
to local cluster Model
Global model
to local clusterModel
Global model
to local cluster
Dataset 0.38 0.67 0.40
DCS - 0.79 0.73 0.56 0.37
LBS - 0.48 0.43 0.30 0.24
DLS - 0.32 0.35 0.25 0.25
PSS - 0.71 0.71 0.61 0.53
Sandy soils 0.33 0.10 0.54 0.38 -
Silty soils 0.48 0.46 0.48 0.43 -
Loamy soils 0.40 0.36 0.60 0.59 -
Arable 0.70 0.60 0.70 0.61
Grassland 0.75 0.61 0.75 0.60
20
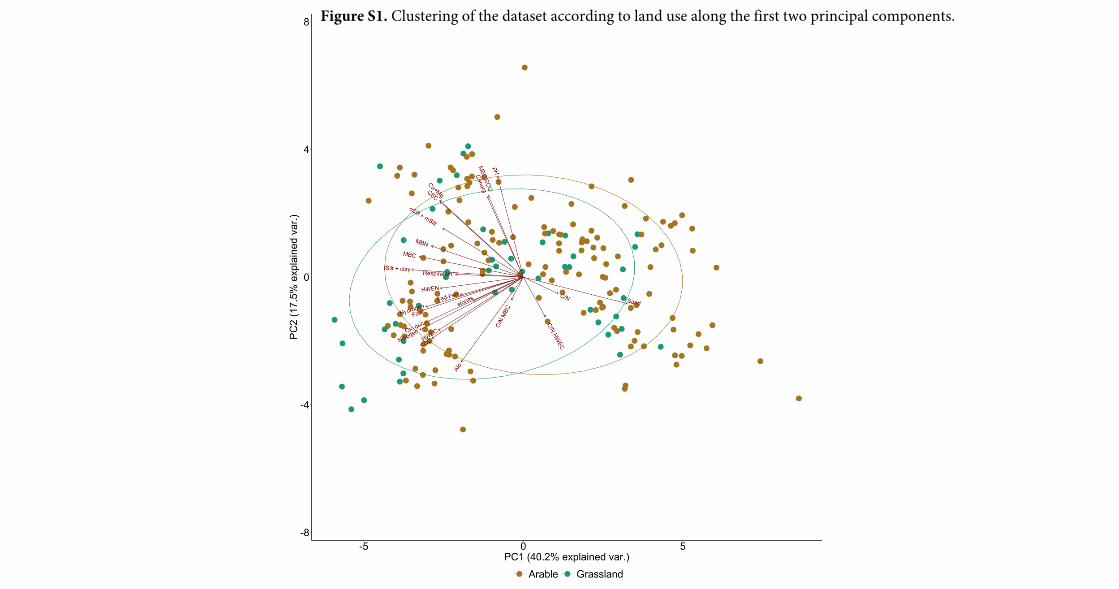
Figure S1. Clustering of the dataset according to land use along the first two principal components.