supervision of a photovoltaic system for making it...
TRANSCRIPT
Volume 57, Number 1, 2016 ACTA TECHNICA NAPOCENSIS
Electronics and Telecommunications
________________________________________________________________________________
Manuscript received February 9, 2016; revised March 3, 2016
31
SUPERVISION OF A PHOTOVOLTAIC SYSTEM FOR MAKING IT
TRANSPARENT IN UNPREDICTABLE WEATHER
Serge Maxime FONOU 1 , Dorin PETREUS 2, Martin KAMTA 1 , Khalil KASSMI 3
1 University of Ngaoundéré, ENSAI, Ngaoundéré, Cameroon, E-mail: [email protected]
2 Technical University of Cluj-Napoca, Faculty of Electronics, Telecommunications and Information Technology, 26-28 G. Baritiu Street, Cluj-Napoca, Romania, Phone +40-264-401499, E-mail: [email protected]
3 Mohamed first University of Oujda, Faculty of Sciences, Oujda, Morocco, E-mail: [email protected]
Abstract: It is well known that the photovoltaic source remains intermittent, since it depends on unpredictable weather. In order to overcome this inconvenient in the case of standalone photovoltaic system, a solar battery is often used. However, the black dot of a photovoltaic system with battery is the guarantee of their lifetime according to manufacturer's forecast. This lifetime is uncertain when the photovoltaic system is supervised by users. In this paper, a supervising algorithm of a photovoltaic power supply source has been developed and simulated in Proteus environment for making it transparent to the users. Keywords: Microcontroller system, Standalone photovoltaic system, Numeric simulation, Management of photovoltaic energy.
I. INTRODUCTION Global warming is primarily due to the emission of greenhouse gases (eg. CO2) from burning fossil fuels namely: oil, coal and natural gas. The extract statistics of the IEA (2011) [1] showed that 86.8% of the global primary energy production is based on non-renewable resources, i.e.: 81.7% of fossil fuels and 5.1% of nuclear fuels. Therefore, only 13.2% of global energy production is based on renewable resources, i.e.: 2.3% of the hydraulic and 10.9% of the other resources (biomass, solar, wind, etc.). The summit in Rio de Janeiro (Brazil 1992) [2], the protocol in Kyoto (Japan 1997) [3] and the COP21 (Paris 2015) [4] advocated the limiting solutions of at least 2 °C of the global warming of planet in 2040. Obviously, population growth expected for the coming years will increase the needs in electricity. Indeed, the renewable energy technologies ensure low CO2 emissions. Up to date, these technologies are booming subsidies amounting to $ 120 billion in 2013 globally [5]. Among the renewable energy resources, the sun light is the most available. Unfortunately, the photovoltaic source remains intermittent, since it depends on unpredictable weather conditions. To overcome this inconvenient in the case of standalone photovoltaic system, a battery of solar accumulators is associated with the photovoltaic panel. Therefore, the resulting power supply system is a permanent energy source that can be used in the absence of the solar light. These batteries must be controlled by voltage regulator of charge and discharge in order to improve their lifetime. The typical backup time of the storage battery is 48 hours. Often, when the autonomy of the solar battery is insufficient, a generator is associated with the PV system [6-9]. Unfortunately, the generator operating costs are high on one hand and on the other hand, it is an environmental pollution
source [6-10]. The black dot of a photovoltaic system with battery is the guarantee of their lifetime according to manufacturer's forecast. This lifetime is uncertain when the photovoltaic system is supervised by users. It is therefore necessary to write a supervising algorithm of an electronic circuit for managing a photovoltaic power supply source, so it may be transparent to the users [10-15]. In this paper, a supervision algorithm is developed and simulated in Proteus environment for making transparent the standalone photovoltaic system for users.
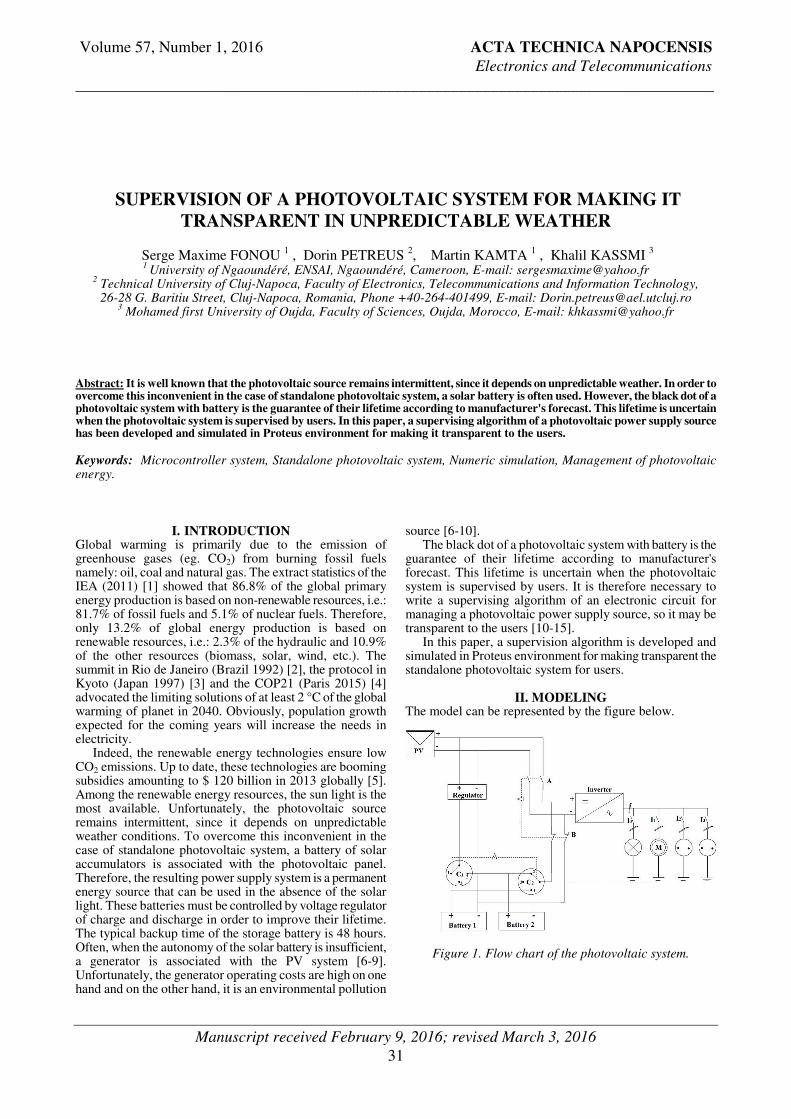
II. MODELING The model can be represented by the figure below.
Figure 1. Flow chart of the photovoltaic system.

Volume 57, Number 1, 2016 ACTA TECHNICA NAPOCENSIS
Electronics and Telecommunications
________________________________________________________________________________
32
Table 1 Truth table of solar batteries
C1 C2 State of charge
Charge of battery 1
1
2 Discharge of battery 2
Discharge of battery 1
2
1 Charge of battery 2
2 2 Prohibited
1 1 Prohibited
3 3 Isolation of batteries
During the day, because the solar energy is high, the microcontroller should command the supply of the house using the photovoltaic panels, closing the switch A (which comes from the panels) and by opening the switch B (which comes from batteries). The energy which comes directly from the panels to the inverter powers the house. During the day the charging of batteries is controlled by the regulator which is managed by the microcontroller because each battery have three operating points. If the battery1 switch is on 1, battery 1 charges. If the battery 1 switch is on 2, battery 2 charges. When the batteries 1 and 2 are full the switches go to position 3. In the night the microcontroller opens switch A of photovoltaic panel and closes switch B which comes from batteries. In this time the batteries power the house. When the supply comes from battery 1 the switch of battery 2 is in position 1 and switch of battery1 is on 3. When battery 2 supplies the house the switch is in position 2 and the switch of battery1 is in 3. The switches: Io, I1, I2, I3 represent respectively the priority line, lighting, fridge, and finally the devices that can be disconnected.
III. SUPERVISION ALGORITHM In this part, we discuss firstly on algorithm of charging accumulators then on automatic discharge of the batteries. A. Control algorithm of accumulators charging in three states (three state charge algorithm) The battery charging algorithm in three states that results from the combination of two methods of charging (constant voltage charging and constant current charging) to achieve the best performance [16,17]: a. Bulk charge In this step, the photovoltaic panel charges the battery with the maximum current allowed. The voltage across the battery increases gradually. When the Vbat voltage reaches
VR=14,4V, it passes to absorption charge state. b. Absorption charge Here, the battery voltage is maintained at the regulation value VR to complete the battery charge and avoid over charging. When the current decreases at Ich=100mA, it passes to state of float charge. c. Float charge This is a maintenance stage where the battery voltage is reduced to a level just sufficient Vfloat=13,2V and the current becomes very low. The three state charging algorithm is illustrated in the following figure 2. In this figure, during the period of bulk charge the battery voltage increases from VLVD= 10,8V to VR=14,4V. During the step of absorption charge, the voltage is constant to VR and finally it decreases to Vfloat= 13,2V in the float charge.
Figure 2: Different states of battery charge [18]. The program begins with a spindle RA2 state test. If RA2 = 0, the module is insufficiently lighted. The battery voltage Vbat is measured by the PIC microcontroller: Vbat ≥10,8V, the battery is discharging according to the discharge flowchart; Vbat ≤10,8V, the discharging is not allowed; If RA2=1, the module is sufficiently illuminate; The current of charging Ibat is measured by the PIC; Ibat =0, the photovoltaic module is disconnected from the system; Ibat ≠0, the PIC performs the measure of Vbat voltage and compares it with the threshold voltages VLVD , Vfloat, VR.
Figure 3. Organizational chart of the main program. B. Automatic discharge flowchart of batteries The system has been sized to meet the daily requirements of consumption estimated at 8280Wh / day (excluding heating and cooking) and comprising of: Low energy lighting: 06 lamps low consumption: 30W; 6h/ day; 01 halogen lamp: 40W, 5h/ day; Fridge: 450W 10h/day; Washes linen: 1300W,1h/ day ; Audiovisual: Stereo chains: 80W 2h/ day; DVD player: 60W 4h/ day; The TV: 120W, 4h/day; Computing: Laptop computer: 80W 4h/ day

Volume 57, Number 1, 2016 ACTA TECHNICA NAPOCENSIS
Electronics and Telecommunications
________________________________________________________________________________
33
Figure 4. Flowchart of accumulators discharge.
From 50% to 100%; the voltage of the battery varies between 14.4V and 12,18V, 50% corresponds to a voltage 12,18V, 40% corresponds to a voltage 12V, 30% corresponds to a voltage 11,88V, 20% corresponds to a voltage 11,7V The battery 1 supplies the home with all the illuminated lines from 100% to 50% depth of discharge. From 50%, the voltage becomes critical, it is necessary to disconnect some consumers (at 40% audiovisual stops; at 30%, computing stops). These devices have low priority for the consumer. After that the microcontroller manages the remaining energy to lighting, fridge and one priority line which allow user comfort since it can connect a device according to his preference. At 20% state of charge battery 2 takes over but only during the night. The lifetime of the batteries is uncertain when the photovoltaic system is controlled by the user this being the reason why the microcontroller is programed according the user’s priorities.
IV. DIFFERENTS MODULES OF THE
ELECTRONIC SYSTEM This system can be decomposed into several blocks. It will include: the power supply block of device; the DC-AC converter; the switches circuit (different lines of home); the system control circuit. A. The power supply circuit As part of this work, the photovoltaic panels feed the
home during the day and the batteries take over at night and during times of low sunlight. a. Estimation of the required photovoltaic panel number The power of the photovoltaic panels can be calculated using the following formula:
genaccj
j
cηη ××Ε
Β=Ρ
(1)
where, Pc (W) is power crest of the photovoltaic installation; Bj (Wh/ day) daily requirements; Ej (Wh/m2/day), average value of the irradiation for the worst month; ηacc, yields the efficiency of the battery pack; ηgen, yields the efficiency of the photovoltaic generator (Losses due to dust, at the heating of the modules, at the wiring). One can thus calculate the number of useful modules using the formula:
1Ρ
Ρ=Ν c
b
(2)
where, Nb is the number of useful modules; P1 (W) is power crest provided by one panel. b. Estimation of the nominal capacity of the accumulators The accumulation capacity (Kacc in Ah) is given by the formula:

Volume 57, Number 1, 2016 ACTA TECHNICA NAPOCENSIS
Electronics and Telecommunications
________________________________________________________________________________
34
accn
rj
accUDM
J
η××
×Β=Κ
(3)
where, Jr is the number of days of storage; DM, maximum discharge of the accumulators; Un(V) nominal accumulators voltage. c. State of battery charge (EDC) It is given by the following relationship:
C
QDC −=Ε 1
(4)
where C(Ah) is rated battery capacity; Q extracted charge quantity with respect to C. d. Electronic diagram of the supply circuit The voltage of the photovoltaic module does not match the needs of each stage of the system. For that, we need a voltage regulator namely the 7805, which will provide a positive DC voltage of 5V necessary to power the microcontroller. This regulator is very simple and less expensive. The electronic diagram of the supply circuit is given by the following Figure 5.
Figure 5. Electronic diagram of the supply circuit. B. The DC-AC converter This circuit consists of an inverter that converts the DC voltage coming from the solar panels in an AC voltage because; all our devices operate in alternative. It is controlled by a microcontroller PIC 16F877A, his power circuit includes two drivers which allow manage his four switches.
Figure 6. Diagram of the inverter controlled by the microcontroller U11 (PIC 16F877A).
C. The switches circuit It is consist of six incandescent lamps representing each of the different lines of priorities, who must be controlled by the microcontroller as a function of the energy level contained in the accumulator battery which is operating. These lamps go from L1 to L6. These priorities are classified according to their energy consumption and user priorities. - The L1 lamp: represents the line of the Washes linen. It is the first line to be shut off because of his power which east of 1300W. - The L2 lamp: represents the audiovisual line. It is the second line to be shut off because of his power which east of 260W. - The L3 lamp: represents line of computing. It is the third line to be shut off. - The L4 lamp: represents the line of the fridge. It must always be fed because the user stores his food in the fridge. - The L5 lamp: represents the line of the illumination. All our activities need bright conditions to avoid eye tiredness which is a part of our visual comfort. - The L6 lamp: represents the priority line of the user. The system uses six optocouplers which are electronic components consisting of a diode and of an NPN-type phototransistor. They are used to separate two electrics circuits where of masses are not the same electrical potential: here, it's question the control circuit and of the switches circuit. After these optocouplers we have six relays that are managed by the microcontroller; six switches which depend on the user. The electronic diagram of circuit is given by Figure 7 following:
Figure 7. Circuit of the switches. D. The facility control circuit This circuit ensures the transfer and the power conversion between both sides, source and load thanks to a control system. This power circuit is composed of:
Volume 57, Number 1, 2016 ACTA TECHNICA NAPOCENSIS
Electronics and Telecommunications
________________________________________________________________________________
35
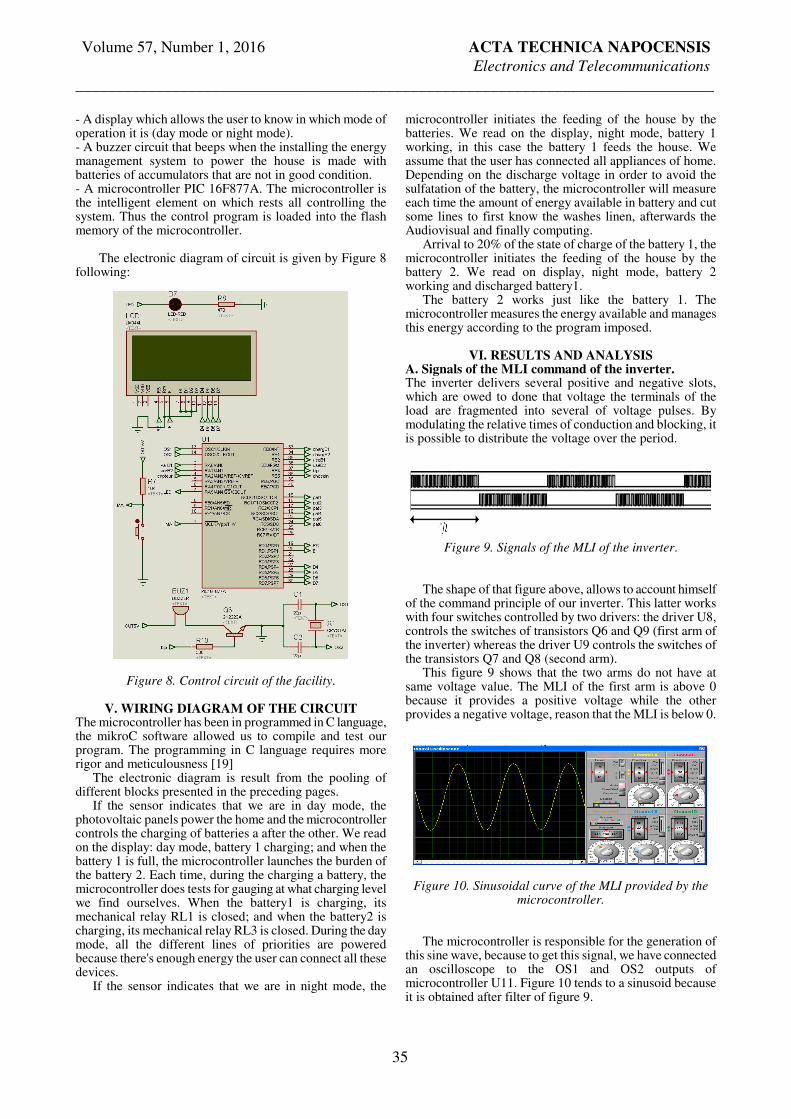
- A display which allows the user to know in which mode of operation it is (day mode or night mode). - A buzzer circuit that beeps when the installing the energy management system to power the house is made with batteries of accumulators that are not in good condition. - A microcontroller PIC 16F877A. The microcontroller is the intelligent element on which rests all controlling the system. Thus the control program is loaded into the flash memory of the microcontroller. The electronic diagram of circuit is given by Figure 8 following:
Figure 8. Control circuit of the facility.
V. WIRING DIAGRAM OF THE CIRCUIT The microcontroller has been in programmed in C language, the mikroC software allowed us to compile and test our program. The programming in C language requires more rigor and meticulousness [19] The electronic diagram is result from the pooling of different blocks presented in the preceding pages. If the sensor indicates that we are in day mode, the photovoltaic panels power the home and the microcontroller controls the charging of batteries a after the other. We read on the display: day mode, battery 1 charging; and when the battery 1 is full, the microcontroller launches the burden of the battery 2. Each time, during the charging a battery, the microcontroller does tests for gauging at what charging level we find ourselves. When the battery1 is charging, its mechanical relay RL1 is closed; and when the battery2 is charging, its mechanical relay RL3 is closed. During the day mode, all the different lines of priorities are powered because there's enough energy the user can connect all these devices. If the sensor indicates that we are in night mode, the
microcontroller initiates the feeding of the house by the batteries. We read on the display, night mode, battery 1 working, in this case the battery 1 feeds the house. We assume that the user has connected all appliances of home. Depending on the discharge voltage in order to avoid the sulfatation of the battery, the microcontroller will measure each time the amount of energy available in battery and cut some lines to first know the washes linen, afterwards the Audiovisual and finally computing. Arrival to 20% of the state of charge of the battery 1, the microcontroller initiates the feeding of the house by the battery 2. We read on display, night mode, battery 2 working and discharged battery1. The battery 2 works just like the battery 1. The microcontroller measures the energy available and manages this energy according to the program imposed.
VI. RESULTS AND ANALYSIS A. Signals of the MLI command of the inverter. The inverter delivers several positive and negative slots, which are owed to done that voltage the terminals of the load are fragmented into several of voltage pulses. By modulating the relative times of conduction and blocking, it is possible to distribute the voltage over the period.
Figure 9. Signals of the MLI of the inverter.
The shape of that figure above, allows to account himself of the command principle of our inverter. This latter works with four switches controlled by two drivers: the driver U8, controls the switches of transistors Q6 and Q9 (first arm of the inverter) whereas the driver U9 controls the switches of the transistors Q7 and Q8 (second arm). This figure 9 shows that the two arms do not have at same voltage value. The MLI of the first arm is above 0 because it provides a positive voltage while the other provides a negative voltage, reason that the MLI is below 0.
Figure 10. Sinusoidal curve of the MLI provided by the
microcontroller. The microcontroller is responsible for the generation of this sine wave, because to get this signal, we have connected an oscilloscope to the OS1 and OS2 outputs of microcontroller U11. Figure 10 tends to a sinusoid because it is obtained after filter of figure 9.

Volume 57, Number 1, 2016 ACTA TECHNICA NAPOCENSIS
Electronics and Telecommunications
________________________________________________________________________________
36
B. Results for the charging state of the batteries. By connecting the oscilloscope to the useB1 and useB2 outputs of the microcontroller, the following results are obtained. The yellow line represents battery 1 power and the blue line battery 2 power. This figure shows that the battery 2 takes the succession immediately when the battery 1 stops powering the house.
Figure 11. Curve when the batteries are changing.
VII. CONCLUSION The development of the systems command by circuit programmable has occupied the field of modern technology, what pushed us to choose the PIC microcontrollers that are more reliable. Our work was to automate the shutdown of the appliances of the home in depending on the battery discharge voltage in order to optimize the performance of the regulator. In this paper, the purpose referred is to manage the photovoltaic energy of the battery by controlling the discharge voltage of the latter in receptors function, order to improve the continuity of the energy and to better manage the life of the battery. For this we designed and simulate a microcontroller system that can manage the energy photovoltaic the home comprising several lines of priorities. We developed the algorithm of charging batteries in three states « Three state charge algorithm » and write a battery discharge flowchart according to the user's devices. The set of results obtained show that the microcontroller system properly plays its role which is to make the transparent photovoltaic installation in the eyes of the user because it automates the stopping of devices by controlling the discharge of the battery as a function of devices of the home. Optimizing of the performance of regulator has experienced considerable progress, but until then, many efforts must still be made. Thus we envisage realization of the system designed and simulated in ISIS environment and expanding the system to other applications (continuous loads) by introducing into the system a chopper type converter. The work is still in progress. In the near future experimentation for testing the management algorithm will be done.
ACKNOWLEDGEMENT S. M. Fonou gratefully acknowledges the support of the Erasmus Mundus programme under Action 2 funded by the European Commission and coordinated by Vrije Universiteit Brussel.
REFERENCES
[1] International Energy Agency, World Energy Outlook, IEA 2011, http://www.iea.org/Textbase/about/copyright.asp. ISBN: 978 92 64 12413 4. [2] United Nations Conference on Environment and Development (UNCED), Rio de Janeiro, 3-14 June 1992, http://www.un.org/geninfo/bp/enviro.html. [3] Kyoto Protocol, International Treaty, Japan, December 1997, http://www.rac-f.org. [4] United Nations Conference on Climate Change COP21/CMP11, Paris, 30November - 11December 2015. [5] Belpowersolutions.com [6] M. Adouane, M. Haddadi and K.Touafek, "Conception d’un Gestionnaire Intelligent des Systèmes Photovoltaïques Hybrides," Revue des Energies Renouvelables SIENR’12 Ghardaia, pp.325-330, 2012. [7] F. K. Manasse, "Comparaison of Costs for Solar Electric Sources with Diesel Generators in Remote Locations," Revue de Physique Appliquée, vol.15, no.3, 1980. [8] M. Adouane, M.Haddadi and R. Medjoudj, "Conception et Réalisation d’un Module Electronique de Contrôle et de Gestion Optimale de l’Energie Hybride Photovoltaïque-Groupe Electrogène," Revue des Energies Renouvelables, ICESD’ 11, Adrar, pp.9-15, 2011. [9] J. K. Tangka, P. Tchakoua, H. Fotsin and A. Fomethe, "Conception et Réalisation d’un Module Electronique de Contrôle de Charge et de Gestion Optimale de l’Energie pour Système Energétiques Hybrides Eolien-Diesel, Photovoltaïque-Diesel et Eolien-Photovoltaïque-Diesel (MECCGOPSEH)," Revue des Energies Renouvelables, vol.13, no.4, pp. 591 – 602, 2010. [10] M. F. Yaden, R. Gaamouche, K. Hirech, M. Melhaoui, E. H. Baghaz and K. Kassmi,"Conception, Réalisation et Caractérisation d’un Système Photovoltaïque Menu des Commandes de Contrôle et d’Acquisition Numériques," Revue "Nature &Technologie" A-Sciences Fondamentales et Engineering, no.10, pp.29-40, 2014. [11] A. T. Singo, "Système d’Alimentation Photovoltaïque avec Stockage Hybride pour l’Habitat Energétiquement Autonome," Ph. D thesis in Electrical Engineering, Henri Poincaré University, Nancy-I, France, 2010. [12] D. Lu, H. Fakham, T. Zhou and B. François, "Application of Petri Nets for the Energy Management of a Photovoltaic Based Power Station Including Storage Units," Renewable Energy, vol.35, no. 6, pp.1117-1124, 2010. [13] Otaibi, Essounbouli and Nollet,"Intelligent Energy Management in a Photovoltaic Installation Using Fuzzy Logic," International Journal on Sciences and Techniques of Automatic control & computer engineering, vol.5, no.2, pp.1576-1585, 2011. [14] L. Croci, "Gestion de l’Energie Dans un Système Multi-Sources Photovoltaïque et Eolien avec Stockage Hybride Batteries / Supercondensateurs," Ph. D thesis in Automatics, University of Poitiers, France, 2013. [15] Tharanidevi and Sumithra, "FPGA Based Efficient Control Stratergy for Multi-Mode Power Flow Management in Solar Photovoltaic System," International Journal of Scientific and Engineerig Research, vol.5, no.5, 2014 [16] L. Balogh, "Implementing Multi-State Charge Algorithm with the UC3909 Switchmode Lead-Acid Battery Charger Controller," Unitrode Production Applications Handbook, 1999. [17] K. Hirech, M. Melhaoui, F. Yaden, E. Baghaz, K. Kassmi, "Design and Realisation of and autonomous system equipped with a charge / Discharge regulator and digital MPPT Command," Energy Procedia, vol.42, pp. 503-512, 2013. [18] S. Zaamta, "Réalisation d’un Régulateur Solaire à Base de Microcontrôleur Pour le Contrôle de L’état de Charge et la Protection des Accumulateurs," Master thesis in Electrical Engineering in Larbi Ben M’hidi Oum-El-Bouaghi University Center, Algeria, 2008. [19] Christian Dupaty, "C.MINIMUM : Connaissances Nécessaires à la Programmation des Microcontrôleurs en Langage C," Cours d’Electronique en Ligne, 26 Avril 2012.