superparamagnetic and ferrimagnetic nanoparticles in glass matrix
TRANSCRIPT

*Corresponding author. Fax: #7-3912-438923.E-mail address: [email protected] (I. Edelman).
Physica B 301 (2001) 203}211
Superparamagnetic and ferrimagnetic nanoparticlesin glass matrix
I.S. Edelman��*, R. Ivantsov�, A. Vasiliev�, S. Stepanov�, E. Kornilova�,T. Zarubina�
�L.V. Kirensky Institute of Physics, Russian Academy of Sciences}SB, Krasnoyarsk 660036, Russia�S.I. Vavilov Optical State Institute, St. Peterburg 193117, Russia
Received 13 June 2000; received in revised form 7 December 2000
Abstract
Faraday rotation (FR) spectral, "eld, and temperature dependencies in oxide glasses with small additions ofparamagnetic elements are investigated. Formation of ferrite nanoparticles in amorphous glass matrices is revealed byX-ray di!raction. Particles have crystal structure similar to spinel structure, their dimensions are about 10}24 nm.
The FR "eld dependencies are typical for ferrimagnetic or superparamagnetic substances depending on particle size.Strong FR increase at the samples cooling (more than twice for some samples) in the temperature interval 105}273 K isobserved. � 2001 Elsevier Science B.V. All rights reserved.
PACS: 75.20.Tt; 78.20.Ls
Keywords: Magnetic nanoparticles; Faraday rotation
1. Introduction
Nano-sized magnetic particles in non-magneticmatrices attract considerable attention because thedecrease in the size of particles changes their prop-erties and presents interesting applications for mag-netic storage. Di!erent methods of samplepreparation lead to the large variety of magneticbehavior observed experimentally in di!erent kindsof systems. Fiorani et al. observed spin glass behav-
ior in the ensemble of iron grains "nely dispersed inan amorphous Al
�O
�matrix, prepared by thin "lm
technology [1]. Tsang and co-authors investigatedthe ratio of superparamagnetic to high coercivityferromagnetic particles in the nano-particle en-sembles prepared by decomposition of Fe(CO)
�in
porous glass [2]. Kodama and co-authors revealedanomalous magnetic properties of organic coatedNiFe
�O
�nanoparticles [3]. Superparamagnetic
behavior was observed by Babu and co-authors inthin amorphous "lms 0.5Fe
�O
�}0.1Bi
�O
�}
0.4ZnO associated with the ferrite microcrystalsformation after "lms annealing [4].
Recently, we suggested a kalium}alumino}bor-ate glass system containing paramagnetic metal
0921-4526/01/$ - see front matter � 2001 Elsevier Science B.V. All rights reserved.PII: S 0 9 2 1 - 4 5 2 6 ( 0 1 ) 0 0 2 7 4 - 5
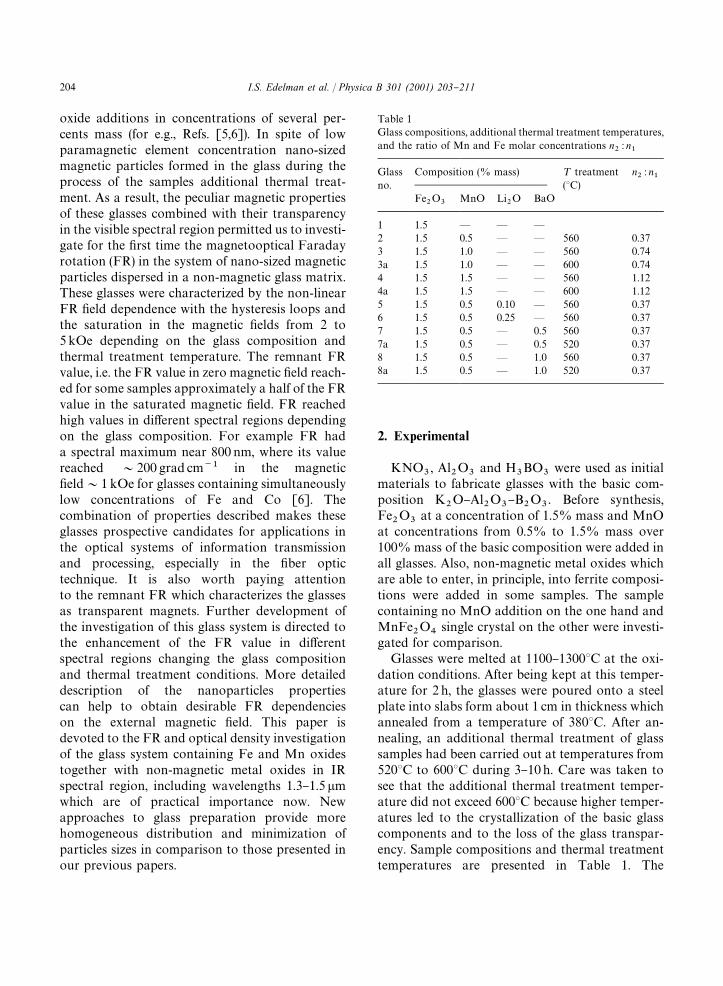
Table 1Glass compositions, additional thermal treatment temperatures,and the ratio of Mn and Fe molar concentrations n
�: n
�
Glassno.
Composition (% mass) ¹ treatment(3C)
n�
: n�
Fe�O
�MnO Li
�O BaO
1 1.5 * * *
2 1.5 0.5 * * 560 0.373 1.5 1.0 * * 560 0.743a 1.5 1.0 * * 600 0.744 1.5 1.5 * * 560 1.124a 1.5 1.5 * * 600 1.125 1.5 0.5 0.10 * 560 0.376 1.5 0.5 0.25 * 560 0.377 1.5 0.5 * 0.5 560 0.377a 1.5 0.5 * 0.5 520 0.378 1.5 0.5 * 1.0 560 0.378a 1.5 0.5 * 1.0 520 0.37
oxide additions in concentrations of several per-cents mass (for e.g., Refs. [5,6]). In spite of lowparamagnetic element concentration nano-sizedmagnetic particles formed in the glass during theprocess of the samples additional thermal treat-ment. As a result, the peculiar magnetic propertiesof these glasses combined with their transparencyin the visible spectral region permitted us to investi-gate for the "rst time the magnetooptical Faradayrotation (FR) in the system of nano-sized magneticparticles dispersed in a non-magnetic glass matrix.These glasses were characterized by the non-linearFR "eld dependence with the hysteresis loops andthe saturation in the magnetic "elds from 2 to5 kOe depending on the glass composition andthermal treatment temperature. The remnant FRvalue, i.e. the FR value in zero magnetic "eld reach-ed for some samples approximately a half of the FRvalue in the saturated magnetic "eld. FR reachedhigh values in di!erent spectral regions dependingon the glass composition. For example FR hada spectral maximum near 800 nm, where its valuereached &200 grad cm�� in the magnetic"eld&1 kOe for glasses containing simultaneouslylow concentrations of Fe and Co [6]. Thecombination of properties described makes theseglasses prospective candidates for applications inthe optical systems of information transmissionand processing, especially in the "ber optictechnique. It is also worth paying attentionto the remnant FR which characterizes the glassesas transparent magnets. Further development ofthe investigation of this glass system is directed tothe enhancement of the FR value in di!erentspectral regions changing the glass compositionand thermal treatment conditions. More detaileddescription of the nanoparticles propertiescan help to obtain desirable FR dependencieson the external magnetic "eld. This paper isdevoted to the FR and optical density investigationof the glass system containing Fe and Mn oxidestogether with non-magnetic metal oxides in IRspectral region, including wavelengths 1.3}1.5 �mwhich are of practical importance now. Newapproaches to glass preparation provide morehomogeneous distribution and minimization ofparticles sizes in comparison to those presented inour previous papers.
2. Experimental
KNO�, Al
�O
�and H
�BO
�were used as initial
materials to fabricate glasses with the basic com-position K
�O}Al
�O
�}B
�O
�. Before synthesis,
Fe�O
�at a concentration of 1.5% mass and MnO
at concentrations from 0.5% to 1.5% mass over100% mass of the basic composition were added inall glasses. Also, non-magnetic metal oxides whichare able to enter, in principle, into ferrite composi-tions were added in some samples. The samplecontaining no MnO addition on the one hand andMnFe
�O
�single crystal on the other were investi-
gated for comparison.Glasses were melted at 1100}13003C at the oxi-
dation conditions. After being kept at this temper-ature for 2 h, the glasses were poured onto a steelplate into slabs form about 1 cm in thickness whichannealed from a temperature of 3803C. After an-nealing, an additional thermal treatment of glasssamples had been carried out at temperatures from5203C to 6003C during 3}10 h. Care was taken tosee that the additional thermal treatment temper-ature did not exceed 6003C because higher temper-atures led to the crystallization of the basic glasscomponents and to the loss of the glass transpar-ency. Sample compositions and thermal treatmenttemperatures are presented in Table 1. The
204 I.S. Edelman et al. / Physica B 301 (2001) 203}211

Fig. 1. X-ray di!raction patterns for sample no. 1 containing no Mn additions (1) and sample no. 4 with 1.5% mass MnO (2).
measurements were also carried out for the samplesof all compositions which were not subjected to theadditional thermal treatment. The measurementswere made on optically smoothed samplesof (1.0$0.05) mm thickness. The MnFe
�O
�single crystal plate had dimensions of 0.1�3.0�3.0 mm.
The optical density spectra were obtained witha Hitachi spectrophotometer in the spectral regionfrom the edge of absorption of each sample(900}1000 nm) to 1600 nm. FR was measured withthe self-made installation [5] with an accuracy ofabout 0.2 min in the interval 1000}2000 nm. Theexternal magnetic "eld was applied normal to thesamples surface and changed from !3.5 to!3.5 kOe with an accuracy of $20 Oe. Temper-ature changed in the interval 100}300 K with anaccuracy $0.5 K. Structural characterization ofthe glasses was done with a D8ADVANCE(Bruker). X-ray di!raction spectra were recordedfor the 2� range 5}603 for a Cu K
�emission with
�"1.5406 As .
3. Sample structural characterization
Sample nos. 1 and 2 containing no MnO addi-tion and 0.5% mass MnO without other additions,respectively, were X-ray amorphous (curve 1 in Fig.1). For all the samples from nos. 3}8a, a distinct
Bragg peak centered at 2�"35.23 and essentiallyweaker peaks at 2�+433 and 563 due to crystal-line phases were distinguished besides the wideamorphous halo. The part of X-ray diagram forsample no. 4 is shown by curve 2 in Fig. 1. Peakpositions for all samples are identical, but peakwidth and intensity vary from sample to sample.The peaks angle coordinates correspond to thecubic crystal cell. More than that, they correspondto the re#ection with the indices (3 1 1), (4 0 0) and(5 1 1) of MnFe
�O
�single crystal. That is why it
was enough to measure the angle width of one peakto estimate crystalline size. To eliminate the instru-mental contribution to the line broadening the cer-ti"cate standard sample was used which was thecorundum plate with crystallite sizes of (5$2) �m.For this sample the re#ection with indices (1 4 0)had the angle coordinate 2�"35.1773 and the fullwidth at half maximum (FWHM) b"0.2083. Theintense Bragg peak for the samples investigated hadthe coordinate 2�+35.23 and the FWHM B, thelatter was essentially larger in comparison to b. TheScherrer equation [7]
¸"
�� cos �
, (1)
where �"�B�!b�, �"1.5406 As was used todetermine average crystalline dimensions. These di-mensions are presented in Table 2.
I.S. Edelman et al. / Physica B 301 (2001) 203}211 205

Table 2Characteristics of the samples investigated�
Glass no. ��/�
�for
273 K��/�
�for
105 K��
(grad cm��) at935 nm, 273 K
��
(grad cm��) at935 nm, 105 K
��
(grad cm��) at1500 nm, 273 K
Average particlessize (As )
Q (grad)
3 0.33 0.39 15.94 (8) 25.19 (12.6) 5.00 153 *
3a 0.20 0.31 12.23 (6.1) 21.91 (11) 4.39 137 7.324 0.06 0.20 12.86 (4.53) 25.14 (8.4) 5.30 112 *
4a 0.05 0.17 11.67 (3.9) 23.54 (7.8) 6.92 104 12.585 0.37 0.38 10.71 15.71 3.34 118 1.076 0.41 0.41 11.84 16.94 3.68 183 6.517 0.36 0.56 10.50 13.50 2.97 195 5.717a 0.14 0.39 5.98 11.18 2.36 118 5.768 0.37 0.40 11.50 16.10 3.41 235 7.588a 0.26 0.34 5.83 8.83 2.00 161 4.55
�The ratio of remnant FR to FR in the maximal magnetic "eld for two temperatures; FR in the maximal "eld for two temperatures at935 nm (in brackets �
�reduced to the MnO concentration equal to 0.5% mass is presented); FR in the maximal "eld for �"1500 nm at
273 K, average crystalline sizes and "gure of merit for �"1500 nm at room temperature. Numbers of samples correspond to those inTable 1.
Fig. 2. Optical density curves: numbers correspond to Table 1.
4. Optical density
Spectra of optical density of all samples investi-gated are presented in Fig. 2. The spectra of initialsamples (which were not subjected to the additionalthermal treatment) coincide totally with the spec-
trum of sample no. 1, containing only Fe�O
�(curve
1 in Fig. 2). For the conditions used for the glasssynthesis, the absorption of the glass did notchange after thermal treatment. The additionalthermal treatment of glasses containing MnOcaused the essential changes of the absorption.Chief among them were the shift of the absorptionedge to the infra red (IR) spectral region and anincrease of absorption in this region. The strongestincrease of absorption was observed for sample no.2 containing 0.5% mass MnO treated at temper-ature 5603C. It could evidence the presence of Fe��ions. Earlier, it was shown [8] that the absorptionintensity associated with the Fe�� ions increasedstrongly when they are incorporated into the mag-netic micro- or nanoparticles. The MnO concentra-tion increase was accompanied by the absorptiondecrease at wavelengths larger than 1000 nm(curves 3, 3a, 4 and 4a in Fig. 2). At the same time,the steepness of the absorption edge near 1000 nmbecame larger in comparison to sample no. 2 con-taining 0.5% mass MnO. Besides a kink appearsbetween 1000 and 1100 nm. These changes werepractically the same for thermal treatment temper-atures both 5603C and 6003C. One of the reasonsfor such a behavior could be the Fe�� oxidation toFe�� according to the reaction Fe��#Mn��P
Fe��#Mn��.
206 I.S. Edelman et al. / Physica B 301 (2001) 203}211
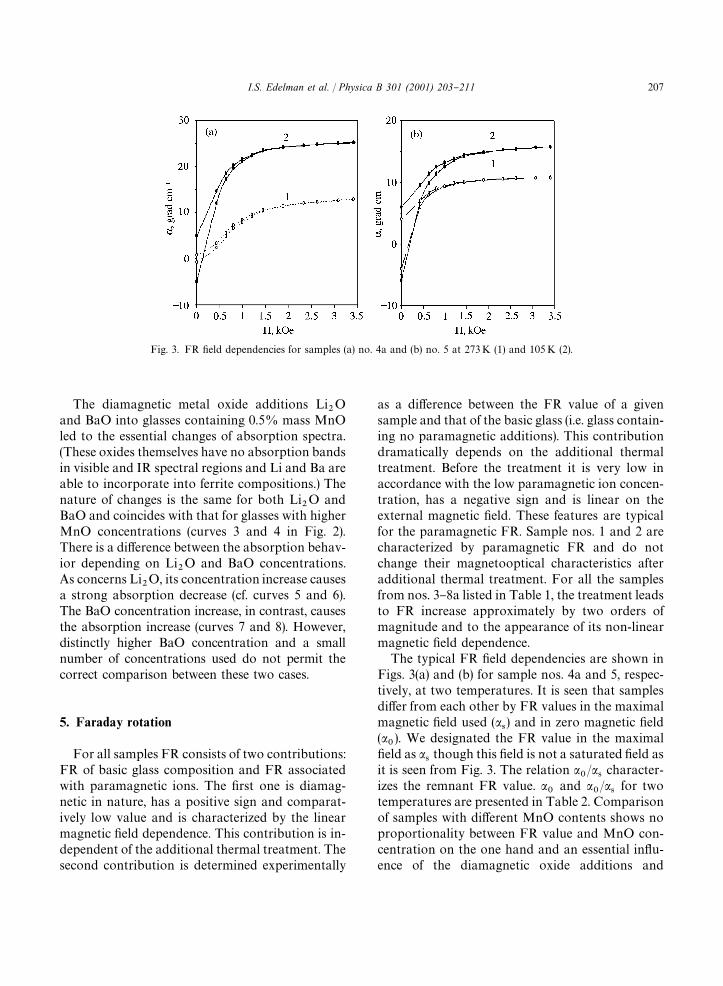
Fig. 3. FR "eld dependencies for samples (a) no. 4a and (b) no. 5 at 273 K (1) and 105 K (2).
The diamagnetic metal oxide additions Li�O
and BaO into glasses containing 0.5% mass MnOled to the essential changes of absorption spectra.(These oxides themselves have no absorption bandsin visible and IR spectral regions and Li and Ba areable to incorporate into ferrite compositions.) Thenature of changes is the same for both Li
�O and
BaO and coincides with that for glasses with higherMnO concentrations (curves 3 and 4 in Fig. 2).There is a di!erence between the absorption behav-ior depending on Li
�O and BaO concentrations.
As concerns Li�O, its concentration increase causes
a strong absorption decrease (cf. curves 5 and 6).The BaO concentration increase, in contrast, causesthe absorption increase (curves 7 and 8). However,distinctly higher BaO concentration and a smallnumber of concentrations used do not permit thecorrect comparison between these two cases.
5. Faraday rotation
For all samples FR consists of two contributions:FR of basic glass composition and FR associatedwith paramagnetic ions. The "rst one is diamag-netic in nature, has a positive sign and comparat-ively low value and is characterized by the linearmagnetic "eld dependence. This contribution is in-dependent of the additional thermal treatment. Thesecond contribution is determined experimentally
as a di!erence between the FR value of a givensample and that of the basic glass (i.e. glass contain-ing no paramagnetic additions). This contributiondramatically depends on the additional thermaltreatment. Before the treatment it is very low inaccordance with the low paramagnetic ion concen-tration, has a negative sign and is linear on theexternal magnetic "eld. These features are typicalfor the paramagnetic FR. Sample nos. 1 and 2 arecharacterized by paramagnetic FR and do notchange their magnetooptical characteristics afteradditional thermal treatment. For all the samplesfrom nos. 3}8a listed in Table 1, the treatment leadsto FR increase approximately by two orders ofmagnitude and to the appearance of its non-linearmagnetic "eld dependence.
The typical FR "eld dependencies are shown inFigs. 3(a) and (b) for sample nos. 4a and 5, respec-tively, at two temperatures. It is seen that samplesdi!er from each other by FR values in the maximalmagnetic "eld used (�
�) and in zero magnetic "eld
(��). We designated the FR value in the maximal
"eld as ��
though this "eld is not a saturated "eld asit is seen from Fig. 3. The relation �
�/�
�character-
izes the remnant FR value. ��
and ��/�
�for two
temperatures are presented in Table 2. Comparisonof samples with di!erent MnO contents shows noproportionality between FR value and MnO con-centration on the one hand and an essential in#u-ence of the diamagnetic oxide additions and
I.S. Edelman et al. / Physica B 301 (2001) 203}211 207

Fig. 4. FR spectral dependencies for the samples presented inTable 2 and for the MnFe
�O
�single crystal plate.
thermal treatment temperature on FR on the otherhand. The maximal �
�value reduced to the MnO
concentration is observed for sample nos. 6 and 8containing 0.25% mass Li
�O and 1.0% mass BaO,
respectively, and treated at 5603C. The maximal��/�
�value for sample no. 6 is observed at room
temperature and for sample no. 7 at 105 K.The measurement temperature decrease in the
interval 273}105 K e!ects the ��
increase for allsamples and the �
�/�
�increase for most samples.
The ��
increase is practically linear with respect tothe measurement temperature. The degree of �
�in-
crease di!ers for di!erent samples (Table 2): thelargest one is observed for sample nos. 4 and 4a.The largest �
�/�
�increase with the temperature
decrease is observed for these samples too. For theremaining samples there is no distinct correlationbetween the �
�and �
�/�
�increase when the temper-
ature decreases.Magnetooptical "gure of merit Q which is deter-
mined as the ratio of the FR value to the opticalabsorption is an important characteristic of amaterial for technical application. The Q valuesobtained at the maximal magnetic "eld used arepresented in Table 2 for the practically importantwavelength �"1.5 �m. The highest Q is observedfor sample no. 4a.
The ��
spectral dependencies are shown in Fig. 4for all samples. Note that the sign of �
�is negative.
Negative FR sign and its graded decrease with the
light wavelength increase in the spectral intervalpresented are characteristic of ferrites with spinelstructure containing 3d� magnetic ions (Fe�� andMn��).
The FR spectrum measured for MnFe�O
�single
crystal plate magnetized normal to its (1 0 0) surfaceis presented in Fig. 4 too. It is seen that FR valueper unit sample thickness is approximately twoorders of magnitude larger for MnFe
�O
�in com-
parison to the glasses investigated. The rate of theFR value decrease with the wavelength increase islarger for MnFe
�O
�too.
6. Discussion
Magnetooptical properties of the glasses investi-gated can be associated with the magnetic nanopar-ticles formation in the glass matrix as a result of anadditional thermal treatment. This assumption isbased on the X-ray data presented in Table 2 re-vealing the regions of inhomogeneity in all glasses.These regions have crystal structure which is char-acteristic of manganese ferrite. The average crystaldimensions vary from sample to sample as it is seenin Table 2. It is possible to propose compositionalphase strati"cation of basic glass components dur-ing the process of the additional thermal treatment.Fe, Mn, Li and Ba ions, which can be considered inthis case as impurities, displace to the phase bound-aries. Thus, regions appear with these elementsconcentration exceeding strongly their averageconcentration which provides conditions for theformation of large clusters or nano-sized particles.Indirect exchange interaction through oxygen ionsFe}O}Fe, Mn}O}Mn and Mn}O}Fe in the par-ticles leads to a ferrimagnetic structure appearancesimilar to that in manganese ferrite. Ferrimagneticorder of the particles is responsible for the high FRvalue of glasses. The volume concentration of fer-rimagnetic particles in glass matrix has to be equalto &1% in accordance with Fe and Mn molarconcentration, which explains the relation betweenFR value in glasses and in MnFe
�O
�single crystal.
It is seen from Table 2 that sample nos. 5}8 demon-strate approximately equal FR values. The relationof Mn and Fe molar concentrations in these sam-ples n
�: n
�&0.37 which is less in comparison to
208 I.S. Edelman et al. / Physica B 301 (2001) 203}211

n�
: n�"0.5 for the stoichiometric Mn-ferrite. For
the samples with higher n�
: n�
values (nos. 3, 3a, 4,and 4a) the FR value increases insu$ciently. Com-paring FR values for all samples (excluding 7a and8a with essentially lower thermal treatment temper-ature) one can conclude that almost all Fe ionscome into particles and only part of the Mn ionscorresponding approximately to n
�: n
�&0.5 are
bonding in particles.It is di$cult to understand now the role of dia-
magnetic metal oxides Li�O and BaO, but this role
is of importance. It is enough to note that samplescontaining 0.5% mass MnO without Li
�O or BaO
additions demonstrate no ferrimagnetic behavior.Besides, these additions in#uence the opticalspectra. According to stoichiometry, &0.06%mass Li
�O is necessary for the formation of the
lithium ferrite phase at the 1.5% mass Fe�O
�con-
tent in glass. At the same time lithium is boundedvery well with the borate glass matrix. So a largeamount of Li has to be introduced into the glasscomposition before it begins to be incorporatedinto nanoparticles. Our attempts to obtain lithiumferrite particles in the glass containing no MnOadditions were unsuccessful. There are two possiblevariants: Li helps the phase strati"cation of basicglass composition or it comes to particles which aremixed lithium}manganese ferrites. Similar specula-tions can be applied to BaO additions. Based onthe fact that in the absence of these additions,glasses containing 0.5% mass MnO remain para-magnetic we prefer to assign them some role in theprocess of the glass phase strati"cation.
Returning to the FR "eld dependencies, one cansee from Table 2 that there is a de"nite correlationbetween the remnant FR value (�
�/�
�) and the
temperature FR increase on the one hand and theaverage particles dimensions on the other. At roomtemperature, samples with particle dimensions(130 As are characterized by the FR "eld depend-ence close to the Langevin curve. The average par-ticle dimensions increase causes an increase of theremnant FR value and a decrease of the FR tem-perature coe$cient. Samples nos. 5 and 7a treatedat 5203C are exclusions of this regularity: low par-ticle dimensions correspond to the large remnantFR value. This observation needs additional invest-igation.
As mentioned above, the FR "eld dependenciesfor sample nos. 4 and 4a have practically no hyster-esis. We tried to describe them in the frame of thetheory of non-interacting superparamagnetic par-ticles. The "eld dependence of the magnetization ofan ensemble of such particles is described by theequation
M"N�<¸, (2)
where N is the number of particles, � and V are thesaturation magnetization of the particles materialand the average particles volume,respectively, L isthe Langevin function
¸"cth�<H
k¹
!
k¹
�<H, (3)
where k is the Boltzmann parameter, T is the abso-lute temperature, H is the external magnetic "eld.Since FR is a linear function of the magnetization,the shape of the �(H) curve obtained from theexperiment will coincide with the shape of the L(H)curve if the magnetic properties of the samplesconsidered are due to the superparamagnetic par-ticles. In the case of close enough coincidence onecan estimate the � value of the nanoparticles mater-ial. Such an estimation was realized in the followingway. As it is seen from (3) the shape of the L(H)curve depends on the ratio H/H
�, where
H�"k¹/�<. Several examples are presented in
Fig. 5. Note that L is a dimensionless value and itapproaches unity when H approaches in"nity. Tocompare the L(H) curve with the experimental �(H)curve, we have to present � as a relative value, i.e. todetermine the ratio of � value in de"nite H, forexample, �
�in the maximal H value used in the
experiment, to � when H goes to in"nity: ��/�
.
Varying H�
and ��/�
for sample no. 4a we have
obtained very close coincidence of the experi-mental �
�/�
(H) values and calculated L(H) curves
with such sets of parameters: H�"0.131 kOe and
��/�
"0.92 at ¹"105 K and H
�"0.442 kOe
and ��/�
"0.865 at ¹"293 K (circles in Fig. 5).
Using these H�
values and the particle volumesgiven in Table 2 we have obtained � for sampleno. 4a: &80 Gs cm� g�� for ¹"293 K and&105 Gs cm� g�� for 105 K. Both these values are
I.S. Edelman et al. / Physica B 301 (2001) 203}211 209
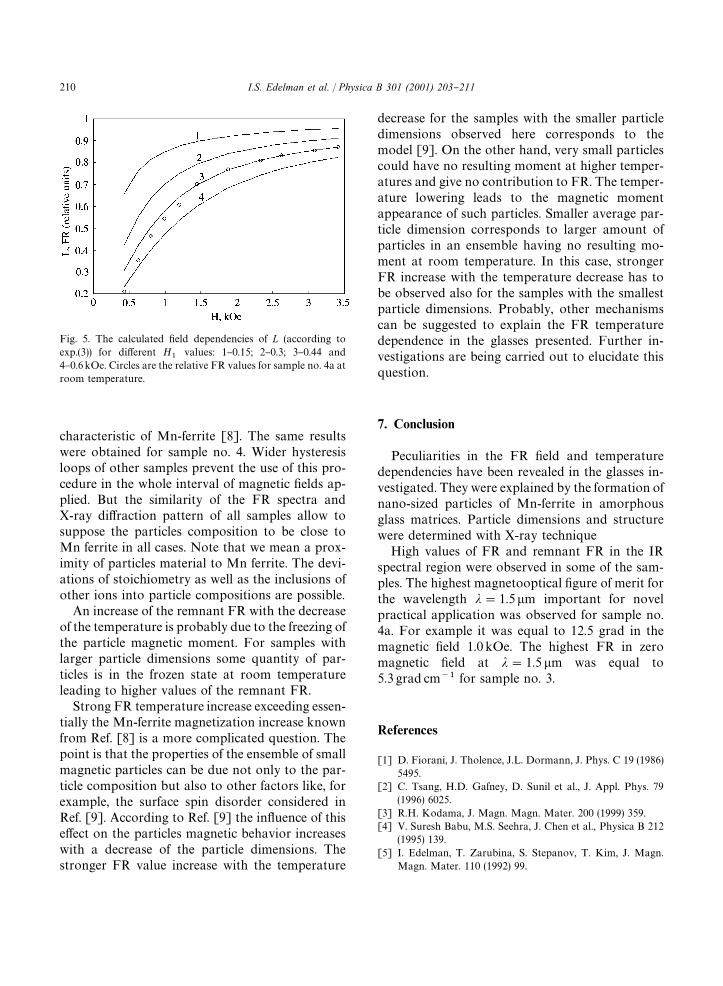
Fig. 5. The calculated "eld dependencies of L (according toexp.(3)) for di!erent H
�values: 1}0.15; 2}0.3; 3}0.44 and
4}0.6 kOe. Circles are the relative FR values for sample no. 4a atroom temperature.
characteristic of Mn-ferrite [8]. The same resultswere obtained for sample no. 4. Wider hysteresisloops of other samples prevent the use of this pro-cedure in the whole interval of magnetic "elds ap-plied. But the similarity of the FR spectra andX-ray di!raction pattern of all samples allow tosuppose the particles composition to be close toMn ferrite in all cases. Note that we mean a prox-imity of particles material to Mn ferrite. The devi-ations of stoichiometry as well as the inclusions ofother ions into particle compositions are possible.
An increase of the remnant FR with the decreaseof the temperature is probably due to the freezing ofthe particle magnetic moment. For samples withlarger particle dimensions some quantity of par-ticles is in the frozen state at room temperatureleading to higher values of the remnant FR.
Strong FR temperature increase exceeding essen-tially the Mn-ferrite magnetization increase knownfrom Ref. [8] is a more complicated question. Thepoint is that the properties of the ensemble of smallmagnetic particles can be due not only to the par-ticle composition but also to other factors like, forexample, the surface spin disorder considered inRef. [9]. According to Ref. [9] the in#uence of thise!ect on the particles magnetic behavior increaseswith a decrease of the particle dimensions. Thestronger FR value increase with the temperature
decrease for the samples with the smaller particledimensions observed here corresponds to themodel [9]. On the other hand, very small particlescould have no resulting moment at higher temper-atures and give no contribution to FR. The temper-ature lowering leads to the magnetic momentappearance of such particles. Smaller average par-ticle dimension corresponds to larger amount ofparticles in an ensemble having no resulting mo-ment at room temperature. In this case, strongerFR increase with the temperature decrease has tobe observed also for the samples with the smallestparticle dimensions. Probably, other mechanismscan be suggested to explain the FR temperaturedependence in the glasses presented. Further in-vestigations are being carried out to elucidate thisquestion.
7. Conclusion
Peculiarities in the FR "eld and temperaturedependencies have been revealed in the glasses in-vestigated. They were explained by the formation ofnano-sized particles of Mn-ferrite in amorphousglass matrices. Particle dimensions and structurewere determined with X-ray technique
High values of FR and remnant FR in the IRspectral region were observed in some of the sam-ples. The highest magnetooptical "gure of merit forthe wavelength �"1.5�m important for novelpractical application was observed for sample no.4a. For example it was equal to 12.5 grad in themagnetic "eld 1.0 kOe. The highest FR in zeromagnetic "eld at �"1.5 �m was equal to5.3 grad cm�� for sample no. 3.
References
[1] D. Fiorani, J. Tholence, J.L. Dormann, J. Phys. C 19 (1986)5495.
[2] C. Tsang, H.D. Gafney, D. Sunil et al., J. Appl. Phys. 79(1996) 6025.
[3] R.H. Kodama, J. Magn. Magn. Mater. 200 (1999) 359.[4] V. Suresh Babu, M.S. Seehra, J. Chen et al., Physica B 212
(1995) 139.[5] I. Edelman, T. Zarubina, S. Stepanov, T. Kim, J. Magn.
Magn. Mater. 110 (1992) 99.
210 I.S. Edelman et al. / Physica B 301 (2001) 203}211

[6] G. Petrovskii, I. Edelman, S. Stepanov, T. Zarubina, T.Kim, Fiz. Chim. Stec. 20 (1994) 748.
[7] L.M. Kovba, V.K. Trunov, X-ray Phase Analysis, MoscowUniversity Publishing House, Moscow, 1976.
[8] J. Smit, H.P.J. Wijn, Ferrites, Philips Technical Library,Eindhoven, The Netherlands, 1959.
[9] R.H. Kodama, A.E. Berkowitz, Phys. Rev. B59 (1999)6321.
I.S. Edelman et al. / Physica B 301 (2001) 203}211 211