superior quality of life and improved surgical margins are ... · laboratory training course. he...
TRANSCRIPT

E U R O P E A N U R O L O G Y 6 5 ( 2 0 1 4 ) 5 2 1 – 5 3 1
ava i lable at www.sciencedirect .com
journal homepage: www.europeanurology.com
Platinum Priority – Prostate CancerEditorial by Andrew J. Vickers on pp. 532–533 of this issue
Superior Quality of Life and Improved Surgical Margins
Are Achievable with Robotic Radical Prostatectomy After
a Long Learning Curve: A Prospective Single-surgeon
Study of 1552 Consecutive Cases
James E. Thompson a,b,c,*, Sam Egger d, Maret Bohm b, Anne-Maree Haynes b,Jayne Matthews a, Krishan Rasiah a, Phillip D. Stricker a,b,c
a St. Vincent’s Prostate Cancer Centre, Darlinghurst, NSW, Australia; b Garvan Institute of Medical Research & The Kinghorn Cancer Centre, Darlinghurst,
NSW, Australia; c The University of New South Wales, Kensington, NSW, Australia; d Cancer Council NSW, Woolloomooloo, NSW, Australia
Article info
Article history:
Accepted October 21, 2013Published online ahead ofprint on October 31, 2013
Keywords:
Comparative study
Learning curve
Oncologic outcomes
Positive surgical margin
Prospective
Quality of life
Radical prostatectomy
Retropubic
Robotic
Please visit
www.eu-acme.org/
europeanurology to read and
answer questions on-line.
Abstract
Background: Comparative studies suggest functional and perioperative superiority ofrobot-assisted radical prostatectomy (RARP) over open radical prostatectomy (ORP).Objective: To determine whether high-volume experienced open surgeons can improvetheir functional and oncologic outcomes with RARP and, if so, how many cases arerequired to surpass ORP outcomes and reach the learning curve plateau.Design, setting, and participants: A prospective observational study compared twosurgical techniques: 1552 consecutive men underwent RARP (866) or ORP (686) at asingle Australian hospital from 2006 to 2012, by one surgeon with 3000 prior ORPs.Outcome measurements and statistical analysis: Demographic and clinicopathologicdata were collected prospectively. The Expanded Prostate Cancer Index Compositequality of life (QoL) questionnaire was administered at baseline, 1.5, 3, 6, 12, and 24mo. Multivariate linear and logistic regression modelled the difference in QoL domainsand positive surgical margin (PSM) odds ratio (OR), respectively, against case number.Results and limitations: A total of 1511 men were included in the PSM and 609 in the QoLanalysis. RARP sexual function scores surpassed ORP scores after 99 RARPs and increasedto a mean difference at 861st case of 11.0 points (95% confidence interval [CI], 5.9–16.1),plateauing around 600–700 RARPs. Early urinary incontinence scores for RARP surpassedORP after 182 RARPs and increased to a mean difference of 8.4 points (95% CI, 2.1–14.7),plateauing around 700–800 RARPs. The odds of a pT2 PSM were initially higher for RARPbut became lower after 108 RARPs and were 55% lower (OR: 0.45; 95% CI, 0.22–0.92) by the866th RARP. The odds of a pT3/4 PSM were initially higher for RARP but decreased,plateauing around 200–300 RARPs with an OR of 1.15 (0.68–1.95) at the 866th RARP.Limitations include single-surgeon data and residual confounding.Conclusions: RARP had a long learning curve with inferior outcomes initially, andthen showed progressively superior sexual, early urinary, and pT2 PSM outcomesand similar pT3 PSM and late urinary outcomes. Learning RARP was worthwhile forthis high-volume surgeon, but the learning curve may not be justifiable for late-career/low-volume surgeons; further studies are needed.
soc
The EU-ACME credits will# 2013 European As
then be attributed
automatically.* Corresponding author. Prostate Cancer Clinical Research Group, Level 6, Kinghorn Cancer Centre,370 Victoria Street, Darlinghurst, NSW 2010, Australia. Tel. +61 2 9355 5790.
[email protected] (J.E. Thompson).
E-mail address: drjetho0302-2838/$ – see back matter # 2013 European Association of Urology. Phttp://dx.doi.org/10.1016/j.eururo.2013.10.030
iation of Urology. Published by Elsevier B.V. All rights reserved.
ublished by Elsevier B.V. All rights reserved.

E U R O P E A N U R O L O G Y 6 5 ( 2 0 1 4 ) 5 2 1 – 5 3 1522
1. Introduction
Radical prostatectomy is a treatment option for localised
prostate cancer in men with a life expectancy exceeding
10–15 yr [1]. Open radical prostatectomy (ORP) is the gold
standard technique; however, robot-assisted radical pros-
tatectomy (RARP) is gaining popularity. Recent studies
report superior quality of life (QoL) and equivalent positive
surgical margin (PSM) outcomes with RARP compared with
ORP [2–5], but there remains a paucity of high-quality
evidence. Randomised trials are underway [6–8]. However,
according to trial protocols, participating surgeons perform
ORP or RARP but not both. Hence the skill and experience of
individual surgeons may confound results.
Men undergoing RARP during a surgeon’s learning curve
may be subject to treatment selection bias, with selection
potentially based on factors such as current QoL, age,
disease characteristics, desire for nerve sparing, and prior
hormonal therapy. Despite this, many of these potential
confounders were not adjusted for in previous studies,
thereby producing results vulnerable to confounding
from treatment selection bias. No studies have attempted[(Fig._1)TD$FIG]
Fig. 1 – Flow diagram showing patient participation.ADT = androgen-deprivation therapy; EPIC = Expanded Prostate Cancer Index Cprostatectomy; RARP = robot-assisted radical prostatectomy.
in-depth modelling of the learning curve effect on
functional and oncologic outcomes across >800 cases,
adjusting comprehensively for confounders. Describing the
learning curve up to 850 cases for one highly experienced
high-volume open surgeon may guide open surgeons who
are considering learning RARP.
The objectives of this study were to determine if an
experienced surgeon could improve QoL and PSM outcomes
by learning RARP, and if so, to determine how many RARPs
were required to achieve superiority and to reach the
learning curve plateau for each outcome.
2. Patients and methods
2.1. Patients and study design
Between March 2006 and September 2012, a single surgeon (PS), who
had performed >3000 prior ORPs, performed his first 866 RARPs
independently (following supervised training by an expert surgeon)
(Fig. 1) at St. Vincent’s private hospital in Sydney, Australia. PS’s initial
robotic training consisted of limited experience in laparoscopic surgery,
an accredited intensive robotic training workshop, and an animal
omposite; HRQoL = health-related quality of life; ORP = open radical

Table 1 – Slope coefficients for the associations between quality oflife/positive surgical margin outcomes and surgeon’s open radicalprostatectomy (ORP) case number during the study period for ORPpatients
Outcome Slope coefficientV
p value
Sexual function* �0.004 0.833
Sexual bother* 0.011 0.739
Urinary function* 0.014 0.338
Urinary bother* 0.017 0.253
Urinary irritative obstruction* 0.008 0.728
Urinary incontinence* 0.015 0.226
Positive surgical marginV
�0.002 0.169
Data are for ORP patients only.* Slope coefficient obtained from linear regression of quality of life (QoL)
outcome on surgeon’s ORP case number during the study period. General
estimating equations were used to account for the repeated QoL
measurements on the same individuals at different time intervals.V
Slope coefficient obtained from logistic regression of positive surgical
margin outcome on surgeon’s ORP case number during the study period.
Note: Linear and logistic regression models were adjusted for age at surgery,
calendar year of surgery, socioeconomic status of residence, place of
residence, baseline prostate-specific antigen, pathologic stage, Gleason
score on biopsy, and hormonal preoperation therapy. Linear (QoL)
regression models were additionally adjusted for baseline QoL score,
time after surgery, and adjuvant therapy.
E U R O P E A N U R O L O G Y 6 5 ( 2 0 1 4 ) 5 2 1 – 5 3 1 523
laboratory training course. He received initial mentoring and proctoring
by an experienced surgeon for 20 cases until deemed competent and
further proctoring by a leading expert to approximately case number 50
to further refine his technique. He also obtained observerships with
three leading robotic surgeons prior to and during the first year of
robotics.
PS also performed 686 ORPs during the period of the study. All 1552
men in consultation with a multidisciplinary team chose their preferred
surgical method and consented to be enrolled in a prospective research
database. Overall, 1511 patients with complete data were included in the
PSM analysis. All were invited to participate in the prospective Expanded
Prostate Cancer Index Composite (EPIC) QoL study of which 637 agreed;
609 had sufficient data for inclusion in this QoL analysis. The hospital’s
ethics committee approved the study.
2.2. Outcome measures
2.2.1. Quality-of-life outcome measures
Participants in the EPIC QoL study received a self-administered question-
naire at baseline and at 1.5, 3, 6, 12, and 24 mo following treatment. The
questionnaire included questions from EPIC [9], developed from the UCLA
Prostate Cancer Index [10], to assess health-related quality of life (HRQoL)
in men with prostate cancer. The EPIC questions measure QoL scores for
Urinary, Bowel, Sexual, and Hormonal summary domains, and each
Domain Summary Score is composed of Function and Bother subscales. In
addition, the Urinary Domain summary score includes distinct Inconti-
nence and Irritation/Obstruction subscales. All scores (and also differences
in mean scores) are determined on 100-point scales, where lower scores
indicate poorer QoL.
2.2.2. Positive surgical margin outcome measures
All prostatectomy specimens were processed according to International
Society of Urological Pathology/American Joint Committee on Cancer
guidelines with whole-mount step sectioning at 3-mm intervals. A PSM
was defined as tumour involving the inked margin of the cut surface.
2.3. Surgical technique
The ORP technique was performed as described by Walsh [11].
Retrograde nerve sparing was performed selectively based on
preoperative risk stratification (using the Partin nomogram) [12]
and adjusted according to operative findings. Extent of nerve sparing
was defined as 0 (no neurovascular nerve bundle [NVB] preservation),
0.5 (partial NVB preservation), or 1 (complete NVB preservation) for
each side; a total score of 0–2 was recorded postoperatively. Bladder
neck reconstruction, eversion, and six-suture urethrovesical anasto-
mosis were performed.
The transperitoneal RARP technique used was previously described
by Rocco and colleagues [13], using the da Vinci Si robotic system
(Intuitive Surgical, Sunnyvale, CA, USA). Prior suture ligation of the
dorsal venous complex (except where there was a significant aberrant
pudendal artery) followed by division, selective bladder neck preserva-
tion, and combined antegrade/retrograde nerve sparing were performed,
adjusted according to visual feedback in selected high-risk cases. A Rocco
posterior stitch, suspension stitch, and continuous anastomosis were
performed.
2.4. Statistical analyses
Multivariate linear regression analyses with generalized estimating
equation adjustment to account for repeated outcome observations on
the same individual were used to estimate adjusted mean differences in
QoL scores between treatments according to surgeon experience [14].
Separate regression models were fitted for each HRQoL domain subscale,
with each model sharing a common formulation. Subscale-specific
scores were defined as the dependent variable in each model with the
corresponding baseline score as a continuous independent variable.
Categorical covariates included time since surgery (1.5, 3, 6, 12,
24 mo), age (38–54, 55–59, 60–64, 65–77 yr), year of surgery
(2006–2007, 2008–2009, 2010–2012), socioeconomic status of resi-
dence area (divided into quintiles using the Socio-Economic Indexes
for Areas) [15], remoteness of residence (major city, inner regional,
outer regional, remote/very remote based on Accessibility/Remote-
ness Index of Australia) [16], baseline prostate-specific antigen (PSA)
(<4, 4–10, >10 ng/ml), pathologic stage (pT1c–pT2c, pT3A–pT4),
biopsy Gleason score (<7, 7, >7), hormonal preoperative therapy
(no, yes), adjuvant therapy (no, yes), and operation type (ORP vs
RARP). Models were not adjusted for NVB preservation because
this variable potentially is situated on causal pathways between
surgery type and QoL outcomes (and additional adjustment for NVB
did not materially change any estimates anyway). QoL scores were
found not to be associated with the surgeon’s ORP case number
(presumably the surgeon had plateaued in his ORP learning curve;
Table 1). Consequently, mean ORP QoL scores were modelled in the
regression equations as constant.
The RARP learning curve relationship between mean QoL score and
RARP case number was found to be most suitably modelled in the
regression equations by natural log functions. To assess whether the
learning curve was significantly modified by time after surgery, terms
for interaction between learning curves and a dichotomous variable
(1.5–6 and 12–24 mo after surgery) were added to the regression
models.
The relationship between PSM risk and surgeon’s experience was
modelled using logistic regression. Independent variables included those
in the linear regression models except for baseline QoL score, time since
surgery, and adjuvant therapy. The surgeon’s learning curves for ORP and
RARP were again modelled as constant and natural log functions,
respectively. Modification of the learning curve by pathologic stage
(pT2 vs pT3–4) was modelled using interaction terms. In the absence of
published studies defining a ‘‘plateau point’’ in the learning curve, an
increase of 1 point in QoL score or 10% decrease in the PSM odds ratio
(OR) per 150 additional cases was proposed.

E U R O P E A N U R O L O G Y 6 5 ( 2 0 1 4 ) 5 2 1 – 5 3 1524
3. Results
Table 2 summarises the baseline demographics and clinical
characteristics. They were similar between the 1511 men
in the PSM analysis and the subset included in the QoL
analysis (see supplemental data, Supplemental Table 1,
comparing baseline characteristics of the QoL and PSM
analysis groups). There were differences between the RARP
Table 2 – Demographic and clinical characteristics by analysis type an
HRQoL analysesy (n = 6
ORP RARP
Characteristic (n = 230) (n = 379)
Age at surgery, yr
Median 60.9 62.2
Quartiles 56–65 57–66
Age group (%)
38–54 48 (21) 53 (14)
55–59 49 (21) 87 (23)
60–64 62 (27) 117 (31)
65–77 71 (31) 122 (32)
Calendar year of surgery (%)
2006–2007 74 (32) 37 (10)
2008–2009 119 (52) 162 (43)
2010–2012 37 (16) 180 (47)
SES of residence area (%)
1 (highest SES) 109 (47) 220 (58)
2 47 (20) 65 (17)
3 38 (17) 42 (11)
4 25 (11) 35 (9)
5 (lowest SES) 11 (5) 17 (4)
Place of residence (%)
Remote/Very remote 3 (1) 5 (1)
Outer regional 41 (18) 46 (12)
Inner regional 49 (21) 70 (18)
Major city 137 (60) 258 (68)
PSA at baseline
Median, ng/ml 6.7 5.9
Quartiles, ng/ml 4.8–10.4 4.2–7.8
PSA group (%)
<4 ng/ml 28 (12) 82 (22)
4–10 ng/ml 144 (63) 258 (68)
>10 ng/ml 58 (25) 39 (10)
Pathologic stage (%)
pT2 129 (56) 250 (66)
pT3–pT4 101 (44) 129 (34)
Gleason score on biopsy (%)
<7 16 (7) 55 (15)
7 176 (77) 281 (74)
>7 38 (17) 43 (11)
Hormonal preoperative therapy (%)
No 206 (90) 369 (97)
Yes 24 (10) 10 (3)
Adjuvant therapy (%)
No 219 (95) 373 (98)
Yes 11 (5) 6 (2)
NVB score (%)
0, 0.5 16 (7) 15 (4)
1, 1.5 69 (30) 57 (15)
2 145 (63) 307 (81)
HRQoL = health-related quality of life; ORP = open radical prostatectomy; NVB =
assisted radical prostatectomy; SES = socioeconomic status.y All patients included in the HRQoL analyses are also included in the surgical m* Adjuvant therapy data are not shown for the surgical margin cohort because ad
margin.
and ORP groups at baseline as demonstrated in Table 2: a
larger proportion of ORP patients had their operation in
2006–2007 than RARP patients (53% vs 8%); the ORP group
had a higher median PSA (6.8 vs 5.8 ng/ml) and higher
proportions with PSA >10 (25% vs 12%), Gleason score >7
(18% vs 11%), pathologic stage >T2 (42% vs 38%), and
neoadjuvant therapy (11% vs 4%). Patients in the ORP group
were less likely to undergo complete NVB preservation
d prostatectomy group
09) Surgical margin analyses* (n = 1511)
ORP RARP
p value (n = 674) (n = 837) p value
61.2 62.0
56–65 57–66
0.165 131 (19) 140 (17) 0.403
160 (24) 187 (22)
179 (27) 236 (28)
204 (30) 274 (33)
<0.001 359 (53) 70 (8) <0.001
198 (29) 300 (36)
117 (17) 467 (56)
0.112 353 (52) 481 (57) 0.380
126 (19) 139 (17)
99 (15) 105 (13)
63 (9) 75 (9)
33 (5) 37 (4)
0.143 7 (1) 10 (1) 0.221
99 (15) 109 (13)
136 (20) 141 (17)
432 (64) 577 (69)
6.8 5.8
4.9–10.0 4.3–7.8
<0.001 83 (12) 170 (20) <0.001
424 (63) 569 (68)
167 (25) 98 (12)
0.015 391 (58) 521 (62) 0.094
283 (42) 316 (38)
0.007 74 (11) 119 (14) <0.001
478 (71) 627 (75)
122 (18) 91 (11)
<0.001 602 (89) 800 (96) <0.001
72 (11) 37 (4)
0.020 n/a n/a n/a
n/a n/a
<0.001 42 (6) 30 (4) <0.001
186 (28) 142 (17)
446 (66) 665 (79)
neurovascular nerve bundle; PSA = prostate-specific antigen; RARP = robot-
argin analyses.
juvant therapy occurs postsurgery and thus cannot causally affect the surgical
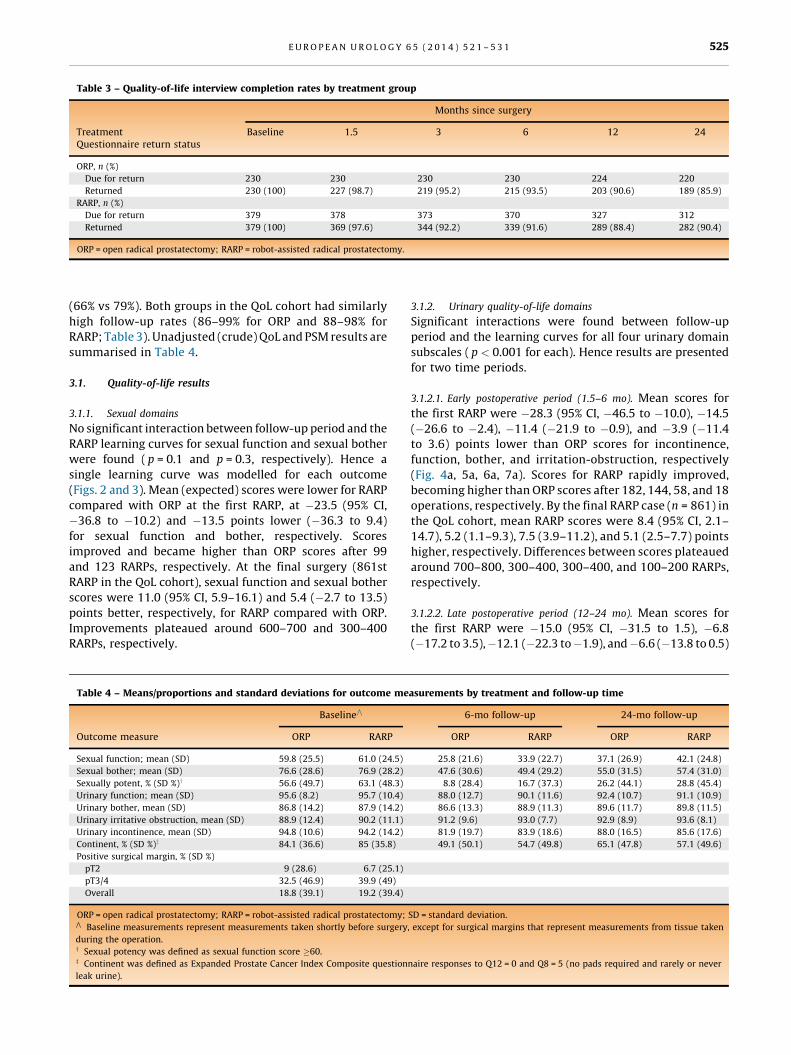
Table 3 – Quality-of-life interview completion rates by treatment group
Months since surgery
TreatmentQuestionnaire return status
Baseline 1.5 3 6 12 24
ORP, n (%)
Due for return 230 230 230 230 224 220
Returned 230 (100) 227 (98.7) 219 (95.2) 215 (93.5) 203 (90.6) 189 (85.9)
RARP, n (%)
Due for return 379 378 373 370 327 312
Returned 379 (100) 369 (97.6) 344 (92.2) 339 (91.6) 289 (88.4) 282 (90.4)
ORP = open radical prostatectomy; RARP = robot-assisted radical prostatectomy.
E U R O P E A N U R O L O G Y 6 5 ( 2 0 1 4 ) 5 2 1 – 5 3 1 525
(66% vs 79%). Both groups in the QoL cohort had similarly
high follow-up rates (86–99% for ORP and 88–98% for
RARP; Table 3). Unadjusted (crude) QoL and PSM results are
summarised in Table 4.
3.1. Quality-of-life results
3.1.1. Sexual domains
No significant interaction between follow-up period and the
RARP learning curves for sexual function and sexual bother
were found ( p = 0.1 and p = 0.3, respectively). Hence a
single learning curve was modelled for each outcome
(Figs. 2 and 3). Mean (expected) scores were lower for RARP
compared with ORP at the first RARP, at �23.5 (95% CI,
�36.8 to �10.2) and �13.5 points lower (�36.3 to 9.4)
for sexual function and bother, respectively. Scores
improved and became higher than ORP scores after 99
and 123 RARPs, respectively. At the final surgery (861st
RARP in the QoL cohort), sexual function and sexual bother
scores were 11.0 (95% CI, 5.9–16.1) and 5.4 (�2.7 to 13.5)
points better, respectively, for RARP compared with ORP.
Improvements plateaued around 600–700 and 300–400
RARPs, respectively.
Table 4 – Means/proportions and standard deviations for outcome me
BaselineV
Outcome measure ORP RARP
Sexual function; mean (SD) 59.8 (25.5) 61.0 (24.5)
Sexual bother; mean (SD) 76.6 (28.6) 76.9 (28.2)
Sexually potent, % (SD %)y 56.6 (49.7) 63.1 (48.3)
Urinary function; mean (SD) 95.6 (8.2) 95.7 (10.4)
Urinary bother, mean (SD) 86.8 (14.2) 87.9 (14.2)
Urinary irritative obstruction, mean (SD) 88.9 (12.4) 90.2 (11.1)
Urinary incontinence, mean (SD) 94.8 (10.6) 94.2 (14.2)
Continent, % (SD %)z 84.1 (36.6) 85 (35.8)
Positive surgical margin, % (SD %)
pT2 9 (28.6) 6.7 (25.1)
pT3/4 32.5 (46.9) 39.9 (49)
Overall 18.8 (39.1) 19.2 (39.4)
ORP = open radical prostatectomy; RARP = robot-assisted radical prostatectomy;V
Baseline measurements represent measurements taken shortly before surgery
during the operation.y Sexual potency was defined as sexual function score �60.z Continent was defined as Expanded Prostate Cancer Index Composite question
leak urine).
3.1.2. Urinary quality-of-life domains
Significant interactions were found between follow-up
period and the learning curves for all four urinary domain
subscales ( p < 0.001 for each). Hence results are presented
for two time periods.
3.1.2.1. Early postoperative period (1.5–6 mo). Mean scores for
the first RARP were �28.3 (95% CI, �46.5 to �10.0), �14.5
(�26.6 to �2.4), �11.4 (�21.9 to �0.9), and �3.9 (�11.4
to 3.6) points lower than ORP scores for incontinence,
function, bother, and irritation-obstruction, respectively
(Fig. 4a, 5a, 6a, 7a). Scores for RARP rapidly improved,
becoming higher than ORP scores after 182, 144, 58, and 18
operations, respectively. By the final RARP case (n = 861) in
the QoL cohort, mean RARP scores were 8.4 (95% CI, 2.1–
14.7), 5.2 (1.1–9.3), 7.5 (3.9–11.2), and 5.1 (2.5–7.7) points
higher, respectively. Differences between scores plateaued
around 700–800, 300–400, 300–400, and 100–200 RARPs,
respectively.
3.1.2.2. Late postoperative period (12–24 mo). Mean scores for
the first RARP were �15.0 (95% CI, �31.5 to 1.5), �6.8
(�17.2 to 3.5),�12.1 (�22.3 to�1.9), and�6.6 (�13.8 to 0.5)
asurements by treatment and follow-up time
6-mo follow-up 24-mo follow-up
ORP RARP ORP RARP
25.8 (21.6) 33.9 (22.7) 37.1 (26.9) 42.1 (24.8)
47.6 (30.6) 49.4 (29.2) 55.0 (31.5) 57.4 (31.0)
8.8 (28.4) 16.7 (37.3) 26.2 (44.1) 28.8 (45.4)
88.0 (12.7) 90.1 (11.6) 92.4 (10.7) 91.1 (10.9)
86.6 (13.3) 88.9 (11.3) 89.6 (11.7) 89.8 (11.5)
91.2 (9.6) 93.0 (7.7) 92.9 (8.9) 93.6 (8.1)
81.9 (19.7) 83.9 (18.6) 88.0 (16.5) 85.6 (17.6)
49.1 (50.1) 54.7 (49.8) 65.1 (47.8) 57.1 (49.6)
SD = standard deviation.
, except for surgical margins that represent measurements from tissue taken
naire responses to Q12 = 0 and Q8 = 5 (no pads required and rarely or never

[(Fig._2)TD$FIG]
Fig. 2 – Adjusted differences in mean sexual function scores (robot-assisted radical prostatectomy [RARP] minus open radical prostatectomy[ORP]) by surgeon RARP experience (number of prior RARPs) formeasurements taken between 1.5 and 24 mo after surgery.yAdjusted for time after surgery, baseline sexual function score, age atsurgery, calendar year of surgery, socioeconomic status of residence,place of residence, baseline prostate-specific antigen, pathologic stage,Gleason score on biopsy, hormonal preoperation therapy, and adjuvanttherapy.* Difference in means (95% confidence interval) at first RARP.** Difference in means at last RARP (n = 861).V
Number of prior RARPs required for RARP mean score to exceed ORPmean score.# Number of prior RARPs where an additional 150 operations will resultin a one-unit increase in the mean difference.CI = confidence interval.
[(Fig._3)TD$FIG]
Fig. 3 – Adjusted differences in mean sexual bother scores (robot-assistedradical prostatectomy [RARP] minus open radical prostatectomy [ORP])by surgeon RARP experience (number of prior RARPs) for measurementstaken between 1.5 and 24 mo after surgery.yAdjusted for time after surgery, baseline sexual bother score, age atsurgery, calendar year of surgery, socioeconomic status of residence,place of residence, baseline prostate-specific antigen, pathologic stage,Gleason score on biopsy, hormonal preoperation therapy, and adjuvanttherapy.* Difference in means (95% confidence interval) at first RARP.** Difference in means at last RARP (n = 861).V
Number of prior RARPs required for RARP mean score to exceed ORPmean score.# Number of prior RARPs where an additional 150 operations will resultin a one-unit increase in the mean difference.CI = confidence interval.
[(Fig._4)TD$FIG]
Fig. 4 – Adjusted differences in mean urinary function scores (robot-assisted radical prostatectomy [RARP] minus open radical prostatectomy [ORP]) bysurgeon RARP experience (number of prior RARPs) for measurements taken between (a) 1.5–6 mo after surgery and (b) 12–24 mo after surgery.yAdjusted for time after surgery, baseline sexual bother score, age at surgery, calendar year of surgery, socioeconomic status of residence, place ofresidence, baseline prostate-specific antigen, pathologic stage, Gleason score on biopsy, hormonal preoperation therapy, and adjuvant therapy.* Difference in means (95% confidence interval) at first RARP.** Difference in means at last RARP (n = 861).V
Number of prior RARPs required for RARP mean score to exceed ORP mean score.# Number of prior RARPs where an additional 150 operations will result in a one unit increase in the mean difference.CI = confidence interval.
E U R O P E A N U R O L O G Y 6 5 ( 2 0 1 4 ) 5 2 1 – 5 3 1526

[(Fig._5)TD$FIG]
Fig. 5 – Adjusted differences in mean urinary bother scores (robot-assisted radical prostatectomy [RARP] minus open radical prostatectomy [ORP]) bysurgeon RARP experience (number of prior RARPs) for measurements taken between (a) 1.5–6 mo after surgery and (b) 12–24 mo after surgery.yAdjusted for time after surgery, baseline sexual bother score, age at surgery, calendar year of surgery, socioeconomic status of residence, place ofresidence, baseline prostate-specific antigen, pathologic stage, Gleason score on biopsy, hormonal preoperation therapy, and adjuvant therapy.* Difference in means (95% confidence interval) at first RARP.** Difference in means at last RARP (n = 861).V
Number of prior RARPs required for RARP mean score to exceed ORP mean score.# Number of prior RARPs where an additional 150 operations will result in a one-unit increase in the mean difference.CI = confidence interval.
E U R O P E A N U R O L O G Y 6 5 ( 2 0 1 4 ) 5 2 1 – 5 3 1 527
points lower than ORP scores for incontinence, function,
bother, and irritation-obstruction, respectively (Fig. 4b, 5b,
6b, 7b). RARP scores improved rapidly early in the learning
curve but plateaued sooner than RARP scores for 1–6 mo.
RARP scores became higher than ORP scores after 579, 284,
and 222 RARPs for incontinence, bother, and irritation-
obstruction, respectively, and they never became higher for
function. Differences between scores plateaued around
200–300, 50–100, 200–300, and 200–300 RARPs for
incontinence, function, bother, and irritation-obstruction,
respectively (Figs. 4–7).
3.2. Oncologic results: positive surgical margins
Because there was a significant interaction between the
PSM risk learning curve and pathologic stage ( p = 0.036),
PSM learning curves are reported by pathologic stage
(Fig. 8). In pT2 disease, the odds of a PSM were 6.19 times
higher (95% CI, 1.20–31.80) for RARP than ORP at first RARP
but became lower after 108 RARPs and plateaued around
400–500 RARPs. At the final RARP (n = 866) in the study, the
odds of a PSM were 55% lower for RARP compared with ORP
(OR: 0.45 [95% CI, 0.22–0.92]). In pT3–4 disease, the odds of
a PSM were initially 4.71 times higher (95% CI, 0.90–24.60)
for RARP and plateaued around 200–300 cases. The odds
of a PSM remained 17% higher with RARP at the final
RARP; however, the confidence limits were wide (OR: 1.17
[95% CI, 0.70–1.97]).
4. Discussion
In this study, an experienced high-volume open surgeon
improved his surgical margins and a number of his QoL
outcomes by learning RARP. This study adds to the evidence
base because it uses a validated QoL tool (EPIC), adjusts for
more confounders than previous studies, extends the
learning curve analysis to approximately 850 cases, and
demonstrates a benefit for highly experienced open
surgeons.
Unadjusted potency and continence rates (Table 4) may
appear lower than some series; this is due to the strict
definitions of continence and potency imposed by the EPIC
QoL tool, the inclusion of all men with baseline erectile
dysfunction and impotence, and the absence of adjustment
for learning curve and other confounders in these raw
figures.
The improved potency outcomes with RARP in this study
are consistent with a recent meta-analysis of six compara-
tive studies that reported erectile dysfunction in 47.4% of
men 12 mo following ORP, compared with 24.2% following
RARP (OR: 2.84; p = 0.002) [3]. Degree of nerve sparing was
not adjusted for in our study because RARP may improve

[(Fig._6)TD$FIG]
Fig. 6 – Adjusted differences in mean urinary incontinence scores (robot-assisted radical prostatectomy [RARP] minus open radical prostatectomy [ORP])by surgeon RARP experience (number of prior RARPs) for measurements taken between (a) 1.5–6 mo after surgery and (b) 12–24 mo after surgery.yAdjusted for time after surgery, baseline sexual bother score, age at surgery, calendar year of surgery, socioeconomic status of residence, place ofresidence, baseline prostate-specific antigen, pathologic stage, Gleason score on biopsy, hormonal preoperation therapy, and adjuvant therapy.* Difference in means (95% confidence interval) at first RARP.** Difference in means at last RARP (n = 861).V
Number of prior RARPs required for RARP mean score to exceed ORP mean score.# Number of prior RARPs where an additional 150 operations will result in a one-unit increase in the mean difference.CI = confidence interval.[(Fig._7)TD$FIG]
1.5–6 12–24
Fig. 7 – Adjusted differences in mean urinary irritative obstruction scores (robot-assisted radical prostatectomy [RARP] minus open radical prostatectomy[ORP]) by surgeon RARP experience (number of prior RARPs) for measurements taken between (a) 1.5–6 mo after surgery and (b) 12–24 mo after surgery.yAdjusted for time after surgery, baseline sexual bother score, age at surgery, calendar year of surgery, socioeconomic status of residence, place ofresidence, baseline prostate-specific antigen, pathologic stage, Gleason score on biopsy, hormonal preoperation therapy, and adjuvant therapy.* Difference in means (95% confidence interval) at first RARP.** Difference in means at last RARP (n = 861).V
Number of prior RARPs required for RARP mean score to exceed ORP mean score.# Number of prior RARPs where an additional 150 operations will result in a one-unit increase in the mean difference.CI = confidence interval.
E U R O P E A N U R O L O G Y 6 5 ( 2 0 1 4 ) 5 2 1 – 5 3 1528

[(Fig._8)TD$FIG]
Pathologic PathologicpT2 pT3/pT4
Fig. 8 – Adjusted robot-assisted radical prostatectomy (RARP) versus open radical prostatectomy [ORP] (reference group) odds ratios for positive surgicalmargin by surgeon RARP experience (number of prior RARPs) stratified by pathologic stage.yAdjusted for time after surgery, baseline sexual bother score, age at surgery, calendar year of surgery, socioeconomic status of residence, place ofresidence, baseline prostate-specific antigen, pathologic stage, Gleason score on biopsy, hormonal preoperation therapy, and adjuvant therapy.* Difference in means (95% confidence interval) at first RARP.** Difference in means at last RARP (n = 861).V
Number of prior RARPs required for RARP mean score to exceed ORP mean score.# Number of prior RARPs where an additional 150 operations will result in a one-unit increase in the mean difference.CI = confidence interval.
E U R O P E A N U R O L O G Y 6 5 ( 2 0 1 4 ) 5 2 1 – 5 3 1 529
precision in intrafascial nerve sparing through enhanced
magnification, greater degrees of freedom, downscaled
movements, controlled gentle retraction, antegrade ap-
proach, and reducing venous bleeding. Intrafascial nerve
sparing may damage fewer cavernous nerve fibres and
reduce traction neurapraxia, improving potency outcomes
[17,18].
The improved early urinary outcomes seen with RARP are
consistent with previous studies by our group [19] and others
[20]. In a 2012 meta-analysis of 51 studies, incontinence at
12 mo was 11.3% after ORP and 7.5% after RARP (OR for
incontinence: 1.53; p = 0.03) [21]. Improved early continence
may be due to the improved distribution of tension, reduced
anastomotic leaks, and reduced suture knot fibrosis with a
continuous 12-suture anastomosis. Robotics may facilitate
apical preservation of the pubourethral ligaments, fascia, and
delicate neurovascular supply to the external sphincter.
The finding of lower pT2 PSM risk with RARP after
approximately 100 cases suggests that RARP may be
oncologically superior after a modest learning curve for
organ-confined (pT2) disease, even for an experienced open
surgeon. A previous smaller study demonstrated the same
finding [22]. Two meta-analyses [2,5] and a literature
review [4] showed equivalent pT2 PSM rates, but they did
not model PSM risk across the learning curve. One
published study reported higher pT2 PSM rates for RARP,
but results were confounded by comparing the ORP series of
one surgeon with the RARP series of another [23].
For extraprostatic (pT3) disease in this study, RARP
achieved a similar PSM risk to ORP late in the learning curve.
A recent meta-analysis reported lower PSM rates for ORP
than RARP in pT3 disease, but adjustment for confounders
was limited and the learning curve was not analysed [2].
One recent study showed equivalent PSM outcomes for
RARP and ORP in higher risk disease for experienced robotic
surgeons [24]. A multi-institutional review of 3794 patients
showed a learning curve of>1000 cases before the pT3 PSM
rate plateaued [25]. Therefore, RARP for high-risk disease
should be avoided early in the learning curve but appears
equivalent in experienced robotic surgeons.
Surgeon experience across a learning curve of >1000
cases and heterogeneity (due to unmeasured surgeon
factors) were previously shown to be significant predictors
of biochemical recurrence after ORP [26,27]. Experienced
open surgeons therefore argue that individual surgeon skill
and experience are more important predictors of outcomes
than operative approach, and that their excellent ORP
results are due to having reached a plateau in the learning
curve [28,29], beyond which they are unlikely to improve
further by learning RARP. Our PSM results suggest that
although RARP exhibited a similarly long learning curve to
that shown in ORP studies, the assumption that ORP
outcomes cannot be improved upon by RARP for an
experienced surgeon may be inaccurate. RARP involves a
long learning curve, and patients early in the learning curve
may experience worse QoL and PSM outcomes than if they

E U R O P E A N U R O L O G Y 6 5 ( 2 0 1 4 ) 5 2 1 – 5 3 1530
had undergone ORP by the same surgeon [19,25]. A trifecta
of superior early continence, sexual function, and pT2 PSM
risk required >300 cases in our study, as did achieving
similar late continence and pT3 PSM risk outcomes.
If our results are validated in future studies, it would
suggest that learning RARP may be worthwhile for young
or high-volume surgeons but may not be for late-career
(<10 yr of practise remaining) or midcareer low-volume
(<25 cases per year) surgeons because it may a take a low-
volume surgeon 5 yr to achieve equivalent outcomes and
15 yr to achieve superior outcomes. Fellowship training
likely shortens the learning curve [30–32], but undertaking
a 12-mo robotic fellowship is impractical for established
surgeons. For these surgeons, a combination of intensive
workshops, advanced simulator dry labs, live animal/
cadaveric wet labs, and observerships and closely super-
vised preceptorships may shorten the learning curve.
The most important limitation of this study is that it is a
single-surgeon study. The learning curve may vary widely
between surgeons, just as an individual surgeon is an
independent predictor of outcomes even for highly experi-
enced surgeons [27]. This limits the generalizability of the
study to surgeons with different levels of training, experi-
ence, caseload, and case complexity. External factors may
contribute to the learning curve too, such as the level of
training and experience with robotic surgery of the surgical
assistant, operating room nurses, anaesthetists, and tech-
nical staff.
Our study is subject to other limitations. First, a major
limitation is that PSM is a weak surrogate for subsequent
oncologic outcomes; biochemical recurrence, cancer pro-
gression, and survival end points are preferable but require
longer follow-up. Second, although statistical adjustments
can compensate for the nonrandomised nature of observa-
tional studies, some residual confounding is likely to remain
due mostly to unidentified confounding factors. Thus some
unidentified confounder may be the causal factor explain-
ing the differences in outcomes rather than the RARP
technique itself. This major limitation of an observational
study such as ours may alter (to an unknown extent) our
results and therefore precludes us from drawing definitive
conclusions. Randomised trials are underway and may
provide more definitive conclusions; however, published
protocols suggest individual surgeon factors may confound
results because participating surgeons will perform only
ORP or RARP rather than both techniques. Finally, only 609
men had sufficient QoL data for analysis because some men
met exclusion criteria, declined participation, or dropped
out. Despite this, there were no baseline differences
between the QoL and overall cohorts to suggest a selection
bias, and the retention rate was high (Table 2).
5. Conclusions
In this single-surgeon analysis, RARP had a long learning
curve with inferior outcomes initially but then progressive-
ly superior sexual, early urinary, and pT2 PSM outcomes,
and equivalent pT3 PSM and late urinary outcomes.
Although our study suggests that switching to RARP could
be worthwhile for some high-volume surgeons, high-
quality studies are needed that analyse the learning curves
of surgeons with varying case volumes, experience,
laparoscopic training, and robotic fellowship training.
Author contributions: James E. Thompson had full access to all the data in
the study and takes responsibility for the integrity of the data and the
accuracy of the data analysis.
Study concept and design: Stricker, Thompson, Rasiah.
Acquisition of data: Bohm, Haynes, Thompson, Matthews.
Analysis and interpretation of data: Thompson, Egger, Stricker.
Drafting of the manuscript: Thompson, Egger.
Critical revision of the manuscript for important intellectual content: Bohm,
Haynes, Rasiah, Stricker.
Statistical analysis: Thompson, Egger.
Obtaining funding: Stricker, Matthews, Rasiah, Haynes.
Administrative, technical, or material support: Matthews, Haynes, Bohm.
Supervision: Stricker, Rasiah.
Other (specify): None.
Financial disclosures: James E. Thompson certifies that all conflicts of
interest, including specific financial interests and relationships and
affiliations relevant to the subject matter or materials discussed in the
manuscript (eg, employment/affiliation, grants or funding, consultan-
cies, honoraria, stock ownership or options, expert testimony, royalties,
or patents filed, received, or pending), are the following: None.
Funding/Support and role of the sponsor: St. Vincent’s Prostate Cancer
Centre, St. Vincent’s Clinic Foundation, and the Cancer Council NSW
helped design and conduct the study, collect, manage, analyse, and
interpret the data, and prepare, review, and approve the manuscript.
Appendix A. Supplementary data
Supplementary data associated with this article can be
found, in the online version, at http://dx.doi.org/10.1016/
j.eururo.2013.10.030.
References
[1] Heidenreich A, Bellmunt J, Bolla M, et al. EAU guidelines on prostate
cancer. Part 1: screening, diagnosis, and treatment of clinically
localised disease. Eur Urol 2011;59:61–71.
[2] Tewari A, Sooriakumaran P, Bloch DA, Seshadri-Kreaden U,
Hebert AE, Wiklund P. Positive surgical margin and perioperative
complication rates of primary surgical treatments for prostate
cancer: a systematic review and meta-analysis comparing retro-
pubic, laparoscopic, and robotic prostatectomy. Eur Urol 2012;
62:1–15.
[3] Ficarra V, Novara G, Ahlering TE, et al. Systematic review and meta-
analysis of studies reporting potency rates after robot-assisted
radical prostatectomy. Eur Urol 2012;62:418–30.
[4] Wilson T, Torrey R. Open versus robotic-assisted radical prostatec-
tomy: which is better? Curr Opin Urol 2011;21:200–5.
[5] Novara G, Ficarra V, Mocellin S, et al. Systematic review and meta-
analysis of studies reporting oncologic outcome after robot-assisted
radical prostatectomy. Eur Urol 2012;62:382–404.
[6] Thompson RH, Tollefson M. Prospective randomized trial compar-
ing robotic versus open radical prostatectomy. ClinicalTrials.gov
Web site. http://clinicaltrials.gov/show/NCT01365143.
[7] Darzi A. Open prostatectomy versus laparoscopic prostatectomy
versus robot-assisted prostatectomy for organ-confined prostate
cancer. International Standard Randomized Controlled Trials Web
site. http://www.controlled-trials.com/ISRCTN59410552.
E U R O P E A N U R O L O G Y 6 5 ( 2 0 1 4 ) 5 2 1 – 5 3 1 531
[8] Gardiner RA, Yaxley J, Coughlin G, et al. A randomised trial of robotic
and open prostatectomy in men with localised prostate cancer.
BMC Cancer 2012;12:189.
[9] Wei JT, Dunn RL, Litwin MS, Sandler HM, Sanda MG. Development
and validation of the expanded prostate cancer index composite
(EPIC) for comprehensive assessment of health-related quality of
life in men with prostate cancer. Urology 2000;56:899–905.
[10] Litwin MS, Hays RD, Fink A, Ganz PA, Leake B, Brook RH. The UCLA
Prostate Cancer Index: development, reliability, and validity of
a health-related quality of life measure. Med Care 1998;36:
1002–12.
[11] Walsh PC. Anatomic radical prostatectomy: evolution of the surgical
technique. J Urol 1998;160:2418–24.
[12] Eifler JB, Feng Z, Lin BM, et al. An updated prostate cancer staging
nomogram (Partin tables) based on cases from 2006 to 2011. BJU
Int 2013;111:22–9.
[13] Rocco B, Coelho RF, Albo G, Patel VR. Robot-assisted laparoscopic
prostatectomy: surgical technique [in Italian]. Minerva Urol Nefrol
2010;62:295–304.
[14] Zeger SL, Liang KY. Longitudinal data analysis for discrete and
continuous outcomes. Biometrics 1986;42:121–30.
[15] Australian Bureau of Statistics (ABS). Census of population and
housing: socio-economic indexes for areas: Australia data. ABS
Web site. http://www.abs.gov.au/websitedbs/censushome.nsf/home/
seifa?opendocument&navpos=260.
[16] Glover J, Tennant S. Remote areas statistical geography in
Australia: notes on the Accessibility/Remoteness Index for Australia
(ARIA+ version). Working Paper Series No. 9. Public Health Informa-
tion Development Unit. PublicHealth.gov Web site. http://www.
publichealth.gov.au/pdf/reports_papers/working_papers_other/
wk_ppr9_remoteness_aria+.pdf
[17] Schatloff O, Chauhan S, Kameh D, et al. Cavernosal nerve preserva-
tion during robot-assisted radical prostatectomy is a graded rather
than an all-or-none phenomenon: objective demonstration by
assessment of residual nerve tissue on surgical specimens. Urology
2012;79:596–600.
[18] Tewari AK, Srivastava A, Huang MW, et al. Anatomical grades
of nerve sparing: a risk-stratified approach to neural-hammock
sparing during robot-assisted radical prostatectomy (RARP). BJU Int
2011;108:984–92.
[19] Doumerc N, Yuen C, Savdie R, et al. Should experienced open
prostatic surgeons convert to robotic surgery? The real learning
curve for one surgeon over 3 years. BJU Int 2010;106:378–84.
[20] Rocco B, Matei DV, Melegari S, et al. Robotic vs open prostatectomy
in a laparoscopically naive centre: a matched-pair analysis. BJU Int
2009;104:991–5.
[21] Ficarra V, Novara G, Rosen RC, et al. Systematic review and
meta-analysis of studies reporting urinary continence recovery
after robot-assisted radical prostatectomy. Eur Urol 2012;62:
405–17.
[22] Smith Jr JA, Chan RC, Chang SS, et al. A comparison of the incidence
and location of positive surgical margins in robotic assisted
laparoscopic radical prostatectomy and open retropubic radical
prostatectomy. J Urol 2007;178:2385–9, discussion 2389–90.
[23] Williams SB, Chen MH, D’Amico AV, et al. Radical retropubic prosta-
tectomy and robotic-assisted laparoscopic prostatectomy: likelihood
of positive surgical margin(s). Urology 2010;76:1097–101.
[24] Silberstein JL, Su D, Glickman L, et al. A case-mix-adjusted compar-
ison of early oncological outcomes of open and robotic prostatec-
tomy performed by experienced high volume surgeons. BJU Int
2013;111:206–12.
[25] Sooriakumaran P, John M, Wiklund P, Lee D, Nilsson A, Tewari AK.
Learning curve for robotic assisted laparoscopic prostatectomy: a
multi-institutional study of 3794 patients. Minerva Urol Nefrol
2011;63:191–8.
[26] Klein EA, Bianco FJ, Serio AM, et al. Surgeon experience is strongly
associated with biochemical recurrence after radical prostatectomy
for all preoperative risk categories. J Urol 2008;179:2212–6,
discussion 2216–7.
[27] Bianco Jr FJ, Vickers AJ, Cronin AM, et al. Variations among experi-
enced surgeons in cancer control after open radical prostatectomy.
J Urol 2010;183:977–82.
[28] Vickers AJ, Savage CJ, Bianco FJ, et al. Surgery confounds biology:
the predictive value of stage-, grade- and prostate-specific antigen
for recurrence after radical prostatectomy as a function of surgeon
experience. Int J Cancer 2011;128:1697–702.
[29] Vickers AJ, Bianco FJ, Serio AM, et al. The surgical learning curve for
prostate cancer control after radical prostatectomy. J Natl Cancer
Inst 2007;99:1171–7.
[30] Leroy TJ, Thiel DD, Duchene DA, et al. Safety and peri-operative
outcomes during learning curve of robot-assisted laparoscopic
prostatectomy: a multi-institutional study of fellowship-trained
robotic surgeons versus experienced open radical prostatectomy
surgeons incorporating robot-assisted laparoscopic prostatectomy.
J Endourol 2010;24:1665–9.
[31] Kwon EO, Bautista TC, Jung H, Goharderakhshan RZ, Williams SG,
Chien GW. Impact of robotic training on surgical and pathologic
outcomes during robot-assisted laparoscopic radical prostatec-
tomy. Urology 2010;76:363–8.
[32] Bianco FJ, Cronin AM, Klein EA, Pontes JE, Scardino PT, Vickers AJ.
Fellowship training as a modifier of the surgical learning curve.
Acad Med 2010;85:863–8.