superior plus corp. announces 2021 second quarter results
TRANSCRIPT
Superior Plus Corp. 1 2021 Second Quarter Results
TSX: SPB
August 11, 2021
Superior Plus Corp. Announces 2021 Second Quarter Results and Updated 2021 Adjusted EBITDA Guidance
Superior Plus Corp. (“Superior”) (TSX:SPB) announced today its financial and operating results for the second quarter ended June 30, 2021. Unless otherwise expressed, all financial figures are expressed in Canadian dollars. “We have made great progress this year on our Superior Way Forward acquisition and operational improvement initiatives, including six acquisitions completed or announced for total consideration of ~$600 million,” said Luc Desjardins, President and Chief Executive Officer. “We are increasing the bottom end of our Adjusted EBITDA guidance range to reflect the expected impact from the acquisitions in 2021, and reflecting some anticipated challenges in the last six months due to weaker wholesale propane market fundamentals, the higher commodity price environment in 2021 and the slower than expected recovery from COVID-19. Our trailing twelve month Adjusted EBITDA as at June 30, 2021 pro forma the impact of the acquisitions announced in 2021 was approximately $460 million, which excludes the anticipated synergies we expect based on past acquisitions.” Financial Highlights:
Superior achieved second quarter Adjusted EBITDA of $31.6 million, a $7.5 million or 19% decrease over the prior year quarter primarily due to lower EBITDA from operations in U.S. propane distribution (“U.S. Propane”) and higher corporate costs, partially offset by higher EBITDA from operations in Canadian propane distribution (“Canadian Propane”) and realized gains on foreign exchange hedging contracts compared to a realized loss in the prior year quarter.
Net loss from continuing operations of $36.1 million in the second quarter decreased $36.0 million over the second quarter of 2020 primarily due higher finance expense, lower unrealized gains on derivatives and foreign currency translation of borrowing recorded in the current quarter and lower gross profit, partially offset by the impact of the Canadian Emergency Wage Subsidy (“CEWS”) recorded in the current quarter.
U.S. Propane EBITDA from operations was $14.0 million, a decrease of $13.1 million or 48% compared to the prior year quarter primarily due to higher operating costs and lower adjusted gross profit. Due to the seasonality of the U.S. Propane business, the second quarter represents ~16% of the volumes and ~22% of the operating costs for the year. The seasonality impact results in a more substantial increase in operating costs from acquisitions with less contribution from volumes and adjusted gross profit. Adjusted gross profit decreased $9.4

Superior Plus Corp. 2 2021 Second Quarter Results
million primarily due to lower sales volumes, excluding the impact of acquisitions, related to warmer weather and, to a lesser extent, lower unit margins related to short-term margin opportunities that existed in Q1 2020 with lower commodity prices, the impact of the stronger Canadian dollar on the translation of U.S. denominated adjusted gross profit and customer mix, partially offset by the impact of acquisitions completed in the last twelve months and higher commercial demand as the U.S. emerged from COVID-19 restrictions. Sales volumes were higher due to the contribution from acquisitions completed in the last twelve months partially offset by warmer weather. Average weather, as measured by degree days, across markets where U.S. propane operates for 2021 was 14% warmer than the prior year and 4% colder than the five-year average. Operating costs increased by $5.2 million primarily due to higher sales volumes, incremental costs related to acquisitions completed in the last twelve months and inflation, partially offset by cost-saving initiatives, realized synergies from acquisitions and the impact of the stronger Canadian dollar on U.S. denominated operating expenses.
Canadian Propane EBITDA from operations of $23.0 million, increased $1.8 million or 8% from the prior year quarter primarily due to lower operating expenses, partially offset by lower adjusted gross profit. Operating costs decreased $4.7 million due to the impact from the CEWS benefit and cost-saving initiatives. Adjusted gross profit decreased $3.9 million primarily due to lower average margins related to weaker wholesale propane fundamentals and customer mix, partially offset by higher commercial and wholesale sales volumes. Average weather across Canada for the second quarter, as measured by degree days was 14% warmer than the prior year and 7% warmer than the five-year average.
Corporate costs for the second quarter of 2021 were $8.2 million, a $1.2 million increase compared to the prior year quarter due to higher long-term incentive plan costs related to share price appreciation in the current quarter. In the second quarter of 2021, Superior had realized gains on foreign currency hedging contracts of $2.8 million compared to realized losses of $2.2 million in the prior year quarter due to the average hedge rate of the foreign exchange contracts and the strengthening of the Canadian dollar.
AOCF before transaction and other costs during the second quarter was $9.0 million, a $5.5 million or 38% decrease compared to the prior year quarter primarily due to lower Adjusted EBITDA and higher cash tax expenses, partially offset by lower interest expense. AOCF before transaction and other costs per share was $0.04, $0.04 lower than the prior year for the reasons noted above and an increase in the weighted average shares outstanding. Weighted average shares outstanding, which assumes the exchange of the preferred shares into common shares, were higher than the prior year quarter primarily due to the issuance of preferred shares in the prior year, and to a lesser extent, the impact of shares issued under the Dividend Reinvestment Plan in the prior year.
Superior’s Total Net Debt to Adjusted EBITDA leverage ratio for the trailing twelve months ended June 30, 2021, was 3.3x, which is within Superior’s long-term target range of 3.0x to 3.5x.
Superior is increasing the bottom end of the 2021 Adjusted EBITDA range due to the expected contribution from the Freeman Gas and Kamps acquisitions, with expected Adjusted EBITDA guidance in the range of $390 million to $420 million up from the previously disclosed range of $380 million to $420 million. Average weather for the remainder of 2021 is anticipated to be consistent with the five-year average for the U.S. and Canada.
Strategic Developments and Highlights:
On July 14, 2021, Superior announced that one of its wholly-owned subsidiaries entered into an agreement to acquire the equity interests of Kamps Propane, Inc., High Country Propane, Inc., Pick Up Propane, Inc., Kiva Energy, Inc., Competitive Capital, Inc. and Propane Construction and Meter Services (collectively, “Kamps”) for an aggregate purchase price of approximately US $240 million (CDN $299 million) before adjustments for working capital. Founded in 1969 by John Kamps, Kamps is an established independent family owned and
Superior Plus Corp. 3 2021 Second Quarter Results
operated retail and wholesale propane distributor based in California servicing approximately 45,000 residential, commercial and wholesale customers. Kamps has 14 retail branch offices, 5 company-operated rail terminals, over 375 vehicles and approximately 280 employees.
On July 7, 2021, Superior acquired the assets of a retail propane distribution company based in North Carolina, operating under the tradename, Williams Energy Group (“Williams Energy”). Founded in 1998, Williams Energy is an established independent retail propane distributor delivering approximately 7 million gallons of propane annually to 12,000 retail and commercial customers in North Carolina.
On June 16, 2021 Superior acquired the assets of a retail propane distribution company based in South Carolina, operating under the tradename, Freeman Gas and Electric Co., Inc. (“Freeman”) for an aggregate purchase price of US $169.2 million ($207.7 million) before adjustments for working capital.
On May 18, 2021, Superior sold CDN$500 million aggregate principal amount of 4.25% unsecured notes due May 18, 2028, which were issued at par (the “Offering”). Superior also redeemed all of its outstanding: (i) CDN$400 million principal amount of 5.25% senior unsecured notes due February 27, 2024 (the “2024 Notes”) in accordance with the indenture governing the 2024 Notes; and (ii) CDN$370 million principal amount of 5.125% senior unsecured notes due August 27, 2025 (the “2025 Notes”) in accordance with the indenture governing the 2025 Notes.
On May 25, 2021, Superior outlined the “Superior Way Forward”, a strategic roadmap targeting EBITDA from Operations of $700 million to $750 million in 2026.
On April 19, 2021, recognizing the importance of sustainability and ESG principles in how Superior operates and in its business strategy, Superior published its inaugural Sustainability Report.
On April 9, 2021, Superior amended the syndicated credit facility and extended the maturity to May 8, 2026.
There were no changes to the total commitments available under the credit facility ($750 million), the accordion capacity ($300 million) or the financial covenants.
On April 9, 2021 Superior completed the sale of its Specialty Chemicals business to Birch Hill Equity Partners
for total consideration of $725 million (the “Transaction”). Under the terms of the Transaction, Superior received $600 million in cash proceeds from Birch Hill, subject to certain adjustments, and $125 million in the form of a 6% unsecured note issued by the affiliate of Birch Hill that is acquiring Specialty Chemicals. The consideration received is subject to certain post-closing adjustments as previously disclosed.
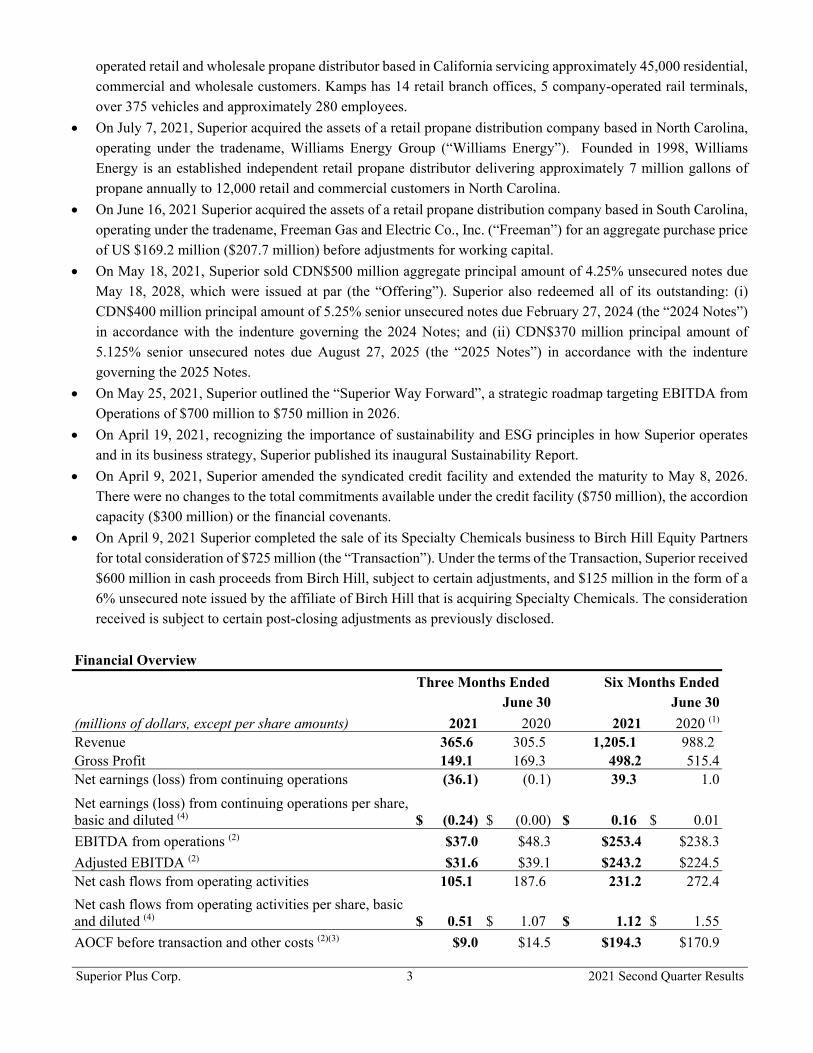
Financial Overview
Three Months Ended Six Months Ended June 30 June 30
(millions of dollars, except per share amounts) 2021 2020 2021 2020 (1) Revenue 365.6 305.5 1,205.1 988.2 Gross Profit 149.1 169.3 498.2 515.4 Net earnings (loss) from continuing operations (36.1) (0.1) 39.3 1.0
Net earnings (loss) from continuing operations per share, basic and diluted (4) $ (0.24) $ (0.00) $ 0.16 $ 0.01
EBITDA from operations (2) $37.0 $48.3 $253.4 $238.3
Adjusted EBITDA (2) $31.6 $39.1 $243.2 $224.5 Net cash flows from operating activities 105.1 187.6 231.2 272.4
Net cash flows from operating activities per share, basic and diluted (4) $ 0.51 $ 1.07 $ 1.12 $ 1.55
AOCF before transaction and other costs (2)(3) $9.0 $14.5 $194.3 $170.9
Superior Plus Corp. 4 2021 Second Quarter Results
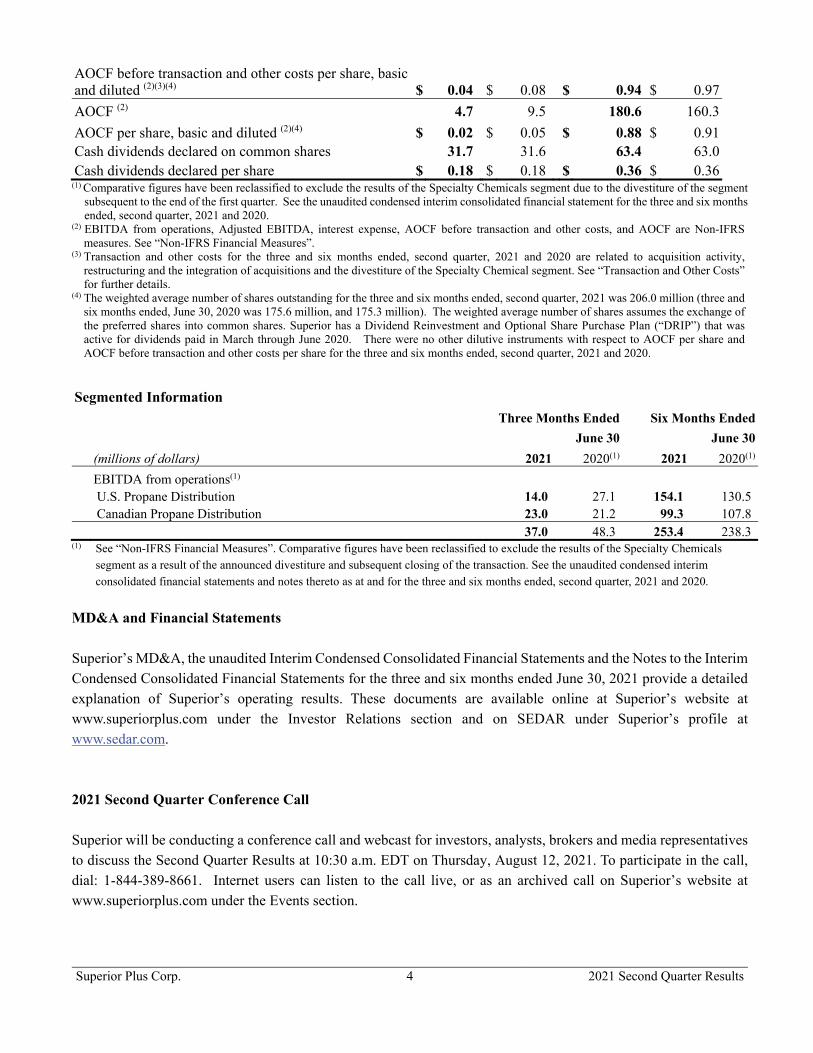
AOCF before transaction and other costs per share, basic and diluted (2)(3)(4) $ 0.04 $ 0.08 $ 0.94 $ 0.97
AOCF (2) 4.7 9.5 180.6 160.3
AOCF per share, basic and diluted (2)(4) $ 0.02 $ 0.05 $ 0.88 $ 0.91 Cash dividends declared on common shares 31.7 31.6 63.4 63.0 Cash dividends declared per share $ 0.18 $ 0.18 $ 0.36 $ 0.36
(1) Comparative figures have been reclassified to exclude the results of the Specialty Chemicals segment due to the divestiture of the segment subsequent to the end of the first quarter. See the unaudited condensed interim consolidated financial statement for the three and six months ended, second quarter, 2021 and 2020.
(2) EBITDA from operations, Adjusted EBITDA, interest expense, AOCF before transaction and other costs, and AOCF are Non-IFRS measures. See “Non-IFRS Financial Measures”.
(3) Transaction and other costs for the three and six months ended, second quarter, 2021 and 2020 are related to acquisition activity, restructuring and the integration of acquisitions and the divestiture of the Specialty Chemical segment. See “Transaction and Other Costs” for further details.
(4) The weighted average number of shares outstanding for the three and six months ended, second quarter, 2021 was 206.0 million (three and six months ended, June 30, 2020 was 175.6 million, and 175.3 million). The weighted average number of shares assumes the exchange of the preferred shares into common shares. Superior has a Dividend Reinvestment and Optional Share Purchase Plan (“DRIP”) that was active for dividends paid in March through June 2020. There were no other dilutive instruments with respect to AOCF per share and AOCF before transaction and other costs per share for the three and six months ended, second quarter, 2021 and 2020.
Segmented Information Three Months Ended Six Months Ended
June 30 June 30
(millions of dollars) 2021 2020(1) 2021 2020(1)
EBITDA from operations(1) U.S. Propane Distribution 14.0 27.1 154.1 130.5 Canadian Propane Distribution 23.0 21.2 99.3 107.8 37.0 48.3 253.4 238.3 (1) See “Non-IFRS Financial Measures”. Comparative figures have been reclassified to exclude the results of the Specialty Chemicals
segment as a result of the announced divestiture and subsequent closing of the transaction. See the unaudited condensed interim consolidated financial statements and notes thereto as at and for the three and six months ended, second quarter, 2021 and 2020.
MD&A and Financial Statements Superior’s MD&A, the unaudited Interim Condensed Consolidated Financial Statements and the Notes to the Interim Condensed Consolidated Financial Statements for the three and six months ended June 30, 2021 provide a detailed explanation of Superior’s operating results. These documents are available online at Superior’s website at www.superiorplus.com under the Investor Relations section and on SEDAR under Superior’s profile at www.sedar.com. 2021 Second Quarter Conference Call Superior will be conducting a conference call and webcast for investors, analysts, brokers and media representatives to discuss the Second Quarter Results at 10:30 a.m. EDT on Thursday, August 12, 2021. To participate in the call, dial: 1-844-389-8661. Internet users can listen to the call live, or as an archived call on Superior’s website at www.superiorplus.com under the Events section.
Superior Plus Corp. 5 2021 Second Quarter Results
Non-IFRS Financial Measures
Throughout the first quarter earnings release, Superior has used the following terms that are not defined by International Financial Reporting Standards (“Non-IFRS Financial Measures”), but are used by management to evaluate the performance of Superior and its business: AOCF before and after transaction and other costs, earnings before interest, taxes, depreciation and amortization (“EBITDA”) from operations, Adjusted Gross Profit, Adjusted EBITDA, Total Debt to Adjusted EBITDA leverage ratio, Senior Debt, Credit Facility EBITDA and Senior Debt to Credit Facility EBITDA leverage ratio. These measures may also be used by investors, financial institutions and credit rating agencies to assess Superior’s performance and ability to service debt. Non-IFRS financial measures do not have standardized meanings prescribed by IFRS and are therefore unlikely to be comparable to similar measures presented by other companies. Securities regulations require that Non-IFRS financial measures are clearly defined, qualified and reconciled to their most comparable IFRS financial measures. Except as otherwise indicated, these Non-IFRS financial measures are calculated and disclosed on a consistent basis from period to period. Specific items may only be relevant in certain periods. See “Non-IFRS Financial Measures” in the MD&A for a discussion of Non-IFRS financial measures and certain reconciliations to IFRS financial measures.
The intent of Non-IFRS financial measures is to provide additional useful information to investors and analysts, and the measures do not have any standardized meaning under IFRS. The measures should not, therefore, be considered in isolation or used in substitute for measures of performance prepared in accordance with IFRS. Other issuers may calculate Non-IFRS financial measures differently. Investors should be cautioned that AOCF, EBITDA from operations, Adjusted EBITDA and Credit Facility EBITDA should not be construed as alternatives to net earnings, cash flow from operating activities or other measures of financial results determined in accordance with IFRS as an indicator of Superior’s performance. Adjusted Operating Cash Flow and Adjusted Operating Cash Flow per Share AOCF is equal to cash flow from operating activities as defined by IFRS, adjusted for changes in non-cash working capital, other expenses, non-cash interest expense, current income taxes and finance costs. Superior may deduct or include additional items in its calculation of AOCF; these items would generally, but not necessarily, be infrequent in nature and could distort the analysis of trends in business performance. Excluding these items does not imply they are non-recurring. AOCF and AOCF per share are presented before and after transaction and other costs. AOCF per share before transaction and other costs is calculated by dividing AOCF before transaction and other costs by the weighted average number of shares outstanding. AOCF per share is calculated by dividing AOCF by the weighted average number of shares outstanding. AOCF is a performance measure used by management and investors to evaluate Superior’s ongoing performance of its businesses and ability to generate cash flow. AOCF represents cash flow generated by Superior that is available for, but not necessarily limited to, changes in working capital requirements, investing activities and financing activities of Superior. The seasonality of Superior’s individual quarterly results must be assessed in the context of annualized AOCF. Adjustments recorded by Superior as part of its calculation of AOCF include, but are not limited to, the impact of the seasonality of Superior’s businesses, principally the Energy Distribution segment, by adjusting for non-cash working capital items, thereby eliminating the impact of the timing between the recognition and collection/payment of Superior’s revenues and expenses, which can differ significantly from quarter to quarter. AOCF is reconciled to
Superior Plus Corp. 6 2021 Second Quarter Results
cash flow from operating activities. Please refer to the Financial Overview section of the MD&A for the reconciliation. EBITDA from operations EBITDA from operations is defined as Adjusted EBITDA excluding costs that are not considered representative of Superior’s underlying core operating performance, including gains and losses on foreign currency hedging contracts, corporate costs and transaction and other costs. Management uses EBITDA from operations to set targets for Superior (including annual guidance and variable compensation targets). EBITDA from operations is reconciled to net earnings before income taxes. Please refer to the Results of Operating Segments in the MD&A for the reconciliations. Adjusted EBITDA Adjusted EBITDA represents earnings before interest, taxes, depreciation, amortization, losses (gains) on disposal of assets, finance expense, restructuring costs, transaction and other costs, and unrealized gains (losses) on derivative financial instruments. Adjusted EBITDA is used by Superior and investors to assess its consolidated results and ability to service debt. Adjusted EBITDA is reconciled to net earnings before income taxes. Adjusted EBITDA is a significant performance measure used by management and investors to evaluate Superior’s ongoing performance of its businesses. Adjusted EBITDA is also used as one component in determining short-term incentive compensation for certain management employees. The seasonality of Superior’s individual quarterly results must be assessed in the context of annualized Adjusted EBITDA. Total Net Debt to Adjusted EBITDA Leverage Ratio and Pro Forma Adjusted EBITDA Adjusted EBITDA for the Total Net Debt to Adjusted EBITDA Leverage Ratio is defined as Adjusted EBITDA calculated on a 12-month trailing basis giving pro forma effect to acquisitions and dispositions adjusted to the first day of the calculation period (“Pro Forma Adjusted EBITDA”). Pro Forma Adjusted EBITDA is used by Superior to calculate its Total Net Debt to Adjusted EBITDA Leverage Ratio. Total Net Debt is determined by taking the sum of borrowings before deferred financing fees and lease liabilities and reducing this by the cash and cash equivalents balance. To calculate the Total Net Debt to Adjusted EBITDA Leverage Ratio divide Total Net Debt by Pro Forma Adjusted EBITDA. Total Net Debt to Adjusted EBITDA Leverage Ratio is used by Superior and investors to assess its ability to service debt. Forward Looking Information
Certain information included herein is forward-looking information within the meaning of applicable Canadian securities laws. Forward-looking information may include statements regarding the objectives, business strategies to achieve those objectives, expected financial results (including those in the area of risk management), economic or market conditions, and the outlook of or involving Superior, Superior LP and its businesses. Such information is
Superior Plus Corp. 7 2021 Second Quarter Results
typically identified by words such as “anticipate”, “believe”, “continue”, “estimate”, “expect”, “plan”, “forecast”, “future”, “outlook, “guidance”, “may”, “project”, “should”, “strategy”, “target”, “will” or similar expressions suggesting future outcomes. Forward-looking information in this document includes: future financial position, consolidated and business segment outlooks, updated 2021 Adjusted EBITDA guidance range, anticipated synergies on acquisitions in 2021, the markets for our products and our financial results, business strategy and objectives, development plans and programs, organic growth, weather, economic activity in Western Canada, product pricing and sourcing, wholesale propane market fundamentals, exchange rates, expected seasonality of demand, and future economic conditions. Forward-looking information is provided for the purpose of providing information about management’s expectations and plans about the future and may not be appropriate for other purposes. Forward-looking information herein is based on various assumptions and expectations that Superior believes are reasonable in the circumstances. No assurance can be given that these assumptions and expectations will prove to be correct. Those assumptions and expectations are based on information currently available to Superior, including information obtained from third party industry analysts and other third party sources, and the historic performance of Superior’s businesses. Such assumptions include the closing of the Kamps acquisition in the third quarter of 2021 in accordance with the terms of the agreement, integration of acquisitions in 2021 consistent with past experience, anticipated financial performance, current business and economic trends, the amount of future dividends paid by Superior, business prospects, utilization of tax basis, regulatory developments, currency, exchange and interest rates, future commodity prices relating to the oil and gas industry, future oil rig activity levels, trading data, cost estimates, our ability to obtain financing on acceptable terms, expected life of facilities and statements regarding net working capital and capital expenditure requirements of Superior or Superior LP, the assumptions set forth under the “Financial Outlook” sections of our MD&A. The forward looking information is also subject to the risks and uncertainties set forth below. By its very nature, forward-looking information involves numerous assumptions, risks and uncertainties, both general and specific. Should one or more of these risks and uncertainties materialize or should underlying assumptions prove incorrect, as many important factors are beyond our control, Superior’s or Superior LP’s actual performance and financial results may vary materially from those estimates and intentions contemplated, expressed or implied in the forward-looking information. These risks and uncertainties include risks relating to satisfaction of the conditions to, and completion of, the Kamps acquisition, our ability to integrate acquisitions and realize synergies consistent with past experience, incorrect assessments of value when making acquisitions, increases in debt service charges, the loss of key personnel, the anticipated impact of the COVID-19 pandemic and the expected economic recession, fluctuations in foreign currency and exchange rates, inadequate insurance coverage, liability for cash taxes, counterparty risk, compliance with environmental laws and regulations, reduced customer demand, operational risks involving our facilities, force majeure, labour relations matters, our ability to access external sources of debt and equity capital, and the risks identified in (i) our MD&A under the heading “Risk Factors” and (ii) Superior’s most recent Annual Information Form. The preceding list of assumptions, risks and uncertainties is not exhaustive. When relying on our forward-looking information to make decisions with respect to Superior, investors and others should carefully consider the preceding factors, other uncertainties and potential events. Any forward-looking information is provided as of the date of this document and, except as required by law, neither Superior nor Superior LP undertakes to update or revise such information to reflect new information, subsequent or otherwise. For the reasons set forth above, investors should not place undue reliance on forward-looking information.
Superior Plus Corp. 8 2021 Second Quarter Results
For more information about Superior, visit our website at www.superiorplus.com or contact: Beth Summers Executive Vice President and Chief Financial Officer Phone: (416) 340-6015
Rob Dorran Vice President, Investor Relations and Treasurer
Phone: (416) 340-6003 Toll Free: 1-866-490-PLUS (7587)
Superior Plus Corp. 9 2021 Second Quarter Results
MANAGEMENT’S DISCUSSION AND ANALYSIS OF 2021 SECOND QUARTER RESULTS AUGUST 11, 2021 This Management’s Discussion and Analysis (MD&A) contains information about the performance and financial position of Superior Plus Corp. (Superior) as at and for the three and six months ended June 30, 2021 and 2020, as well as forward-looking information about future periods. The information in this MD&A is current to August 11, 2021, and should be read in conjunction with Superior’s unaudited condensed interim consolidated financial statements and notes thereto as at and for the three and six months ended June 30, 2021 and 2020. The accompanying unaudited condensed interim consolidated financial statements of Superior were prepared by and are the responsibility of Superior’s management. Superior’s unaudited condensed interim consolidated financial statements as at and for the three and six months ended June 30, 2021 and 2020 were prepared in accordance with International Accounting Standards (IAS) 34, Interim Financial Reporting as issued by the International Accounting Standards Board (IASB). All financial amounts in this MD&A are expressed in millions of Canadian dollars except where otherwise noted. All tables are for the three and six months ended June 30 of the period indicated, unless otherwise stated. This MD&A includes forward-looking statements and assumptions. See “Forward-Looking Information” for more details. Overview of Superior Superior is a diversified business corporation. Superior holds 99.9% of Superior Plus LP (Superior LP), a limited partnership formed between Superior General Partner Inc. (Superior GP) as general partner and Superior as limited partner. Superior owns 100% of the shares of Superior GP and Superior GP holds 0.1% of Superior LP. The cash flow of Superior is solely dependent on the results of Superior LP and is derived from the allocation of Superior LP’s income to Superior by means of partnership allocations. Superior, through its ownership of Superior LP and Superior GP, has two operating segments: U.S. Propane Distribution, and Canadian Propane Distribution. The U.S. Propane Distribution segment distributes propane gas and liquid fuels primarily in the Eastern United States, as well as the Midwest and California. The Canadian Propane Distribution segment includes the Canadian retail propane distribution business and the wholesale natural gas liquid marketing businesses with operations located in Canada and California. The previously disclosed Specialty Chemicals segment has been divested, see the Basis of Presentation and Divestiture section below for further details. Non-IFRS Financial Measures Throughout the MD&A, Superior has used the following terms that are not defined under International Financial Reporting Standards (IFRS), but are used by management to evaluate the performance of Superior and its businesses: adjusted operating cash flow (AOCF) before and after transaction and other costs, earnings before interest, taxes, depreciation and amortization (EBITDA) from operations, Adjusted EBITDA, Operating Costs, Interest expense, Total Net Debt to Adjusted EBITDA, Leverage Ratio and Adjusted Gross Profit. These measures may also be used by investors, financial institutions and credit rating agencies to assess Superior’s performance and ability to service debt. Non-IFRS financial measures do not have standardized meaning prescribed by IFRS and are therefore unlikely to be comparable to similar measures presented by other companies. Securities regulations require that Non-IFRS financial measures are clearly defined, qualified and reconciled to their most comparable IFRS financial measures. Except as otherwise indicated, these Non-IFRS financial measures are calculated and disclosed on a consistent basis from period to period. Specific items may only be relevant in certain periods. The intent of using Non-IFRS financial measures is to provide additional useful information to investors and analysts; the measures do not have standardized meaning under IFRS. The measures should not, therefore, be considered in isolation or used in substitute for measures of performance prepared in accordance with IFRS. Other issuers may calculate Non-IFRS financial measures differently. See “Non-IFRS Financial Measures” for more information about these measures.
Superior Plus Corp. 10 2021 Second Quarter Results
Forward-Looking Information Certain information included herein is forward-looking information within the meaning of applicable Canadian securities laws. Forward-looking information may include statements regarding the objectives, business strategies to achieve those objectives, expected financial results (including those in the area of risk management), economic or market conditions, and the outlook of or involving Superior, Superior LP and its businesses. Such information is typically identified by words such as “anticipate”, “believe”, “continue”, “estimate”, “expect”, “plan”, “forecast”, “future”, “outlook”, “guidance”, “may”, “project”, “should”, “strategy”, “target”, “will” or similar expressions suggesting future outcomes. Forward-looking information in this document includes: future financial position, consolidated and business segment outlooks, updated 2021 Adjusted EBITDA guidance range, expected Adjusted EBITDA, the duration and anticipated impact of the COVID-19 pandemic and the expected economic recession, estimates of the impact COVID-19 may have on our operations, the markets for our products and our financial results, expected total net debt to Adjusted EBITDA ratio, business strategy and objectives, development plans and programs, organic growth, weather, economic activity in Western Canada, product pricing and sourcing, volumes and pricing, wholesale propane market fundamentals, exchange rates, expected synergies from acquisitions, expected seasonality of demand, and future economic conditions. Forward-looking information is provided for the purpose of providing information about management’s expectations and plans about the future and may not be appropriate for other purposes. Forward-looking information herein is based on various assumptions and expectations that Superior believes are reasonable in the circumstances. No assurance can be given that these assumptions and expectations will prove to be correct. Those assumptions and expectations are based on information currently available to Superior, including information obtained from third party industry analysts and other third-party sources, and the historic performance of Superior’s businesses. Such assumptions include the acquisition of Kamps Propane Inc., High Country Propane, Inc., Pick Up Propane, Inc., Kiva Energy, Inc., Competitive Capital, Inc. and Propane Construction and Meter Services (“collectively, Kamps”) closing in the third quarter of 2021 in accordance with the terms of the agreement, anticipated financial performance, current business and economic trends, the amount of future dividends paid by Superior, business prospects, utilization of tax basis, regulatory developments, currency, exchange and interest rates, future commodity prices relating to the oil and gas industry, future oil rig activity levels, trading data, cost estimates, our ability to obtain financing on acceptable terms, expected life of facilities and statements regarding net working capital and capital expenditure requirements of Superior or Superior LP, the assumptions set forth under the “Financial Outlook” sections in this MD&A. The forward-looking information is also subject to the risks and uncertainties set forth below. By its very nature, forward-looking information involves numerous assumptions, risks and uncertainties, both general and specific. Should one or more of these risks and uncertainties materialize or should underlying assumptions prove incorrect, as many important factors are beyond our control, Superior’s or Superior LP’s actual performance and financial results may vary materially from those estimates and intentions contemplated, expressed or implied in the forward-looking information. These risks and uncertainties include risks relating to satisfaction of the conditions to, and completion of, the Kamps acquisition, incorrect assessments of value when making acquisitions, increases in debt service charges, the loss of key personnel, the anticipated impact of the COVID-19 pandemic and the economic recession, fluctuations in foreign currency and exchange rates, inadequate insurance coverage, liability for cash taxes, counterparty risk, compliance with environmental laws and regulations, reduced customer demand, operational risks involving our facilities, force majeure, labour relations matters, our ability to access external sources of debt and equity capital, and the risks identified in (i) this MD&A under “Risk Factors to Superior” and (ii) Superior’s most recent Annual Information Form. The preceding list of assumptions, risks and uncertainties is not exhaustive. When relying on Superior’s forward-looking information to make decisions with respect to Superior, investors and others should carefully consider the preceding factors, other uncertainties and potential events. Any forward-looking information is provided as of the date of this document and, except as required by law, neither Superior nor Superior LP undertakes to update or revise such information to reflect new information, subsequent or otherwise. For the reasons set forth above, investors should not place undue reliance on forward-looking information.

Superior Plus Corp. 11 2021 Second Quarter Results
Basis of Presentation and Divestiture
On April 9, 2021 (the “closing date”) Superior completed the previously announced sale of its Specialty Chemicals business for total consideration of $725.0 million (the “Transaction”). Superior received $600.0 million in cash proceeds less an initial working capital adjustment of $17.0 million and $125 million in the form of a 6% unsecured note (“Vendor Note”). The principal amount of the Vendor Note and accrued and unpaid interest are due October 9, 2026. The Transaction purchase price is subject to adjustment based on the average EBITDA of the business, excluding the impact of IFRS 16 (the “average EBITDA”), for the three consecutive twelve-month periods following the closing date. The Transaction purchase price may be adjusted through the issuance of an additional note from either Superior or the Specialty Chemicals business. If the average EBITDA is higher than $115 million, the buyer will issue an additional note to Superior. The amount of the additional note will be the difference between the average EBITDA and $115 million, multiplied by 4.5, up to a maximum of $100 million, including accumulated interest. The additional note will bear interest at the same rate as the Vendor Note and interest will accrue from the closing date. If the average EBITDA is lower than $100 million, an additional note will be issued by Superior to the Specialty Chemicals business. The amount of the additional note will be the difference between the average EBITDA and $100 million, multiplied by 4.5 up to a maximum of $100 million, including accumulated interest. The additional note will bear interest at the same rate as the Vendor Note and interest will accrue from the closing date. Superior now presents the results of operations from this business as discontinued operations, (see Note 4 in the unaudited condensed interim consolidated financial statements). The Specialty Chemicals segment operated as a distinct segment, and has no impact on the operations of the Energy Distribution segments. This MD&A reflects the results of continuing operations, unless otherwise noted. FINANCIAL OVERVIEW Summary of AOCF Three Months Ended Six Months Ended
June 30 June 30
(millions of dollars except per share amounts) 2021 2020(1) 2021 2020(1)
Revenue 365.6 305.6 1,205.1 988.2 Gross profit 149.1 169.3 498.2 515.5
EBITDA from operations (2) 37.0 48.3 253.4 238.3
Corporate administrative costs (2) (8.2) (7.0) (18.5) (7.6) Realized gains (losses) on foreign currency hedging contracts 2.8 (2.2) 8.3 (6.2)
Adjusted EBITDA (2) 31.6 39.1 243.2 224.5
Interest expense (2) (19.9) (22.8) (41.9) (48.3) Cash income tax expense (2.7) (1.8) (7.0) (5.3)
AOCF before transaction and other costs (2) 9.0 14.5 194.3 170.9
Transaction and other costs (3) (4.3) (5.0) (13.7) (10.6)
AOCF(2) 4.7 9.5 180.6 160.3
AOCF per share before transaction and other costs (2)(3)(4) $0.04 $0.08 $0.94 $0.97
AOCF per share (2)(3)(4) $0.02 $0.05 $0.88 $0.91 Dividends declared per common share $0.18 $0.18 $0.36 $0.36 (1) Comparative figures have been reclassified to exclude the results of the divested Specialty Chemicals segment. See the unaudited condensed
interim consolidated financial statements and notes thereto as at and for the three and six months ended, June 30, 2021 and 2020.
Superior Plus Corp. 12 2021 Second Quarter Results
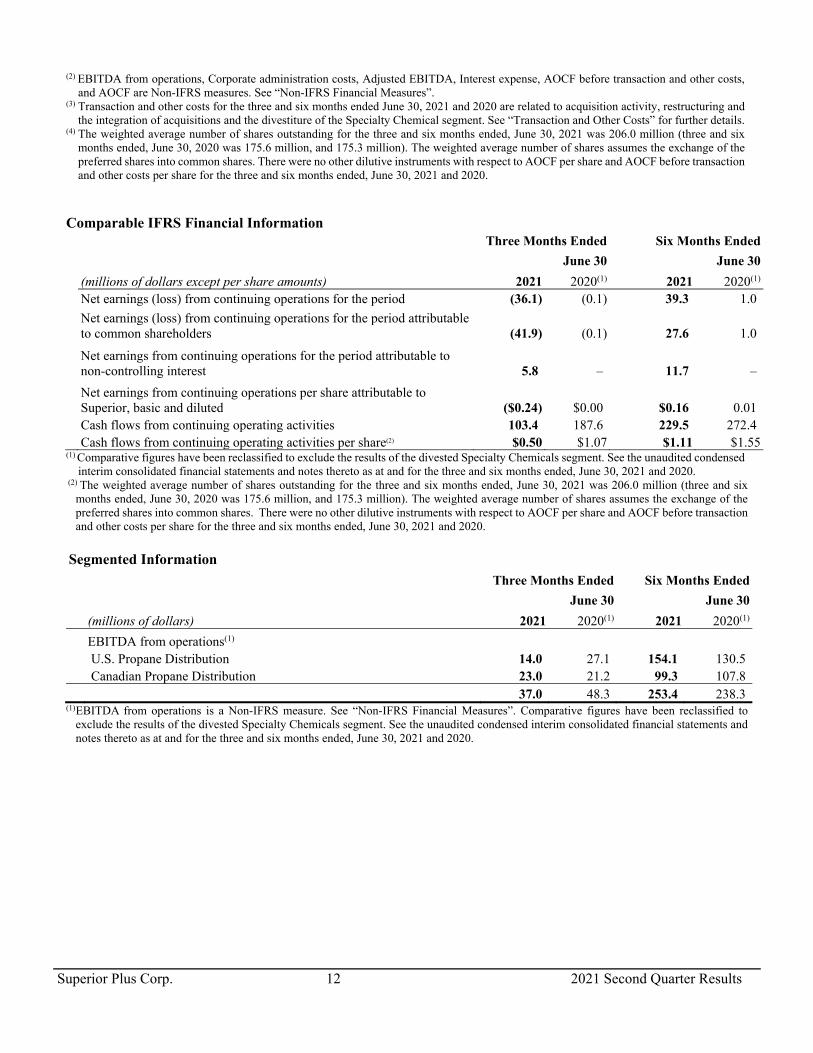
(2) EBITDA from operations, Corporate administration costs, Adjusted EBITDA, Interest expense, AOCF before transaction and other costs, and AOCF are Non-IFRS measures. See “Non-IFRS Financial Measures”.
(3) Transaction and other costs for the three and six months ended June 30, 2021 and 2020 are related to acquisition activity, restructuring and the integration of acquisitions and the divestiture of the Specialty Chemical segment. See “Transaction and Other Costs” for further details.
(4) The weighted average number of shares outstanding for the three and six months ended, June 30, 2021 was 206.0 million (three and six months ended, June 30, 2020 was 175.6 million, and 175.3 million). The weighted average number of shares assumes the exchange of the preferred shares into common shares. There were no other dilutive instruments with respect to AOCF per share and AOCF before transaction and other costs per share for the three and six months ended, June 30, 2021 and 2020.
Comparable IFRS Financial Information Three Months Ended Six Months Ended
June 30 June 30
(millions of dollars except per share amounts) 2021 2020(1) 2021 2020(1) Net earnings (loss) from continuing operations for the period (36.1) (0.1) 39.3 1.0
Net earnings (loss) from continuing operations for the period attributable to common shareholders (41.9) (0.1) 27.6 1.0
Net earnings from continuing operations for the period attributable to non-controlling interest 5.8 – 11.7 –
Net earnings from continuing operations per share attributable to Superior, basic and diluted ($0.24) $0.00 $0.16 0.01
Cash flows from continuing operating activities 103.4 187.6 229.5 272.4 Cash flows from continuing operating activities per share(2) $0.50 $1.07 $1.11 $1.55 (1) Comparative figures have been reclassified to exclude the results of the divested Specialty Chemicals segment. See the unaudited condensed
interim consolidated financial statements and notes thereto as at and for the three and six months ended, June 30, 2021 and 2020. (2) The weighted average number of shares outstanding for the three and six months ended, June 30, 2021 was 206.0 million (three and six
months ended, June 30, 2020 was 175.6 million, and 175.3 million). The weighted average number of shares assumes the exchange of the preferred shares into common shares. There were no other dilutive instruments with respect to AOCF per share and AOCF before transaction and other costs per share for the three and six months ended, June 30, 2021 and 2020.
Segmented Information Three Months Ended Six Months Ended
June 30 June 30
(millions of dollars) 2021 2020(1) 2021 2020(1)
EBITDA from operations(1) U.S. Propane Distribution 14.0 27.1 154.1 130.5 Canadian Propane Distribution 23.0 21.2 99.3 107.8 37.0 48.3 253.4 238.3 (1) EBITDA from operations is a Non-IFRS measure. See “Non-IFRS Financial Measures”. Comparative figures have been reclassified to
exclude the results of the divested Specialty Chemicals segment. See the unaudited condensed interim consolidated financial statements and notes thereto as at and for the three and six months ended, June 30, 2021 and 2020.
Superior Plus Corp. 13 2021 Second Quarter Results
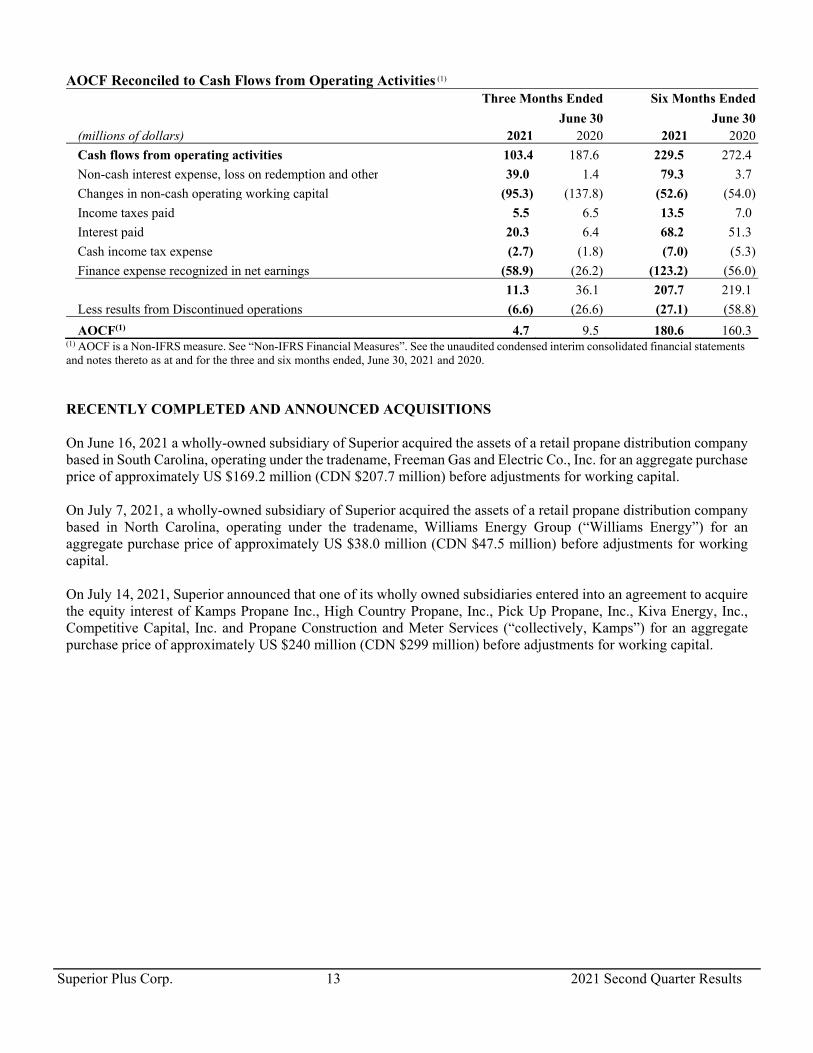
AOCF Reconciled to Cash Flows from Operating Activities (1)
Three Months Ended Six Months Ended
June 30 June 30 (millions of dollars) 2021 2020 2021 2020
Cash flows from operating activities 103.4 187.6 229.5 272.4
Non-cash interest expense, loss on redemption and other 39.0 1.4 79.3 3.7
Changes in non-cash operating working capital (95.3) (137.8) (52.6) (54.0)
Income taxes paid 5.5 6.5 13.5 7.0
Interest paid 20.3 6.4 68.2 51.3
Cash income tax expense (2.7) (1.8) (7.0) (5.3)
Finance expense recognized in net earnings (58.9) (26.2) (123.2) (56.0)
11.3 36.1 207.7 219.1
Less results from Discontinued operations (6.6) (26.6) (27.1) (58.8)
AOCF(1) 4.7 9.5 180.6 160.3 (1) AOCF is a Non-IFRS measure. See “Non-IFRS Financial Measures”. See the unaudited condensed interim consolidated financial statements and notes thereto as at and for the three and six months ended, June 30, 2021 and 2020.
RECENTLY COMPLETED AND ANNOUNCED ACQUISITIONS On June 16, 2021 a wholly-owned subsidiary of Superior acquired the assets of a retail propane distribution company based in South Carolina, operating under the tradename, Freeman Gas and Electric Co., Inc. for an aggregate purchase price of approximately US $169.2 million (CDN $207.7 million) before adjustments for working capital. On July 7, 2021, a wholly-owned subsidiary of Superior acquired the assets of a retail propane distribution company based in North Carolina, operating under the tradename, Williams Energy Group (“Williams Energy”) for an aggregate purchase price of approximately US $38.0 million (CDN $47.5 million) before adjustments for working capital. On July 14, 2021, Superior announced that one of its wholly owned subsidiaries entered into an agreement to acquire the equity interest of Kamps Propane Inc., High Country Propane, Inc., Pick Up Propane, Inc., Kiva Energy, Inc., Competitive Capital, Inc. and Propane Construction and Meter Services (“collectively, Kamps”) for an aggregate purchase price of approximately US $240 million (CDN $299 million) before adjustments for working capital.

Superior Plus Corp. 14 2021 Second Quarter Results
Consolidated Statement of Net Earnings Three Months Ended Six Months Ended
June 30 June 30
(millions of dollars except per share amounts) 2021 2020 (1) 2021 2020 (1) Revenue 365.6 305.6 1,205.1 988.2 Cost of sales (includes products and services) (216.5) (136.3) (706.9) (472.7) Gross profit 149.1 169.3 498.2 515.5 Expenses Selling, distribution and administrative costs ("SD&A") (178.2) (174.6) (399.2) (369.1) Finance expense (58.9) (24.2) (121.2) (52.0) Gains (losses) on derivatives and foreign currency translation of borrowings 39.1 64.7 75.1 (47.0) (198.0) (134.1) (445.3) (468.1) Earnings before income taxes (48.9) 35.2 52.9 47.4 Income tax(expense) 12.8 (35.3) (13.6) (46.4) Net earnings (loss) from continuing operations (36.1) (0.1) 39.3 1.0
Net earnings (loss) from continuing operations attributable to: Superior (41.9) (0.1) 27.6 1.0 Non-controlling interest 5.8 – 11.7 –
Net earnings (loss) from continuing operations per share attributable to Superior, fully diluted ($0.24) $0.00 $0.16 $0.01
(1) Comparative figures have been reclassified to exclude the results of the divested Specialty Chemicals segment. See the unaudited condensed interim consolidated financial statements as at and for the three and six months ended, June 30, 2021 and 2020.
Q2 2021 Summary of Results Compared to the Prior Year Quarter Adjusted EBITDA for the three months ended June 30, 2021 was $31.6 million, a decrease of $7.5 million or 19% compared to the prior year quarter Adjusted EBITDA of $39.1 million. The decrease is primarily due to lower EBITDA from operations and to a lesser extent higher corporate costs partially offset by a realized gain on foreign currency hedging contracts compared to a realized loss in the prior year quarter. EBITDA from operations decreased $11.3 million or 23% compared to the prior year quarter primarily due to lower U.S. Propane Distribution (U.S. Propane) EBITDA from operations partially offset by modestly higher Canadian Propane Distribution (Canadian Propane) EBITDA from operations. U.S. Propane EBITDA from operations was $14.0 million, a decrease of $13.1 million or 48% compared to the prior year quarter due primarily to warmer weather and lower unit margins as a result of short-term margin opportunities that existed in the prior year quarter with low commodity prices and to a lesser extent the impact of the stronger Canadian dollar on the translation of U.S. denominated EBITDA. This was partially offset by the impact of completed acquisitions, and to a lesser extent reduced COVID-19 restrictions increasing commercial demand. Canadian Propane EBITDA from operations was $23.0 million, an increase of $1.8 million or 8% compared to the prior year quarter primarily due to the impact of the Canadian Emergency Wage Subsidy (“CEWS”) recorded in the current period, and to a lesser extent higher sales volumes, partially offset by weaker wholesale propane market fundamentals compared to the prior year quarter and lower average unit margins. In the second quarter, Superior realized a gain on foreign currency hedging contracts of $2.8 million compared to a loss of $2.2 million in the prior year quarter due to changes in foreign exchange rates relative to amounts hedged. Corporate administrative costs were $8.2 million, an increase of $1.2 million from the prior year quarter of $7.0 million primarily due to higher long-term incentive plan costs related to the appreciation of the share price in the current quarter.
Superior Plus Corp. 15 2021 Second Quarter Results
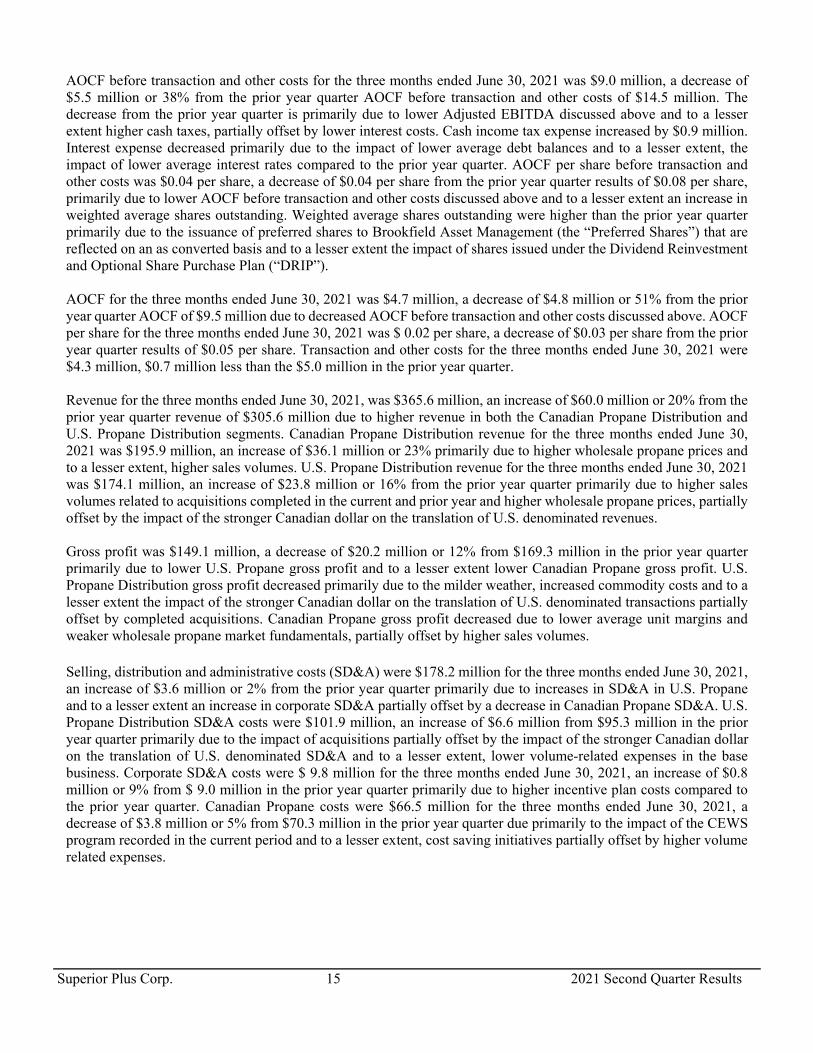
AOCF before transaction and other costs for the three months ended June 30, 2021 was $9.0 million, a decrease of $5.5 million or 38% from the prior year quarter AOCF before transaction and other costs of $14.5 million. The decrease from the prior year quarter is primarily due to lower Adjusted EBITDA discussed above and to a lesser extent higher cash taxes, partially offset by lower interest costs. Cash income tax expense increased by $0.9 million. Interest expense decreased primarily due to the impact of lower average debt balances and to a lesser extent, the impact of lower average interest rates compared to the prior year quarter. AOCF per share before transaction and other costs was $0.04 per share, a decrease of $0.04 per share from the prior year quarter results of $0.08 per share, primarily due to lower AOCF before transaction and other costs discussed above and to a lesser extent an increase in weighted average shares outstanding. Weighted average shares outstanding were higher than the prior year quarter primarily due to the issuance of preferred shares to Brookfield Asset Management (the “Preferred Shares”) that are reflected on an as converted basis and to a lesser extent the impact of shares issued under the Dividend Reinvestment and Optional Share Purchase Plan (“DRIP”). AOCF for the three months ended June 30, 2021 was $4.7 million, a decrease of $4.8 million or 51% from the prior year quarter AOCF of $9.5 million due to decreased AOCF before transaction and other costs discussed above. AOCF per share for the three months ended June 30, 2021 was $ 0.02 per share, a decrease of $0.03 per share from the prior year quarter results of $0.05 per share. Transaction and other costs for the three months ended June 30, 2021 were $4.3 million, $0.7 million less than the $5.0 million in the prior year quarter. Revenue for the three months ended June 30, 2021, was $365.6 million, an increase of $60.0 million or 20% from the prior year quarter revenue of $305.6 million due to higher revenue in both the Canadian Propane Distribution and U.S. Propane Distribution segments. Canadian Propane Distribution revenue for the three months ended June 30, 2021 was $195.9 million, an increase of $36.1 million or 23% primarily due to higher wholesale propane prices and to a lesser extent, higher sales volumes. U.S. Propane Distribution revenue for the three months ended June 30, 2021 was $174.1 million, an increase of $23.8 million or 16% from the prior year quarter primarily due to higher sales volumes related to acquisitions completed in the current and prior year and higher wholesale propane prices, partially offset by the impact of the stronger Canadian dollar on the translation of U.S. denominated revenues. Gross profit was $149.1 million, a decrease of $20.2 million or 12% from $169.3 million in the prior year quarter primarily due to lower U.S. Propane gross profit and to a lesser extent lower Canadian Propane gross profit. U.S. Propane Distribution gross profit decreased primarily due to the milder weather, increased commodity costs and to a lesser extent the impact of the stronger Canadian dollar on the translation of U.S. denominated transactions partially offset by completed acquisitions. Canadian Propane gross profit decreased due to lower average unit margins and weaker wholesale propane market fundamentals, partially offset by higher sales volumes. Selling, distribution and administrative costs (SD&A) were $178.2 million for the three months ended June 30, 2021, an increase of $3.6 million or 2% from the prior year quarter primarily due to increases in SD&A in U.S. Propane and to a lesser extent an increase in corporate SD&A partially offset by a decrease in Canadian Propane SD&A. U.S. Propane Distribution SD&A costs were $101.9 million, an increase of $6.6 million from $95.3 million in the prior year quarter primarily due to the impact of acquisitions partially offset by the impact of the stronger Canadian dollar on the translation of U.S. denominated SD&A and to a lesser extent, lower volume-related expenses in the base business. Corporate SD&A costs were $ 9.8 million for the three months ended June 30, 2021, an increase of $0.8 million or 9% from $ 9.0 million in the prior year quarter primarily due to higher incentive plan costs compared to the prior year quarter. Canadian Propane costs were $66.5 million for the three months ended June 30, 2021, a decrease of $3.8 million or 5% from $70.3 million in the prior year quarter due primarily to the impact of the CEWS program recorded in the current period and to a lesser extent, cost saving initiatives partially offset by higher volume related expenses.
Superior Plus Corp. 16 2021 Second Quarter Results
Finance expense for the three months ended June 30, 2021 was $58.9 million, an increase of $34.7 million or 143% from $24.2 million in the prior year quarter. The increase is primarily due to $25.9 million early call premium related to the redemption of the $400 million 5.25% senior unsecured notes due in 2024 (the “5.25% notes”) and $370 million 5.125% senior unsecured notes due in 2025 (the “5.125% notes”) partially offset by the impact of lower average debt balances and lower average interest rates. Debt balances were lower as the net proceeds from the divestiture of the Specialty Chemicals business in the quarter were used to reduce debt, and to fund acquisitions. Gains (losses) on derivative and foreign currency translation of borrowings consists of unrealized gains (losses) on derivative financial instruments and foreign currency translation of borrowings, net of realized gains (losses) on derivative financial instruments. Superior recognized a gain on derivatives and foreign currency translation of borrowings of $39.1 million for the three months ended June 30, 2021 compared to a gain of $64.7 million in the prior year quarter. This is mainly related to changes in market prices of commodities, timing of maturities of underlying financial instruments and foreign exchange rates relative to amounts hedged and U.S. denominated debt. For additional details, refer to Note 13 of the 2021 unaudited condensed interim consolidated financial statements. Total income tax recovery for the three months ended June 30, 2021 was $12.8 million, a change of $48.1 million from a $35.3 million income tax expense in the prior year quarter. Current income tax expense was $2.7 million, an increase of $0.9 million from the prior year quarter expense of $1.8 million. Deferred income tax recovery was $15.5 million, a decrease of $49.0 million from a $33.5 million income tax expense in the prior year quarter due to the impact of the Specialty Chemical divestiture. The net loss from continuing operations for the three months ended June 30, 2021 was $36.1 million, a $36.0 million increase from the net loss of $0.1 million in the prior year quarter. The decrease from the prior year quarter is primarily due to higher finance expense related primarily to the premiums on early redemption of senior unsecured notes, a decrease in unrealized gains on derivatives and foreign currency translation of borrowings recorded in the current quarter compared to the prior year quarter and lower gross profit, partially offset by the impact of CEWS recorded in the current quarter. Basic and diluted loss per share was $0.24, compared to a loss per share of $0.00 in the prior year quarter. Net earnings from discontinued operations of $166.1 million increased $158.5 million from $7.6 million in the prior year quarter. The increase is primarily due to the recognition of the realized gain on the disposal of the Specialty Chemical segment partially offset by a partial month of earnings compared to a full quarter in the prior year. Year-to-date Comparison to the Prior Year-to-date Adjusted EBITDA for the six months ended June 30, 2021 was $243.2 million, an increase of $18.7 million or 8% compared to the prior comparable period Adjusted EBITDA of $224.5 million. The increase is primarily due to higher EBITDA from operations and a realized gain on foreign currency hedging contracts compared to a loss in the prior comparable period partially offset by higher corporate costs. EBITDA from operations increased $15.1 million or 6% compared to the prior year primarily due to higher U.S. Propane EBITDA from operations, partially offset by lower Canadian Propane EBITDA from operations. U.S. Propane EBITDA from operations was $154.1 million, an increase of $23.6 million or 18% primarily due to the impact of completed acquisitions and colder weather in the first quarter, and additional synergies. Canadian Propane EBITDA from operations was $99.3 million, a decrease of $8.5 million or 8% primarily due to the weaker market fundamentals within the supply portfolio management business partially offset by the impact of the CEWS program. Superior realized a gain on foreign currency hedging contracts of $8.3 million compared to a loss of $6.2 million in the prior year due to the weaker Canadian dollar than the average hedge rate. Corporate administrative costs were $18.5 million compared to $7.6 million in the prior comparable period. The increase is primarily due to higher incentive plan costs than in the prior year due to appreciation in the share price.
Superior Plus Corp. 17 2021 Second Quarter Results
AOCF before transaction and other costs for the six months ended June 30, 2021 was $194.3 million, an increase of $23.4 million or 14% from the prior comparable period AOCF before transaction and other costs of $170.9 million. The increase from the prior year is primarily due to higher Adjusted EBITDA discussed above and lower interest expense, partially offset by higher cash taxes. Interest expense decreased by $6.4 million or 13% primarily to due to lower average debt balances and lower average interest rates. Cash income tax expense increased by $1.7 million as a result of utilizing expiring Canadian federal tax credits. AOCF per share before transaction and other costs was $0.94 per share, a decrease of $0.03 per share or 3% from the prior year to date results of $0.97 per share primarily due to the increase in the weighted average shares outstanding, offset by the higher AOCF before transaction costs discussed above. AOCF for the six months ended June 30, 2021 was $180.6 million, an increase of $20.3 million or 13% from the prior year AOCF of $160.3 million due to the increased AOCF before transaction and other costs discussed above. AOCF per share for six months ended June 30, 2021 was $0.88 per share, a decrease of $0.03 per share or 3% from the prior year quarter results of $0.91 per share. Transaction and other costs for the six months ended June 30, 2021 were $13.7 million, $3.1 million higher than the prior year. Costs incurred in the current year related primarily to the integration of acquisitions and the Specialty Chemicals divestiture. Revenue for the six months ended June 30, 2021 was $1,205.1 million, an increase of $216.9 million or 22% from the prior year quarter due to higher revenue in the U.S. Propane Distribution and Canadian Propane Distribution segments. U.S. Propane Distribution revenue for the six months ended June 30, 2021 was $628.5 million, an increase of $136.2 million or 28% primarily due to the impact of increases to wholesale propane prices and the additional revenues from acquisitions partially offset by the impact of the stronger Canadian dollar on U.S. denominated sales. Canadian Propane Distribution revenue for the six months ended June 30, 2021 was $591.6 million, an increase of $85.9 million or 17% primarily due to higher wholesale propane prices and the impact of higher sales volumes. Consolidated gross profit was $498.2 million, a decrease of $17.3 million or 3% from $515.5 million primarily due to lower Canadian Propane gross profit and partially offset by higher U.S. Propane gross profit. Canadian Propane gross profit decreased due to weaker market fundamentals within the supply portfolio management business and due to the impact of greater increases to wholesale propane prices compared to sales prices as a result of competitive pressures. U.S. Propane Distribution gross profit increased primarily due to the impact of completed acquisitions in the current and prior years and 7% colder weather in Q1 partially offset by the impact of the stronger Canadian dollar on the translation of U.S. denominated transactions. SD&A was $399.2 million for the six months ended June 30, 2021, an increase of $30.1 million or 8% from the prior comparable period, primarily due to an increase in U.S. Propane and Corporate SD&A partially offset by a decrease in Canadian Propane SD&A. U.S. Propane Distribution SD&A costs were $229.1 million, an increase of $24.0 million or 12% from $205.1 million in the prior year primarily due to the impact of completed acquisitions and higher volume related expenses partially offset by the impact of the weaker Canadian dollar on the translation of U.S. denominated SD&A and to a lesser extent workforce optimization and the realization of incremental synergies, lower transaction and restructuring costs. Corporate SD&A costs were $23.3 million, an increase of $11.7 million or 101% from $11.6 million in the prior year primarily due to higher incentive plan costs related to share price appreciation and higher transaction costs. Canadian Propane Distribution SD&A costs of $146.8 million a decrease of $5.6 million or 4% from $152.4 million in the prior comparable period primarily due to the impact of the CEWS program recorded in the current period, and cost savings initiatives. Finance expense for the six months ended June 30, 2021 was $121.2 million, an increase of $69.2 million or 133% from $52.0 million in the prior year comparable period. The increase is primarily due to $58.6 million in early call premiums related to the redemption of the US$350 million, $400 million and $370 million senior unsecured notes and to a lesser extent the impact of the stronger Canadian dollar on the translation of U.S. denominated finance expense partially offset by lower average debt balances and lower average interest rates. Debt balances are lower primarily as the net proceeds from the divestiture of Specialty Chemicals in the quarter and the proceeds from the US$260 million Preferred Share issuance in the prior year were used to reduce debt and fund acquisitions.
Superior Plus Corp. 18 2021 Second Quarter Results
Gains (losses) on derivative and foreign currency translation of borrowings consists of unrealized gains (losses) on derivative financial instruments and foreign currency translation of borrowings, net of realized gains (losses) on derivative financial instruments. Superior incurred a gain on derivatives and foreign currency translation of borrowings of $75.1 million for the six months ended June 30, 2021 compared to a loss of $47.0 million in the prior year comparable period. This is mainly related to changes in market prices of commodities, timing of maturities of underlying financial instruments and foreign exchange rates relative to amounts hedged. For additional details, refer to Note 13 of the 2021 unaudited condensed interim consolidated financial statements. Total income tax expense of $13.6 million was $32.8 million lower than the prior year expense of $46.4 million. Current income tax expense was 7.0 million, an increase of $1.7 million from the comparable prior year’s expense of $5.3 million. Deferred income tax expense was $6.6 million, a decrease of $34.5 million from the prior comparable period expense of $41.1 million primarily due to the impact of U.S. tax regulations enacted during the year. The net earnings from continuing operations for the six months ended June 30, 2021 was $39.3 million, compared to $1.0 million in the prior comparable period. The increase from the prior comparable period is primarily due to gains on derivatives and foreign currency translation of borrowings compared to a loss in the prior comparable period and to a lesser extent lower tax expense partially offset by lower gross profit, higher finance expense and higher SD&A. Basic and diluted loss per share was $0.16, compared to basic and diluted earnings per share of $0.01 in the prior comparable period. Net earnings from discontinued operations for the six months ended June 30, 2021 was $174.8 million an increase of $156.9 million from $17.9 million in the prior comparable period. The increase is primarily due to a gain on disposal of the Specialty Chemical segment partially offset by lower net earnings as a result of two months less operations.
Superior Plus Corp. 19 2021 Second Quarter Results
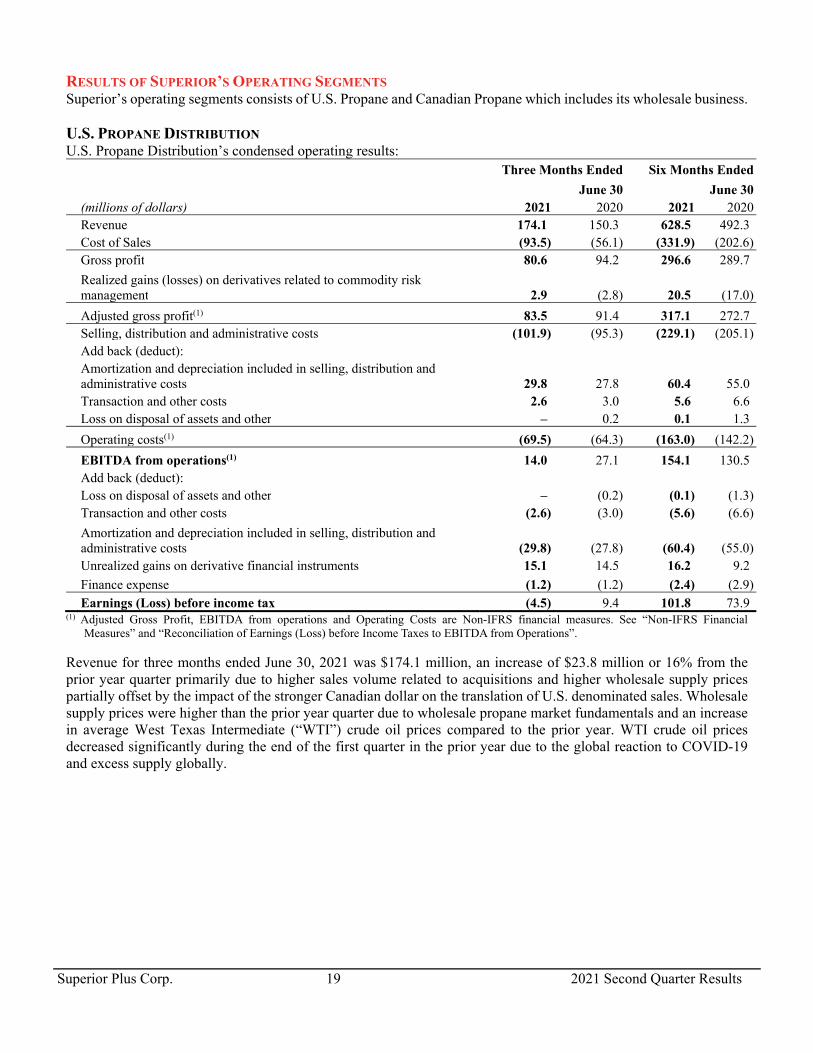
RESULTS OF SUPERIOR’S OPERATING SEGMENTS Superior’s operating segments consists of U.S. Propane and Canadian Propane which includes its wholesale business. U.S. PROPANE DISTRIBUTION U.S. Propane Distribution’s condensed operating results: Three Months Ended Six Months Ended
June 30 June 30 (millions of dollars) 2021 2020 2021 2020 Revenue 174.1 150.3 628.5 492.3 Cost of Sales (93.5) (56.1) (331.9) (202.6) Gross profit 80.6 94.2 296.6 289.7
Realized gains (losses) on derivatives related to commodity risk management 2.9 (2.8) 20.5 (17.0)
Adjusted gross profit(1) 83.5 91.4 317.1 272.7 Selling, distribution and administrative costs (101.9) (95.3) (229.1) (205.1) Add back (deduct):
Amortization and depreciation included in selling, distribution and administrative costs 29.8 27.8 60.4 55.0
Transaction and other costs 2.6 3.0 5.6 6.6 Loss on disposal of assets and other – 0.2 0.1 1.3
Operating costs(1) (69.5) (64.3) (163.0) (142.2)
EBITDA from operations(1) 14.0 27.1 154.1 130.5 Add back (deduct): Loss on disposal of assets and other – (0.2) (0.1) (1.3) Transaction and other costs (2.6) (3.0) (5.6) (6.6)
Amortization and depreciation included in selling, distribution and administrative costs (29.8) (27.8) (60.4) (55.0)
Unrealized gains on derivative financial instruments 15.1 14.5 16.2 9.2
Finance expense (1.2) (1.2) (2.4) (2.9) Earnings (Loss) before income tax (4.5) 9.4 101.8 73.9 (1) Adjusted Gross Profit, EBITDA from operations and Operating Costs are Non-IFRS financial measures. See “Non-IFRS Financial
Measures” and “Reconciliation of Earnings (Loss) before Income Taxes to EBITDA from Operations”. Revenue for three months ended June 30, 2021 was $174.1 million, an increase of $23.8 million or 16% from the prior year quarter primarily due to higher sales volume related to acquisitions and higher wholesale supply prices partially offset by the impact of the stronger Canadian dollar on the translation of U.S. denominated sales. Wholesale supply prices were higher than the prior year quarter due to wholesale propane market fundamentals and an increase in average West Texas Intermediate (“WTI”) crude oil prices compared to the prior year. WTI crude oil prices decreased significantly during the end of the first quarter in the prior year due to the global reaction to COVID-19 and excess supply globally.
Superior Plus Corp. 20 2021 Second Quarter Results
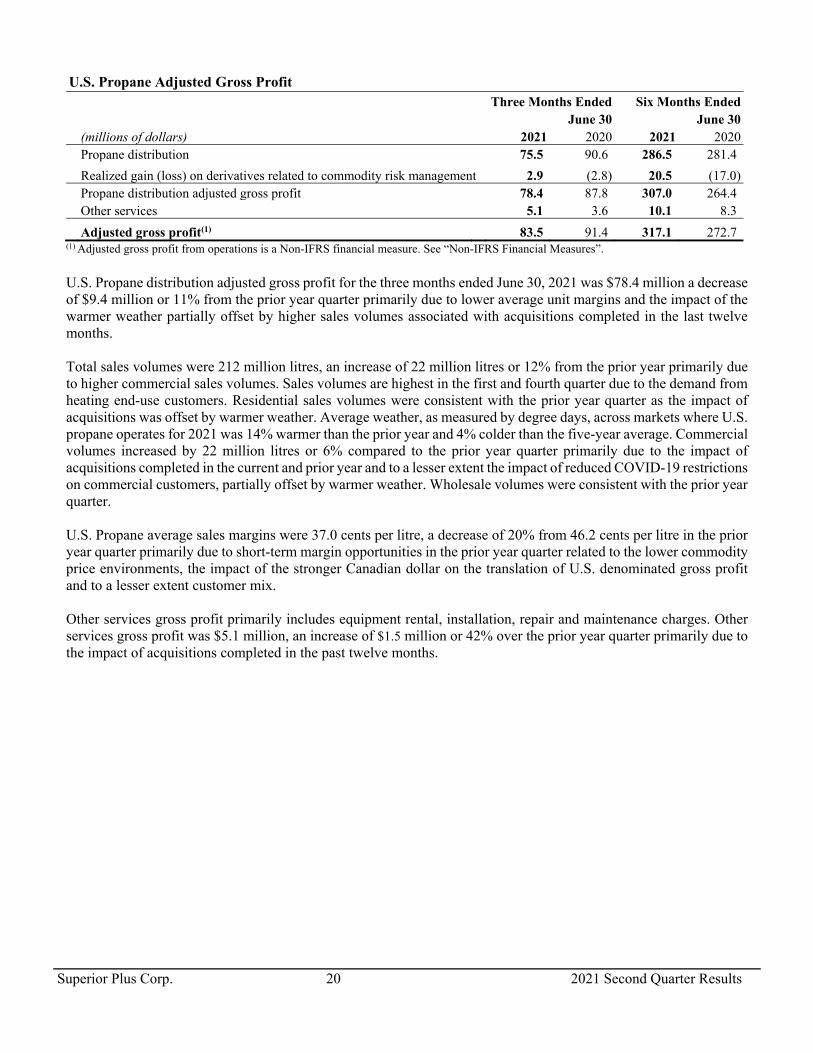
U.S. Propane Adjusted Gross Profit Three Months Ended Six Months Ended June 30 June 30 (millions of dollars) 2021 2020 2021 2020 Propane distribution 75.5 90.6 286.5 281.4
Realized gain (loss) on derivatives related to commodity risk management 2.9 (2.8) 20.5 (17.0) Propane distribution adjusted gross profit 78.4 87.8 307.0 264.4 Other services 5.1 3.6 10.1 8.3
Adjusted gross profit(1) 83.5 91.4 317.1 272.7 (1) Adjusted gross profit from operations is a Non-IFRS financial measure. See “Non-IFRS Financial Measures”.
U.S. Propane distribution adjusted gross profit for the three months ended June 30, 2021 was $78.4 million a decrease of $9.4 million or 11% from the prior year quarter primarily due to lower average unit margins and the impact of the warmer weather partially offset by higher sales volumes associated with acquisitions completed in the last twelve months. Total sales volumes were 212 million litres, an increase of 22 million litres or 12% from the prior year primarily due to higher commercial sales volumes. Sales volumes are highest in the first and fourth quarter due to the demand from heating end-use customers. Residential sales volumes were consistent with the prior year quarter as the impact of acquisitions was offset by warmer weather. Average weather, as measured by degree days, across markets where U.S. propane operates for 2021 was 14% warmer than the prior year and 4% colder than the five-year average. Commercial volumes increased by 22 million litres or 6% compared to the prior year quarter primarily due to the impact of acquisitions completed in the current and prior year and to a lesser extent the impact of reduced COVID-19 restrictions on commercial customers, partially offset by warmer weather. Wholesale volumes were consistent with the prior year quarter. U.S. Propane average sales margins were 37.0 cents per litre, a decrease of 20% from 46.2 cents per litre in the prior year quarter primarily due to short-term margin opportunities in the prior year quarter related to the lower commodity price environments, the impact of the stronger Canadian dollar on the translation of U.S. denominated gross profit and to a lesser extent customer mix. Other services gross profit primarily includes equipment rental, installation, repair and maintenance charges. Other services gross profit was $5.1 million, an increase of $1.5 million or 42% over the prior year quarter primarily due to the impact of acquisitions completed in the past twelve months.
Superior Plus Corp. 21 2021 Second Quarter Results
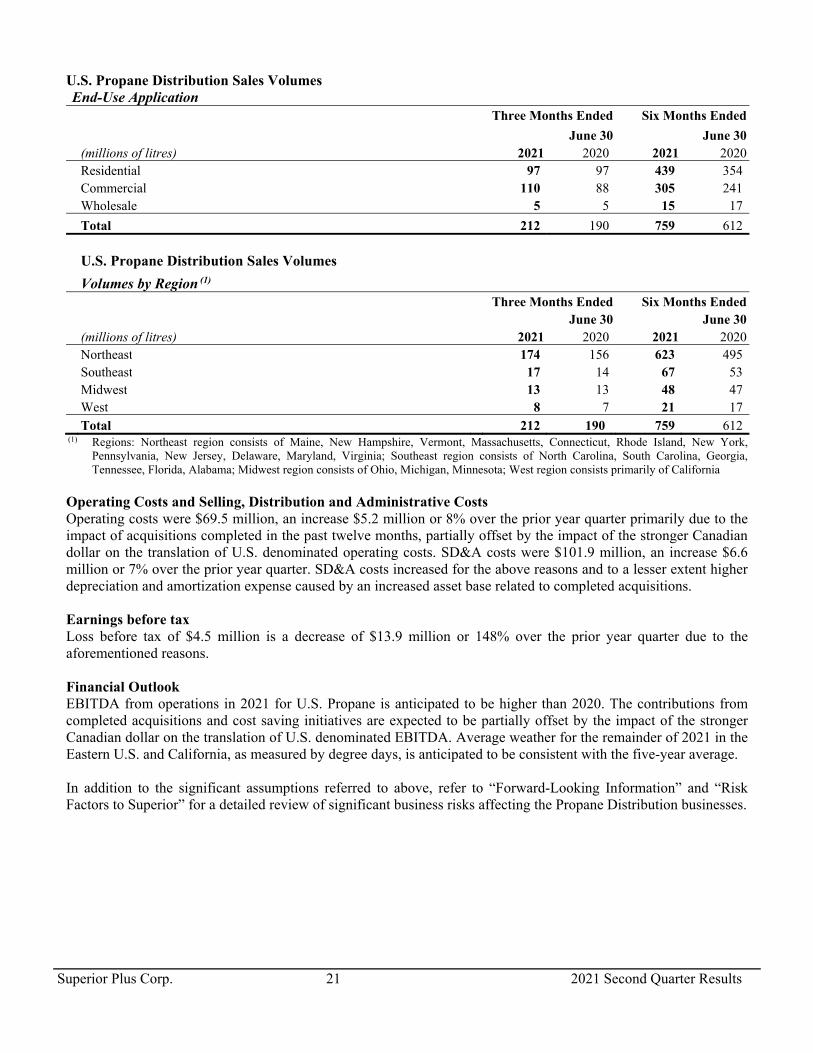
U.S. Propane Distribution Sales Volumes End-Use Application
Three Months Ended Six Months Ended
June 30 June 30 (millions of litres) 2021 2020 2021 2020 Residential 97 97 439 354 Commercial 110 88 305 241 Wholesale 5 5 15 17
Total 212 190 759 612 U.S. Propane Distribution Sales Volumes
Volumes by Region (1) Three Months Ended Six Months Ended June 30 June 30 (millions of litres) 2021 2020 2021 2020 Northeast 174 156 623 495 Southeast 17 14 67 53 Midwest 13 13 48 47 West 8 7 21 17 Total 212 190 759 612 (1) Regions: Northeast region consists of Maine, New Hampshire, Vermont, Massachusetts, Connecticut, Rhode Island, New York,
Pennsylvania, New Jersey, Delaware, Maryland, Virginia; Southeast region consists of North Carolina, South Carolina, Georgia, Tennessee, Florida, Alabama; Midwest region consists of Ohio, Michigan, Minnesota; West region consists primarily of California
Operating Costs and Selling, Distribution and Administrative Costs Operating costs were $69.5 million, an increase $5.2 million or 8% over the prior year quarter primarily due to the impact of acquisitions completed in the past twelve months, partially offset by the impact of the stronger Canadian dollar on the translation of U.S. denominated operating costs. SD&A costs were $101.9 million, an increase $6.6 million or 7% over the prior year quarter. SD&A costs increased for the above reasons and to a lesser extent higher depreciation and amortization expense caused by an increased asset base related to completed acquisitions. Earnings before tax Loss before tax of $4.5 million is a decrease of $13.9 million or 148% over the prior year quarter due to the aforementioned reasons. Financial Outlook EBITDA from operations in 2021 for U.S. Propane is anticipated to be higher than 2020. The contributions from completed acquisitions and cost saving initiatives are expected to be partially offset by the impact of the stronger Canadian dollar on the translation of U.S. denominated EBITDA. Average weather for the remainder of 2021 in the Eastern U.S. and California, as measured by degree days, is anticipated to be consistent with the five-year average. In addition to the significant assumptions referred to above, refer to “Forward-Looking Information” and “Risk Factors to Superior” for a detailed review of significant business risks affecting the Propane Distribution businesses.
Superior Plus Corp. 22 2021 Second Quarter Results
CANADIAN PROPANE DISTRIBUTION Canadian Propane Distribution’s condensed operating results: Three Months Ended Six Months Ended
June 30 June 30 (millions of dollars) 2021 2020 2021 2020
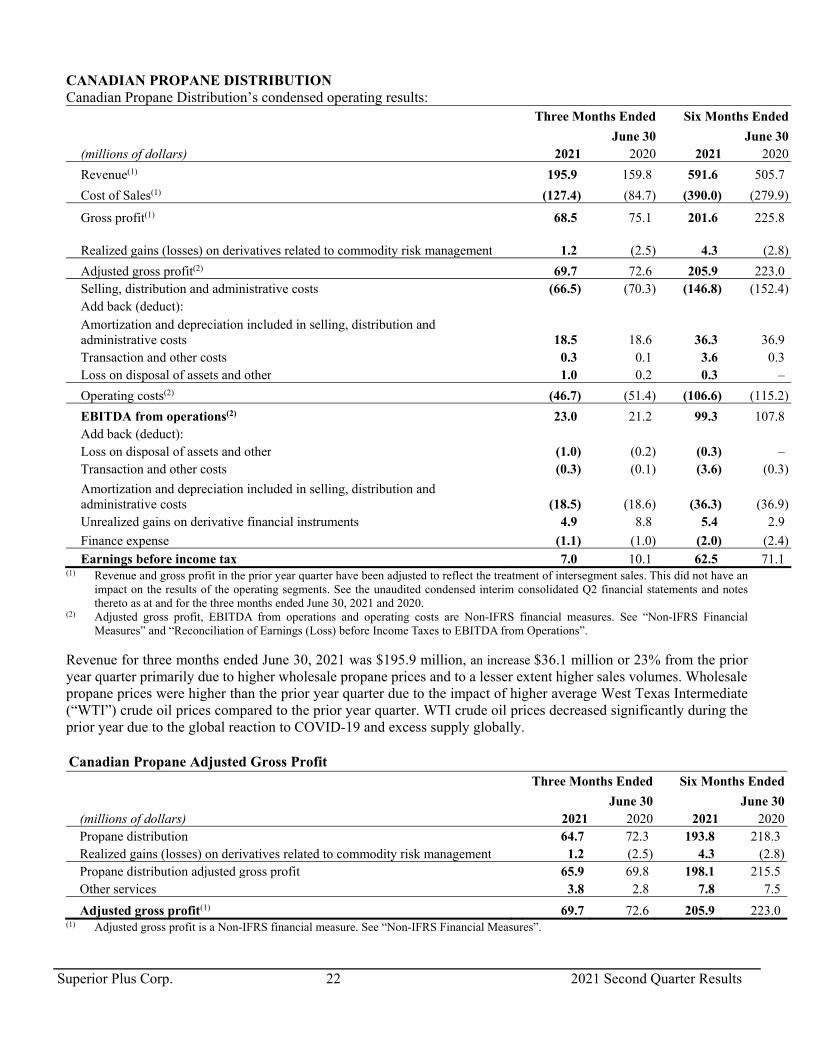
Revenue(1) 195.9 159.8 591.6 505.7
Cost of Sales(1) (127.4) (84.7) (390.0) (279.9)
Gross profit(1) 68.5 75.1 201.6 225.8
Realized gains (losses) on derivatives related to commodity risk management 1.2 (2.5) 4.3 (2.8)
Adjusted gross profit(2) 69.7 72.6 205.9 223.0 Selling, distribution and administrative costs (66.5) (70.3) (146.8) (152.4) Add back (deduct):
Amortization and depreciation included in selling, distribution and administrative costs 18.5 18.6 36.3 36.9
Transaction and other costs 0.3 0.1 3.6 0.3 Loss on disposal of assets and other 1.0 0.2 0.3 –
Operating costs(2) (46.7) (51.4) (106.6) (115.2)
EBITDA from operations(2) 23.0 21.2 99.3 107.8 Add back (deduct): Loss on disposal of assets and other (1.0) (0.2) (0.3) – Transaction and other costs (0.3) (0.1) (3.6) (0.3)
Amortization and depreciation included in selling, distribution and administrative costs (18.5) (18.6) (36.3) (36.9)
Unrealized gains on derivative financial instruments 4.9 8.8 5.4 2.9
Finance expense (1.1) (1.0) (2.0) (2.4) Earnings before income tax 7.0 10.1 62.5 71.1 (1) Revenue and gross profit in the prior year quarter have been adjusted to reflect the treatment of intersegment sales. This did not have an
impact on the results of the operating segments. See the unaudited condensed interim consolidated Q2 financial statements and notes thereto as at and for the three months ended June 30, 2021 and 2020.
(2) Adjusted gross profit, EBITDA from operations and operating costs are Non-IFRS financial measures. See “Non-IFRS Financial Measures” and “Reconciliation of Earnings (Loss) before Income Taxes to EBITDA from Operations”.
Revenue for three months ended June 30, 2021 was $195.9 million, an increase $36.1 million or 23% from the prior year quarter primarily due to higher wholesale propane prices and to a lesser extent higher sales volumes. Wholesale propane prices were higher than the prior year quarter due to the impact of higher average West Texas Intermediate (“WTI”) crude oil prices compared to the prior year quarter. WTI crude oil prices decreased significantly during the prior year due to the global reaction to COVID-19 and excess supply globally. Canadian Propane Adjusted Gross Profit Three Months Ended Six Months Ended
June 30 June 30 (millions of dollars) 2021 2020 2021 2020 Propane distribution 64.7 72.3 193.8 218.3 Realized gains (losses) on derivatives related to commodity risk management 1.2 (2.5) 4.3 (2.8) Propane distribution adjusted gross profit 65.9 69.8 198.1 215.5 Other services 3.8 2.8 7.8 7.5
Adjusted gross profit(1) 69.7 72.6 205.9 223.0 (1) Adjusted gross profit is a Non-IFRS financial measure. See “Non-IFRS Financial Measures”.
Superior Plus Corp. 23 2021 Second Quarter Results
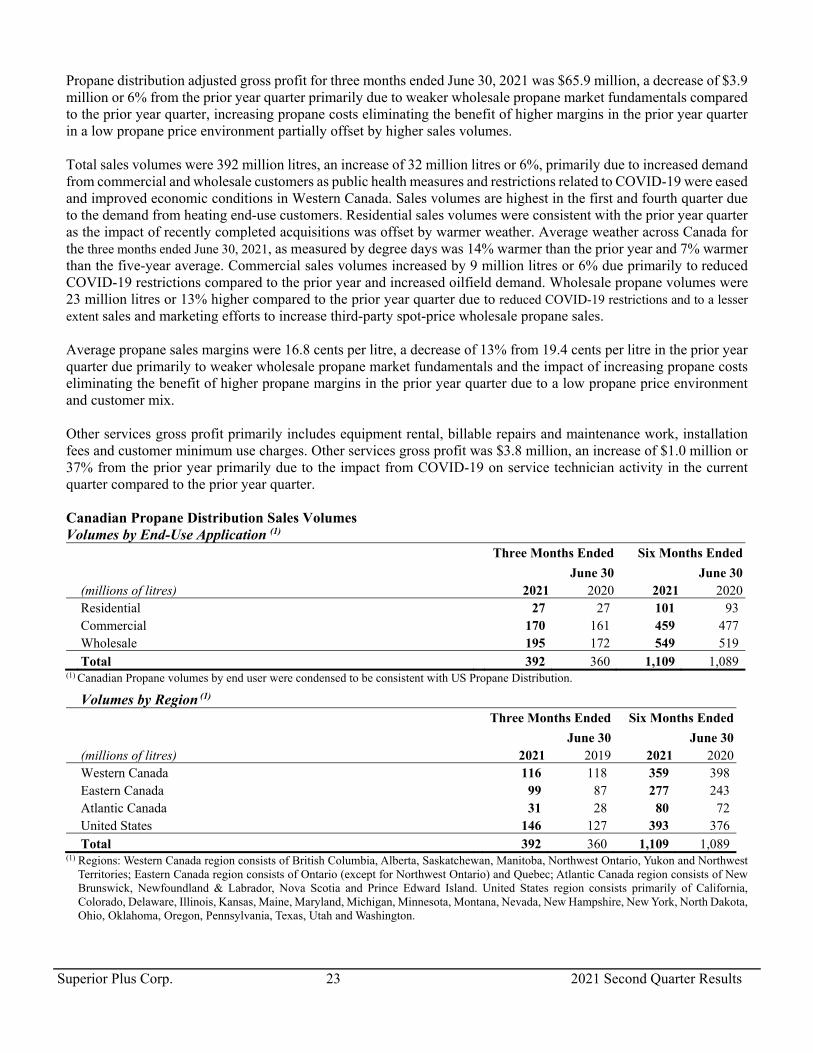
Propane distribution adjusted gross profit for three months ended June 30, 2021 was $65.9 million, a decrease of $3.9 million or 6% from the prior year quarter primarily due to weaker wholesale propane market fundamentals compared to the prior year quarter, increasing propane costs eliminating the benefit of higher margins in the prior year quarter in a low propane price environment partially offset by higher sales volumes. Total sales volumes were 392 million litres, an increase of 32 million litres or 6%, primarily due to increased demand from commercial and wholesale customers as public health measures and restrictions related to COVID-19 were eased and improved economic conditions in Western Canada. Sales volumes are highest in the first and fourth quarter due to the demand from heating end-use customers. Residential sales volumes were consistent with the prior year quarter as the impact of recently completed acquisitions was offset by warmer weather. Average weather across Canada for the three months ended June 30, 2021, as measured by degree days was 14% warmer than the prior year and 7% warmer than the five-year average. Commercial sales volumes increased by 9 million litres or 6% due primarily to reduced COVID-19 restrictions compared to the prior year and increased oilfield demand. Wholesale propane volumes were 23 million litres or 13% higher compared to the prior year quarter due to reduced COVID-19 restrictions and to a lesser extent sales and marketing efforts to increase third-party spot-price wholesale propane sales. Average propane sales margins were 16.8 cents per litre, a decrease of 13% from 19.4 cents per litre in the prior year quarter due primarily to weaker wholesale propane market fundamentals and the impact of increasing propane costs eliminating the benefit of higher propane margins in the prior year quarter due to a low propane price environment and customer mix. Other services gross profit primarily includes equipment rental, billable repairs and maintenance work, installation fees and customer minimum use charges. Other services gross profit was $3.8 million, an increase of $1.0 million or 37% from the prior year primarily due to the impact from COVID-19 on service technician activity in the current quarter compared to the prior year quarter. Canadian Propane Distribution Sales Volumes Volumes by End-Use Application (1)
Three Months Ended Six Months Ended
June 30 June 30 (millions of litres) 2021 2020 2021 2020 Residential 27 27 101 93 Commercial 170 161 459 477 Wholesale 195 172 549 519 Total 392 360 1,109 1,089 (1) Canadian Propane volumes by end user were condensed to be consistent with US Propane Distribution.
Volumes by Region (1) Three Months Ended Six Months Ended
June 30 June 30 (millions of litres) 2021 2019 2021 2020 Western Canada 116 118 359 398 Eastern Canada 99 87 277 243 Atlantic Canada 31 28 80 72 United States 146 127 393 376 Total 392 360 1,109 1,089 (1) Regions: Western Canada region consists of British Columbia, Alberta, Saskatchewan, Manitoba, Northwest Ontario, Yukon and Northwest
Territories; Eastern Canada region consists of Ontario (except for Northwest Ontario) and Quebec; Atlantic Canada region consists of New Brunswick, Newfoundland & Labrador, Nova Scotia and Prince Edward Island. United States region consists primarily of California, Colorado, Delaware, Illinois, Kansas, Maine, Maryland, Michigan, Minnesota, Montana, Nevada, New Hampshire, New York, North Dakota, Ohio, Oklahoma, Oregon, Pennsylvania, Texas, Utah and Washington.
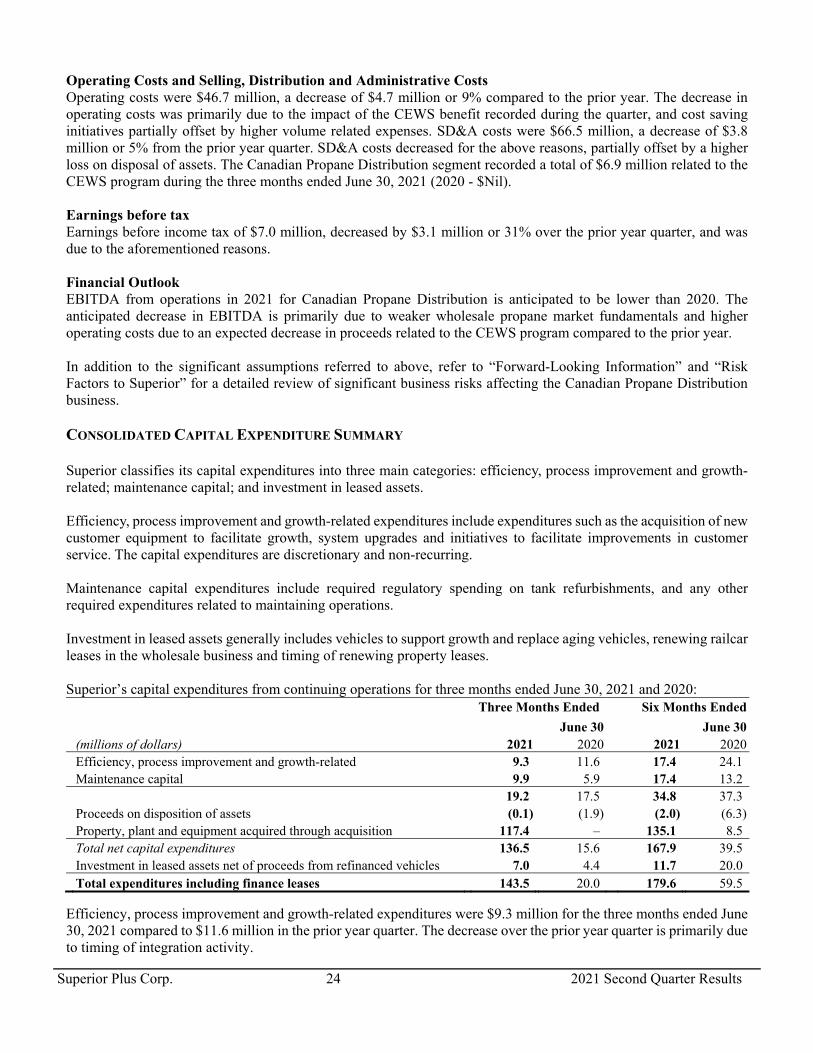
Superior Plus Corp. 24 2021 Second Quarter Results
Operating Costs and Selling, Distribution and Administrative Costs Operating costs were $46.7 million, a decrease of $4.7 million or 9% compared to the prior year. The decrease in operating costs was primarily due to the impact of the CEWS benefit recorded during the quarter, and cost saving initiatives partially offset by higher volume related expenses. SD&A costs were $66.5 million, a decrease of $3.8 million or 5% from the prior year quarter. SD&A costs decreased for the above reasons, partially offset by a higher loss on disposal of assets. The Canadian Propane Distribution segment recorded a total of $6.9 million related to the CEWS program during the three months ended June 30, 2021 (2020 - $Nil). Earnings before tax Earnings before income tax of $7.0 million, decreased by $3.1 million or 31% over the prior year quarter, and was due to the aforementioned reasons. Financial Outlook EBITDA from operations in 2021 for Canadian Propane Distribution is anticipated to be lower than 2020. The anticipated decrease in EBITDA is primarily due to weaker wholesale propane market fundamentals and higher operating costs due to an expected decrease in proceeds related to the CEWS program compared to the prior year. In addition to the significant assumptions referred to above, refer to “Forward-Looking Information” and “Risk Factors to Superior” for a detailed review of significant business risks affecting the Canadian Propane Distribution business. CONSOLIDATED CAPITAL EXPENDITURE SUMMARY Superior classifies its capital expenditures into three main categories: efficiency, process improvement and growth-related; maintenance capital; and investment in leased assets. Efficiency, process improvement and growth-related expenditures include expenditures such as the acquisition of new customer equipment to facilitate growth, system upgrades and initiatives to facilitate improvements in customer service. The capital expenditures are discretionary and non-recurring. Maintenance capital expenditures include required regulatory spending on tank refurbishments, and any other required expenditures related to maintaining operations. Investment in leased assets generally includes vehicles to support growth and replace aging vehicles, renewing railcar leases in the wholesale business and timing of renewing property leases. Superior’s capital expenditures from continuing operations for three months ended June 30, 2021 and 2020: Three Months Ended Six Months Ended
June 30 June 30 (millions of dollars) 2021 2020 2021 2020 Efficiency, process improvement and growth-related 9.3 11.6 17.4 24.1 Maintenance capital 9.9 5.9 17.4 13.2 19.2 17.5 34.8 37.3 Proceeds on disposition of assets (0.1) (1.9) (2.0) (6.3) Property, plant and equipment acquired through acquisition 117.4 – 135.1 8.5 Total net capital expenditures 136.5 15.6 167.9 39.5 Investment in leased assets net of proceeds from refinanced vehicles 7.0 4.4 11.7 20.0 Total expenditures including finance leases 143.5 20.0 179.6 59.5
Efficiency, process improvement and growth-related expenditures were $9.3 million for the three months ended June 30, 2021 compared to $11.6 million in the prior year quarter. The decrease over the prior year quarter is primarily due to timing of integration activity.
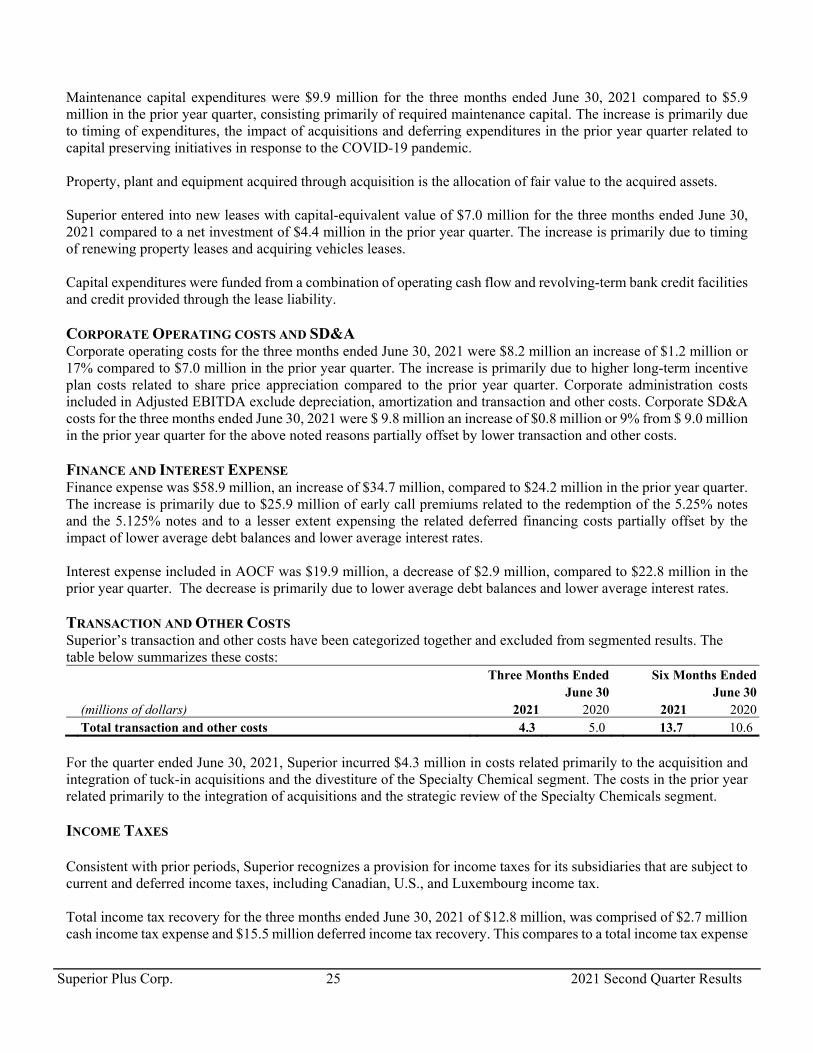
Superior Plus Corp. 25 2021 Second Quarter Results
Maintenance capital expenditures were $9.9 million for the three months ended June 30, 2021 compared to $5.9 million in the prior year quarter, consisting primarily of required maintenance capital. The increase is primarily due to timing of expenditures, the impact of acquisitions and deferring expenditures in the prior year quarter related to capital preserving initiatives in response to the COVID-19 pandemic. Property, plant and equipment acquired through acquisition is the allocation of fair value to the acquired assets. Superior entered into new leases with capital-equivalent value of $7.0 million for the three months ended June 30, 2021 compared to a net investment of $4.4 million in the prior year quarter. The increase is primarily due to timing of renewing property leases and acquiring vehicles leases. Capital expenditures were funded from a combination of operating cash flow and revolving-term bank credit facilities and credit provided through the lease liability. CORPORATE OPERATING COSTS AND SD&A Corporate operating costs for the three months ended June 30, 2021 were $8.2 million an increase of $1.2 million or 17% compared to $7.0 million in the prior year quarter. The increase is primarily due to higher long-term incentive plan costs related to share price appreciation compared to the prior year quarter. Corporate administration costs included in Adjusted EBITDA exclude depreciation, amortization and transaction and other costs. Corporate SD&A costs for the three months ended June 30, 2021 were $ 9.8 million an increase of $0.8 million or 9% from $ 9.0 million in the prior year quarter for the above noted reasons partially offset by lower transaction and other costs. FINANCE AND INTEREST EXPENSE Finance expense was $58.9 million, an increase of $34.7 million, compared to $24.2 million in the prior year quarter. The increase is primarily due to $25.9 million of early call premiums related to the redemption of the 5.25% notes and the 5.125% notes and to a lesser extent expensing the related deferred financing costs partially offset by the impact of lower average debt balances and lower average interest rates. Interest expense included in AOCF was $19.9 million, a decrease of $2.9 million, compared to $22.8 million in the prior year quarter. The decrease is primarily due to lower average debt balances and lower average interest rates. TRANSACTION AND OTHER COSTS Superior’s transaction and other costs have been categorized together and excluded from segmented results. The table below summarizes these costs: Three Months Ended Six Months Ended June 30 June 30 (millions of dollars) 2021 2020 2021 2020 Total transaction and other costs 4.3 5.0 13.7 10.6
For the quarter ended June 30, 2021, Superior incurred $4.3 million in costs related primarily to the acquisition and integration of tuck-in acquisitions and the divestiture of the Specialty Chemical segment. The costs in the prior year related primarily to the integration of acquisitions and the strategic review of the Specialty Chemicals segment. INCOME TAXES Consistent with prior periods, Superior recognizes a provision for income taxes for its subsidiaries that are subject to current and deferred income taxes, including Canadian, U.S., and Luxembourg income tax. Total income tax recovery for the three months ended June 30, 2021 of $12.8 million, was comprised of $2.7 million cash income tax expense and $15.5 million deferred income tax recovery. This compares to a total income tax expense

Superior Plus Corp. 26 2021 Second Quarter Results
of $35.3 million in the prior year quarter, which consisted of cash income tax expense of $1.8 million and $33.5 million deferred income tax expense. Cash income taxes for the three months ended June 30, 2021 were $2.7 million (2020 – $1.8 million), consisting of income taxes in Canada of $1.6 million (2020 – $1.6 million), in the U.S. of $0.5 million (2020 – $0.5 million recovery), and in Luxembourg of $0.6 million (2020 – $0.7 million). Deferred income tax expense for the three months ended June 30, 2021 was $15.5 million recovery (2020 – $33.5 million expense), resulting in a net deferred income tax liability of $111.7 million as at June 30, 2021. FINANCIAL OUTLOOK Superior is increasing the bottom end of the 2021 Adjusted EBITDA range due to expected contributions from recent acquisitions with expected Adjusted EBITDA guidance in the range of $390 million to $420 million up from the previously disclosed range of $380 million to $420 million. Superior expects the contribution from acquisitions that will close in 2021 will be partially offset by the impact of the stronger than anticipated Canadian dollar and slightly warmer weather in the first quarter compared to the five-year average. As a result of the ongoing impact of the COVID-19 pandemic and the impact from reduced oil and gas drilling activity to the broader macro-economy, results may differ from these assumptions. Achieving Superior’s Adjusted EBITDA depends on the operating results of its segments. In addition to the operating results of Superior’s segments, significant assumptions underlying the achievement of Superior’s 2021 guidance are:
Weather for the remainder of 2021 is expected to be consistent with the average temperature for the last five years;
Economic growth in Canada and the U.S. is expected to begin to stabilize in the second half of 2021; Superior is expected to continue to attract capital and obtain financing on acceptable terms; Acquisitions based on total consideration paid is expected to be higher than 2020; Superior estimates maintenance and non-recurring capital expenditures net of disposals and including vehicle
leases to be in the range of $120 million to $140 million in 2021; Superior is substantively hedged for its estimated U.S. dollar exposure for 2021, and due to the hedge position,
a change in the Canadian to U.S, dollar exchange rate for 2021 would not have a material impact to Superior. The foreign currency exchange rate between the Canadian dollar and U.S. dollar is expected to average $0.82
for the remainder of 2021 on all unhedged foreign currency transactions; Financial and physical counterparties are expected to continue fulfilling their obligations to Superior; Regulatory authorities are not expected to impose any new regulations impacting Superior; and Canadian and U.S. based cash taxes are expected to be in the range of $5 million to $15 million for 2021
based on existing statutory income tax rates and the ability to use available tax basis. This excludes cash taxes related to the divestiture of Specialty Chemicals.
U.S. Propane Distribution
Wholesale propane prices are anticipated to be higher than 2020, impacting margin opportunities; Wholesale propane prices are not anticipated to significantly affect demand for propane and related services; Continue to realize synergies from acquisitions primarily through supply chain efficiencies, margin
management improvements and operational expense savings; and Continue to implement cost-saving initiatives related to workforce optimization.
Canadian Propane Distribution
Wholesale propane and natural gas liquid fundamentals related to basis differentials are anticipated to be weaker than 2020;
Wholesale propane prices are not anticipated to significantly affect demand for propane and related services; Commercial and wholesale volumes are anticipated to be impacted by COVID-19 until vaccines are widely
distributed. The assumed recovery from COVID-19 is expected in the second half of 2021; and
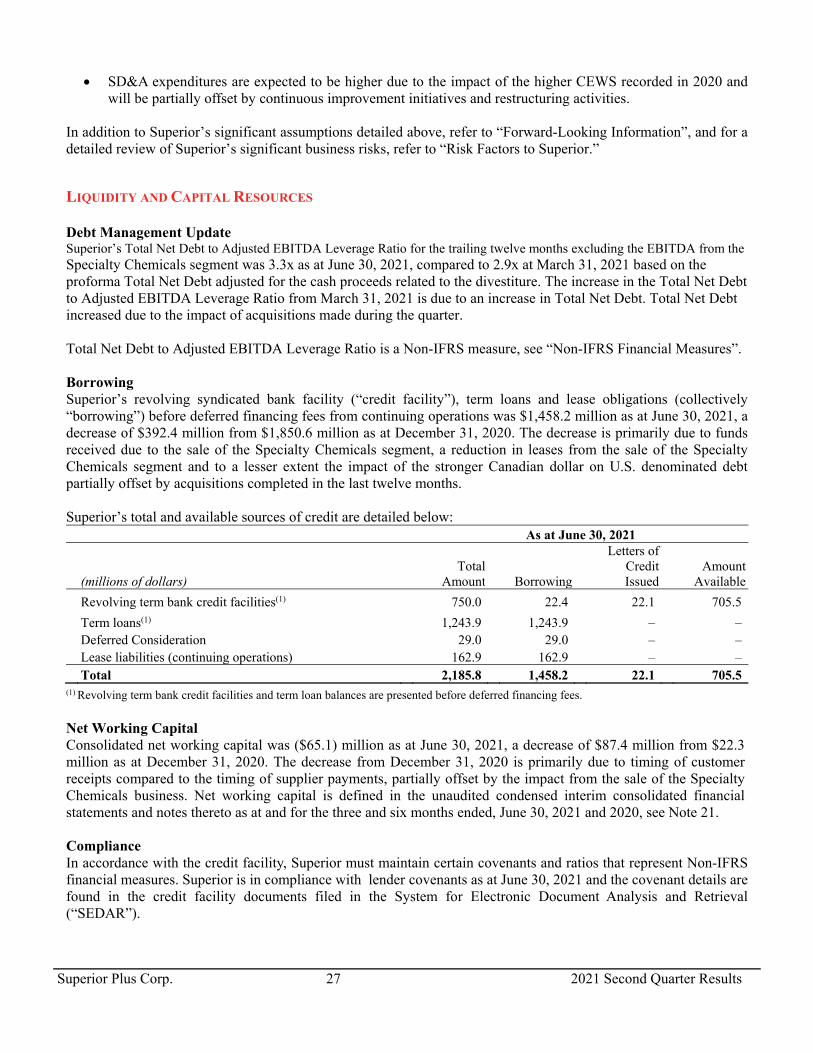
Superior Plus Corp. 27 2021 Second Quarter Results
SD&A expenditures are expected to be higher due to the impact of the higher CEWS recorded in 2020 and will be partially offset by continuous improvement initiatives and restructuring activities.
In addition to Superior’s significant assumptions detailed above, refer to “Forward-Looking Information”, and for a detailed review of Superior’s significant business risks, refer to “Risk Factors to Superior.”
LIQUIDITY AND CAPITAL RESOURCES Debt Management Update Superior’s Total Net Debt to Adjusted EBITDA Leverage Ratio for the trailing twelve months excluding the EBITDA from the Specialty Chemicals segment was 3.3x as at June 30, 2021, compared to 2.9x at March 31, 2021 based on the proforma Total Net Debt adjusted for the cash proceeds related to the divestiture. The increase in the Total Net Debt to Adjusted EBITDA Leverage Ratio from March 31, 2021 is due to an increase in Total Net Debt. Total Net Debt increased due to the impact of acquisitions made during the quarter. Total Net Debt to Adjusted EBITDA Leverage Ratio is a Non-IFRS measure, see “Non-IFRS Financial Measures”. Borrowing Superior’s revolving syndicated bank facility (“credit facility”), term loans and lease obligations (collectively “borrowing”) before deferred financing fees from continuing operations was $1,458.2 million as at June 30, 2021, a decrease of $392.4 million from $1,850.6 million as at December 31, 2020. The decrease is primarily due to funds received due to the sale of the Specialty Chemicals segment, a reduction in leases from the sale of the Specialty Chemicals segment and to a lesser extent the impact of the stronger Canadian dollar on U.S. denominated debt partially offset by acquisitions completed in the last twelve months. Superior’s total and available sources of credit are detailed below: As at June 30, 2021
(millions of dollars) Total
Amount Borrowing
Letters of Credit Issued
Amount Available
Revolving term bank credit facilities(1) 750.0 22.4 22.1 705.5
Term loans(1) 1,243.9 1,243.9 – – Deferred Consideration 29.0 29.0 – – Lease liabilities (continuing operations) 162.9 162.9 – – Total 2,185.8 1,458.2 22.1 705.5 (1) Revolving term bank credit facilities and term loan balances are presented before deferred financing fees.
Net Working Capital Consolidated net working capital was ($65.1) million as at June 30, 2021, a decrease of $87.4 million from $22.3 million as at December 31, 2020. The decrease from December 31, 2020 is primarily due to timing of customer receipts compared to the timing of supplier payments, partially offset by the impact from the sale of the Specialty Chemicals business. Net working capital is defined in the unaudited condensed interim consolidated financial statements and notes thereto as at and for the three and six months ended, June 30, 2021 and 2020, see Note 21. Compliance In accordance with the credit facility, Superior must maintain certain covenants and ratios that represent Non-IFRS financial measures. Superior is in compliance with lender covenants as at June 30, 2021 and the covenant details are found in the credit facility documents filed in the System for Electronic Document Analysis and Retrieval (“SEDAR”).
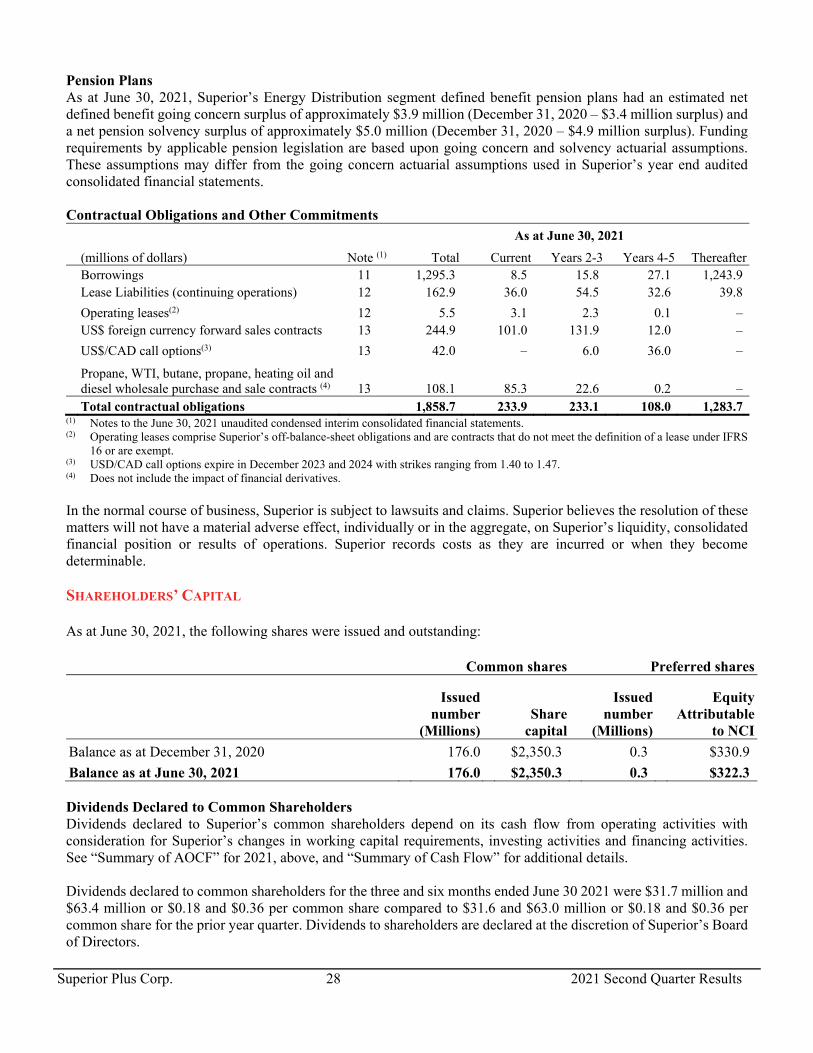
Superior Plus Corp. 28 2021 Second Quarter Results
Pension Plans As at June 30, 2021, Superior’s Energy Distribution segment defined benefit pension plans had an estimated net defined benefit going concern surplus of approximately $3.9 million (December 31, 2020 – $3.4 million surplus) and a net pension solvency surplus of approximately $5.0 million (December 31, 2020 – $4.9 million surplus). Funding requirements by applicable pension legislation are based upon going concern and solvency actuarial assumptions. These assumptions may differ from the going concern actuarial assumptions used in Superior’s year end audited consolidated financial statements. Contractual Obligations and Other Commitments
As at June 30, 2021
(millions of dollars) Note (1) Total Current Years 2-3 Years 4-5 Thereafter Borrowings 11 1,295.3 8.5 15.8 27.1 1,243.9 Lease Liabilities (continuing operations) 12 162.9 36.0 54.5 32.6 39.8
Operating leases(2) 12 5.5 3.1 2.3 0.1 – US$ foreign currency forward sales contracts 13 244.9 101.0 131.9 12.0 –
US$/CAD call options(3) 13 42.0 – 6.0 36.0 –
Propane, WTI, butane, propane, heating oil and diesel wholesale purchase and sale contracts (4) 13 108.1 85.3 22.6 0.2 –
Total contractual obligations 1,858.7 233.9 233.1 108.0 1,283.7 (1) Notes to the June 30, 2021 unaudited condensed interim consolidated financial statements. (2) Operating leases comprise Superior’s off-balance-sheet obligations and are contracts that do not meet the definition of a lease under IFRS
16 or are exempt. (3) USD/CAD call options expire in December 2023 and 2024 with strikes ranging from 1.40 to 1.47. (4) Does not include the impact of financial derivatives. In the normal course of business, Superior is subject to lawsuits and claims. Superior believes the resolution of these matters will not have a material adverse effect, individually or in the aggregate, on Superior’s liquidity, consolidated financial position or results of operations. Superior records costs as they are incurred or when they become determinable. SHAREHOLDERS’ CAPITAL As at June 30, 2021, the following shares were issued and outstanding: Common shares Preferred shares
Issued number
(Millions)
Issued number
(Millions)
Equity Attributable
to NCI Share capital
Balance as at December 31, 2020 176.0 $2,350.3 0.3 $330.9
Balance as at June 30, 2021 176.0 $2,350.3 0.3 $322.3 Dividends Declared to Common Shareholders Dividends declared to Superior’s common shareholders depend on its cash flow from operating activities with consideration for Superior’s changes in working capital requirements, investing activities and financing activities. See “Summary of AOCF” for 2021, above, and “Summary of Cash Flow” for additional details. Dividends declared to common shareholders for the three and six months ended June 30 2021 were $31.7 million and $63.4 million or $0.18 and $0.36 per common share compared to $31.6 and $63.0 million or $0.18 and $0.36 per common share for the prior year quarter. Dividends to shareholders are declared at the discretion of Superior’s Board of Directors.
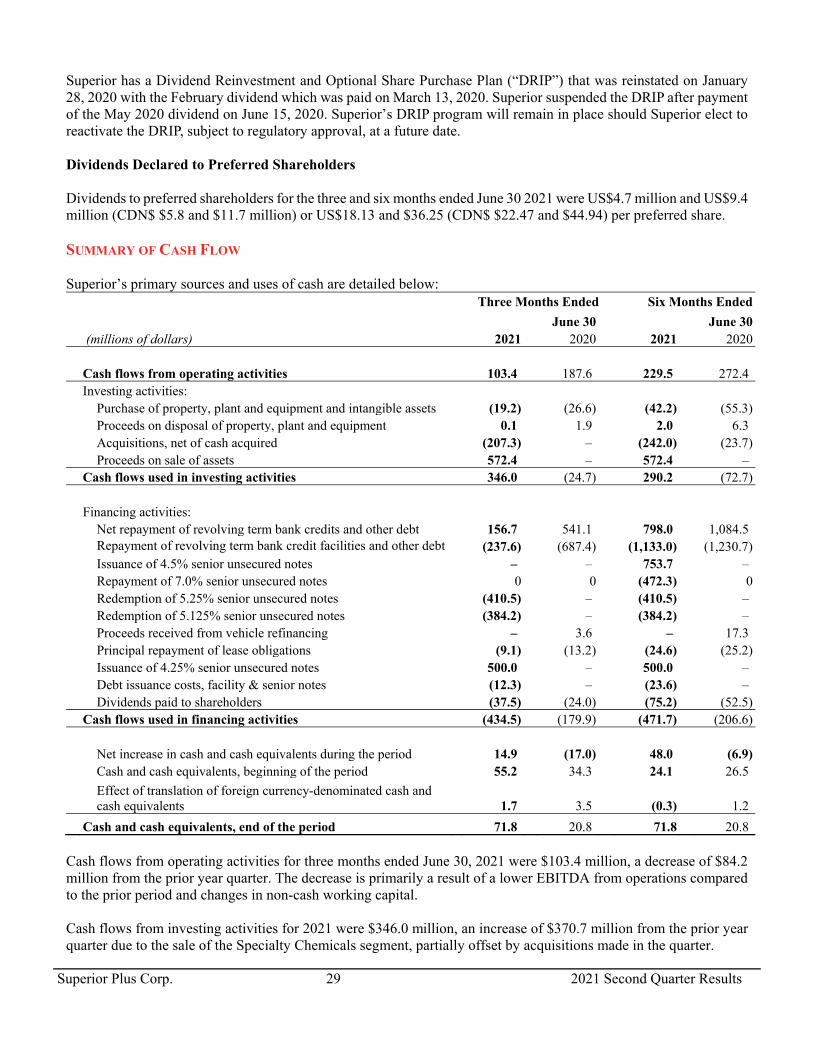
Superior Plus Corp. 29 2021 Second Quarter Results
Superior has a Dividend Reinvestment and Optional Share Purchase Plan (“DRIP”) that was reinstated on January 28, 2020 with the February dividend which was paid on March 13, 2020. Superior suspended the DRIP after payment of the May 2020 dividend on June 15, 2020. Superior’s DRIP program will remain in place should Superior elect to reactivate the DRIP, subject to regulatory approval, at a future date. Dividends Declared to Preferred Shareholders Dividends to preferred shareholders for the three and six months ended June 30 2021 were US$4.7 million and US$9.4 million (CDN$ $5.8 and $11.7 million) or US$18.13 and $36.25 (CDN$ $22.47 and $44.94) per preferred share. SUMMARY OF CASH FLOW Superior’s primary sources and uses of cash are detailed below: Three Months Ended Six Months Ended
June 30 June 30 (millions of dollars) 2021 2020 2021 2020 Cash flows from operating activities 103.4 187.6 229.5 272.4 Investing activities: Purchase of property, plant and equipment and intangible assets (19.2) (26.6) (42.2) (55.3) Proceeds on disposal of property, plant and equipment 0.1 1.9 2.0 6.3 Acquisitions, net of cash acquired (207.3) – (242.0) (23.7) Proceeds on sale of assets 572.4 – 572.4 – Cash flows used in investing activities 346.0 (24.7) 290.2 (72.7) Financing activities: Net repayment of revolving term bank credits and other debt 156.7 541.1 798.0 1,084.5 Repayment of revolving term bank credit facilities and other debt (237.6) (687.4) (1,133.0) (1,230.7) Issuance of 4.5% senior unsecured notes – – 753.7 – Repayment of 7.0% senior unsecured notes 0 0 (472.3) 0 Redemption of 5.25% senior unsecured notes (410.5) – (410.5) – Redemption of 5.125% senior unsecured notes (384.2) – (384.2) – Proceeds received from vehicle refinancing – 3.6 – 17.3 Principal repayment of lease obligations (9.1) (13.2) (24.6) (25.2) Issuance of 4.25% senior unsecured notes 500.0 – 500.0 – Debt issuance costs, facility & senior notes (12.3) – (23.6) – Dividends paid to shareholders (37.5) (24.0) (75.2) (52.5) Cash flows used in financing activities (434.5) (179.9) (471.7) (206.6) Net increase in cash and cash equivalents during the period 14.9 (17.0) 48.0 (6.9) Cash and cash equivalents, beginning of the period 55.2 34.3 24.1 26.5
Effect of translation of foreign currency-denominated cash and cash equivalents 1.7 3.5 (0.3) 1.2
Cash and cash equivalents, end of the period 71.8 20.8 71.8 20.8 Cash flows from operating activities for three months ended June 30, 2021 were $103.4 million, a decrease of $84.2 million from the prior year quarter. The decrease is primarily a result of a lower EBITDA from operations compared to the prior period and changes in non-cash working capital. Cash flows from investing activities for 2021 were $346.0 million, an increase of $370.7 million from the prior year quarter due to the sale of the Specialty Chemicals segment, partially offset by acquisitions made in the quarter.
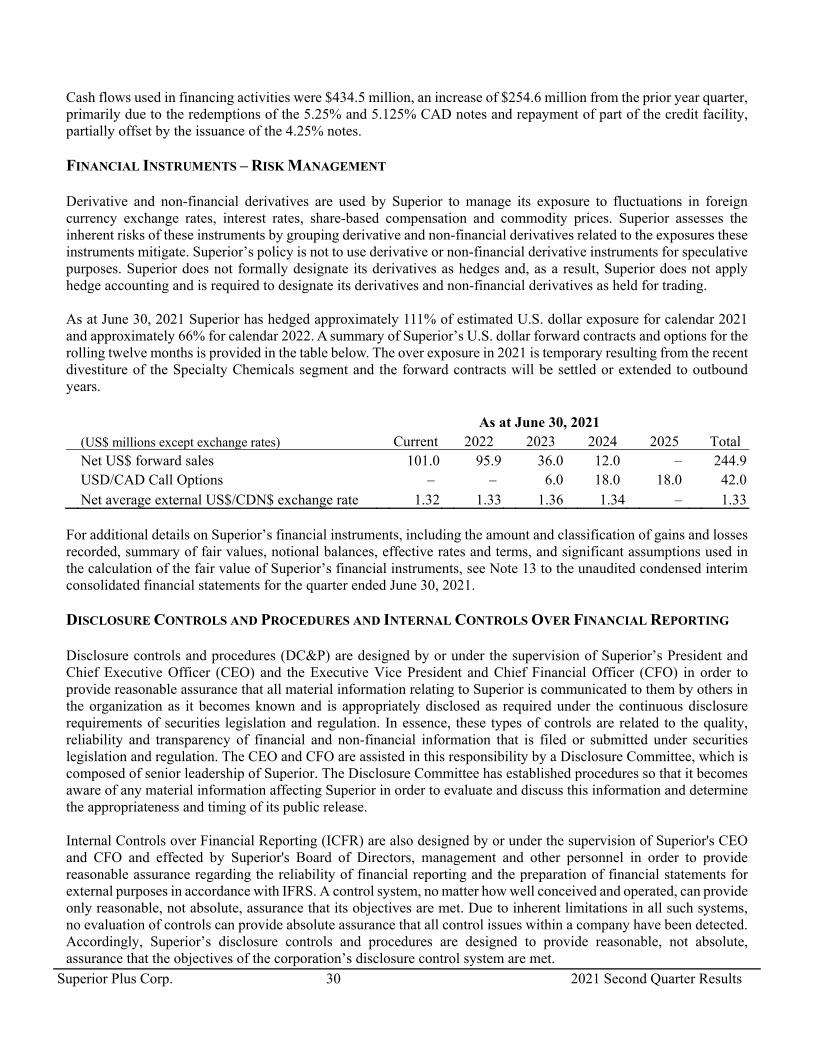
Superior Plus Corp. 30 2021 Second Quarter Results
Cash flows used in financing activities were $434.5 million, an increase of $254.6 million from the prior year quarter, primarily due to the redemptions of the 5.25% and 5.125% CAD notes and repayment of part of the credit facility, partially offset by the issuance of the 4.25% notes. FINANCIAL INSTRUMENTS – RISK MANAGEMENT Derivative and non-financial derivatives are used by Superior to manage its exposure to fluctuations in foreign currency exchange rates, interest rates, share-based compensation and commodity prices. Superior assesses the inherent risks of these instruments by grouping derivative and non-financial derivatives related to the exposures these instruments mitigate. Superior’s policy is not to use derivative or non-financial derivative instruments for speculative purposes. Superior does not formally designate its derivatives as hedges and, as a result, Superior does not apply hedge accounting and is required to designate its derivatives and non-financial derivatives as held for trading. As at June 30, 2021 Superior has hedged approximately 111% of estimated U.S. dollar exposure for calendar 2021 and approximately 66% for calendar 2022. A summary of Superior’s U.S. dollar forward contracts and options for the rolling twelve months is provided in the table below. The over exposure in 2021 is temporary resulting from the recent divestiture of the Specialty Chemicals segment and the forward contracts will be settled or extended to outbound years. As at June 30, 2021 (US$ millions except exchange rates) Current 2022 2023 2024 2025 Total Net US$ forward sales 101.0 95.9 36.0 12.0 – 244.9 USD/CAD Call Options – – 6.0 18.0 18.0 42.0 Net average external US$/CDN$ exchange rate 1.32 1.33 1.36 1.34 – 1.33 For additional details on Superior’s financial instruments, including the amount and classification of gains and losses recorded, summary of fair values, notional balances, effective rates and terms, and significant assumptions used in the calculation of the fair value of Superior’s financial instruments, see Note 13 to the unaudited condensed interim consolidated financial statements for the quarter ended June 30, 2021. DISCLOSURE CONTROLS AND PROCEDURES AND INTERNAL CONTROLS OVER FINANCIAL REPORTING Disclosure controls and procedures (DC&P) are designed by or under the supervision of Superior’s President and Chief Executive Officer (CEO) and the Executive Vice President and Chief Financial Officer (CFO) in order to provide reasonable assurance that all material information relating to Superior is communicated to them by others in the organization as it becomes known and is appropriately disclosed as required under the continuous disclosure requirements of securities legislation and regulation. In essence, these types of controls are related to the quality, reliability and transparency of financial and non-financial information that is filed or submitted under securities legislation and regulation. The CEO and CFO are assisted in this responsibility by a Disclosure Committee, which is composed of senior leadership of Superior. The Disclosure Committee has established procedures so that it becomes aware of any material information affecting Superior in order to evaluate and discuss this information and determine the appropriateness and timing of its public release. Internal Controls over Financial Reporting (ICFR) are also designed by or under the supervision of Superior's CEO and CFO and effected by Superior's Board of Directors, management and other personnel in order to provide reasonable assurance regarding the reliability of financial reporting and the preparation of financial statements for external purposes in accordance with IFRS. A control system, no matter how well conceived and operated, can provide only reasonable, not absolute, assurance that its objectives are met. Due to inherent limitations in all such systems, no evaluation of controls can provide absolute assurance that all control issues within a company have been detected. Accordingly, Superior’s disclosure controls and procedures are designed to provide reasonable, not absolute, assurance that the objectives of the corporation’s disclosure control system are met.
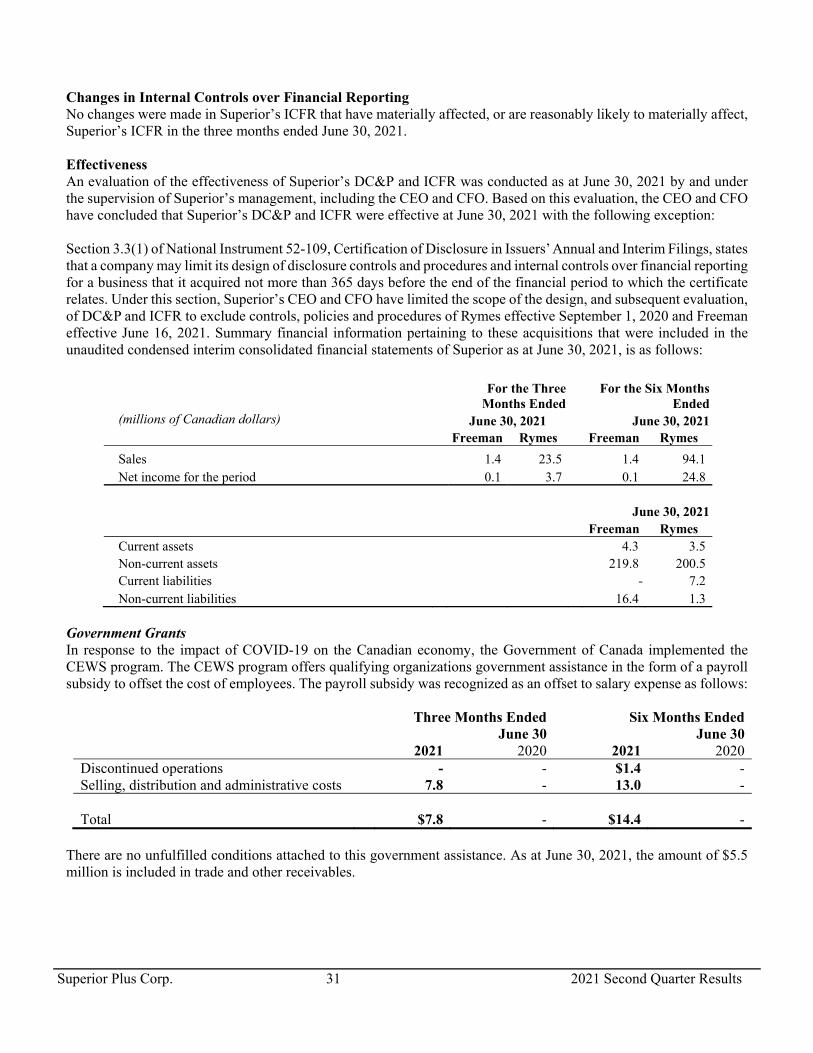
Superior Plus Corp. 31 2021 Second Quarter Results
Changes in Internal Controls over Financial Reporting No changes were made in Superior’s ICFR that have materially affected, or are reasonably likely to materially affect, Superior’s ICFR in the three months ended June 30, 2021. Effectiveness An evaluation of the effectiveness of Superior’s DC&P and ICFR was conducted as at June 30, 2021 by and under the supervision of Superior’s management, including the CEO and CFO. Based on this evaluation, the CEO and CFO have concluded that Superior’s DC&P and ICFR were effective at June 30, 2021 with the following exception: Section 3.3(1) of National Instrument 52-109, Certification of Disclosure in Issuers’ Annual and Interim Filings, states that a company may limit its design of disclosure controls and procedures and internal controls over financial reporting for a business that it acquired not more than 365 days before the end of the financial period to which the certificate relates. Under this section, Superior’s CEO and CFO have limited the scope of the design, and subsequent evaluation, of DC&P and ICFR to exclude controls, policies and procedures of Rymes effective September 1, 2020 and Freeman effective June 16, 2021. Summary financial information pertaining to these acquisitions that were included in the unaudited condensed interim consolidated financial statements of Superior as at June 30, 2021, is as follows:
For the Three
Months Ended For the Six Months
Ended (millions of Canadian dollars) June 30, 2021 June 30, 2021 Freeman Rymes Freeman Rymes
Sales 1.4 23.5 1.4 94.1 Net income for the period 0.1 3.7 0.1 24.8 June 30, 2021 Freeman Rymes Current assets 4.3 3.5 Non-current assets 219.8 200.5 Current liabilities - 7.2 Non-current liabilities 16.4 1.3
Government Grants In response to the impact of COVID-19 on the Canadian economy, the Government of Canada implemented the CEWS program. The CEWS program offers qualifying organizations government assistance in the form of a payroll subsidy to offset the cost of employees. The payroll subsidy was recognized as an offset to salary expense as follows:
Three Months Ended Six Months Ended June 30 June 30 2021 2020 2021 2020 Discontinued operations - - $1.4 - Selling, distribution and administrative costs 7.8 - 13.0 -
Total
$7.8 - $14.4 - There are no unfulfilled conditions attached to this government assistance. As at June 30, 2021, the amount of $5.5 million is included in trade and other receivables.
Superior Plus Corp. 32 2021 Second Quarter Results
CRITICAL ACCOUNTING POLICIES AND ESTIMATES Superior’s audited consolidated financial statements were prepared in accordance with IFRS. The significant accounting policies are described in the audited consolidated financial statements for the year ended December 31, 2020. Certain of these accounting policies, as well as estimates made by management in applying such policies, are recognized as critical because they require management to make subjective or complex judgments about matters that are inherently uncertain. Superior’s critical accounting estimates relate to the allowance for doubtful accounts, employee future benefits, deferred income tax assets and liabilities, the valuation of financial and non-financial derivatives, asset impairments, the purchase price allocation for business combinations and the assessment of potential provision for asset retirement obligations. Recent Accounting Pronouncements Certain new standards, interpretations, amendments and improvements to existing standards were issued by the IASB or the International Financial Reporting Interpretations Committee effective for accounting periods beginning on or after January 1, 2021, or latter periods. Adoption of Interest Rate Benchmark Reform Various interest rate and other indices that are deemed to be “benchmarks” (including LIBOR) are the subject of international regulatory guidance and proposals for reform. Regulators in various jurisdictions have pushed for the transition from Interbank Offered Rates (“IBORs”) to alternative benchmark rates (alternative rates), based upon risk free rates determined using actual market transactions. In March 2021, the Financial Conduct Authority and the ICE Benchmark Administration announced that US dollar one-week and two-month settings will stop being published after December 31, 2021 and all remaining US dollar LIBOR settings will stop being published after June 30, 2023. The transition from current reference rates to alternative rates may adversely affect the value of contracts linked to existing benchmarks. These developments may cause some LIBOR and other benchmarks to be discontinued. Superior is monitoring these developments and the impact this may have on our LIBOR based borrowings. The IASB addressed interest rate benchmark reform and its effects on financial reporting in two phases. The first phase focuses on issues affecting financial reporting in the period before the interest rate benchmark reform, while the second phase focuses on the issues that affect financial reporting once the existing rate is replaced with an alternative rate. In September 2019, the IASB finalized the first phase through the issuance of “Interest Rate Benchmark Reform: Amendments to IFRS 9, IAS 39 and IFRS 7”. This did not have any impact on Superior. In August 2020, the IASB finalized the second phase through the issuance of “Interest Rate Benchmark Reform: Phase 2 Amendments to IFRS 9, IAS 39, IFRS 7, IFRS 4 and IFRS 16” (Phase 2 amendments), which addresses the issues that affect financial reporting once the existing rate is replaced with an alternative rate. The Phase 2 amendments are effective and have been adopted on January 1, 2021. For financial instruments measured using amortized cost measurement, changes to the basis for determining the contractual cash flows required by interest rate benchmark reform are reflected by adjusting their effective interest rate. No immediate gain or loss is recognized. For lease liabilities where there is a change to the basis for determining the contractual cash flows, as a practical expedient the lease liability is remeasured by discounting the revised lease payments using a discount rate that reflects the change in the interest rate where the change is required by IBOR reform. These expedients are only applicable to changes that are required by interest rate benchmark reform when made on an economically equivalent basis. Superior does not expect changes related to interest rate benchmark reform to have a material impact to Superior’s results. Superior’s exposure is limited to borrowings with a variable interest rate, see Note 11 of the unaudited condensed interim consolidated financial statements as at June 30, 2021.

Superior Plus Corp. 33 2021 Second Quarter Results
NON-IFRS FINANCIAL MEASURES Throughout the MD&A, Superior has used the following terms that are not defined by IFRS, but are used by management to evaluate the performance of Superior and its business. These measures may also be used by investors, financial institutions and credit rating agencies to assess Superior’s performance and ability to service debt. Non-IFRS financial measures do not have standardized meaning prescribed by IFRS and are therefore unlikely to be comparable to similar measures presented by other companies. Securities regulations require that Non-IFRS financial measures be clearly defined, qualified and reconciled to their most comparable IFRS financial measures. Except as otherwise indicated, these Non-IFRS financial measures are calculated and disclosed on a consistent basis from period to period. Specific items may only be relevant in certain periods. The intent of non-IFRS financial measures is to provide additional useful information to investors and analysts, and the measures do not have any standardized meaning under IFRS. The measures should not, therefore, be considered in isolation or used in substitute for measures of performance prepared in accordance with IFRS. Other issuers may calculate non-IFRS financial measures differently. Investors should be cautioned that AOCF, EBITDA from operations, and Adjusted EBITDA should not be construed as alternatives to net earnings, cash flow from operating activities or other measures of financial results determined in accordance with IFRS as an indicator of Superior’s performance. Non-IFRS financial measures are identified and defined as follows: AOCF and AOCF per Share AOCF is equal to cash flow from operating activities as defined by IFRS, adjusted for changes in non-cash working capital, other expenses, non-cash interest expense, current income taxes and finance costs. Interest expense included in AOCF is equal to finance expense as defined by IFRS, adjusted for unwinding of discount on debentures, borrowing and decommissioning liabilities and other non-recurring items. Superior may deduct or include additional items in its calculation of AOCF; these items would generally, but not necessarily, be infrequent in nature and could distort the analysis of trends in business performance. Excluding these items does not imply they are non-recurring. AOCF and AOCF per share are presented before and after transaction and other costs. AOCF per share before transaction and other costs is calculated by dividing AOCF before transaction and other costs by the weighted average number of shares outstanding. AOCF per share is calculated by dividing AOCF by the weighted average number of shares outstanding. AOCF is a performance measure used by management and investors to evaluate Superior’s ongoing performance of its businesses and ability to generate cash flow. AOCF represents cash flow generated by Superior that is available for, but not necessarily limited to, changes in working capital requirements, investing activities and financing activities. The seasonality of Superior’s individual quarterly results must be assessed in the context of annualized AOCF. Adjustments recorded by Superior as part of its calculation of AOCF include, but are not limited to, the impact of the seasonality of Superior’s businesses, principally the Propane Distribution segments, by adjusting for non-cash working capital items, thereby eliminating the impact of the timing between the recognition and collection/payment of Superior’s revenue and expenses, which can differ significantly from quarter to quarter. Adjusted EBITDA Adjusted EBITDA represents earnings before interest, taxes, depreciation, amortization, losses (gains) on disposal of assets, finance expense, restructuring costs, transaction and other costs, and unrealized gains (losses) on derivative financial instruments. Adjusted EBITDA is used by Superior and investors to assess its consolidated results and ability to service debt. Adjusted EBITDA is reconciled to earnings before income taxes. Adjusted EBITDA is a significant performance measure used by management and investors to evaluate Superior’s ongoing performance of its businesses. Adjusted EBITDA is also used as one component in determining short-term incentive compensation for certain management employees.
Superior Plus Corp. 34 2021 Second Quarter Results
The seasonality of Superior’s individual quarterly results must be assessed in the context of annualized Adjusted EBITDA. EBITDA from operations EBITDA from operations is defined as Adjusted EBITDA excluding costs that are not considered representative of Superior’s underlying core operating performance, including gains and losses on foreign currency hedging contracts, corporate costs and transaction and other costs. Management uses EBITDA from operations to set targets for Superior (including annual guidance and variable compensation targets). EBITDA from operations is reconciled to earnings before income taxes. Adjusted Gross Profit Adjusted gross profit represents revenue less cost of sales adjusted for realized gains and losses on commodity derivative instruments related to risk management. Management uses Adjusted Gross Profit to set margin targets and measure results. Unrealized gains and losses on commodity derivative instruments are excluded because of the accounting mis-match that exists as a result of the customer contract not being included in the determination of the fair value for this risk management activity. Operating Costs Operating costs are defined as SD&A expenses adjusted for amortization and depreciation, gains or losses on disposal of assets and transaction, restructuring and other costs. Operating costs include wages and benefits for employees, drivers, service and administrative labour, fleet maintenance and operating costs, freight and distribution expenses excluded from cost of sales, along with the costs associated with owning and maintaining land, buildings and equipment, such as repairs and maintenance, environmental, utilities, insurance and property tax costs. Interest expense Interest expense is defined as Finance expense excluding unwinding of discount on decommissioning liabilities, non-cash finance expenses and premiums on the early redemption of borrowings. Management uses interest expense in the calculation of AOCF because it better reflects the cost of financing operations, including acquisitions. Total Net Debt to Adjusted EBITDA Leverage Ratio and Pro Forma Adjusted EBITDA Adjusted EBITDA for the Total Net Debt to Adjusted EBITDA Leverage Ratio is defined as Adjusted EBITDA calculated on a 12-month trailing basis giving pro forma effect to acquisitions and dispositions adjusted to the first day of the calculation period (“Pro Forma Adjusted EBITDA”). Pro Forma Adjusted EBITDA is used by Superior to calculate its Total Net Debt to Adjusted EBITDA Leverage Ratio. Total Net Debt is determined by taking the sum of borrowings before deferred financing fees and lease liabilities and reducing this by the cash and cash equivalents balance. To calculate the Total Net Debt to Adjusted EBITDA Leverage Ratio divide Total Net Debt by Pro Forma Adjusted EBITDA. Total Net Debt to Adjusted EBITDA Leverage Ratio is used by Superior and investors to assess its ability to service debt.
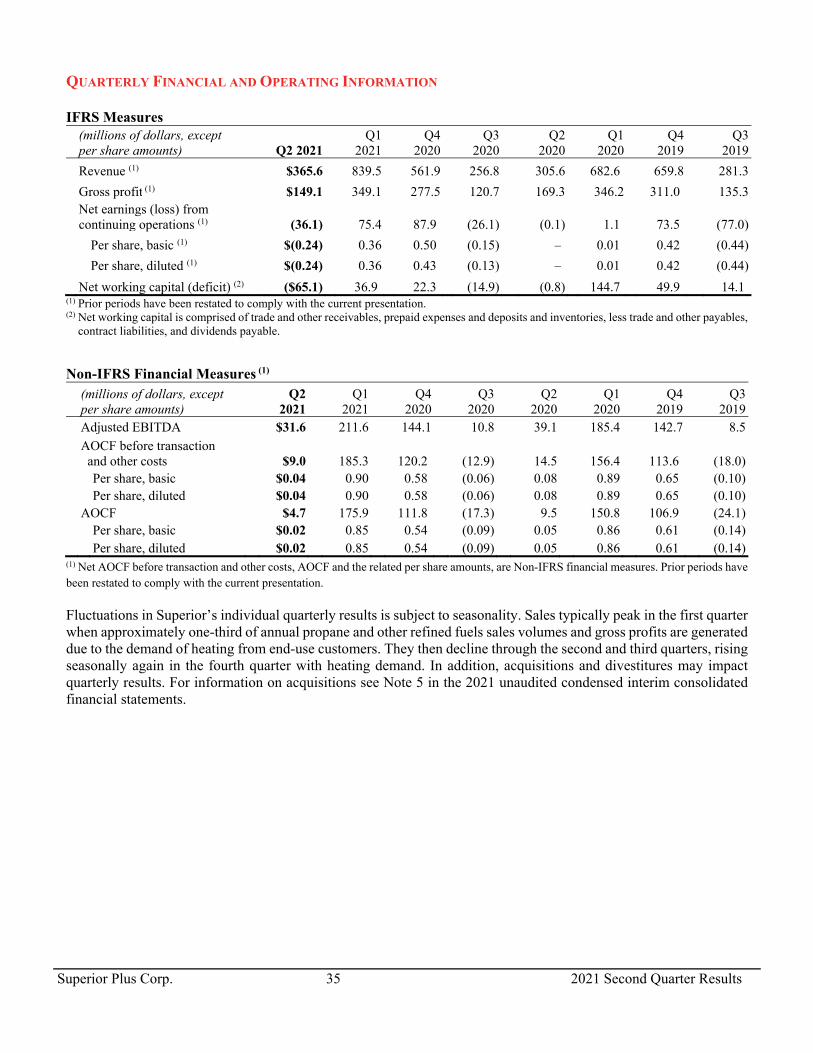
Superior Plus Corp. 35 2021 Second Quarter Results
QUARTERLY FINANCIAL AND OPERATING INFORMATION IFRS Measures
(millions of dollars, except per share amounts) Q2 2021
Q1 2021
Q4 2020
Q3 2020
Q2 2020
Q1 2020
Q4 2019
Q3 2019
Revenue (1) $365.6 839.5 561.9 256.8 305.6 682.6 659.8 281.3
Gross profit (1) $149.1 349.1 277.5 120.7 169.3 346.2 311.0 135.3
Net earnings (loss) from continuing operations (1) (36.1) 75.4 87.9 (26.1) (0.1) 1.1 73.5 (77.0)
Per share, basic (1) $(0.24) 0.36 0.50 (0.15) – 0.01 0.42 (0.44)
Per share, diluted (1) $(0.24) 0.36 0.43 (0.13) – 0.01 0.42 (0.44)
Net working capital (deficit) (2) ($65.1) 36.9 22.3 (14.9) (0.8) 144.7 49.9 14.1 (1) Prior periods have been restated to comply with the current presentation. (2) Net working capital is comprised of trade and other receivables, prepaid expenses and deposits and inventories, less trade and other payables,
contract liabilities, and dividends payable.
Non-IFRS Financial Measures (1)
(millions of dollars, except per share amounts)
Q2 2021
Q1 2021
Q4 2020
Q3 2020
Q2 2020
Q1 2020
Q4 2019
Q3 2019
Adjusted EBITDA $31.6 211.6 144.1 10.8 39.1 185.4 142.7 8.5
AOCF before transaction and other costs $9.0 185.3 120.2 (12.9) 14.5 156.4 113.6 (18.0)
Per share, basic $0.04 0.90 0.58 (0.06) 0.08 0.89 0.65 (0.10) Per share, diluted $0.04 0.90 0.58 (0.06) 0.08 0.89 0.65 (0.10) AOCF $4.7 175.9 111.8 (17.3) 9.5 150.8 106.9 (24.1) Per share, basic $0.02 0.85 0.54 (0.09) 0.05 0.86 0.61 (0.14) Per share, diluted $0.02 0.85 0.54 (0.09) 0.05 0.86 0.61 (0.14) (1) Net AOCF before transaction and other costs, AOCF and the related per share amounts, are Non-IFRS financial measures. Prior periods have been restated to comply with the current presentation. Fluctuations in Superior’s individual quarterly results is subject to seasonality. Sales typically peak in the first quarter when approximately one-third of annual propane and other refined fuels sales volumes and gross profits are generated due to the demand of heating from end-use customers. They then decline through the second and third quarters, rising seasonally again in the fourth quarter with heating demand. In addition, acquisitions and divestitures may impact quarterly results. For information on acquisitions see Note 5 in the 2021 unaudited condensed interim consolidated financial statements.
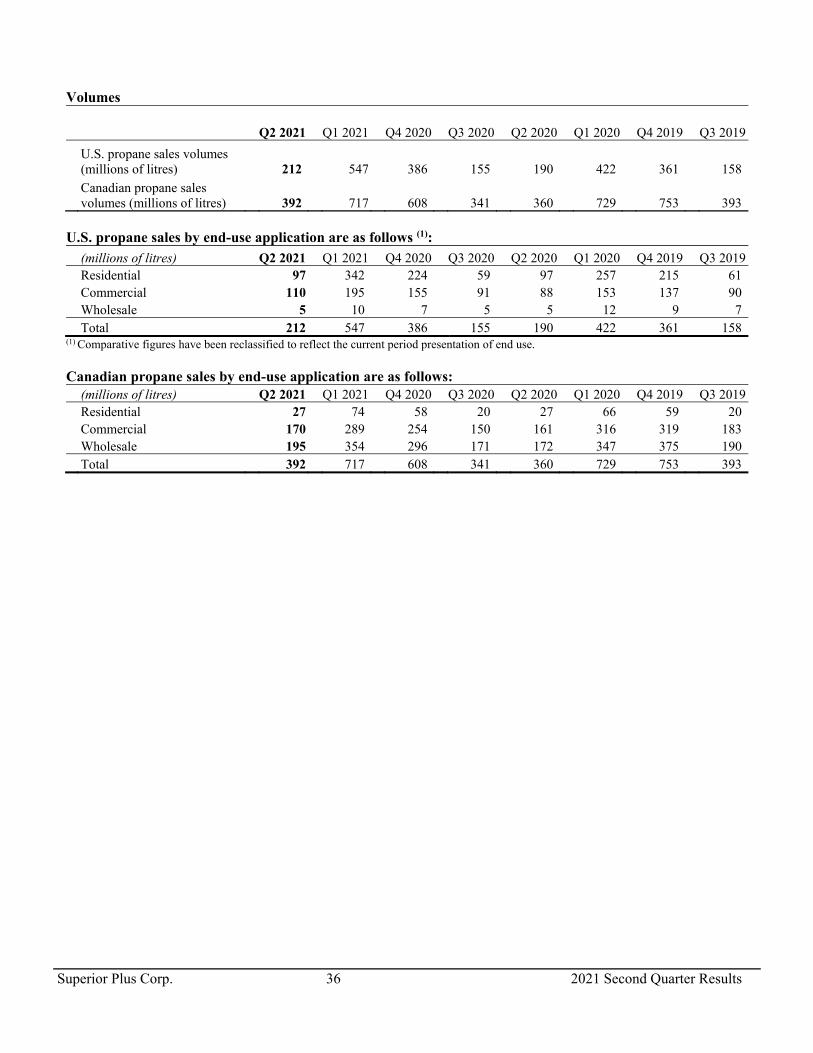
Superior Plus Corp. 36 2021 Second Quarter Results
Volumes
Q2 2021 Q1 2021 Q4 2020 Q3 2020 Q2 2020 Q1 2020 Q4 2019 Q3 2019
U.S. propane sales volumes (millions of litres) 212 547 386 155 190 422 361 158
Canadian propane sales volumes (millions of litres) 392 717 608 341 360 729 753 393
U.S. propane sales by end-use application are as follows (1):
(millions of litres) Q2 2021 Q1 2021 Q4 2020 Q3 2020 Q2 2020 Q1 2020 Q4 2019 Q3 2019 Residential 97 342 224 59 97 257 215 61 Commercial 110 195 155 91 88 153 137 90 Wholesale 5 10 7 5 5 12 9 7 Total 212 547 386 155 190 422 361 158 (1) Comparative figures have been reclassified to reflect the current period presentation of end use. Canadian propane sales by end-use application are as follows: (millions of litres) Q2 2021 Q1 2021 Q4 2020 Q3 2020 Q2 2020 Q1 2020 Q4 2019 Q3 2019 Residential 27 74 58 20 27 66 59 20 Commercial 170 289 254 150 161 316 319 183 Wholesale 195 354 296 171 172 347 375 190 Total 392 717 608 341 360 729 753 393
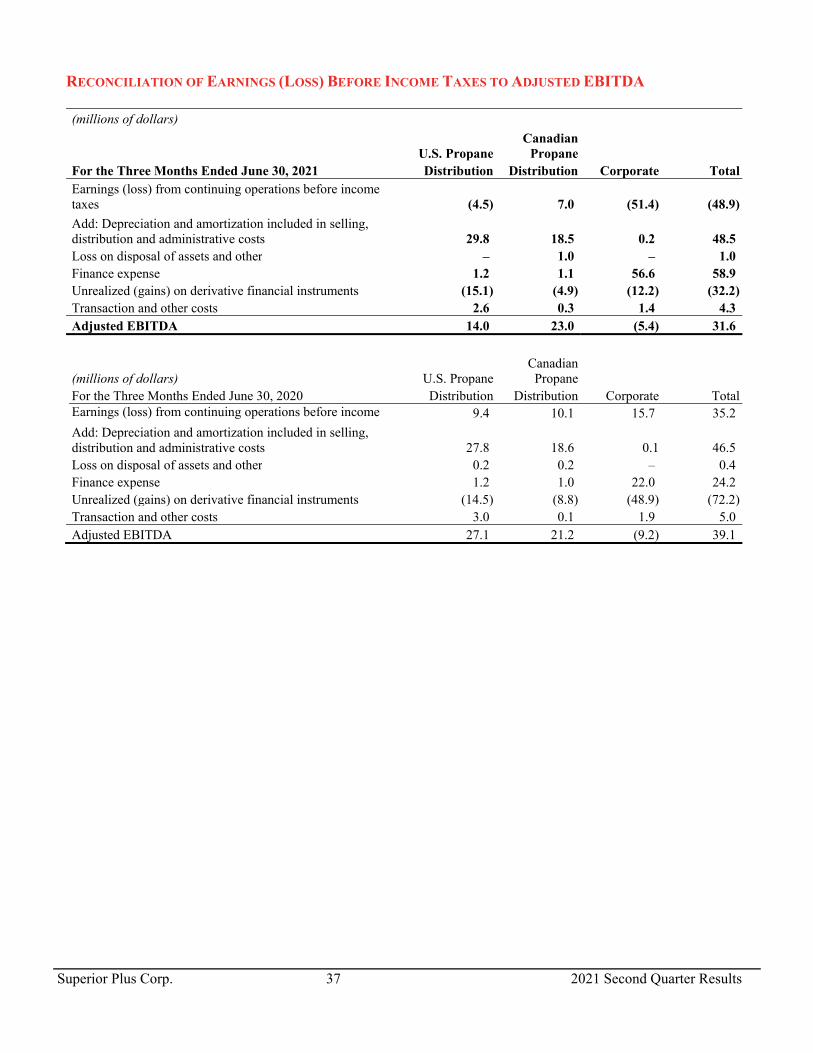
Superior Plus Corp. 37 2021 Second Quarter Results
RECONCILIATION OF EARNINGS (LOSS) BEFORE INCOME TAXES TO ADJUSTED EBITDA (millions of dollars)
U.S. Propane Canadian
Propane For the Three Months Ended June 30, 2021 Distribution Distribution Corporate Total
Earnings (loss) from continuing operations before income taxes (4.5) 7.0 (51.4) (48.9)
Add: Depreciation and amortization included in selling, distribution and administrative costs 29.8 18.5 0.2 48.5
Loss on disposal of assets and other – 1.0 – 1.0 Finance expense 1.2 1.1 56.6 58.9 Unrealized (gains) on derivative financial instruments (15.1) (4.9) (12.2) (32.2) Transaction and other costs 2.6 0.3 1.4 4.3 Adjusted EBITDA 14.0 23.0 (5.4) 31.6
(millions of dollars) U.S. Propane Canadian
Propane For the Three Months Ended June 30, 2020 Distribution Distribution Corporate Total Earnings (loss) from continuing operations before income 9.4 10.1 15.7 35.2
Add: Depreciation and amortization included in selling, distribution and administrative costs 27.8 18.6 0.1 46.5
Loss on disposal of assets and other 0.2 0.2 – 0.4 Finance expense 1.2 1.0 22.0 24.2 Unrealized (gains) on derivative financial instruments (14.5) (8.8) (48.9) (72.2) Transaction and other costs 3.0 0.1 1.9 5.0 Adjusted EBITDA 27.1 21.2 (9.2) 39.1
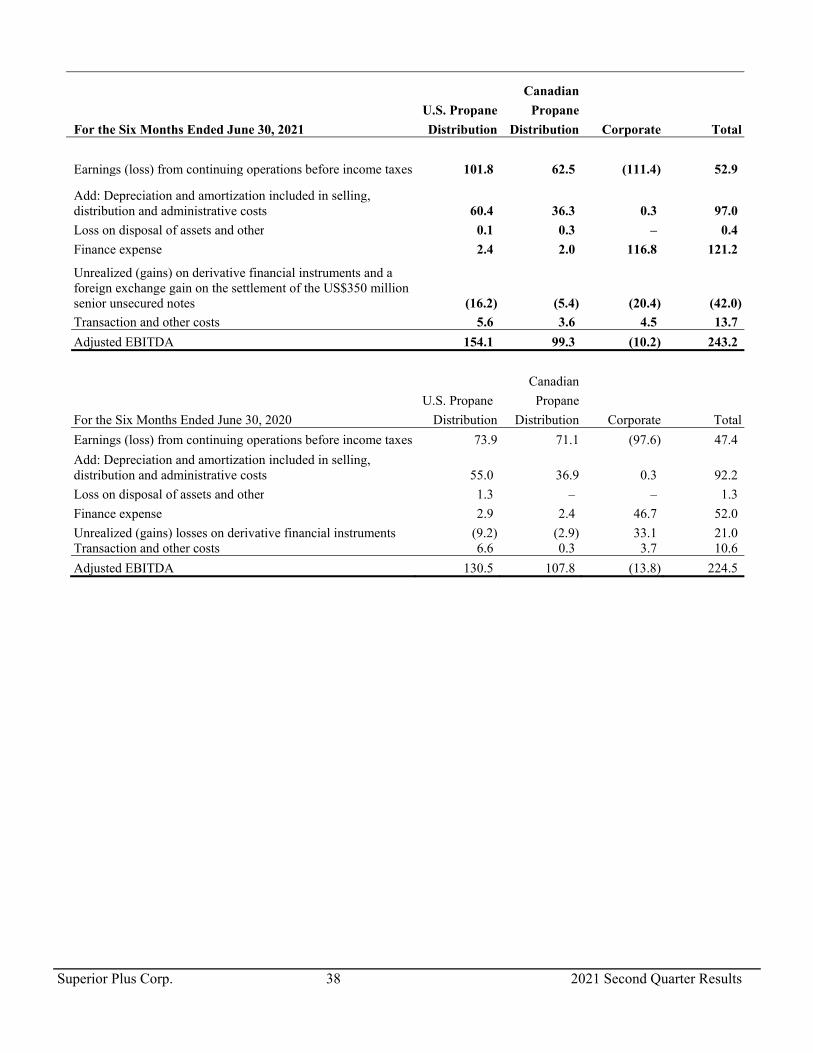
Superior Plus Corp. 38 2021 Second Quarter Results
Canadian
U.S. Propane Propane
For the Six Months Ended June 30, 2021 Distribution Distribution Corporate Total
Earnings (loss) from continuing operations before income taxes 101.8 62.5 (111.4) 52.9
Add: Depreciation and amortization included in selling, distribution and administrative costs 60.4 36.3 0.3 97.0
Loss on disposal of assets and other 0.1 0.3 – 0.4
Finance expense 2.4 2.0 116.8 121.2
Unrealized (gains) on derivative financial instruments and a foreign exchange gain on the settlement of the US$350 million senior unsecured notes (16.2) (5.4) (20.4) (42.0)
Transaction and other costs 5.6 3.6 4.5 13.7
Adjusted EBITDA 154.1 99.3 (10.2) 243.2
Canadian
U.S. Propane Propane
For the Six Months Ended June 30, 2020 Distribution Distribution Corporate Total
Earnings (loss) from continuing operations before income taxes 73.9 71.1 (97.6) 47.4
Add: Depreciation and amortization included in selling, distribution and administrative costs 55.0 36.9 0.3 92.2
Loss on disposal of assets and other 1.3 – – 1.3
Finance expense 2.9 2.4 46.7 52.0
Unrealized (gains) losses on derivative financial instruments (9.2) (2.9) 33.1 21.0 Transaction and other costs 6.6 0.3 3.7 10.6
Adjusted EBITDA 130.5 107.8 (13.8) 224.5
Superior Plus Corp. 39 2021 Second Quarter Results
RISK FACTORS TO SUPERIOR The risks factors and uncertainties detailed below are a summary of Superior’s assessment of its material risk factors as detailed in Superior’s most recent Annual Information Form (“AIF”) under “Risks associated with our business” which is filed on the Canadian Securities Administrators’ website, www.sedar.com, and on Superior’s website, www.superiorplus.com. The AIF describes some of the most material risks to Superior’s business by type of risk: financial; strategic; operational; and legal. General risks to Superior are as follow: Catastrophic Events, Natural Disasters, Severe Weather and Disease Superior may be negatively impacted to varying degrees by a number of events which are beyond our control, including cyber-attacks, unauthorized access, energy blackouts, pandemics, terrorist attacks, acts of war, earthquakes, hurricanes, tornados, fires, floods, ice storms or other natural or manmade catastrophes. While we engage in emergency preparedness, including business continuity planning, to mitigate risks, such events can evolve very rapidly and their impacts can be difficult to predict. As such, there can be no assurance that in the event of such a catastrophe that our operations and ability to carry on business will not be disrupted. The occurrence of such events may not release us from performing our obligations to third parties. A catastrophic event, including an outbreak of infectious disease, a pandemic or a similar health threat, such as the evolving 2019 Novel Coronavirus outbreak, or fear of any of the foregoing, could adversely impact us by causing operating or supply chain delays and disruptions, labour shortages, expansion project delays and facility shutdowns which could have a negative impact on our ability to conduct our business and increase our costs. In addition, liquidity and volatility, credit availability and market and financial conditions generally could change at any time as a result. Any of these events in isolation or in combination, could have a material negative impact on our financial condition, operating results and cash flows. Cash Dividends to Shareholders are Dependent on the Performance of Superior LP Superior depends entirely on the operations and assets of Superior LP. Superior’s ability to make dividend payments to its shareholders depends on Superior LP’s ability to make distributions on its outstanding limited partnership units, as well as on the operations and business of Superior LP. There is no assurance regarding the amount of cash to be distributed by Superior LP or generated by Superior LP and, therefore, there is no assurance regarding funds available for dividends to shareholders. The amount distributed in respect of the limited partnership units will depend on a variety of factors including, without limitation, the performance of Superior LP’s operating businesses, the effect of acquisitions or dispositions on Superior LP, and other factors that may be beyond the control of Superior LP or Superior. In the event significant sustaining capital expenditures are required by Superior LP or the profitability of Superior LP declines, there would be a decrease in the amount of cash available for dividends to shareholders and such decrease could be material. Superior’s dividend policy and the distribution policy of Superior LP are subject to change at the discretion of the Board of Directors of Superior or the Board of Directors of Superior General Partner Inc., the general partner of Superior LP, as applicable. Superior’s dividend policy and the distribution policy of Superior LP are also limited by contractual agreements including agreements with lenders to Superior and its affiliates and by restrictions under corporate law. Additional Shares In the event the Board of Directors of Superior decides to issue additional common shares, preferred shares or securities convertible into common shares, existing shareholders may suffer significant dilution. Access to Capital The credit facilities and U.S. notes of Superior LP contain covenants that require Superior LP to meet certain financial tests and that restrict, among other things, the ability of Superior LP to incur additional debt, dispose of assets or pay dividends/distributions in certain circumstances. These restrictions may preclude Superior LP from returning capital or making distributions on the limited partnership units.
Superior Plus Corp. 40 2021 Second Quarter Results
The payout by Superior LP of substantially all of its available cash flow means that capital expenditures to fund growth opportunities can only be made in the event that other sources of financing are available. Lack of access to such additional financing could limit the future growth of the business of Superior LP and, over time, have a material adverse effect on the amount of cash available for dividends to shareholders. To the extent that external sources of capital, including public and private markets, become limited or unavailable, Superior’s and Superior LP’s ability to make the necessary capital investments to maintain or expand the current business and to make necessary principal payments and debenture redemptions under its term credit facilities may be impaired. Interest Rates Superior maintains floating interest rate exposure through a combination of floating interest rate borrowing and uses derivative instruments at times, to mitigate this risk. Demand for a significant portion of Propane Distribution’s sales are affected by general economic trends. Generally speaking, when the economy is strong, interest rates increase, as does demand from Superior’s customers, thereby increasing Superior’s sales and its ability to pay higher interest costs. The opposite is also true. In this way, there is a common relationship among economic activity levels, interest rates and Superior’s ability to pay higher or lower rates. Increased interest rates will, however, affect Superior’s borrowing costs, which will have an adverse effect. Foreign Exchange Risk A portion of Superior’s net cash flow is denominated in U.S. dollars. Accordingly, fluctuations in the Canadian/U.S. dollar exchange rate can impact profitability. Superior attempts to mitigate this risk with derivative financial instruments. Changes in Legislation and Expected Tax Profile There can be no assurance that income tax laws, rules or associated regulations applicable to Superior, given the number of jurisdictions in which Superior operates, will not be changed, interpreted or administered in a manner which adversely affects Superior and its shareholders. In addition, there can be no assurance that the CRA (or a provincial tax agency), the U.S. Internal Revenue Service (or a state or local tax agency), the Chilean Internal Revenue Service or the Luxembourg Tax Authorities (collectively, the “tax agencies”) will agree with how Superior calculates its income for tax purposes or that these various tax agencies referenced herein will not change their administrative practices to the detriment of Superior or its shareholders. Acquisitions and Divestitures Superior may not be able to find or buy appropriate acquisition targets on economically acceptable terms. Superior’s acquisition agreements will contain certain representations, warranties and indemnities from the respective vendors subject to certain applicable limitations and thresholds and Superior will conduct due diligence prior to completion of such acquisitions. If, however such representations and warranties are inaccurate or limited in applicability or if any liabilities that are discovered exceed such limits or are not covered by the representations, warranties or indemnities, or the applicable vendors default in their obligations or if certain liabilities are not identified in such agreements, Superior could become liable for any such liabilities which may have an adverse effect on Superior. In addition, there may be liabilities or risks that were not discovered in such due diligence investigations which could have an adverse effect on Superior. Acquiring complementary businesses is required to optimally execute Superior’s business strategy. Distribution systems, technologies, key personnel or businesses of companies Superior acquires may not be effectively assimilated into its business, or its alliances may not be successful. There is also no assurance regarding the completion of a planned acquisition as Superior may be unable to obtain shareholder approval for a planned acquisition or Superior may be unable to obtain government and regulatory approvals required for a planned acquisition, or required government and/or regulatory approvals may result in delays. There may be penalties associated with not completing a planned acquisition. Superior may not be able to successfully complete certain divestitures on satisfactory terms, if at all. Divestitures may reduce Superior’s total revenue and net earnings by more than the sales price. The terms and

Superior Plus Corp. 41 2021 Second Quarter Results
conditions, representations, warranties and indemnities, if any, associated with divestiture activity may hold future risks. As part of the terms of the Specialty Chemical divestiture, a Vendor Note of $125 million was issued by the buyer. Its principal amount and accrued and unpaid interest are due October 2026. The collectability of the amounts owed to Superior is subject to the going concern of the buyer. As of June 30, 2021, Superior does not have any concerns about the financial strength of the buyer. Superior will continuously monitor the credit risk associated with this Vendor Note. Based on the current valuation, Superior has estimated a liability of $1.4 million related to the contingent consideration included in the divestiture. The fair value has been calculated based on an estimate of the EBITDA during the thirty-six-months subsequent to the divestiture. This estimate is subject to change and will be updated as new information becomes available. Information Technology and Cyber Security Superior utilizes a number of information technology systems for the management of its business and the operation of its facilities. The reliability and security of these systems is critical. If the function of these systems is interrupted or fails and cannot be restored quickly, or if the technologies are no longer supported, Superior’s ability to operate its facilities and conduct its business could be compromised. Superior has continued to mature its approach to technology planning. Superior continually assesses and monitors its cyber security risk. In an effort to mitigate such risks, Superior has employed a fully managed third party cyber security service that deploys industry leading technology, conducted comprehensive employee training and utilizes monitoring software to protect its systems. Although the technology systems Superior utilizes are intended to be secure and Superior has employed various methods to mitigate cyber risks, there is still a risk that an unauthorized third party could access the systems. Such a security breach could lead to a number of adverse consequences, including but not limited to, the unavailability, disruption or loss of key function within Superior’s control systems and the unauthorized disclosure, corruption or loss of sensitive company, customer or personal information. Superior attempts to prevent such breaches through the implementation of various technology security measures, segregation of control systems from its general business network, engaging skilled consultants and employees to manage Superior’s technology applications, conducting periodic audits and adopting policies and procedures as appropriate. To date, Superior has not been subject to a cyber-security breach that has resulted in a material impact on its business or operations; there is no guarantee, however, that the measures it takes to protect its business systems and operational control systems will be effective in protecting against a breach in the future. Competition Propane is sold in competition with other energy sources such as natural gas, electricity and fuel oil, some of which are less costly on an energy-equivalent basis. While propane is usually more cost-effective than electricity, electricity is a major competitor in most areas. Fuel oil is also used as a residential, commercial and industrial source of heat and, in general, is less costly on an equivalent-energy basis, although operating efficiencies, environmental and air quality factors help make propane competitive with fuel oil. Except for certain industrial and commercial applications, propane is generally not competitive with natural gas in areas with natural gas service. Other alternative energy sources such as compressed natural gas, methanol and ethanol are available or could be further developed and could have an impact on the future of the propane industry in general and Canadian propane distribution in particular. The trend towards increased conservation measures and technological advances in energy efficiency may have a detrimental effect on propane demand and Canadian Propane Distribution’s sales. Increases in the cost of propane encourage customers to reduce fuel consumption and to invest in more energy efficient equipment, reducing demand. Propane commodity prices are affected by crude oil and natural gas commodity prices. Automotive propane demand depends on propane pricing, the market’s acceptance of propane conversion options and the availability of infrastructure. Superior Propane has strategic partnerships with companies focused on after-market conversion technologies. This segment has been impacted by the development of more fuel efficient and complicated engines which increase the cost of converting engines to propane and reduce the savings per kilometre driven.
Superior Plus Corp. 42 2021 Second Quarter Results
Competition in the U.S. propane distribution business’ markets generally occurs on a local basis between large, full-service, national marketers and smaller, independent local marketers. Marketers primarily compete based on price and service and tend to operate in close proximity to customers, typically within a 60-kilometer marketing radius from a central depot, in order to minimize delivery costs and provide prompt service. Volume Variability, Weather Conditions and Economic Demand Weather, general economic conditions and the volatility in the cost of propane affect propane market volumes. Weather influences the demand for propane, primarily for home and facility heating uses and also for agricultural applications, such as crop drying. Harsh weather can create conditions that exacerbate demand for propane, impede the transportation and delivery of propane, or restrict the ability of Superior to obtain propane from its suppliers. Such conditions may also increase Superior’s operating costs and may reduce customers demand for propane, any of which may have an adverse effect on Superior. Conversely, low prices tend to make customers less price sensitive and less focused on their consumption volume. Spikes in demand caused by weather or other factors can stress the supply chain and hamper Superior’s ability to obtain additional quantities of propane. Transportation providers (railways and trucking companies) have limited ability to provide resources in times of extreme peak demand. Changes in propane supply costs are normally passed through to customers, but timing lags (between when Superior purchases the propane and when the customer purchases the propane) may result in positive or negative gross margin fluctuations. For U.S. propane distribution, demand from end-use heating applications is predictable. Weather and general economic conditions, however, affect distillates and propane market volumes. Weather influences the immediate demand, primarily for heating, while longer-term demand declines due to economic conditions as customer’s trend towards conservation and supplement heating with alternative sources such as electricity and to a lesser extent wood pellets and solar energy. Demand, Supply and Pricing Superior offers its customers various fixed-price propane and heating oil programs. In order to mitigate the price risk from offering these services, Superior uses its physical inventory position, supplemented by forward commodity transactions with various third parties having terms and volumes substantially the same as its customer’s contracts. In periods of high propane price volatility, the fixed-price programs create exposure to over or under-supply positions as the demand from customers may significantly exceed or fall short of supply procured. In addition, if propane prices decline significantly subsequent to customers signing up for a fixed-price program, there is a risk that customers will default on their commitments. Current unit margins may not be sustainable if market conditions change significantly. Current Economic Conditions During the first quarter of 2020, the rapid outbreak of the novel strain of the coronavirus, specifically identified as the COVID-19 pandemic, caused governments worldwide to enact emergency measures and restrictions to combat the spread of the virus. These measures and restrictions, which include the implementation of travel bans, mandated and voluntary business closures, self-imposed and mandatory quarantine periods, isolation orders and social distancing, have caused material disruption to businesses globally resulting in an economic slowdown. Governments and central banks have reacted with significant monetary and fiscal interventions designed to stabilize economic conditions. Superior monitors applicable government relief programs to determine if Superior qualifies to participate in them. Superior continues to apply for the Canadian Emergency Wage Subsidy (“CEWS”) program wherein Superior is allowed to recover a portion of eligible employee costs incurred. The Government of Canada continues to make amendments to the CEWS program and Superior may be eligible for future applications and claims.
Superior Plus Corp. 43 2021 Second Quarter Results
COVID-19 has also resulted in a significant decrease on global demand for crude oil. In addition to the impact of COVID-19, production levels during March and April of 2020 by OPEC+ countries, contributed to excess global supply and caused the price of oil to be exceptionally volatile. Propane is a derivative of natural gas processing and oil refining, so continued volatility in the price of oil could lead to disruptions in the supply of propane if the production of oil and natural gas is further curtailed. In addition to the risk on the supply of propane, demand for Superior’s products from our customers in the oil and gas industry have been impacted as the combined impact of COVID-19 and volatile oil prices has had a significantly negative impact on the energy industry. U.S. propane inventories are currently below the three-year average. The future impact of these events on liquidity, volatility, credit availability and market and financial conditions generally, could change at any time. The duration and ultimate impact on the economy are unknown at this time, and, as a result, it is difficult to estimate the longer-term impact on our operations and the markets for our products. At the current time, we expect an impact to our business as it relates to our customers that operate in industries governments have classified as non-essential and customers required to operate at reduced capacities. During the quarter ended June 30, 2021, the impact of these events caused a decrease in sales volumes and sales prices for our Canadian Propane Distribution operating segment and to a lesser extent our U.S. Propane Distribution operating segment. Management has taken steps to reduce capital and selling, distribution and administrative costs to minimize the impact these events have had on our business. The impact of COVID-19 on the Canadian Propane Distribution segment has been lessened by the CEWS recorded. Superior’s operating segments provide essential services in all provinces, states and territories in which Superior operates. In response to COVID-19, and in-line with recommendations from local health authorities, enhanced operating procedures and protocols were instituted to protect our employees and customers and to maintain our sites and facilities to even higher levels of cleanliness. Management is continuing to monitor these situations and may be required to take further actions that may materially alter operations. Health, Safety and Environment Superior’s operations are subject to the risks associated with handling, storing and transporting propane in bulk. To mitigate risks, Superior has established a comprehensive environmental, health and safety protection program. It consists of an environmental policy, codes of practice, periodic self-audits, employee training, quarterly and annual reporting and emergency prevention and response. The U.S. propane distribution business, through a centralized safety and environment management system, ensures that safety practices and regulatory compliance are an important part of its business. The storage and delivery of refined fuels pose the risk of spills which could adversely affect the soil and water of storage facilities and customer properties. Superior’s fuel distribution businesses are based and operate in Canada and the United States and, as a result, such operations could be affected by changes to laws, rules or policies which could either be more favourable to competing energy sources or increase compliance costs or otherwise negatively affect the operations of Propane Distribution in comparison with such competing energy sources. Any such changes could have an adverse effect on the operations of Propane Distribution. Employee and Labour Relations Approximately 2% of the U.S. propane distribution business employees and 19% of Superior’s Canadian propane distribution business employees are unionized. Collective bargaining agreements are renegotiated in the normal course of business. While labour disruptions are not expected, there is always risk associated with the renegotiation process that could have an adverse impact on Superior.
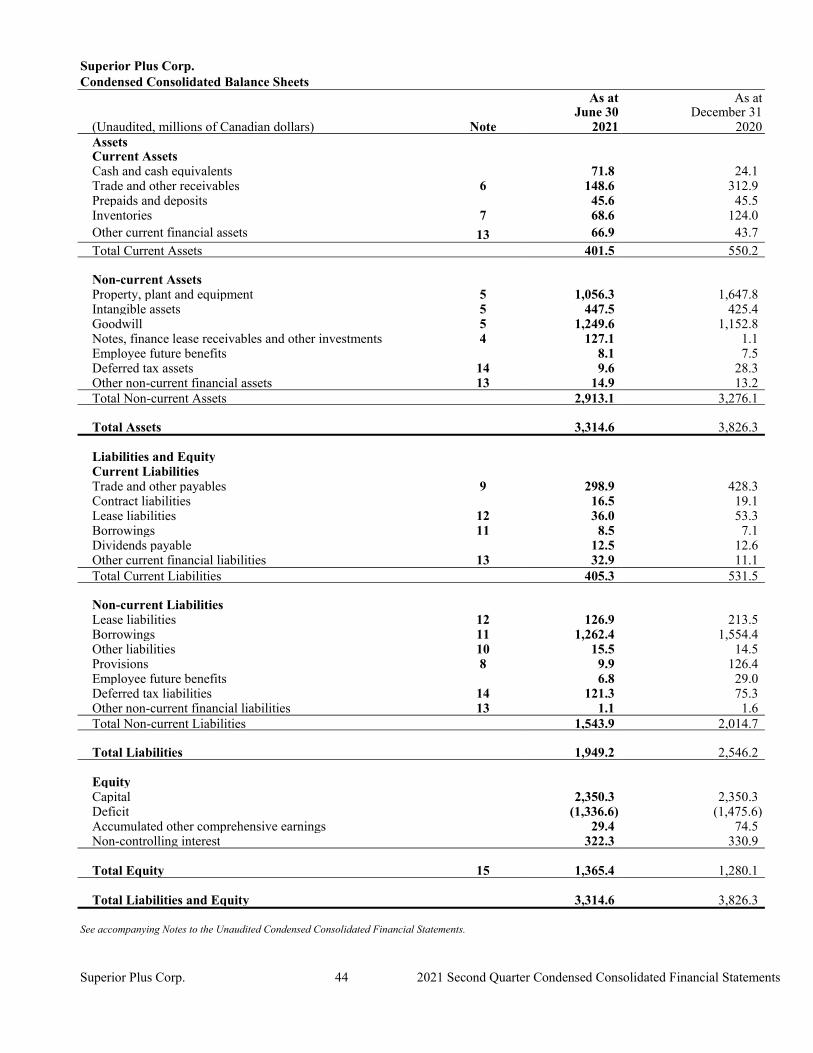
Superior Plus Corp. 44 2021 Second Quarter Condensed Consolidated Financial Statements
Superior Plus Corp. Condensed Consolidated Balance Sheets As at As at June 30 December 31 (Unaudited, millions of Canadian dollars) Note 2021 2020 Assets Current Assets Cash and cash equivalents 71.8 24.1 Trade and other receivables 6 148.6 312.9 Prepaids and deposits 45.6 45.5 Inventories 7 68.6 124.0
Other current financial assets 13 66.9 43.7 Total Current Assets 401.5 550.2 Non-current Assets Property, plant and equipment 5 1,056.3 1,647.8 Intangible assets 5 447.5 425.4 Goodwill 5 1,249.6 1,152.8 Notes, finance lease receivables and other investments 4 127.1 1.1 Employee future benefits 8.1 7.5 Deferred tax assets 14 9.6 28.3 Other non-current financial assets 13 14.9 13.2 Total Non-current Assets 2,913.1 3,276.1 Total Assets 3,314.6 3,826.3 Liabilities and Equity Current Liabilities Trade and other payables 9 298.9 428.3 Contract liabilities 16.5 19.1 Lease liabilities 12 36.0 53.3 Borrowings 11 8.5 7.1 Dividends payable 12.5 12.6 Other current financial liabilities 13 32.9 11.1 Total Current Liabilities 405.3 531.5 Non-current Liabilities Lease liabilities 12 126.9 213.5 Borrowings 11 1,262.4 1,554.4 Other liabilities 10 15.5 14.5 Provisions 8 9.9 126.4 Employee future benefits 6.8 29.0 Deferred tax liabilities 14 121.3 75.3 Other non-current financial liabilities 13 1.1 1.6 Total Non-current Liabilities 1,543.9 2,014.7 Total Liabilities 1,949.2 2,546.2 Equity Capital 2,350.3 2,350.3 Deficit (1,336.6) (1,475.6) Accumulated other comprehensive earnings 29.4 74.5 Non-controlling interest 322.3 330.9 Total Equity 15 1,365.4 1,280.1 Total Liabilities and Equity 3,314.6 3,826.3 See accompanying Notes to the Unaudited Condensed Consolidated Financial Statements.
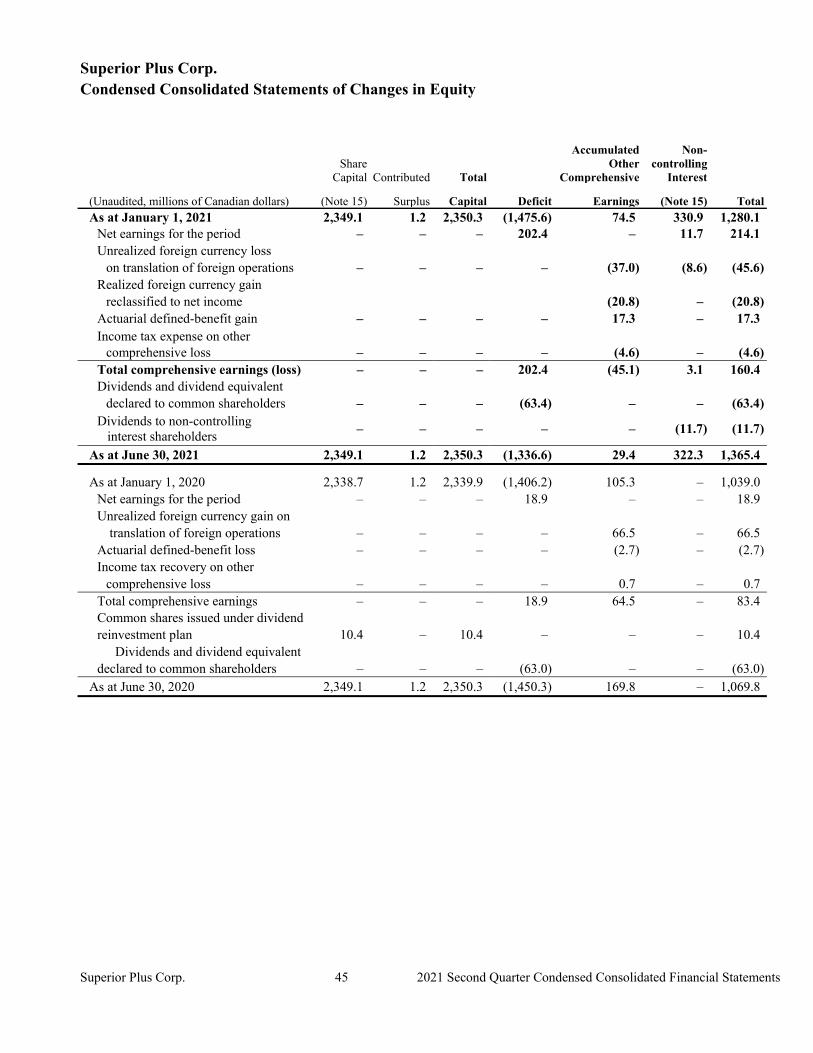
Superior Plus Corp. 45 2021 Second Quarter Condensed Consolidated Financial Statements
Superior Plus Corp. Condensed Consolidated Statements of Changes in Equity
Share
Capital Contributed Total
Accumulated Other
Comprehensive
Non-controlling
Interest
Total (Unaudited, millions of Canadian dollars) (Note 15) Surplus Capital Deficit Earnings (Note 15)
As at January 1, 2021 2,349.1 1.2 2,350.3 (1,475.6) 74.5 330.9 1,280.1 Net earnings for the period – – – 202.4 – 11.7 214.1 Unrealized foreign currency loss on translation of foreign operations – – – – (37.0) (8.6) (45.6) Realized foreign currency gain reclassified to net income (20.8) – (20.8) Actuarial defined-benefit gain – – – – 17.3 – 17.3 Income tax expense on other comprehensive loss – – – – (4.6) – (4.6) Total comprehensive earnings (loss) – – – 202.4 (45.1) 3.1 160.4 Dividends and dividend equivalent declared to common shareholders – – – (63.4) – – (63.4)
Dividends to non-controlling interest shareholders
– – – – – (11.7) (11.7)
As at June 30, 2021 2,349.1 1.2 2,350.3 (1,336.6) 29.4 322.3 1,365.4
As at January 1, 2020 2,338.7 1.2 2,339.9 (1,406.2) 105.3 – 1,039.0 Net earnings for the period – – – 18.9 – – 18.9 Unrealized foreign currency gain on translation of foreign operations – – – – 66.5 – 66.5 Actuarial defined-benefit loss – – – – (2.7) – (2.7) Income tax recovery on other comprehensive loss – – – – 0.7 – 0.7 Total comprehensive earnings – – – 18.9 64.5 – 83.4 Common shares issued under dividend reinvestment plan 10.4 – 10.4 – – – 10.4 Dividends and dividend equivalent declared to common shareholders – – – (63.0) – – (63.0)
As at June 30, 2020 2,349.1 1.2 2,350.3 (1,450.3) 169.8 – 1,069.8
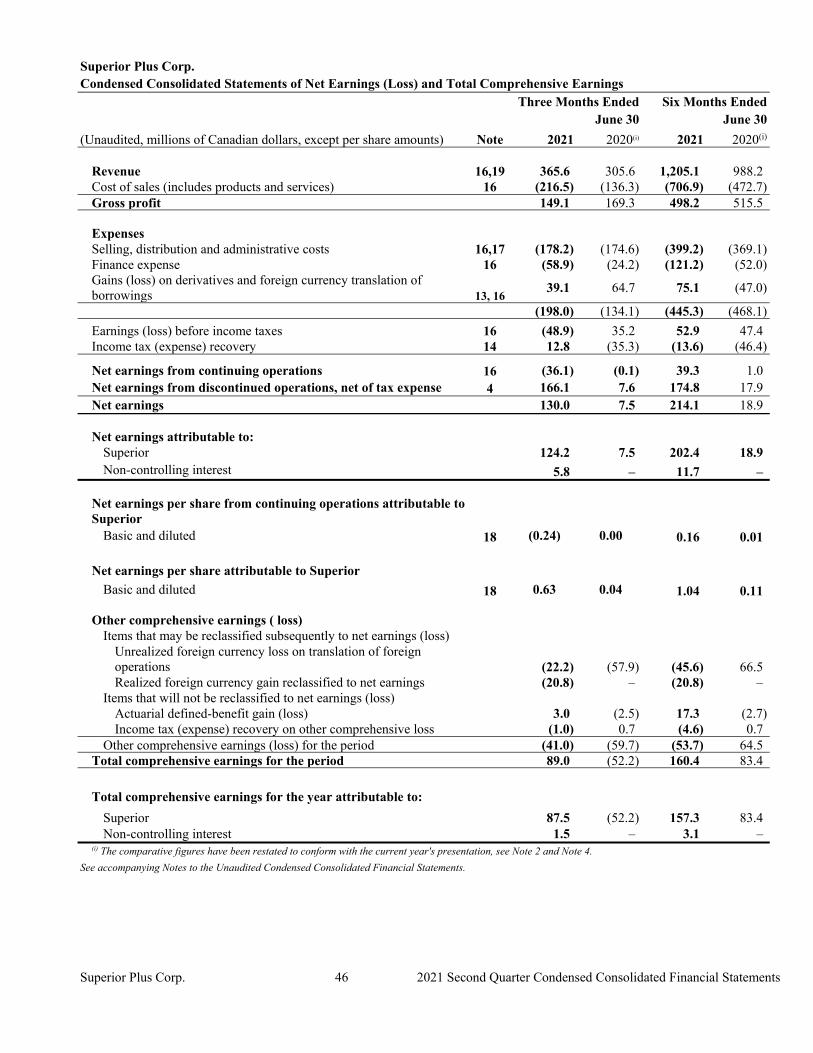
Superior Plus Corp. 46 2021 Second Quarter Condensed Consolidated Financial Statements
Superior Plus Corp. Condensed Consolidated Statements of Net Earnings (Loss) and Total Comprehensive Earnings Three Months Ended Six Months Ended
June 30 June 30
(Unaudited, millions of Canadian dollars, except per share amounts) Note 2021 2020(i) 2021 2020(i) Revenue 16,19 365.6 305.6 1,205.1 988.2 Cost of sales (includes products and services) 16 (216.5) (136.3) (706.9) (472.7) Gross profit 149.1 169.3 498.2 515.5 Expenses Selling, distribution and administrative costs 16,17 (178.2) (174.6) (399.2) (369.1) Finance expense 16 (58.9) (24.2) (121.2) (52.0)
Gains (loss) on derivatives and foreign currency translation of borrowings 13, 16
39.1 64.7 75.1 (47.0)
(198.0) (134.1) (445.3) (468.1)
Earnings (loss) before income taxes 16 (48.9) 35.2 52.9 47.4 Income tax (expense) recovery 14 12.8 (35.3) (13.6) (46.4)
Net earnings from continuing operations 16 (36.1) (0.1) 39.3 1.0 Net earnings from discontinued operations, net of tax expense 4 166.1 7.6 174.8 17.9 Net earnings 130.0 7.5 214.1 18.9 Net earnings attributable to: Superior 124.2 7.5 202.4 18.9 Non-controlling interest 5.8 – 11.7 –
Net earnings per share from continuing operations attributable to Superior
Basic and diluted 18 (0.24) 0.00 0.16 0.01
Net earnings per share attributable to Superior
Basic and diluted 18 0.63 0.04 1.04 0.11 Other comprehensive earnings ( loss) Items that may be reclassified subsequently to net earnings (loss)
Unrealized foreign currency loss on translation of foreign operations
(22.2) (57.9) (45.6) 66.5
Realized foreign currency gain reclassified to net earnings (20.8) – (20.8) – Items that will not be reclassified to net earnings (loss) Actuarial defined-benefit gain (loss) 3.0 (2.5) 17.3 (2.7) Income tax (expense) recovery on other comprehensive loss (1.0) 0.7 (4.6) 0.7 Other comprehensive earnings (loss) for the period (41.0) (59.7) (53.7) 64.5 Total comprehensive earnings for the period 89.0 (52.2) 160.4 83.4
Total comprehensive earnings for the year attributable to:
Superior 87.5 (52.2) 157.3 83.4 Non-controlling interest 1.5 – 3.1 – (i) The comparative figures have been restated to conform with the current year's presentation, see Note 2 and Note 4.
See accompanying Notes to the Unaudited Condensed Consolidated Financial Statements.

Superior Plus Corp. 47 2021 Second Quarter Condensed Consolidated Financial Statements
Superior Plus Corp. Condensed Consolidated Statements of Cash Flows Three Months Ended Six Months Ended June 30 June 30 (Unaudited, millions of Canadian dollars) Note 2021 2020(i) 2021 2020(i) OPERATING ACTIVITIES Net earnings for the period 130.0 7.5 214.1 18.9 Adjustments for: Depreciation included in selling, distribution and administrative 28.8 28.9 58.0 54.9 Depreciation of right-of-use assets included in selling, administrative costs 3.6 4.0 7.3 7.8 Depreciation and amortization included in discontinued – 17.4 9.6 35.2 Amortization of intangible assets included in selling, distribution administrative costs 16.1 13.6 31.7 29.5
Loss (gain) on disposal of assets, impairments, and other non-cash items
1.5 0.4 0.4 1.3
Unrealized loss (gain) on financial and non-financial derivatives and foreign
exchange loss(gain) on US. Dollar debt and lease liabilities 13 (31.6) (74.1) (42.0) 23.4 Gain on disposal of discontinued operations 4 (228.7) – (228.7) – Finance expense recognized in net earnings 58.9 26.2 123.2 56.0 Income tax expense recognized in net earnings 14 55.3 38.8 85.0 49.7 Changes in non-cash operating working capital and other 20 95.3 137.8 52.6 54.0 Net cash flows from operating activities before income taxes and 129.2 200.5 311.2 330.7 Income taxes paid (5.5) (6.5) (13.5) (7.0) Interest paid (20.3) (6.4) (68.2) (51.3) Cash flows from operating activities 103.4 187.6 229.5 272.4 INVESTING ACTIVITIES Acquisitions, net of cash acquired 5 (207.3) – (242.0) (23.7) Purchase of property, plant and equipment and intangible assets 21 (19.2) (26.6) (42.2) (55.3) Proceeds on disposal of property, plant and equipment 0.1 1.9 2.0 6.3 Proceeds on divestiture 5 572.4 – 572.4 – Cash flows used in investing activities 346.0 (24.7) 290.2 (72.7) FINANCING ACTIVITIES Proceeds of revolving term bank credit facilities and other debt 156.7 541.1 798.0 1,084.5 Repayment of revolving term bank credit facilities and other debt (237.6) (687.4) (1,133.0) (1,230.7) Principal repayment of lease obligations (9.1) (13.2) (24.6) (25.2) Redemption of 7% senior unsecured debentures – – (472.3) – Redemption of 5.25% senior unsecured debentures (410.5) – (410.5) – Redemption of 5.125% senior unsecured debentures (384.2) – (384.2) – Issuance of 4.5% senior unsecured notes – – 753.7 – Issuance of 4.25% senior unsecured debenture 500.0 – 500.0 – Debt issue costs credit facility (1.6) – (1.6) – Debt issue costs 4.25% senior unsecured note (8.7) – (8.7) – Debt issue costs 4.5% senior unsecured note (2.0) – (13.3) – Proceeds from vehicle refinancing – 3.6 – 17.3 Dividends paid to shareholders (37.5) (24.0) (75.2) (52.5) Cash flows used in financing activities (434.5) (179.9) (471.7) (206.6)
Net increase in cash and cash equivalents from continuing operations
14.9 (17.0) 48.0 (6.9)
Cash and cash equivalents, beginning of the period 55.2 34.3 24.1 26.5 Effect of translation of foreign currency-denominated cash and cash 1.7 3.5 (0.3) 1.2 Cash and cash equivalents, end of the period 71.8 20.8 71.8 20.8 (i) The comparative figures have been restated to conform with the current year's presentation, see Note 2 and Note 4.
See accompanying Notes to the Unaudited Condensed Consolidated Financial Statements.
Superior Plus Corp. 48 2021 Second Quarter Condensed Consolidated Financial Statements
NOTES TO THE CONDENSED CONSOLIDATED FINANCIAL STATEMENTS (Unaudited, tabular amounts in millions of Canadian dollars, except per share amounts)
1. ORGANIZATION
Superior Plus Corp. (“Superior” or the “Company”) is a diversified business corporation, incorporated under the Canada Business Corporations Act. The registered office is located at Suite 401, 200 Wellington Street West, Toronto, Ontario. Superior’s investment in Superior Plus LP is financed by share capital. Superior is a publicly traded company with its common shares trading on the Toronto Stock Exchange under the exchange symbol SPB. These unaudited condensed consolidated financial statements were authorized for issue by the Board of Directors on August 11, 2021. Reportable Operating Segments Superior operates two reportable operating segments: Canadian Propane Distribution and United States (“U.S.”) Propane Distribution. The Canadian Propane Distribution segment includes the Canadian retail business and wholesale business with operations in Canada and California. The U.S. Propane Distribution segment distributes propane gas and liquid fuels along the Eastern U.S., and into the Midwest and California. In prior years, Superior included its Specialty Chemicals business as an operating segment however, this segment was divested on April 9, 2021 and its net earnings have been reported as a discontinued operation, see Note 4. References to Energy Distribution in the notes below refers to both Canadian Propane Distribution and U.S. Propane Distribution because of the inherent similarities of the businesses. 2. BASIS OF PRESENTATION (a) Preparation of Condensed Consolidated Financial Statements The accompanying unaudited condensed consolidated financial statements were prepared in accordance with International Accounting Standards (“IAS”) 34, Interim Financial Reporting, as issued by the International Accounting Standards Board (“IASB”) using accounting policies Superior adopted in its annual consolidated financial statements as at and for the year ended December 31, 2020, except for our policy on Interest Rate Benchmark Reform disclosed below. The unaudited condensed consolidated financial statements were prepared on a going concern basis. The unaudited condensed consolidated financial statements were prepared on the historical cost basis, except for the revaluation of certain financial instruments and incorporate the accounts of Superior and its subsidiaries. Subsidiaries are all entities over which Superior has the power to govern the financial and operating policies, generally accompanying a shareholding of more than one-half of the voting rights. The results of subsidiaries are included in Superior’s consolidated statements of net earnings and total comprehensive earnings from date of acquisition, or in the case of disposals, up to the effective date of disposal. Where Superior’s interest is less than 100 percent, the interest attributable to outside shareholders is reflected in non-controlling interest (“NCI”). A subsidiary of Superior has outstanding cumulative preference shares that are classified as equity and are held by non-controlling interest. Superior computes its share of net earnings after deducting for the dividend entitlement on these NCI on preference shares. The NCI is translated using exchange rates prevailing at the end of each reporting period with the foreign exchange translation included in other comprehensive earnings for the period. All transactions and balances between Superior and Superior’s subsidiaries are eliminated upon consolidation. The assets and liabilities of Superior’s foreign operations are translated using exchange rates prevailing at the end of
Superior Plus Corp. 49 2021 Second Quarter Condensed Consolidated Financial Statements
each reporting period. Income and expense items are translated at the average exchange rates for the period. Exchange differences are recognized in other comprehensive earnings for the period. If Superior loses control over a subsidiary, it derecognises the related assets (including goodwill), liabilities, non-controlling interest and other components of equity, while any resultant gain or loss is recognised in profit or loss. Any investment retained is recognised at fair value. (b) Reclassification of Comparative Figures
As a result of the transaction disclosed in Note 4, the net earnings of the Specialty Chemicals operating segment have been reported as a discontinued operation. Management has restated the comparative figures in the condensed consolidated statements of net earnings to conform to this presentation. (c) Significant Accounting Judgments, Estimates and Assumptions The preparation of Superior’s unaudited condensed consolidated financial statements in accordance with IFRS requires management to make judgments, estimates and assumptions that affect the reported amounts of assets, liabilities, revenue, expenses and related disclosure. The estimates and associated assumptions are based on historical experience and various other factors deemed reasonable under the circumstances, the results of which form the basis of making the judgments about carrying values of assets and liabilities that are not readily apparent from other sources. Actual results may differ from these estimates. The areas involving a higher degree of judgment or complexity, or where assumptions and estimates are significant to the consolidated financial statements are consistent with those disclosed in Superior’s 2020 annual consolidated financial statements with the exception of the contingent consideration related to the divestiture of the Specialty Chemicals business, see Note 4. COVID-19 The outbreak of the novel strain of the coronavirus in the first quarter of 2020, specifically identified as the COVID-19 pandemic, has caused governments worldwide to enact emergency measures to combat the spread of the virus. These measures, which include the implementation of travel bans, self-imposed quarantine periods and social distancing, have caused material disruption to businesses globally resulting in an economic slowdown. Global equity markets have experienced significant volatility and weakness. Governments and central banks have reacted with significant monetary and fiscal interventions designed to stabilize economic conditions. COVID-19 did not significantly impact the carrying values of the Company’s assets and liabilities as at June 30, 2021, except for the employee future benefits, property, plant and equipment and provisions in relation to the decommissioning costs that were affected by lower interest rates. At this time, given the continued uncertainty surrounding COVID-19, it is not possible to reliably estimate the full impact this will have on Superior’s financial position and operating results. Certain expenses were eligible under the Canadian Emergency Wage Subsidy (“CEWS”) program instituted by the Government of Canada. The CEWS program allowed Superior to recover a portion of eligible employee costs incurred, see Note 17. The Government of Canada continues to make amendments to the CEWS program and Superior may be eligible for future claims. Judgments, estimates and assumptions made by management during the preparation of these consolidated financial statements may also change as conditions related to COVID-19 change. Changes in assumptions including, but not limited to, foreign exchange rates, interest rates and commodity prices could impact the measurement of items including derivative and non-derivative instruments, allowance for doubtful accounts, provisions and employee future benefits. (d) Standards Issued But Not Yet Effective The new and amended standards and interpretations that are issued, but not yet effective, up to the date of issuance of the Company’s unaudited condensed consolidated financial statements are disclosed in the Company’s annual consolidated financial statements.
Superior Plus Corp. 50 2021 Second Quarter Condensed Consolidated Financial Statements
(e) Interest Rate Benchmark Reform Various interest rate and other indices that are deemed to be “benchmarks” (including LIBOR) are the subject of international regulatory guidance and proposals for reform. Regulators in various jurisdictions have pushed for the transition from Interbank Offered Rates (“IBORs”) to alternative benchmark rates (alternative rates), based upon risk free rates determined using actual market transactions. In March 2021, the Financial Conduct Authority and the ICE Benchmark Administration announced that US dollar one-week and two-month settings will stop being published after December 31, 2021 and all remaining US dollar LIBOR settings will stop being published after June 30, 2023. The transition from current reference rates to alternative rates may adversely affect the value of contracts linked to existing benchmarks. These developments may cause some LIBOR and other benchmarks to be discontinued. Superior is monitoring these developments and the impact this may have on our LIBOR based borrowings. The IASB addressed interest rate benchmark reform and its effects on financial reporting in two phases. The first phase focuses on issues affecting financial reporting in the period before the interest rate benchmark reform, while the second phase focuses on the issues that affect financial reporting once the existing rate is replaced with an alternative rate. In September 2019, the IASB finalized the first phase through the issuance of “Interest Rate Benchmark Reform: Amendments to IFRS 9, IAS 39 and IFRS 7”. This did not have any impact on Superior. In August 2020, the IASB finalized the second phase through the issuance of “Interest Rate Benchmark Reform: Phase 2 Amendments to IFRS 9, IAS 39, IFRS 7, IFRS 4 and IFRS 16” (Phase 2 amendments), which addresses the issues that affect financial reporting once the existing rate is replaced with an alternative rate. The Phase 2 amendments are effective and have been adopted on January 1, 2021. For financial instruments measured using amortized cost measurement, changes to the basis for determining the contractual cash flows required by interest rate benchmark reform are reflected by adjusting their effective interest rate. No immediate gain or loss is recognized. For lease liabilities where there is a change to the basis for determining the contractual cash flows, as a practical expedient the lease liability is remeasured by discounting the revised lease payments using a discount rate that reflects the change in the interest rate where the change is required by IBOR reform. These expedients are only applicable to changes that are required by interest rate benchmark reform when made on an economically equivalent basis. Superior does not expect changes related to interest rate benchmark reform to have a material impact to Superior’s results. Superior’s exposure is limited to borrowings with a variable interest rate, see Note 11 of the unaudited condensed consolidated financial statements as at June 30, 2021. 3. SEASONALITY OF OPERATIONS Sales typically peak in the first quarter when approximately one-third of annual propane and other refined fuels sales volumes and gross profits are generated due to the demand of heating from end-use customers. They then decline through the second and third quarters, rising seasonally again in the fourth quarter with heating demand. Similarly, net working capital is typically at seasonal highs during the first and fourth quarters, and normally declines to seasonal lows in the second and third quarters. Net working capital is also significantly influenced by wholesale propane prices and other refined fuels. For the 12 months ended June 30, 2021, Superior reported gross profit of $896.4 million (June 30, 2020 ̶ $965.0 million) and net earnings (loss) of $95.6 million (June 30, 2020 ̶ ($11.8) million) from continuing operations.
Superior Plus Corp. 51 2021 Second Quarter Condensed Consolidated Financial Statements
4. DISCONTINUED OPERATIONS On April 9, 2021, Superior completed the previously announced sale of its Specialty Chemicals business for total consideration of $725.0 million (the “Transaction”). Superior received $600 million in cash proceeds, less an initial working capital adjustment of $17.0 million and a $125 million in the form of a 6% unsecured note (“Vendor Note”). The principal amount of the Vendor Note and accrued and unpaid interest are due October 9, 2026. The purchase price is subject to adjustment based on the average EBITDA of the business for the three consecutive twelve-month periods following the closing date. If the average EBITDA, adjusted to remove the impact of IFRS 16, is higher than $115 million the purchase price will be increased by multiplying the difference by 4.5 and the buyer will issue an additional note to Superior, up to a maximum of $100 million which includes accumulated interest. The note will bear interest at the same rate as the Vendor Note and interest will accrue from the closing date. If the average EBITDA, adjusted to remove the impact of IFRS 16, is lower than $100 million, the purchase price will be decreased by multiplying the difference by 4.5 and a note will be issued by the seller up to a maximum of $100 million which includes accumulated interest. The note will bear interest at the same rate as the Vendor Note and interest will accrue from the closing date. The fair value of the contingent consideration at April 9, 2021 was estimated to be a liability of $1.4 million and has been included in costs to sell and on the balance sheet as part of other non-current financial liabilities. Changes in the fair value of the contingent consideration are recorded in the consolidated statements of net earnings as part of gains (loss) on derivatives and foreign currency translation of borrowings. Interest earned on the vendor note is recorded net of finance expense, see Note 16. There was no change in the estimated fair value from the date of acquisition to June 30, 2021. The Transaction included all assets and liabilities Superior held in its Specialty Chemical operating segment. Management has presented the results of the Specialty Chemicals operating segment a as a discontinued operation and no longer presents these results in the Reportable Segment Information note. The consideration received exceeded the carrying amount of the net assets and therefore, no impairment was required to be recorded.
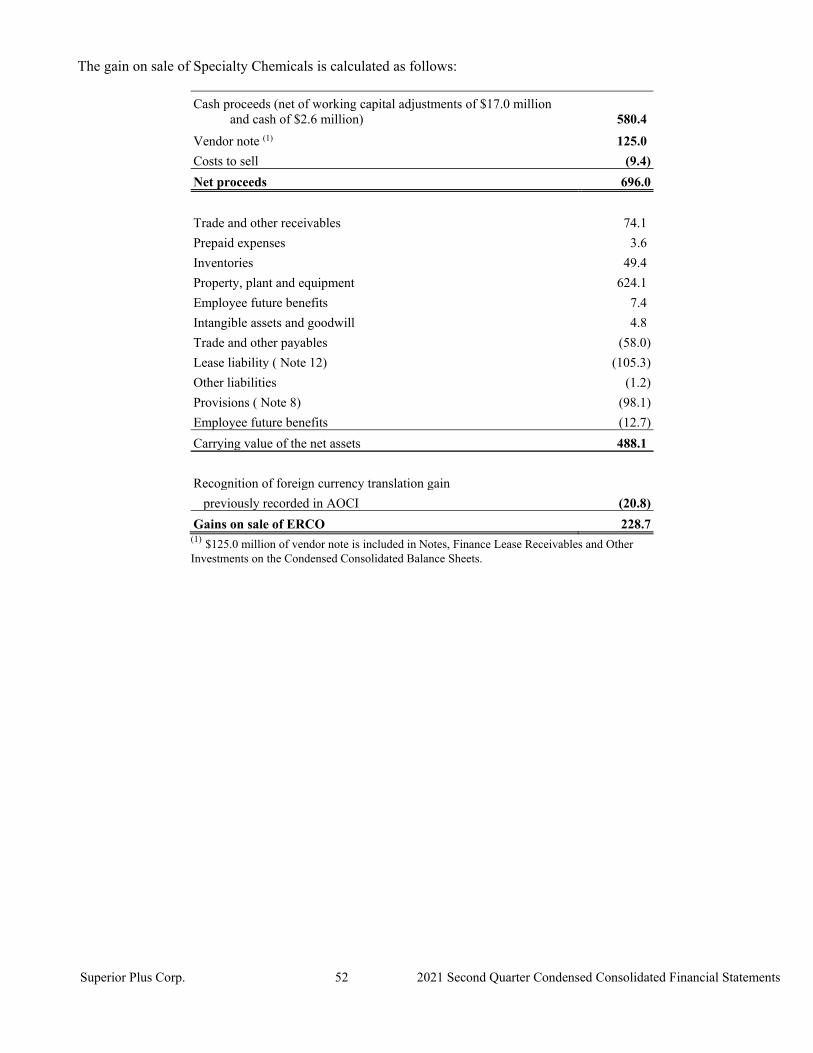
Superior Plus Corp. 52 2021 Second Quarter Condensed Consolidated Financial Statements
The gain on sale of Specialty Chemicals is calculated as follows:
Cash proceeds (net of working capital adjustments of $17.0 million and cash of $2.6 million) 580.4
Vendor note (1) 125.0
Costs to sell (9.4)
Net proceeds 696.0
Trade and other receivables 74.1
Prepaid expenses 3.6
Inventories 49.4
Property, plant and equipment 624.1
Employee future benefits 7.4
Intangible assets and goodwill 4.8
Trade and other payables (58.0)
Lease liability ( Note 12) (105.3)
Other liabilities (1.2)
Provisions ( Note 8) (98.1)
Employee future benefits (12.7)
Carrying value of the net assets 488.1
Recognition of foreign currency translation gain
previously recorded in AOCI (20.8)
Gains on sale of ERCO 228.7 (1) $125.0 million of vendor note is included in Notes, Finance Lease Receivables and Other Investments on the Condensed Consolidated Balance Sheets.
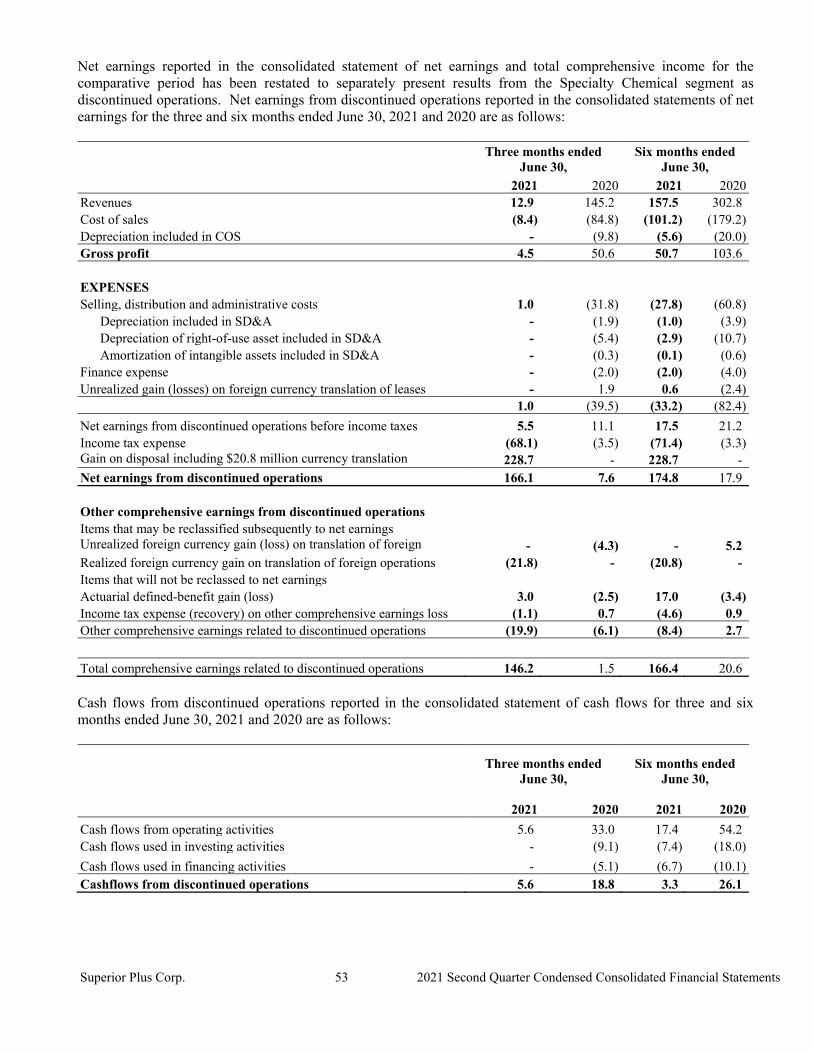
Superior Plus Corp. 53 2021 Second Quarter Condensed Consolidated Financial Statements
Net earnings reported in the consolidated statement of net earnings and total comprehensive income for the comparative period has been restated to separately present results from the Specialty Chemical segment as discontinued operations. Net earnings from discontinued operations reported in the consolidated statements of net earnings for the three and six months ended June 30, 2021 and 2020 are as follows:
Three months ended
June 30, Six months ended
June 30,
2021 2020 2021 2020 Revenues 12.9 145.2 157.5 302.8 Cost of sales (8.4) (84.8) (101.2) (179.2) Depreciation included in COS - (9.8) (5.6) (20.0) Gross profit 4.5 50.6 50.7 103.6 EXPENSES Selling, distribution and administrative costs 1.0 (31.8) (27.8) (60.8) Depreciation included in SD&A - (1.9) (1.0) (3.9) Depreciation of right-of-use asset included in SD&A - (5.4) (2.9) (10.7) Amortization of intangible assets included in SD&A - (0.3) (0.1) (0.6) Finance expense - (2.0) (2.0) (4.0) Unrealized gain (losses) on foreign currency translation of leases - 1.9 0.6 (2.4) 1.0 (39.5) (33.2) (82.4)
Net earnings from discontinued operations before income taxes 5.5 11.1 17.5 21.2 Income tax expense (68.1) (3.5) (71.4) (3.3) Gain on disposal including $20.8 million currency translation 228.7 - 228.7 - Net earnings from discontinued operations 166.1 7.6 174.8 17.9 Other comprehensive earnings from discontinued operations Items that may be reclassified subsequently to net earnings Unrealized foreign currency gain (loss) on translation of foreign - (4.3) - 5.2 Realized foreign currency gain on translation of foreign operations (21.8) - (20.8) - Items that will not be reclassed to net earnings Actuarial defined-benefit gain (loss) 3.0 (2.5) 17.0 (3.4) Income tax expense (recovery) on other comprehensive earnings loss (1.1) 0.7 (4.6) 0.9 Other comprehensive earnings related to discontinued operations (19.9) (6.1) (8.4) 2.7
Total comprehensive earnings related to discontinued operations 146.2 1.5 166.4 20.6 Cash flows from discontinued operations reported in the consolidated statement of cash flows for three and six months ended June 30, 2021 and 2020 are as follows:
Three months ended June 30,
Six months ended June 30,
2021 2020 2021 2020
Cash flows from operating activities 5.6 33.0 17.4 54.2 Cash flows used in investing activities - (9.1) (7.4) (18.0)
Cash flows used in financing activities - (5.1) (6.7) (10.1) Cashflows from discontinued operations 5.6 18.8 3.3 26.1
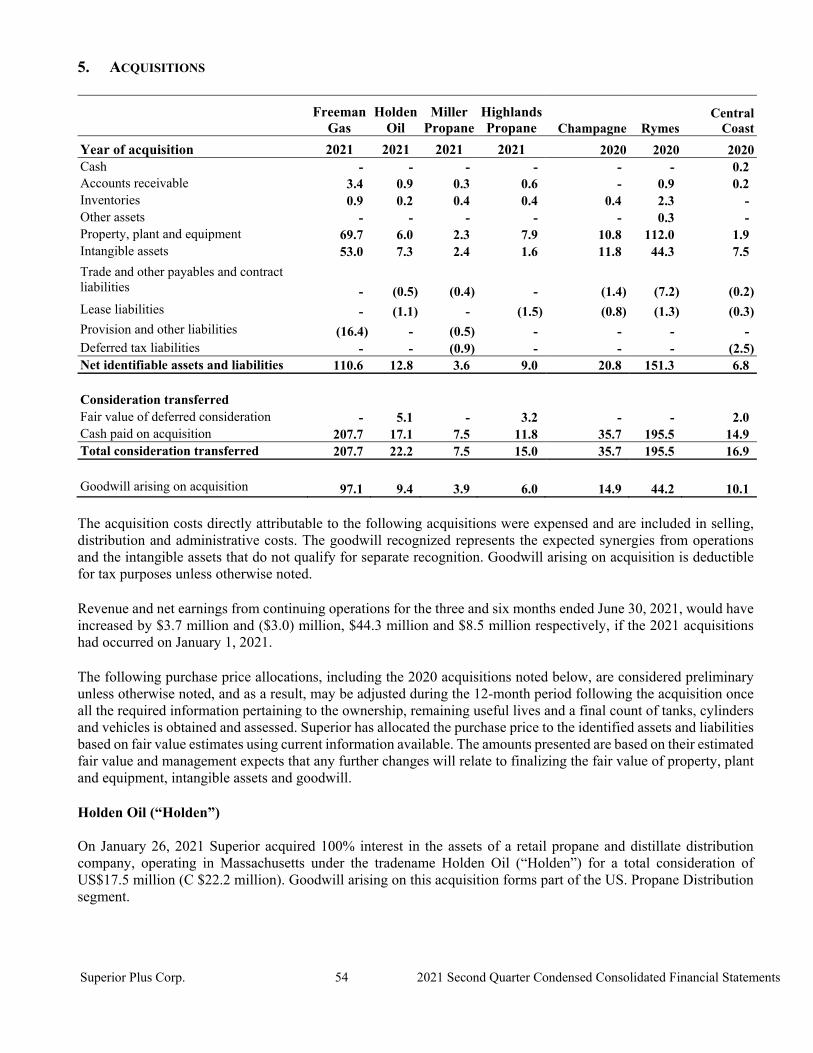
Superior Plus Corp. 54 2021 Second Quarter Condensed Consolidated Financial Statements
5. ACQUISITIONS
Freeman
Gas Holden
Oil Miller
Propane Highlands Propane Champagne Rymes
Central Coast
Year of acquisition 2021 2021 2021 2021 2020 2020 2020 Cash - - - - - - 0.2 Accounts receivable 3.4 0.9 0.3 0.6 - 0.9 0.2 Inventories 0.9 0.2 0.4 0.4 0.4 2.3 - Other assets - - - - - 0.3 - Property, plant and equipment 69.7 6.0 2.3 7.9 10.8 112.0 1.9 Intangible assets 53.0 7.3 2.4 1.6 11.8 44.3 7.5
Trade and other payables and contract liabilities - (0.5) (0.4) - (1.4) (7.2) (0.2) Lease liabilities - (1.1) - (1.5) (0.8) (1.3) (0.3) Provision and other liabilities (16.4) - (0.5) - - - - Deferred tax liabilities - - (0.9) - - - (2.5) Net identifiable assets and liabilities 110.6 12.8 3.6 9.0 20.8 151.3 6.8 Consideration transferred Fair value of deferred consideration - 5.1 - 3.2 - - 2.0 Cash paid on acquisition 207.7 17.1 7.5 11.8 35.7 195.5 14.9 Total consideration transferred 207.7 22.2 7.5 15.0 35.7 195.5 16.9 Goodwill arising on acquisition 97.1 9.4 3.9 6.0 14.9 44.2 10.1 The acquisition costs directly attributable to the following acquisitions were expensed and are included in selling, distribution and administrative costs. The goodwill recognized represents the expected synergies from operations and the intangible assets that do not qualify for separate recognition. Goodwill arising on acquisition is deductible for tax purposes unless otherwise noted. Revenue and net earnings from continuing operations for the three and six months ended June 30, 2021, would have increased by $3.7 million and ($3.0) million, $44.3 million and $8.5 million respectively, if the 2021 acquisitions had occurred on January 1, 2021. The following purchase price allocations, including the 2020 acquisitions noted below, are considered preliminary unless otherwise noted, and as a result, may be adjusted during the 12-month period following the acquisition once all the required information pertaining to the ownership, remaining useful lives and a final count of tanks, cylinders and vehicles is obtained and assessed. Superior has allocated the purchase price to the identified assets and liabilities based on fair value estimates using current information available. The amounts presented are based on their estimated fair value and management expects that any further changes will relate to finalizing the fair value of property, plant and equipment, intangible assets and goodwill. Holden Oil (“Holden”) On January 26, 2021 Superior acquired 100% interest in the assets of a retail propane and distillate distribution company, operating in Massachusetts under the tradename Holden Oil (“Holden”) for a total consideration of US$17.5 million (C $22.2 million). Goodwill arising on this acquisition forms part of the US. Propane Distribution segment.
Superior Plus Corp. 55 2021 Second Quarter Condensed Consolidated Financial Statements
Subsequent to the acquisition date, the acquisition contributed revenue and net earnings of US$8.6 million and US$1.4 million respectively (C$10.8 million and C$1.8 million), and US$3.3 million and US$0.4 million respectively (C$4.1 million and C$0.5 million) for the six months and three months ended June 30, 2021. Miller Propane (“Miller”) On February 1, 2021 Superior acquired a 100% equity interests of a retail propane distribution company, operating in Quebec under the tradename Miller Propane (“Miller”) for a total consideration of $7.5 million. Goodwill arising on this acquisition forms part of the Canadian Propane Distribution segment. Subsequent to the acquisition date, the acquisition contributed revenue and net earnings of $1.7 million and $0.3 million respectively, and $1.0 million and $0.2 million respectively to the Canadian Propane Distribution segment for the six months and three months ended June 30, 2021. Highlands Propane (“Highlands”) On February 11, 2021, Superior acquired the assets and shares of an Ontario retail propane distribution company, operating under the tradename Highlands Propane (“Highlands”) for a total consideration of $15.0 million. Goodwill arising on the acquisition forms part of the Canadian Propane Distribution segment. Subsequent to the acquisition date, the acquisition contributed revenue and net earnings of $4.1 million and $0.5 million respectively, and $1.7 million and $0.1 million respectively, to the Canadian Propane Distribution segment for the six months and three months ended June 30, 2021. Freeman Gas and Electric Co., Inc. (“Freeman”) On June 16, 2021 Superior acquired the assets of a retail propane distribution company based in South Carolina, operating under the tradename, Freeman Gas and Electric Co., Inc. for an aggregate purchase price of approximately US $169.2 million (C$207.7 million) before adjustments for working capital. Goodwill arising on this acquisition forms part of the US. Propane Distribution segment. Subsequent to the acquisition date, the acquisition contributed revenue and net earnings of US$1.2 million and US$0.1 million (C$1.4million and C$0.1 million), respectively to the U.S. Propane Distribution segment for the three and the six months ended June 30, 2021
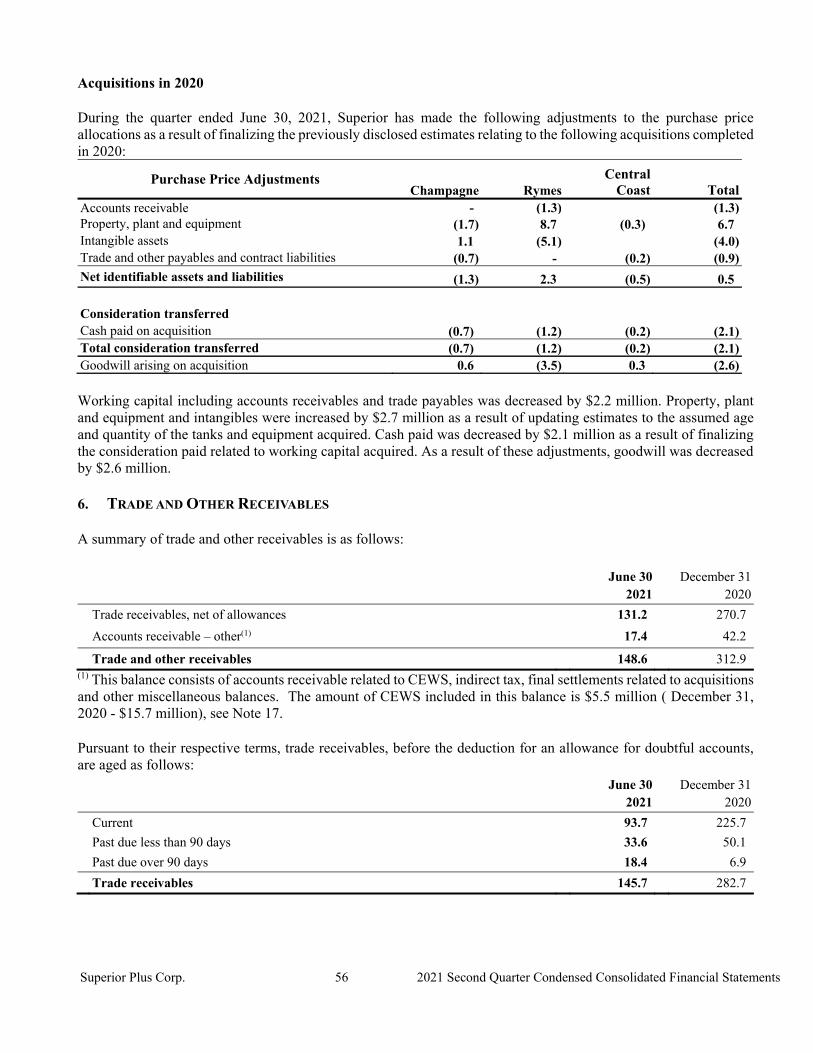
Superior Plus Corp. 56 2021 Second Quarter Condensed Consolidated Financial Statements
Acquisitions in 2020 During the quarter ended June 30, 2021, Superior has made the following adjustments to the purchase price allocations as a result of finalizing the previously disclosed estimates relating to the following acquisitions completed in 2020:
Purchase Price Adjustments Champagne Rymes
Central Coast Total
Accounts receivable - (1.3) (1.3) Property, plant and equipment (1.7) 8.7 (0.3) 6.7 Intangible assets 1.1 (5.1) (4.0) Trade and other payables and contract liabilities (0.7) - (0.2) (0.9) Net identifiable assets and liabilities (1.3) 2.3 (0.5) 0.5 Consideration transferred Cash paid on acquisition (0.7) (1.2) (0.2) (2.1) Total consideration transferred (0.7) (1.2) (0.2) (2.1) Goodwill arising on acquisition 0.6 (3.5) 0.3 (2.6) Working capital including accounts receivables and trade payables was decreased by $2.2 million. Property, plant and equipment and intangibles were increased by $2.7 million as a result of updating estimates to the assumed age and quantity of the tanks and equipment acquired. Cash paid was decreased by $2.1 million as a result of finalizing the consideration paid related to working capital acquired. As a result of these adjustments, goodwill was decreased by $2.6 million.
6. TRADE AND OTHER RECEIVABLES
A summary of trade and other receivables is as follows:
June 30 December 31
2021 2020
Trade receivables, net of allowances 131.2 270.7
Accounts receivable – other(1) 17.4 42.2
Trade and other receivables 148.6 312.9 (1) This balance consists of accounts receivable related to CEWS, indirect tax, final settlements related to acquisitions and other miscellaneous balances. The amount of CEWS included in this balance is $5.5 million ( December 31, 2020 - $15.7 million), see Note 17. Pursuant to their respective terms, trade receivables, before the deduction for an allowance for doubtful accounts, are aged as follows: June 30 December 31
2021 2020
Current 93.7 225.7
Past due less than 90 days 33.6 50.1
Past due over 90 days 18.4 6.9
Trade receivables 145.7 282.7
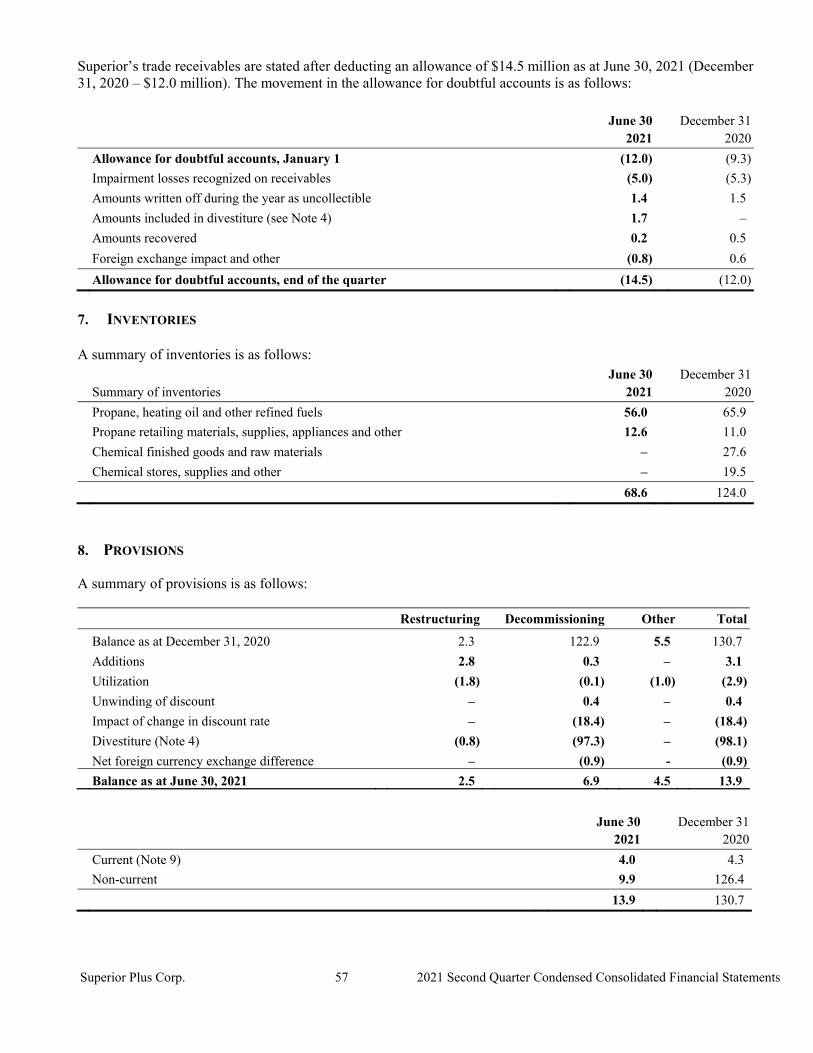
Superior Plus Corp. 57 2021 Second Quarter Condensed Consolidated Financial Statements
Superior’s trade receivables are stated after deducting an allowance of $14.5 million as at June 30, 2021 (December 31, 2020 – $12.0 million). The movement in the allowance for doubtful accounts is as follows:
June 30 December 31
2021 2020
Allowance for doubtful accounts, January 1 (12.0) (9.3)
Impairment losses recognized on receivables (5.0) (5.3)
Amounts written off during the year as uncollectible 1.4 1.5
Amounts included in divestiture (see Note 4) 1.7 –
Amounts recovered 0.2 0.5
Foreign exchange impact and other (0.8) 0.6
Allowance for doubtful accounts, end of the quarter (14.5) (12.0)
7. INVENTORIES A summary of inventories is as follows: June 30 December 31
Summary of inventories 2021 2020
Propane, heating oil and other refined fuels 56.0 65.9
Propane retailing materials, supplies, appliances and other 12.6 11.0
Chemical finished goods and raw materials – 27.6
Chemical stores, supplies and other – 19.5
68.6 124.0
8. PROVISIONS
A summary of provisions is as follows:
Restructuring Decommissioning Other Total
Balance as at December 31, 2020 2.3 122.9 5.5 130.7
Additions 2.8 0.3 – 3.1
Utilization (1.8) (0.1) (1.0) (2.9)
Unwinding of discount – 0.4 – 0.4
Impact of change in discount rate – (18.4) – (18.4)
Divestiture (Note 4) (0.8) (97.3) – (98.1)
Net foreign currency exchange difference – (0.9) - (0.9)
Balance as at June 30, 2021 2.5 6.9 4.5 13.9
June 30 December 31
2021 2020
Current (Note 9) 4.0 4.3
Non-current 9.9 126.4
13.9 130.7

Superior Plus Corp. 58 2021 Second Quarter Condensed Consolidated Financial Statements
Superior is subject to various claims and potential claims in the normal course of business, but the Company does not expect the ultimate settlement of any of these to have a material effect on its financial results. The outcomes of all the proceedings and claims against Superior are subject to future resolution that includes the uncertainties of litigation. It is not possible for Superior to predict the result or magnitude of the claims due to the various factors and uncertainties involved in the legal process. Based on information currently known to Superior, it is not probable that the ultimate resolution of any proceedings and claims, individually or in total, will have a material effect on the consolidated statements of net earnings and total comprehensive earnings or consolidated balance sheets. If it becomes probable that Superior is liable, Superior will record a provision in the period the change in probability occurs, and the resulting impact could be material to the condensed consolidated statements of net earnings and total comprehensive earnings or condensed consolidated balance sheets.
9. TRADE AND OTHER PAYABLES A summary of trade and other payables is as follows: June 30 December 31
2021 2020
Trade payables 179.3 281.9
Provisions (Note 8) 4.0 4.3
Accrued liabilities and other payables 72.6 111.8
Current taxes payable 16.8 15.2
Share-based payments, current portion 26.2 15.1
Trade and other payables 298.9 428.3
10. OTHER LIABILITIES A summary of other liabilities is as follows: June 30 December 31
2021 2020
Quebec cap and trade payable 1.7 –
California cap and trade payable 5.5 3.8
Nova Scotia cap and trade payable 1.4 1.1
Share-based payments and others 6.9 8.4
Other long-term payables – 1.2
Other liabilities 15.5 14.5
Superior operates in California, Nova Scotia, and Quebec, and is required to participate in the respective government cap and trade programs, which requires Superior to settle any liability with compliance instruments at the end of each compliance period. Intangible assets are recorded when compliance instruments are purchased, and cap and trade liabilities are recorded upon the import of propane. These are included in the consolidated statements of cash flows net of the liability that has been accrued related to cap and trade as part of changes in non-cash working capital.
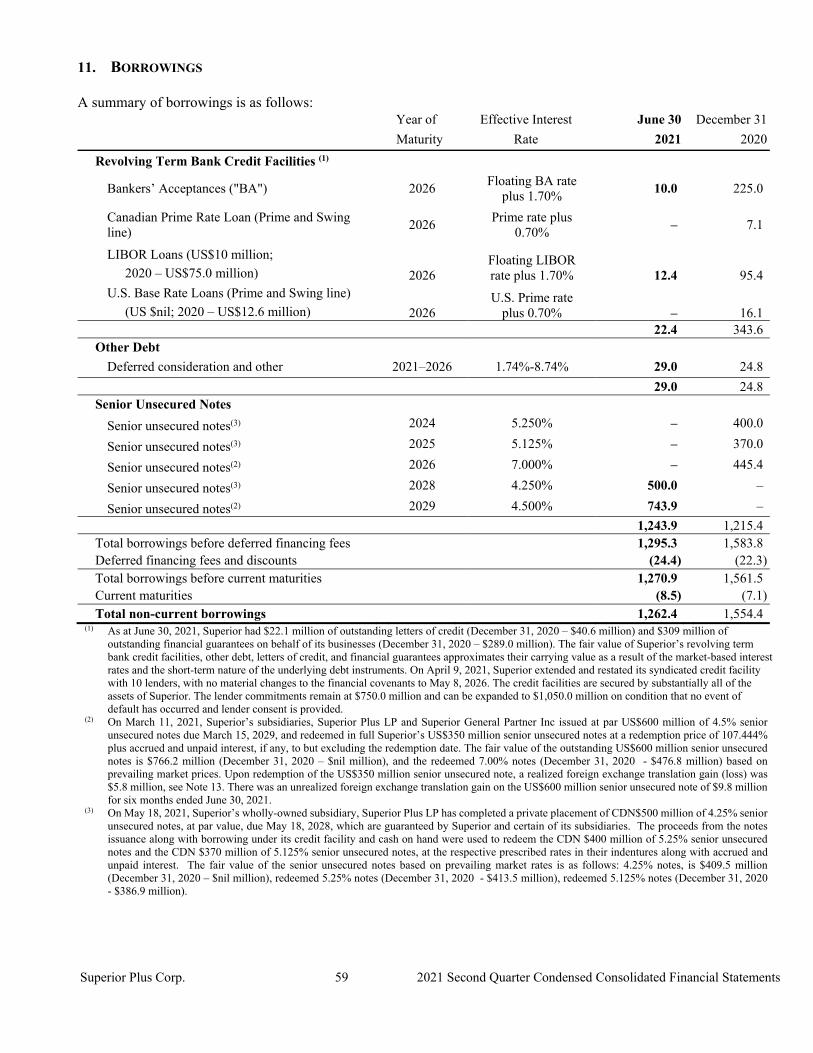
Superior Plus Corp. 59 2021 Second Quarter Condensed Consolidated Financial Statements
11. BORROWINGS A summary of borrowings is as follows: Year of Effective Interest June 30 December 31
Maturity Rate 2021 2020
Revolving Term Bank Credit Facilities (1)
Bankers’ Acceptances ("BA")
2026
Floating BA rate
plus 1.70% 10.0 225.0
Canadian Prime Rate Loan (Prime and Swing line)
2026
Prime rate plus 0.70%
– 7.1
LIBOR Loans (US$10 million; 2026
Floating LIBOR rate plus 1.70%
12.4 95.4 2020 – US$75.0 million)
U.S. Base Rate Loans (Prime and Swing line) 2026
U.S. Prime rate plus 0.70%
– 16.1 (US $nil; 2020 – US$12.6 million)
22.4 343.6 Other Debt
Deferred consideration and other 2021–2026 1.74%-8.74% 29.0 24.8
29.0 24.8 Senior Unsecured Notes
Senior unsecured notes(3) 2024 5.250% – 400.0
Senior unsecured notes(3) 2025 5.125% – 370.0
Senior unsecured notes(2) 2026 7.000% – 445.4
Senior unsecured notes(3) 2028 4.250% 500.0 –
Senior unsecured notes(2) 2029 4.500% 743.9 –
1,243.9 1,215.4 Total borrowings before deferred financing fees 1,295.3 1,583.8 Deferred financing fees and discounts (24.4) (22.3)
Total borrowings before current maturities 1,270.9 1,561.5 Current maturities (8.5) (7.1)
Total non-current borrowings 1,262.4 1,554.4 (1) As at June 30, 2021, Superior had $22.1 million of outstanding letters of credit (December 31, 2020 – $40.6 million) and $309 million of
outstanding financial guarantees on behalf of its businesses (December 31, 2020 – $289.0 million). The fair value of Superior’s revolving term bank credit facilities, other debt, letters of credit, and financial guarantees approximates their carrying value as a result of the market-based interest rates and the short-term nature of the underlying debt instruments. On April 9, 2021, Superior extended and restated its syndicated credit facility with 10 lenders, with no material changes to the financial covenants to May 8, 2026. The credit facilities are secured by substantially all of the assets of Superior. The lender commitments remain at $750.0 million and can be expanded to $1,050.0 million on condition that no event of default has occurred and lender consent is provided.
(2) On March 11, 2021, Superior’s subsidiaries, Superior Plus LP and Superior General Partner Inc issued at par US$600 million of 4.5% senior unsecured notes due March 15, 2029, and redeemed in full Superior’s US$350 million senior unsecured notes at a redemption price of 107.444% plus accrued and unpaid interest, if any, to but excluding the redemption date. The fair value of the outstanding US$600 million senior unsecured notes is $766.2 million (December 31, 2020 – $nil million), and the redeemed 7.00% notes (December 31, 2020 - $476.8 million) based on prevailing market prices. Upon redemption of the US$350 million senior unsecured note, a realized foreign exchange translation gain (loss) was $5.8 million, see Note 13. There was an unrealized foreign exchange translation gain on the US$600 million senior unsecured note of $9.8 million for six months ended June 30, 2021.
(3) On May 18, 2021, Superior’s wholly-owned subsidiary, Superior Plus LP has completed a private placement of CDN$500 million of 4.25% senior unsecured notes, at par value, due May 18, 2028, which are guaranteed by Superior and certain of its subsidiaries. The proceeds from the notes issuance along with borrowing under its credit facility and cash on hand were used to redeem the CDN $400 million of 5.25% senior unsecured notes and the CDN $370 million of 5.125% senior unsecured notes, at the respective prescribed rates in their indentures along with accrued and unpaid interest. The fair value of the senior unsecured notes based on prevailing market rates is as follows: 4.25% notes, is $409.5 million (December 31, 2020 – $nil million), redeemed 5.25% notes (December 31, 2020 - $413.5 million), redeemed 5.125% notes (December 31, 2020 - $386.9 million).
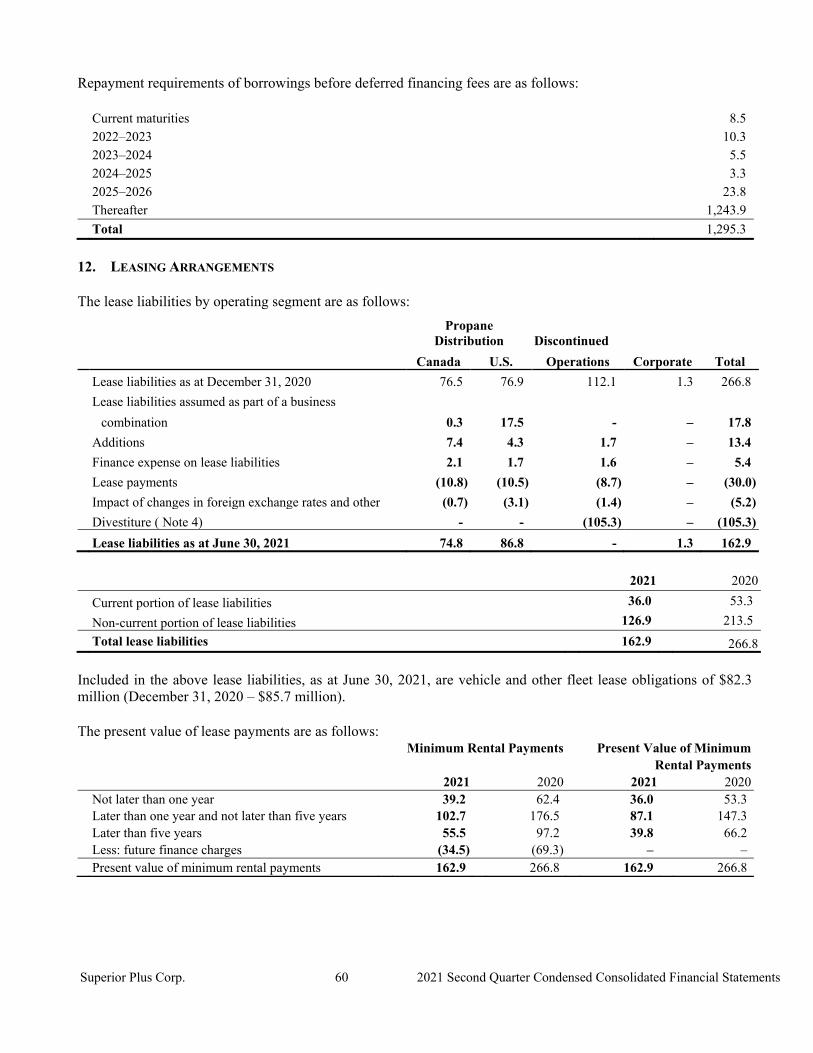
Superior Plus Corp. 60 2021 Second Quarter Condensed Consolidated Financial Statements
Repayment requirements of borrowings before deferred financing fees are as follows:
Current maturities 8.5
2022–2023 10.3
2023–2024 5.5
2024–2025 3.3
2025–2026 23.8
Thereafter 1,243.9
Total 1,295.3
12. LEASING ARRANGEMENTS The lease liabilities by operating segment are as follows:
Propane
Distribution Discontinued
Canada U.S. Operations Corporate Total
Lease liabilities as at December 31, 2020 76.5 76.9 112.1 1.3 266.8
Lease liabilities assumed as part of a business
combination 0.3 17.5 - – 17.8
Additions 7.4 4.3 1.7 – 13.4
Finance expense on lease liabilities 2.1 1.7 1.6 – 5.4
Lease payments (10.8) (10.5) (8.7) – (30.0)
Impact of changes in foreign exchange rates and other (0.7) (3.1) (1.4) – (5.2)
Divestiture ( Note 4) - - (105.3) – (105.3) Lease liabilities as at June 30, 2021 74.8 86.8 - 1.3 162.9
2021 2020
Current portion of lease liabilities 36.0 53.3
Non-current portion of lease liabilities 126.9 213.5
Total lease liabilities 162.9 266.8
Included in the above lease liabilities, as at June 30, 2021, are vehicle and other fleet lease obligations of $82.3 million (December 31, 2020 – $85.7 million). The present value of lease payments are as follows: Minimum Rental Payments Present Value of Minimum Rental Payments 2021 2020 2021 2020 Not later than one year 39.2 62.4 36.0 53.3 Later than one year and not later than five years 102.7 176.5 87.1 147.3 Later than five years 55.5 97.2 39.8 66.2 Less: future finance charges (34.5) (69.3) – –
Present value of minimum rental payments 162.9 266.8 162.9 266.8
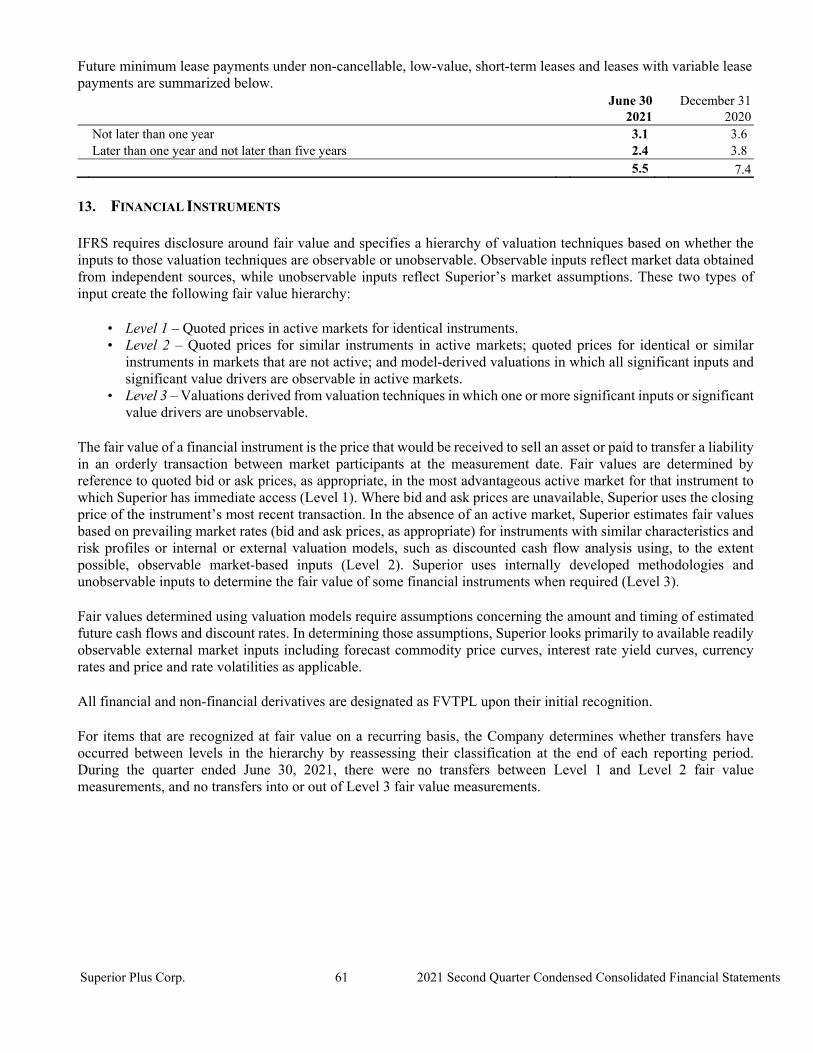
Superior Plus Corp. 61 2021 Second Quarter Condensed Consolidated Financial Statements
Future minimum lease payments under non-cancellable, low-value, short-term leases and leases with variable lease payments are summarized below. June 30 December 31 2021 2020 Not later than one year 3.1 3.6 Later than one year and not later than five years 2.4 3.8 5.5 7.4
13. FINANCIAL INSTRUMENTS
IFRS requires disclosure around fair value and specifies a hierarchy of valuation techniques based on whether the inputs to those valuation techniques are observable or unobservable. Observable inputs reflect market data obtained from independent sources, while unobservable inputs reflect Superior’s market assumptions. These two types of input create the following fair value hierarchy:
• Level 1 – Quoted prices in active markets for identical instruments. • Level 2 – Quoted prices for similar instruments in active markets; quoted prices for identical or similar
instruments in markets that are not active; and model-derived valuations in which all significant inputs and significant value drivers are observable in active markets.
• Level 3 – Valuations derived from valuation techniques in which one or more significant inputs or significant value drivers are unobservable.
The fair value of a financial instrument is the price that would be received to sell an asset or paid to transfer a liability in an orderly transaction between market participants at the measurement date. Fair values are determined by reference to quoted bid or ask prices, as appropriate, in the most advantageous active market for that instrument to which Superior has immediate access (Level 1). Where bid and ask prices are unavailable, Superior uses the closing price of the instrument’s most recent transaction. In the absence of an active market, Superior estimates fair values based on prevailing market rates (bid and ask prices, as appropriate) for instruments with similar characteristics and risk profiles or internal or external valuation models, such as discounted cash flow analysis using, to the extent possible, observable market-based inputs (Level 2). Superior uses internally developed methodologies and unobservable inputs to determine the fair value of some financial instruments when required (Level 3). Fair values determined using valuation models require assumptions concerning the amount and timing of estimated future cash flows and discount rates. In determining those assumptions, Superior looks primarily to available readily observable external market inputs including forecast commodity price curves, interest rate yield curves, currency rates and price and rate volatilities as applicable. All financial and non-financial derivatives are designated as FVTPL upon their initial recognition. For items that are recognized at fair value on a recurring basis, the Company determines whether transfers have occurred between levels in the hierarchy by reassessing their classification at the end of each reporting period. During the quarter ended June 30, 2021, there were no transfers between Level 1 and Level 2 fair value measurements, and no transfers into or out of Level 3 fair value measurements.
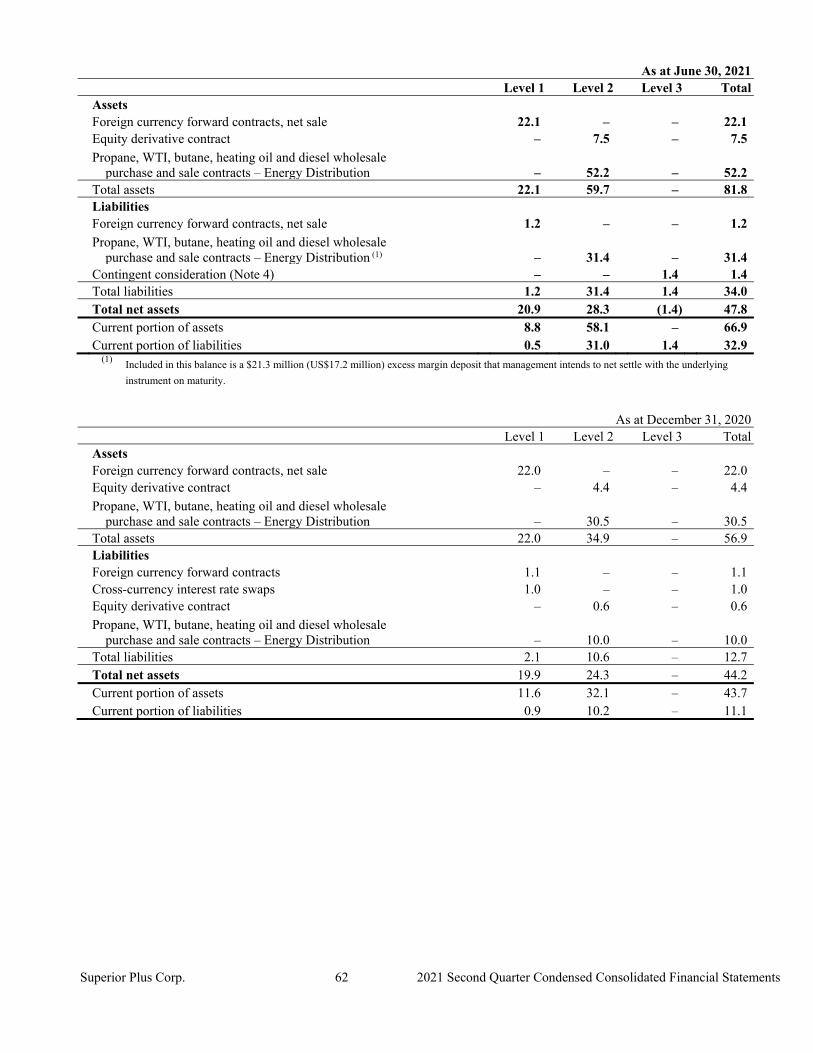
Superior Plus Corp. 62 2021 Second Quarter Condensed Consolidated Financial Statements
As at June 30, 2021 Level 1 Level 2 Level 3 Total Assets Foreign currency forward contracts, net sale 22.1 – – 22.1 Equity derivative contract – 7.5 – 7.5
Propane, WTI, butane, heating oil and diesel wholesale purchase and sale contracts – Energy Distribution – 52.2 – 52.2
Total assets 22.1 59.7 – 81.8 Liabilities Foreign currency forward contracts, net sale 1.2 – – 1.2
Propane, WTI, butane, heating oil and diesel wholesale purchase and sale contracts – Energy Distribution (1) – 31.4 – 31.4
Contingent consideration (Note 4) – – 1.4 1.4 Total liabilities 1.2 31.4 1.4 34.0 Total net assets 20.9 28.3 (1.4) 47.8 Current portion of assets 8.8 58.1 – 66.9 Current portion of liabilities 0.5 31.0 1.4 32.9
(1) Included in this balance is a $21.3 million (US$17.2 million) excess margin deposit that management intends to net settle with the underlying
instrument on maturity.
As at December 31, 2020 Level 1 Level 2 Level 3 Total Assets Foreign currency forward contracts, net sale 22.0 – – 22.0 Equity derivative contract – 4.4 – 4.4
Propane, WTI, butane, heating oil and diesel wholesale purchase and sale contracts – Energy Distribution – 30.5 – 30.5
Total assets 22.0 34.9 – 56.9 Liabilities Foreign currency forward contracts 1.1 – – 1.1 Cross-currency interest rate swaps 1.0 – – 1.0 Equity derivative contract – 0.6 – 0.6
Propane, WTI, butane, heating oil and diesel wholesale purchase and sale contracts – Energy Distribution – 10.0 – 10.0
Total liabilities 2.1 10.6 – 12.7 Total net assets 19.9 24.3 – 44.2 Current portion of assets 11.6 32.1 – 43.7 Current portion of liabilities 0.9 10.2 – 11.1
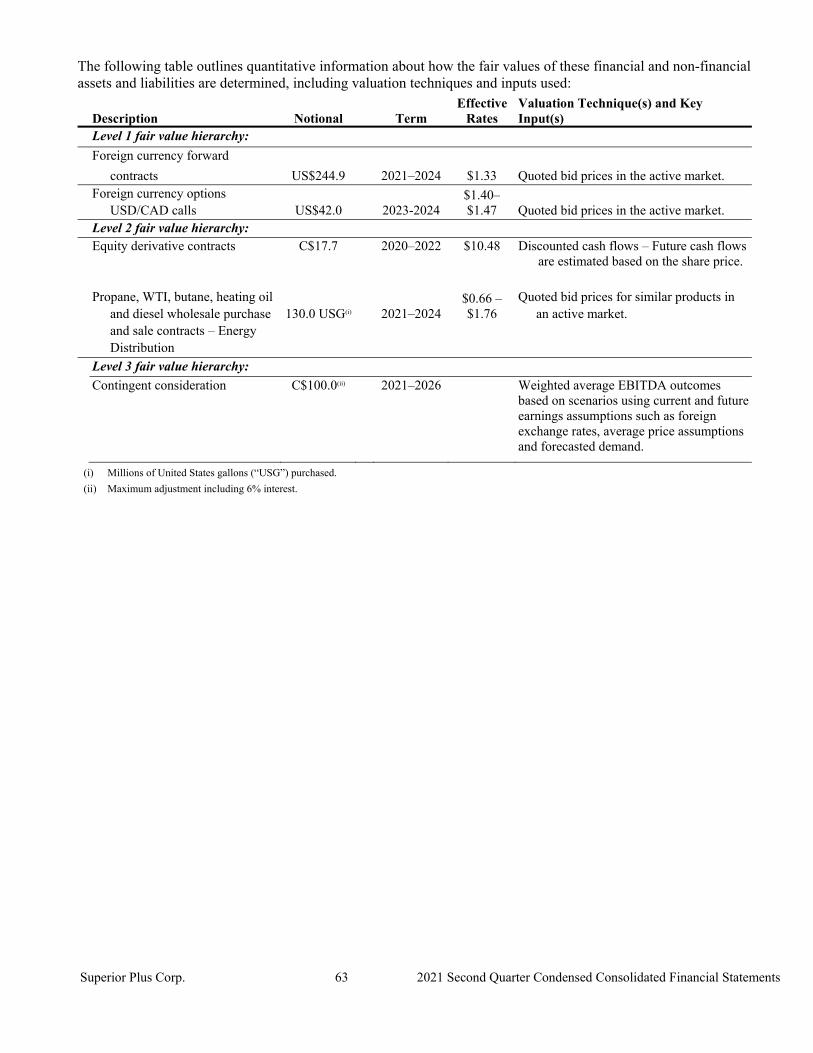
Superior Plus Corp. 63 2021 Second Quarter Condensed Consolidated Financial Statements
The following table outlines quantitative information about how the fair values of these financial and non-financial assets and liabilities are determined, including valuation techniques and inputs used:
Description Notional Term Effective
Rates Valuation Technique(s) and Key Input(s)
Level 1 fair value hierarchy:
Foreign currency forward
contracts US$244.9 2021–2024 $1.33 Quoted bid prices in the active market.
Foreign currency options $1.40–
USD/CAD calls US$42.0 2023-2024 $1.47 Quoted bid prices in the active market.
Level 2 fair value hierarchy:
Equity derivative contracts C$17.7 2020–2022 $10.48 Discounted cash flows – Future cash flows are estimated based on the share price.
Propane, WTI, butane, heating oil $0.66 – Quoted bid prices for similar products in
and diesel wholesale purchase 130.0 USG(i) 2021–2024 $1.76 an active market.
and sale contracts – Energy Distribution
Level 3 fair value hierarchy:
Contingent consideration C$100.0(ii) 2021–2026 Weighted average EBITDA outcomes based on scenarios using current and future earnings assumptions such as foreign exchange rates, average price assumptions and forecasted demand.
(i) Millions of United States gallons (“USG”) purchased.
(ii) Maximum adjustment including 6% interest.

Superior Plus Corp. 64 2021 Second Quarter Condensed Consolidated Financial Statements
Superior’s realized and unrealized financial instrument gains (losses) for the three and six months ended June 30, 2021 and 2020 are as follows: Three Months Ended Three Months Ended
June 30 June 30
2021 2020
Description Realized
Gain Unrealized
Gain Total
Realized Gain
(Loss) Unrealized
Gain Total Foreign currency forward contracts – net sale and foreign currency options, USD/CAD calls 2.8 1.6 6.8 (2.2) 25.7 23.5 Cross-currency interest rate swaps – – – – 0.2 0.2 Equity derivative contracts – 1.0 1.0 – 6.3 6.3
Propane, WTI, butane, heating oil and diesel wholesale purchase and sale contracts – Energy Distribution 4.1 19.9 21.6 (5.3) 23.3 18.0
Total gains (losses) on financial and non-financial derivatives 6.9 22.5 29.4 (7.5) 55.5 48.0 Foreign exchange gain (loss) on U.S. dollar debt and lease liabilities – 9.7 9.7 – 16.7 16.7 Total gains (losses) 6.9 32.2 39.1 (7.5) 72.2 64.7
Six Months Ended Six Months Ended
June 30 June 30
2021 2020
Description Realized
Gain
Unrealized Gain
(Loss) Total Realized
Loss
Unrealized Gain
(Loss) Total Foreign currency forward contracts – net sale and foreign currency options, USD/CAD calls 8.3 1.2 29.5 (6.2) (13.5) (19.7) Cross-currency interest rate swaps – – – 5.8 5.8 Equity derivative contracts – 3.8 3.8 – 0.8 0.8
Propane, WTI, butane, heating oil and diesel wholesale purchase and sale contracts – Energy Distribution 24.7 21.6 26.3 (19.8) 12.1 (7.7)
Total gains (losses) on financial and non-financial derivatives 33.0 26.6 59.6 (26.0) 5.2 (20.8) Foreign exchange gain (loss) on U.S. dollar debt and lease liabilities 20.0 (4.5) 15.5 – (26.2) (26.2) Total gains (losses) 53.0 22.1 75.1 (26.0) (21.0) (47.0)
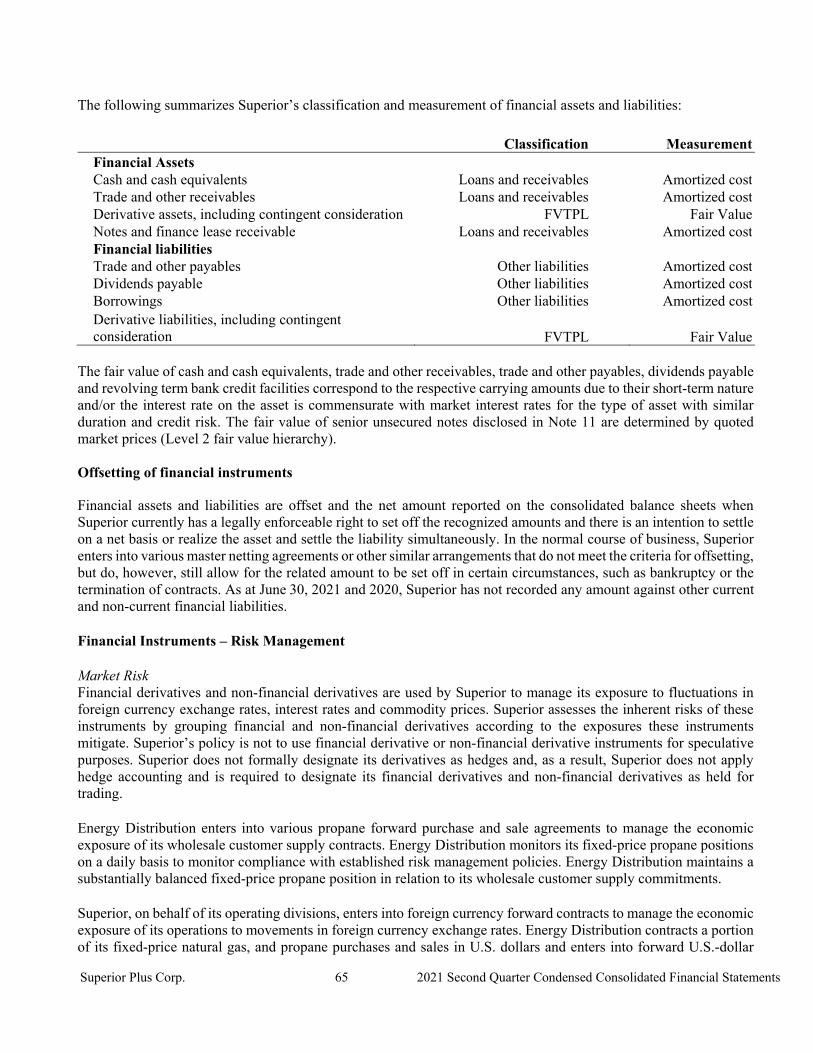
Superior Plus Corp. 65 2021 Second Quarter Condensed Consolidated Financial Statements
The following summarizes Superior’s classification and measurement of financial assets and liabilities: Classification Measurement
Financial Assets Cash and cash equivalents Loans and receivables Amortized cost Trade and other receivables Loans and receivables Amortized cost Derivative assets, including contingent consideration FVTPL Fair Value Notes and finance lease receivable Loans and receivables Amortized cost Financial liabilities Trade and other payables Other liabilities Amortized cost Dividends payable Other liabilities Amortized cost Borrowings Other liabilities Amortized cost Derivative liabilities, including contingent consideration
FVTPL
Fair Value
The fair value of cash and cash equivalents, trade and other receivables, trade and other payables, dividends payable and revolving term bank credit facilities correspond to the respective carrying amounts due to their short-term nature and/or the interest rate on the asset is commensurate with market interest rates for the type of asset with similar duration and credit risk. The fair value of senior unsecured notes disclosed in Note 11 are determined by quoted market prices (Level 2 fair value hierarchy). Offsetting of financial instruments
Financial assets and liabilities are offset and the net amount reported on the consolidated balance sheets when Superior currently has a legally enforceable right to set off the recognized amounts and there is an intention to settle on a net basis or realize the asset and settle the liability simultaneously. In the normal course of business, Superior enters into various master netting agreements or other similar arrangements that do not meet the criteria for offsetting, but do, however, still allow for the related amount to be set off in certain circumstances, such as bankruptcy or the termination of contracts. As at June 30, 2021 and 2020, Superior has not recorded any amount against other current and non-current financial liabilities. Financial Instruments – Risk Management Market Risk Financial derivatives and non-financial derivatives are used by Superior to manage its exposure to fluctuations in foreign currency exchange rates, interest rates and commodity prices. Superior assesses the inherent risks of these instruments by grouping financial and non-financial derivatives according to the exposures these instruments mitigate. Superior’s policy is not to use financial derivative or non-financial derivative instruments for speculative purposes. Superior does not formally designate its derivatives as hedges and, as a result, Superior does not apply hedge accounting and is required to designate its financial derivatives and non-financial derivatives as held for trading. Energy Distribution enters into various propane forward purchase and sale agreements to manage the economic exposure of its wholesale customer supply contracts. Energy Distribution monitors its fixed-price propane positions on a daily basis to monitor compliance with established risk management policies. Energy Distribution maintains a substantially balanced fixed-price propane position in relation to its wholesale customer supply commitments. Superior, on behalf of its operating divisions, enters into foreign currency forward contracts to manage the economic exposure of its operations to movements in foreign currency exchange rates. Energy Distribution contracts a portion of its fixed-price natural gas, and propane purchases and sales in U.S. dollars and enters into forward U.S.-dollar

Superior Plus Corp. 66 2021 Second Quarter Condensed Consolidated Financial Statements
purchase contracts to create an effective Canadian-dollar fixed-price purchase cost. Superior enters into U.S.-dollar forward sales contracts on an ongoing basis to mitigate the impact of foreign exchange fluctuations on sales margins on production from its Canadian plants that is sold in U.S. dollars. Interest expense on Superior’s U.S.-dollar debt is also used to mitigate the impact of foreign exchange fluctuations. Superior manages its overall liquidity risk in relation to its general funding requirements by utilizing a mix of short-term and long-term debt instruments. Superior reviews its mix of short-term and long-term debt instruments on an ongoing basis to ensure it is able to meet its liquidity requirements. Credit Risk Superior utilizes a variety of counterparties in relation to its financial derivative and non-financial derivative instruments in order to mitigate its counterparty risk. Superior assesses the creditworthiness of its significant counterparties at the inception and throughout the term of a contract. Superior is also exposed to customer credit risk. Energy Distribution deals with a large number of small customers, thereby reducing this risk. Energy Distribution actively monitors the creditworthiness of its commercial customers. Overall, Superior’s credit quality is enhanced by its portfolio of customers, which is diversified across geographical (primarily Canada and the U.S.) and end-use (primarily commercial, residential and industrial) markets. Allowances for doubtful accounts and past due receivables are reviewed by Superior as at each consolidated balance sheet date. Superior updates its estimate of the allowance for doubtful accounts based on the evaluation of the recoverability of trade and other receivables with each customer, considering historical collection trends of past due accounts, current economic conditions and future forecasts. Trade and other receivables are written off once it is determined they are uncollectible. As part of the material terms of the divestiture disclosed in Note 4, a Vendor Note of $125 million was issued by the buyer. Its principal amount and accrued and unpaid interest are due October 2026. The collectability of the amounts owed to Superior is subject to the going concern of the buyer. As of June 30, 2021, Superior does not have any concerns about the financial strength of the buyer. Superior will continuously monitor the credit risk associated with this Vendor Note. Based on the current valuation, Superior has estimated a liability of $1.4 million related to this contingent consideration. The fair value has been calculated based on an estimate of the EBITDA during the thirty-six-months subsequent to the divestiture. If Superiors EBITDA assumptions used to value the contingent consideration were increased by 5% or decreased by 5% the fair value would increase by approximately $7.0 million and decrease by approximately $8.0 million respectively. This estimate is subject to change and will be updated as new information becomes available. Liquidity Risk Liquidity risk is the risk that Superior cannot meet a demand for cash or fund an obligation as it comes due. Liquidity risk also includes the risk of not being able to liquidate assets in a timely manner at a reasonable price. To ensure it is able to react to contingencies and investment opportunities quickly, Superior maintains sources of liquidity at the corporate and subsidiary levels. The main sources of liquidity are cash and other financial assets, the undrawn committed revolving term bank credit facility, equity markets and debenture markets. Superior is subject to the risks associated with debt financing, including the ability to refinance indebtedness at maturity. Superior believes these risks are mitigated through the use of long-term debt secured by high quality assets, maintaining debt levels that in management’s opinion are appropriate, and by diversifying maturities over an extended period. Superior also seeks to include in its agreements terms that protect it from liquidity issues of counterparties that might otherwise affect liquidity.
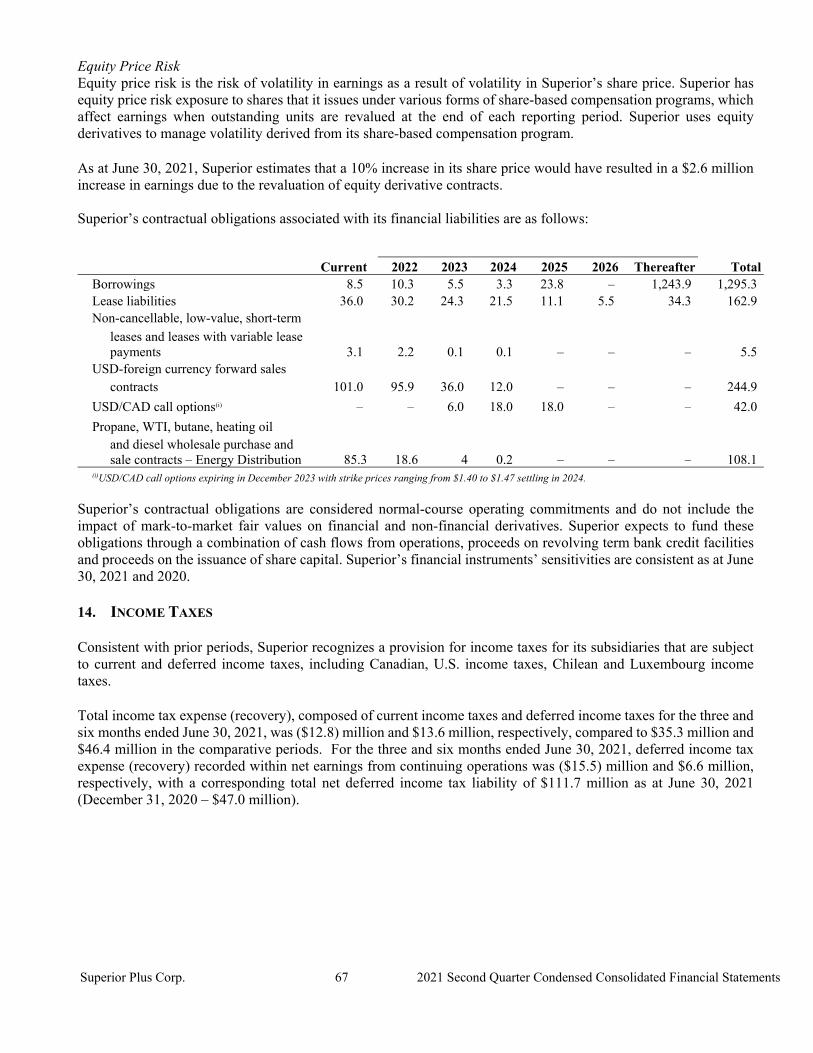
Superior Plus Corp. 67 2021 Second Quarter Condensed Consolidated Financial Statements
Equity Price Risk Equity price risk is the risk of volatility in earnings as a result of volatility in Superior’s share price. Superior has equity price risk exposure to shares that it issues under various forms of share-based compensation programs, which affect earnings when outstanding units are revalued at the end of each reporting period. Superior uses equity derivatives to manage volatility derived from its share-based compensation program. As at June 30, 2021, Superior estimates that a 10% increase in its share price would have resulted in a $2.6 million increase in earnings due to the revaluation of equity derivative contracts. Superior’s contractual obligations associated with its financial liabilities are as follows:
Current 2022 2023 2024 2025 2026 Thereafter Total Borrowings 8.5 10.3 5.5 3.3 23.8 – 1,243.9 1,295.3 Lease liabilities 36.0 30.2 24.3 21.5 11.1 5.5 34.3 162.9 Non-cancellable, low-value, short-term
leases and leases with variable lease payments 3.1 2.2 0.1 0.1 – – – 5.5
USD-foreign currency forward sales contracts 101.0 95.9 36.0 12.0 – – – 244.9
USD/CAD call options(i) – – 6.0 18.0 18.0 – – 42.0
Propane, WTI, butane, heating oil
and diesel wholesale purchase and sale contracts – Energy Distribution 85.3 18.6 4 0.2 – – – 108.1
(i)USD/CAD call options expiring in December 2023 with strike prices ranging from $1.40 to $1.47 settling in 2024.
Superior’s contractual obligations are considered normal-course operating commitments and do not include the impact of mark-to-market fair values on financial and non-financial derivatives. Superior expects to fund these obligations through a combination of cash flows from operations, proceeds on revolving term bank credit facilities and proceeds on the issuance of share capital. Superior’s financial instruments’ sensitivities are consistent as at June 30, 2021 and 2020.
14. INCOME TAXES Consistent with prior periods, Superior recognizes a provision for income taxes for its subsidiaries that are subject to current and deferred income taxes, including Canadian, U.S. income taxes, Chilean and Luxembourg income taxes. Total income tax expense (recovery), composed of current income taxes and deferred income taxes for the three and six months ended June 30, 2021, was ($12.8) million and $13.6 million, respectively, compared to $35.3 million and $46.4 million in the comparative periods. For the three and six months ended June 30, 2021, deferred income tax expense (recovery) recorded within net earnings from continuing operations was ($15.5) million and $6.6 million, respectively, with a corresponding total net deferred income tax liability of $111.7 million as at June 30, 2021 (December 31, 2020 – $47.0 million).
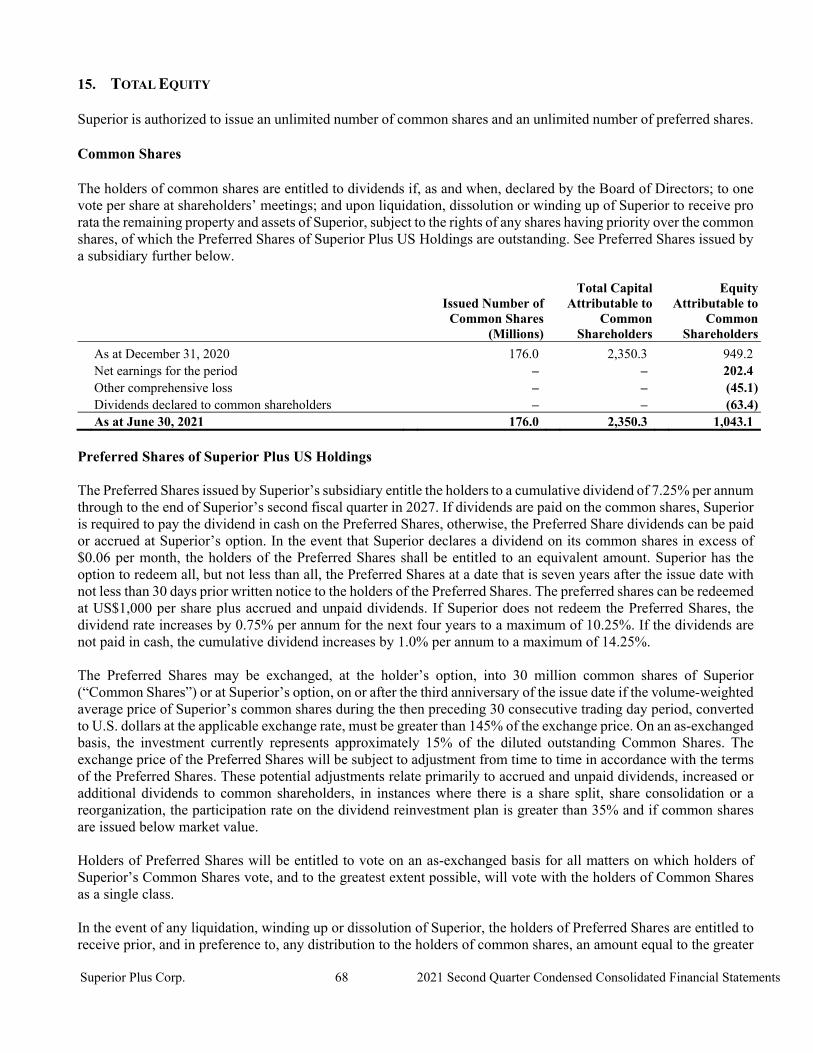
Superior Plus Corp. 68 2021 Second Quarter Condensed Consolidated Financial Statements
15. TOTAL EQUITY Superior is authorized to issue an unlimited number of common shares and an unlimited number of preferred shares. Common Shares The holders of common shares are entitled to dividends if, as and when, declared by the Board of Directors; to one vote per share at shareholders’ meetings; and upon liquidation, dissolution or winding up of Superior to receive pro rata the remaining property and assets of Superior, subject to the rights of any shares having priority over the common shares, of which the Preferred Shares of Superior Plus US Holdings are outstanding. See Preferred Shares issued by a subsidiary further below.
Issued Number of Common Shares
(Millions)
Total Capital Attributable to
Common Shareholders
Equity Attributable to
Common Shareholders
As at December 31, 2020 176.0 2,350.3 949.2 Net earnings for the period – – 202.4 Other comprehensive loss – – (45.1) Dividends declared to common shareholders – – (63.4) As at June 30, 2021 176.0 2,350.3 1,043.1
Preferred Shares of Superior Plus US Holdings The Preferred Shares issued by Superior’s subsidiary entitle the holders to a cumulative dividend of 7.25% per annum through to the end of Superior’s second fiscal quarter in 2027. If dividends are paid on the common shares, Superior is required to pay the dividend in cash on the Preferred Shares, otherwise, the Preferred Share dividends can be paid or accrued at Superior’s option. In the event that Superior declares a dividend on its common shares in excess of $0.06 per month, the holders of the Preferred Shares shall be entitled to an equivalent amount. Superior has the option to redeem all, but not less than all, the Preferred Shares at a date that is seven years after the issue date with not less than 30 days prior written notice to the holders of the Preferred Shares. The preferred shares can be redeemed at US$1,000 per share plus accrued and unpaid dividends. If Superior does not redeem the Preferred Shares, the dividend rate increases by 0.75% per annum for the next four years to a maximum of 10.25%. If the dividends are not paid in cash, the cumulative dividend increases by 1.0% per annum to a maximum of 14.25%. The Preferred Shares may be exchanged, at the holder’s option, into 30 million common shares of Superior (“Common Shares”) or at Superior’s option, on or after the third anniversary of the issue date if the volume-weighted average price of Superior’s common shares during the then preceding 30 consecutive trading day period, converted to U.S. dollars at the applicable exchange rate, must be greater than 145% of the exchange price. On an as-exchanged basis, the investment currently represents approximately 15% of the diluted outstanding Common Shares. The exchange price of the Preferred Shares will be subject to adjustment from time to time in accordance with the terms of the Preferred Shares. These potential adjustments relate primarily to accrued and unpaid dividends, increased or additional dividends to common shareholders, in instances where there is a share split, share consolidation or a reorganization, the participation rate on the dividend reinvestment plan is greater than 35% and if common shares are issued below market value. Holders of Preferred Shares will be entitled to vote on an as-exchanged basis for all matters on which holders of Superior’s Common Shares vote, and to the greatest extent possible, will vote with the holders of Common Shares as a single class. In the event of any liquidation, winding up or dissolution of Superior, the holders of Preferred Shares are entitled to receive prior, and in preference to, any distribution to the holders of common shares, an amount equal to the greater
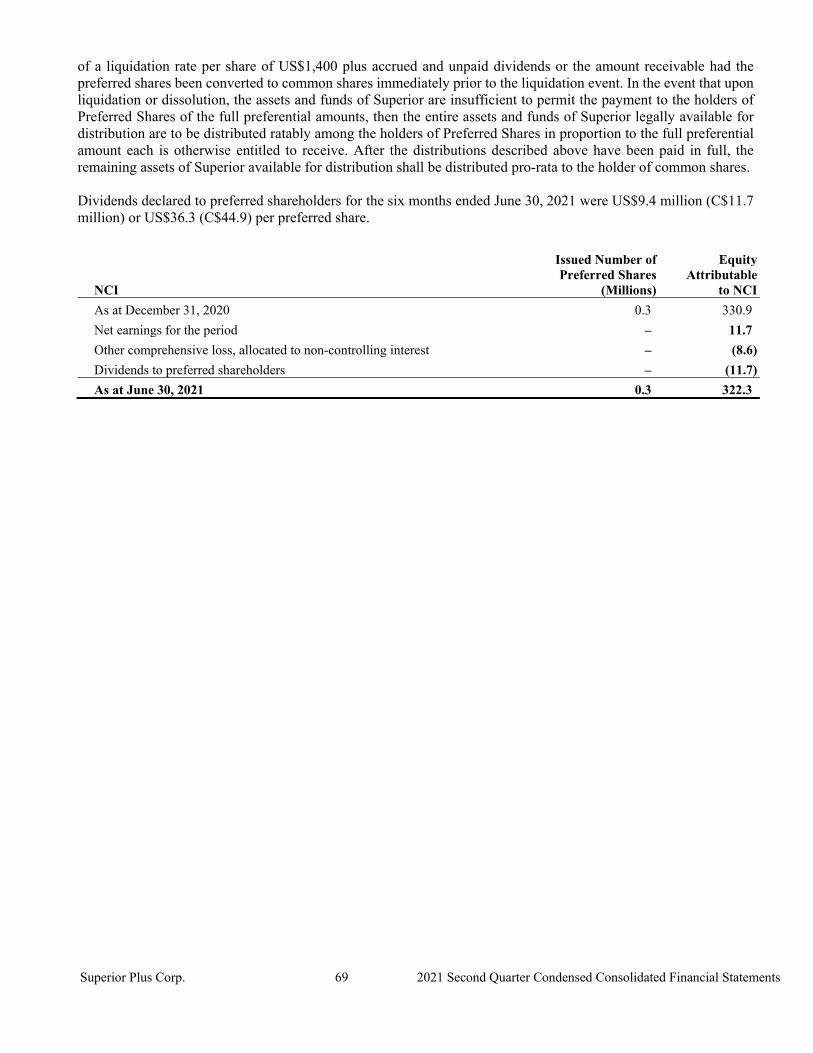
Superior Plus Corp. 69 2021 Second Quarter Condensed Consolidated Financial Statements
of a liquidation rate per share of US$1,400 plus accrued and unpaid dividends or the amount receivable had the preferred shares been converted to common shares immediately prior to the liquidation event. In the event that upon liquidation or dissolution, the assets and funds of Superior are insufficient to permit the payment to the holders of Preferred Shares of the full preferential amounts, then the entire assets and funds of Superior legally available for distribution are to be distributed ratably among the holders of Preferred Shares in proportion to the full preferential amount each is otherwise entitled to receive. After the distributions described above have been paid in full, the remaining assets of Superior available for distribution shall be distributed pro-rata to the holder of common shares. Dividends declared to preferred shareholders for the six months ended June 30, 2021 were US$9.4 million (C$11.7 million) or US$36.3 (C$44.9) per preferred share.
NCI
Issued Number of Preferred Shares
(Millions)
Equity Attributable
to NCI
As at December 31, 2020 1 0.3 330.9
Net earnings for the period – 11.7
Other comprehensive loss, allocated to non-controlling interest – (8.6)
Dividends to preferred shareholders – (11.7)
As at June 30, 2021 0.3 322.3
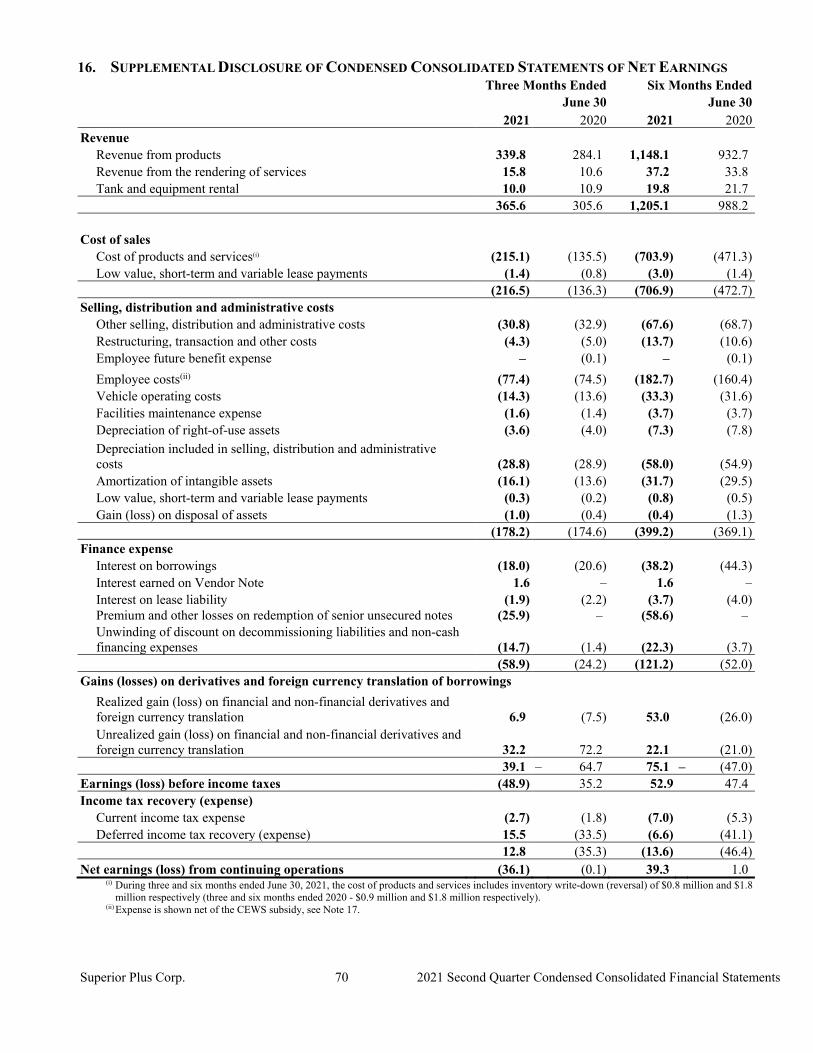
Superior Plus Corp. 70 2021 Second Quarter Condensed Consolidated Financial Statements
16. SUPPLEMENTAL DISCLOSURE OF CONDENSED CONSOLIDATED STATEMENTS OF NET EARNINGS Three Months Ended Six Months Ended June 30 June 30 2021 2020 2021 2020 Revenue Revenue from products 339.8 284.1 1,148.1 932.7 Revenue from the rendering of services 15.8 10.6 37.2 33.8 Tank and equipment rental 10.0 10.9 19.8 21.7 365.6 305.6 1,205.1 988.2 Cost of sales Cost of products and services(i) (215.1) (135.5) (703.9) (471.3) Low value, short-term and variable lease payments (1.4) (0.8) (3.0) (1.4) (216.5) (136.3) (706.9) (472.7) Selling, distribution and administrative costs Other selling, distribution and administrative costs (30.8) (32.9) (67.6) (68.7) Restructuring, transaction and other costs (4.3) (5.0) (13.7) (10.6) Employee future benefit expense – (0.1) – (0.1)
Employee costs(ii) (77.4) (74.5) (182.7) (160.4) Vehicle operating costs (14.3) (13.6) (33.3) (31.6) Facilities maintenance expense (1.6) (1.4) (3.7) (3.7) Depreciation of right-of-use assets (3.6) (4.0) (7.3) (7.8)
Depreciation included in selling, distribution and administrative costs (28.8) (28.9) (58.0) (54.9)
Amortization of intangible assets (16.1) (13.6) (31.7) (29.5) Low value, short-term and variable lease payments (0.3) (0.2) (0.8) (0.5) Gain (loss) on disposal of assets (1.0) (0.4) (0.4) (1.3) (178.2) (174.6) (399.2) (369.1) Finance expense Interest on borrowings (18.0) (20.6) (38.2) (44.3) Interest earned on Vendor Note 1.6 – 1.6 – Interest on lease liability (1.9) (2.2) (3.7) (4.0) Premium and other losses on redemption of senior unsecured notes (25.9) – (58.6) –
Unwinding of discount on decommissioning liabilities and non-cash financing expenses (14.7) (1.4) (22.3) (3.7)
(58.9) (24.2) (121.2) (52.0) Gains (losses) on derivatives and foreign currency translation of borrowings
Realized gain (loss) on financial and non-financial derivatives and foreign currency translation 6.9 (7.5) 53.0 (26.0)
Unrealized gain (loss) on financial and non-financial derivatives and foreign currency translation 32.2 72.2 22.1 (21.0)
39.1 – 64.7 75.1 – (47.0) Earnings (loss) before income taxes (48.9) 35.2 52.9 47.4 Income tax recovery (expense) Current income tax expense (2.7) (1.8) (7.0) (5.3) Deferred income tax recovery (expense) 15.5 (33.5) (6.6) (41.1) 12.8 (35.3) (13.6) (46.4) Net earnings (loss) from continuing operations (36.1) (0.1) 39.3 1.0
(i) During three and six months ended June 30, 2021, the cost of products and services includes inventory write-down (reversal) of $0.8 million and $1.8 million respectively (three and six months ended 2020 - $0.9 million and $1.8 million respectively).
(ii) Expense is shown net of the CEWS subsidy, see Note 17.
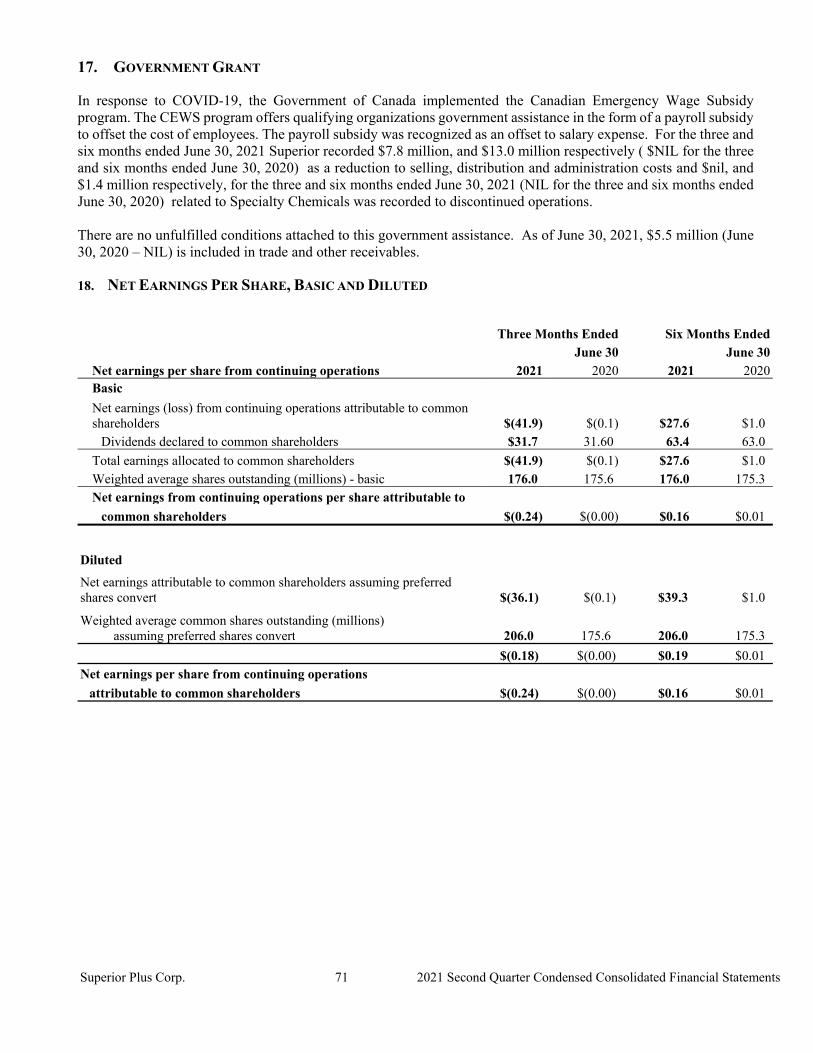
Superior Plus Corp. 71 2021 Second Quarter Condensed Consolidated Financial Statements
17. GOVERNMENT GRANT
In response to COVID-19, the Government of Canada implemented the Canadian Emergency Wage Subsidy program. The CEWS program offers qualifying organizations government assistance in the form of a payroll subsidy to offset the cost of employees. The payroll subsidy was recognized as an offset to salary expense. For the three and six months ended June 30, 2021 Superior recorded $7.8 million, and $13.0 million respectively ( $NIL for the three and six months ended June 30, 2020) as a reduction to selling, distribution and administration costs and $nil, and $1.4 million respectively, for the three and six months ended June 30, 2021 (NIL for the three and six months ended June 30, 2020) related to Specialty Chemicals was recorded to discontinued operations. There are no unfulfilled conditions attached to this government assistance. As of June 30, 2021, $5.5 million (June 30, 2020 – NIL) is included in trade and other receivables. 18. NET EARNINGS PER SHARE, BASIC AND DILUTED
Three Months Ended Six Months Ended June 30 June 30 Net earnings per share from continuing operations 2021 2020 2021 2020 Basic
Net earnings (loss) from continuing operations attributable to common shareholders $(41.9) $(0.1) $27.6 $1.0
Dividends declared to common shareholders $31.7 31.60 63.4 63.0
Total earnings allocated to common shareholders $(41.9) $(0.1) $27.6 $1.0 Weighted average shares outstanding (millions) - basic 176.0 175.6 176.0 175.3 Net earnings from continuing operations per share attributable to
common shareholders $(0.24) $(0.00) $0.16 $0.01
Diluted
Net earnings attributable to common shareholders assuming preferred shares convert $(36.1) $(0.1) $39.3 $1.0
Weighted average common shares outstanding (millions) assuming preferred shares convert 206.0 175.6 206.0 175.3
$(0.18) $(0.00) $0.19 $0.01 Net earnings per share from continuing operations
attributable to common shareholders $(0.24) $(0.00) $0.16 $0.01
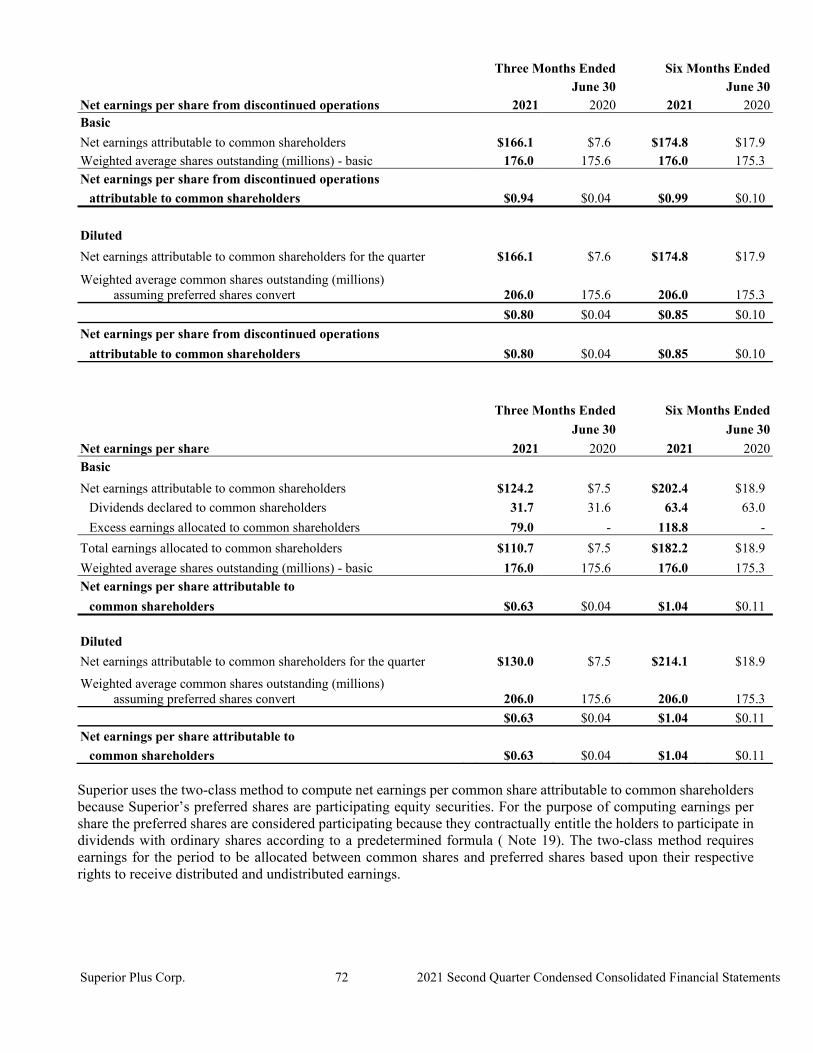
Superior Plus Corp. 72 2021 Second Quarter Condensed Consolidated Financial Statements
Three Months Ended Six Months Ended June 30 June 30 Net earnings per share from discontinued operations 2021 2020 2021 2020 Basic Net earnings attributable to common shareholders $166.1 $7.6 $174.8 $17.9 Weighted average shares outstanding (millions) - basic 176.0 175.6 176.0 175.3 Net earnings per share from discontinued operations
attributable to common shareholders $0.94 $0.04 $0.99 $0.10
Diluted
Net earnings attributable to common shareholders for the quarter $166.1 $7.6 $174.8 $17.9
Weighted average common shares outstanding (millions) assuming preferred shares convert 206.0 175.6 206.0 175.3
$0.80 $0.04 $0.85 $0.10
Net earnings per share from discontinued operations
attributable to common shareholders $0.80 $0.04 $0.85 $0.10
Three Months Ended Six Months Ended
June 30 June 30
Net earnings per share 2021 2020 2021 2020 Basic
Net earnings attributable to common shareholders $124.2 $7.5 $202.4 $18.9
Dividends declared to common shareholders 31.7 31.6 63.4 63.0
Excess earnings allocated to common shareholders 79.0 - 118.8 -
Total earnings allocated to common shareholders $110.7 $7.5 $182.2 $18.9
Weighted average shares outstanding (millions) - basic 176.0 175.6 176.0 175.3 Net earnings per share attributable to
common shareholders $0.63 $0.04 $1.04 $0.11 Diluted Net earnings attributable to common shareholders for the quarter $130.0 $7.5 $214.1 $18.9
Weighted average common shares outstanding (millions) assuming preferred shares convert 206.0 175.6 206.0 175.3
$0.63 $0.04 $1.04 $0.11 Net earnings per share attributable to
common shareholders $0.63 $0.04 $1.04 $0.11 Superior uses the two-class method to compute net earnings per common share attributable to common shareholders because Superior’s preferred shares are participating equity securities. For the purpose of computing earnings per share the preferred shares are considered participating because they contractually entitle the holders to participate in dividends with ordinary shares according to a predetermined formula ( Note 19). The two-class method requires earnings for the period to be allocated between common shares and preferred shares based upon their respective rights to receive distributed and undistributed earnings.
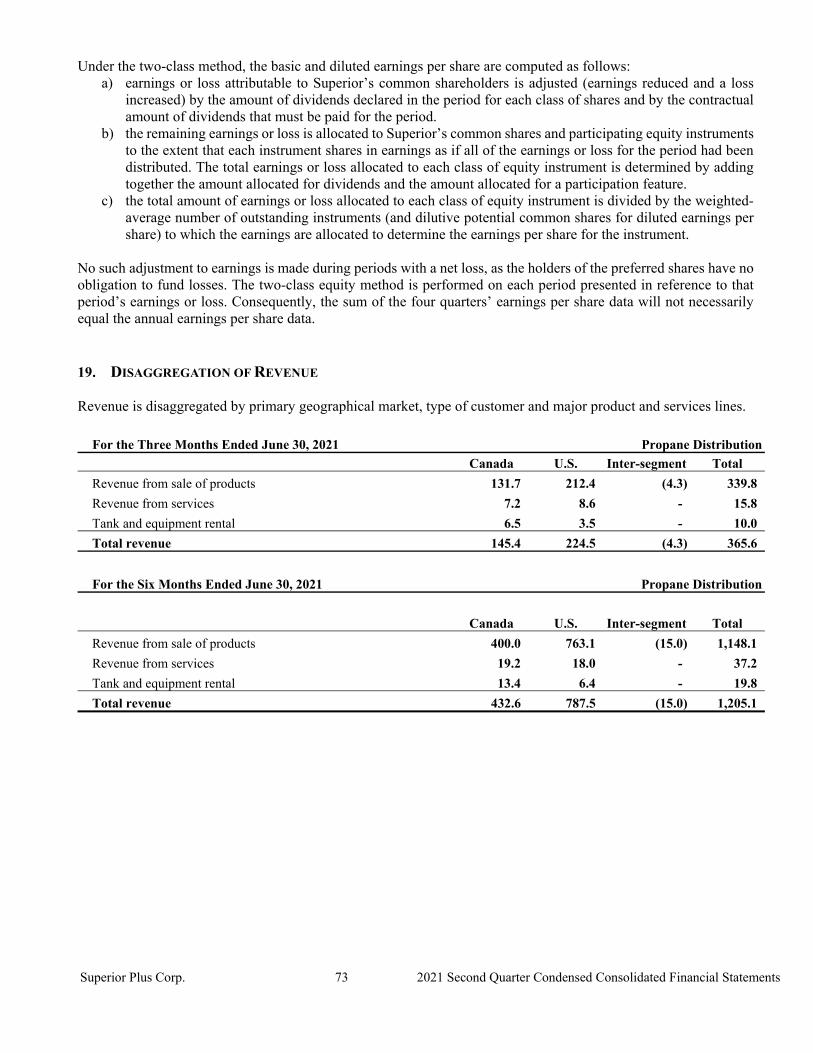
Superior Plus Corp. 73 2021 Second Quarter Condensed Consolidated Financial Statements
Under the two-class method, the basic and diluted earnings per share are computed as follows: a) earnings or loss attributable to Superior’s common shareholders is adjusted (earnings reduced and a loss
increased) by the amount of dividends declared in the period for each class of shares and by the contractual amount of dividends that must be paid for the period.
b) the remaining earnings or loss is allocated to Superior’s common shares and participating equity instruments to the extent that each instrument shares in earnings as if all of the earnings or loss for the period had been distributed. The total earnings or loss allocated to each class of equity instrument is determined by adding together the amount allocated for dividends and the amount allocated for a participation feature.
c) the total amount of earnings or loss allocated to each class of equity instrument is divided by the weighted-average number of outstanding instruments (and dilutive potential common shares for diluted earnings per share) to which the earnings are allocated to determine the earnings per share for the instrument.
No such adjustment to earnings is made during periods with a net loss, as the holders of the preferred shares have no obligation to fund losses. The two-class equity method is performed on each period presented in reference to that period’s earnings or loss. Consequently, the sum of the four quarters’ earnings per share data will not necessarily equal the annual earnings per share data.
19. DISAGGREGATION OF REVENUE Revenue is disaggregated by primary geographical market, type of customer and major product and services lines.
For the Three Months Ended June 30, 2021 Propane Distribution
Canada U.S. Inter-segment Total
Revenue from sale of products 131.7 212.4 (4.3) 339.8
Revenue from services 7.2 8.6 - 15.8
Tank and equipment rental 6.5 3.5 - 10.0
Total revenue 145.4 224.5 (4.3) 365.6
For the Six Months Ended June 30, 2021 Propane Distribution
Canada U.S. Inter-segment Total
Revenue from sale of products 400.0 763.1 (15.0) 1,148.1
Revenue from services 19.2 18.0 - 37.2
Tank and equipment rental 13.4 6.4 - 19.8
Total revenue 432.6 787.5 (15.0) 1,205.1
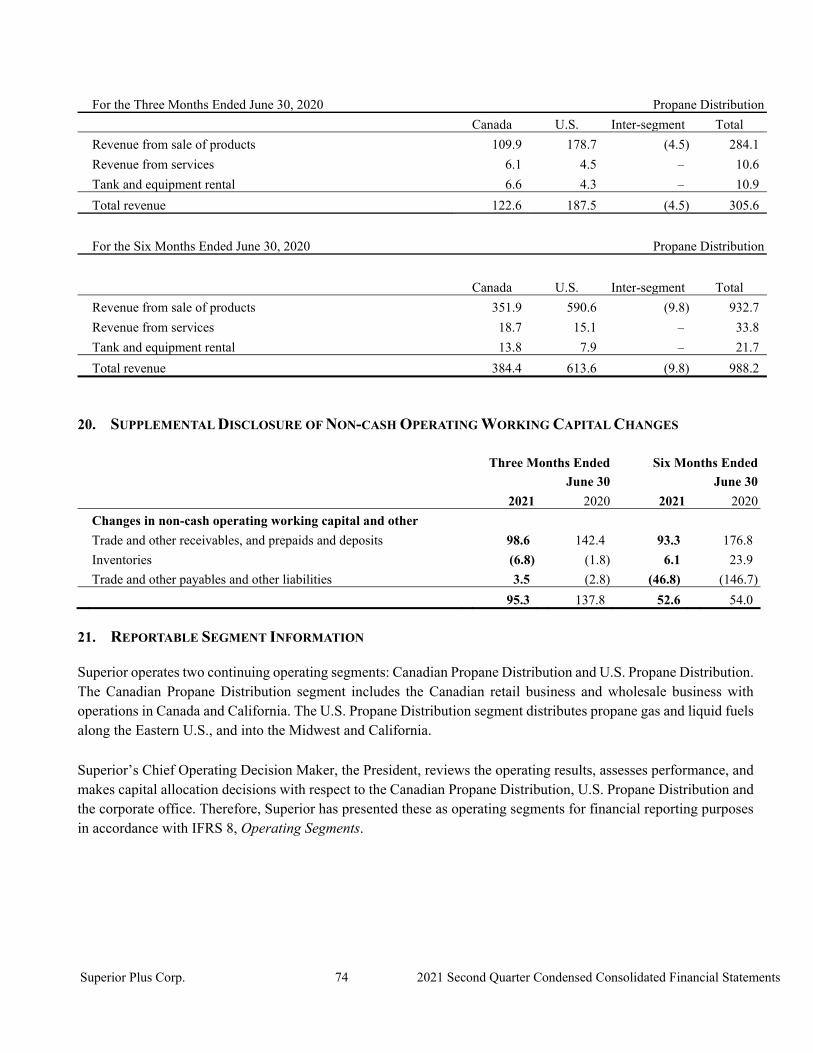
Superior Plus Corp. 74 2021 Second Quarter Condensed Consolidated Financial Statements
For the Three Months Ended June 30, 2020 Propane Distribution
Canada U.S. Inter-segment Total
Revenue from sale of products 109.9 178.7 (4.5) 284.1
Revenue from services 6.1 4.5 – 10.6
Tank and equipment rental 6.6 4.3 – 10.9
Total revenue 122.6 187.5 (4.5) 305.6
For the Six Months Ended June 30, 2020 Propane Distribution
Canada U.S. Inter-segment Total
Revenue from sale of products 351.9 590.6 (9.8) 932.7
Revenue from services 18.7 15.1 – 33.8
Tank and equipment rental 13.8 7.9 – 21.7
Total revenue 384.4 613.6 (9.8) 988.2
20. SUPPLEMENTAL DISCLOSURE OF NON-CASH OPERATING WORKING CAPITAL CHANGES
Three Months Ended Six Months Ended
June 30 June 30
2021 2020 2021 2020
Changes in non-cash operating working capital and other
Trade and other receivables, and prepaids and deposits 98.6 142.4 93.3 176.8
Inventories (6.8) (1.8) 6.1 23.9
Trade and other payables and other liabilities 3.5 (2.8) (46.8) (146.7)
95.3 137.8 52.6 54.0
21. REPORTABLE SEGMENT INFORMATION Superior operates two continuing operating segments: Canadian Propane Distribution and U.S. Propane Distribution. The Canadian Propane Distribution segment includes the Canadian retail business and wholesale business with operations in Canada and California. The U.S. Propane Distribution segment distributes propane gas and liquid fuels along the Eastern U.S., and into the Midwest and California.
Superior’s Chief Operating Decision Maker, the President, reviews the operating results, assesses performance, and makes capital allocation decisions with respect to the Canadian Propane Distribution, U.S. Propane Distribution and the corporate office. Therefore, Superior has presented these as operating segments for financial reporting purposes in accordance with IFRS 8, Operating Segments.
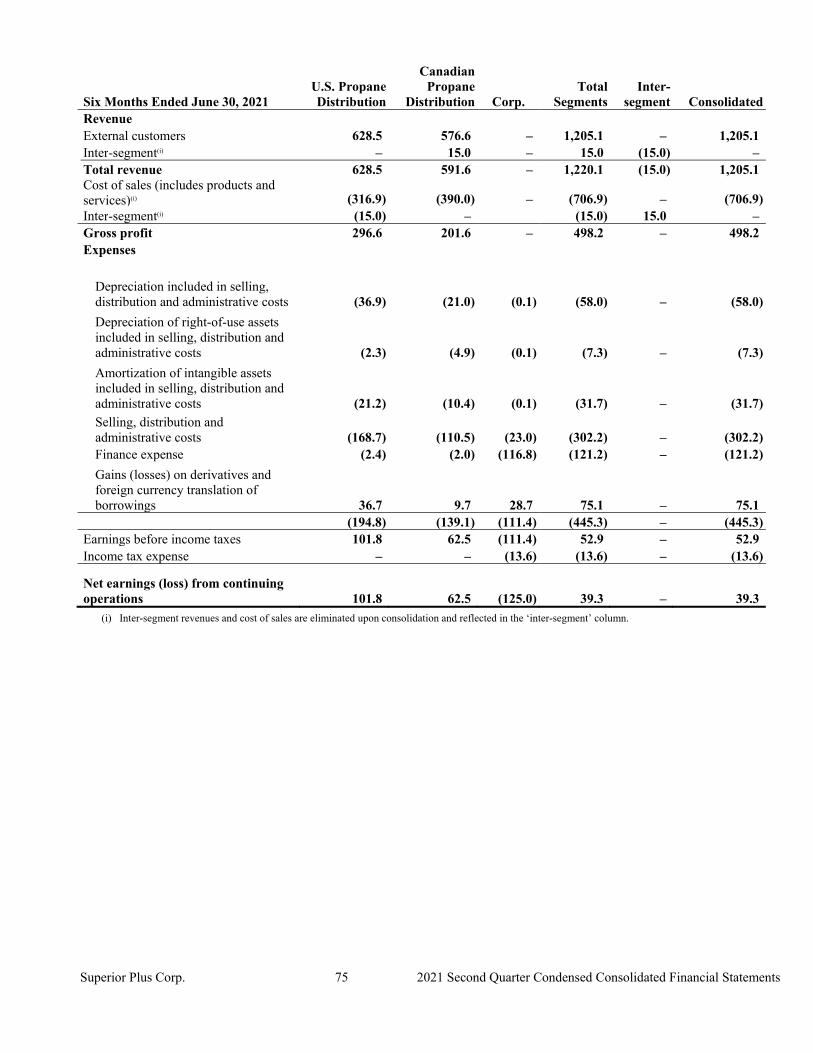
Superior Plus Corp. 75 2021 Second Quarter Condensed Consolidated Financial Statements
Six Months Ended June 30, 2021 U.S. Propane Distribution
Canadian Propane
Distribution Corp. Total
Segments Inter-
segment Consolidated Revenue External customers 628.5 576.6 – 1,205.1 – 1,205.1 Inter-segment(i) – 15.0 – 15.0 (15.0) – Total revenue 628.5 591.6 – 1,220.1 (15.0) 1,205.1
Cost of sales (includes products and services)(i) (316.9) (390.0) – (706.9) – (706.9)
Inter-segment(i) (15.0) – (15.0) 15.0 – Gross profit 296.6 201.6 – 498.2 – 498.2 Expenses
Depreciation included in selling, distribution and administrative costs (36.9) (21.0) (0.1) (58.0) – (58.0)
Depreciation of right-of-use assets included in selling, distribution and administrative costs (2.3) (4.9) (0.1) (7.3) – (7.3)
Amortization of intangible assets included in selling, distribution and administrative costs (21.2) (10.4) (0.1) (31.7) – (31.7)
Selling, distribution and administrative costs (168.7) (110.5) (23.0) (302.2) – (302.2)
Finance expense (2.4) (2.0) (116.8) (121.2) – (121.2)
Gains (losses) on derivatives and foreign currency translation of borrowings 36.7 9.7 28.7 75.1 – 75.1
(194.8) (139.1) (111.4) (445.3) – (445.3) Earnings before income taxes 101.8 62.5 (111.4) 52.9 – 52.9 Income tax expense – – (13.6) (13.6) – (13.6)
Net earnings (loss) from continuing operations 101.8 62.5 (125.0) 39.3 – 39.3
(i) Inter-segment revenues and cost of sales are eliminated upon consolidation and reflected in the ‘inter-segment’ column.

Superior Plus Corp. 76 2021 Second Quarter Condensed Consolidated Financial Statements
Three Months Ended June 30, 2021 U.S. Propane Distribution
Canadian Propane
Distribution Corp. Total
Segments Inter-
segment Consolidated Revenue External customers 174.1 191.5 – 365.6 – 365.6 Inter-segment(i) – 4.4 – 4.4 (4.4) – Total revenue 174.1 195.9 – 370.0 (4.4) 365.6
Cost of sales (includes products and services)(i) (89.1) (127.4) – (216.5) (216.5)
Inter-segment(i) (4.4) – (4.4) 4.4 – Gross profit 80.6 68.5 – 149.1 – 149.1
Depreciation included in selling, distribution and administrative costs (17.9) (10.8) (0.1) (28.8) (28.8)
Depreciation of right-of-use assets included in selling, distribution and administrative costs (1.1) (2.4) (0.1) (3.6) (3.6)
Amortization of intangible assets included in selling, distribution and administrative costs (10.8) (5.3) (0.0) (16.1) (16.1)
Selling, distribution and administrative costs (72.1) (48.0) (9.6) (129.7) (129.7)
Finance expense (1.2) (1.1) (56.6) (58.9) (58.9)
Gains (losses) on derivatives and foreign currency translation of borrowings 18.0 6.1 15.0 39.1 39.1
(85.1) (61.5) (51.4) (198.0) – (198.0) Earnings (loss) before income taxes (4.5) 7.0 (51.4) (48.9) – (48.9) Income tax recovery 12.8 12.8 12.8
Net earnings (loss) from continuing operations (4.5) 7.0 (38.6) (36.1) – (36.1)
(i) Inter-segment revenues and cost of sales are eliminated upon consolidation and reflected in the ‘inter-segment’ column.

Superior Plus Corp. 77 2021 Second Quarter Condensed Consolidated Financial Statements
Six Months Ended June 30, 2020 U.S. Propane Distribution
Canadian Propane
Distribution Corp. Total
Segments Inter-
segment Consolidated Revenue External customers 492.3 495.9 – 988.2 – 988.2 Inter-segment(i) – 9.8 – 9.8 (9.8) – Total revenue 492.3 505.7 – 998.0 (9.8) 988.2
Cost of sales (includes products and services) (i) (192.8) (279.9) – (472.7) – (472.7)
Inter-segment(i) (9.8) - – (9.8) 9.8 – Gross profit 289.7 225.8 – 515.5 – 515.5
Depreciation included in selling, distribution and administrative costs (33.6) (21.1) (0.2) (54.9) – (54.9)
Depreciation of right-of-use assets included in selling, distribution and administrative costs (2.5) (5.2) (0.1) (7.8) – (7.8)
Amortization of intangible assets included in selling, distribution and administrative costs (18.9) (10.6) – (29.5) – (29.5)
Selling, distribution and administrative costs (150.1) (115.5) (11.3) (276.9) – (276.9) Finance expense (2.9) (2.4) (46.7) (52.0) – (52.0)
Gains (losses) on derivatives and foreign currency translation of borrowings (7.8) 0.1 (39.3) (47.0) – (47.0)
(215.8) (154.7) (97.6) (468.1) – (468.1) Earnings (loss) before income taxes 73.9 71.1 (97.6) 47.4 – 47.4 Income tax expense – – (46.4) (46.4) – (46.4)
Net earnings (loss) from continuing operations 73.9 71.1 (144.0) 1.0 – 1.0
(i) Inter-segment revenues and cost of sales are eliminated upon consolidation and reflected in the ‘inter-segment’ column.

Superior Plus Corp. 78 2021 Second Quarter Condensed Consolidated Financial Statements
Three Months Ended June 30, 2020 U.S. Propane Distribution
Canadian Propane
Distribution Corp. Total
Segments Inter-
segment Consolidated Revenue External customers 150.3 155.3 – 305.6 - 305.6 Inter-segment(i) – 4.5 – 4.5 (4.5) – Total revenue 150.3 159.8 - 310.1 (4.5) 305.6
Cost of sales (includes products and services) (i) (51.6) (84.7) - (136.3) - (136.3)
Inter-segment(i) (4.5) - - (4.5) 4.5 – Gross profit 94.2 75.1 - 169.3 - 169.3 Expenses
Depreciation included in selling, distribution and administrative costs (17.9) (10.9) (0.1) (28.9) (28.9)
Depreciation of right-of-use assets included in selling, distribution and administrative costs (1.3) (2.7) - (4.0) (4.0)
Amortization of intangible assets included in selling, distribution and administrative costs (8.6) (5.0) - (13.6) (13.6)
Selling, distribution and administrative costs (67.5) (51.7) (8.9) (128.1) (128.1) Finance expense (1.2) (1.0) (22.0) (24.2) (24.2)
Gains (losses) on derivatives and foreign currency translation of borrowings 11.7 6.3 46.7 64.7 64.7
(84.8) (65.0) 15.7 (134.1) - (134.1) Earnings (loss) before income taxes 9.4 10.1 15.7 35.2 - 35.2 Income tax expense – – (35.3) (35.3) - (35.3)
Net earnings (loss) from continuing operations 9.4 10.1 (19.6) (0.1) - (0.1)
(i) Inter-segment revenues and cost of sales are eliminated upon consolidation and reflected in the ‘inter-segment’ column.
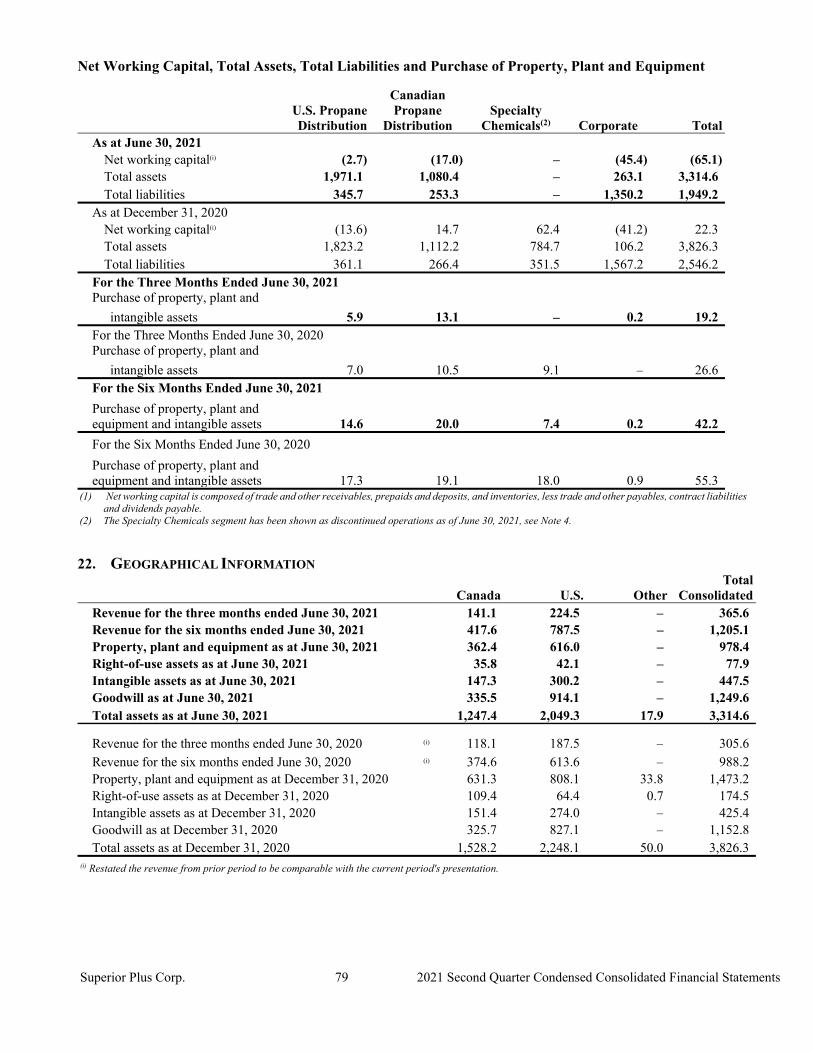
Superior Plus Corp. 79 2021 Second Quarter Condensed Consolidated Financial Statements
Net Working Capital, Total Assets, Total Liabilities and Purchase of Property, Plant and Equipment
U.S. Propane Distribution
Canadian Propane
Distribution Specialty
Chemicals(2) Corporate Total As at June 30, 2021 Net working capital(i) (2.7) (17.0) – (45.4) (65.1) Total assets 1,971.1 1,080.4 – 263.1 3,314.6 Total liabilities 345.7 253.3 – 1,350.2 1,949.2 As at December 31, 2020 Net working capital(i) (13.6) 14.7 62.4 (41.2) 22.3 Total assets 1,823.2 1,112.2 784.7 106.2 3,826.3 Total liabilities 361.1 266.4 351.5 1,567.2 2,546.2 For the Three Months Ended June 30, 2021 Purchase of property, plant and
intangible assets 5.9 13.1 – 0.2 19.2 For the Three Months Ended June 30, 2020 Purchase of property, plant and
intangible assets 7.0 10.5 9.1 – 26.6 For the Six Months Ended June 30, 2021 Purchase of property, plant and
equipment and intangible assets 14.6 20.0 7.4 0.2 42.2
For the Six Months Ended June 30, 2020 Purchase of property, plant and
equipment and intangible assets 17.3 19.1 18.0 0.9 55.3 (1) Net working capital is composed of trade and other receivables, prepaids and deposits, and inventories, less trade and other payables, contract liabilities
and dividends payable. (2) The Specialty Chemicals segment has been shown as discontinued operations as of June 30, 2021, see Note 4.
22. GEOGRAPHICAL INFORMATION
Canada U.S. Other Total
Consolidated Revenue for the three months ended June 30, 2021 141.1 224.5 – 365.6 Revenue for the six months ended June 30, 2021 417.6 787.5 – 1,205.1 Property, plant and equipment as at June 30, 2021 362.4 616.0 – 978.4 Right-of-use assets as at June 30, 2021 35.8 42.1 – 77.9 Intangible assets as at June 30, 2021 147.3 300.2 – 447.5 Goodwill as at June 30, 2021 335.5 914.1 – 1,249.6 Total assets as at June 30, 2021 1,247.4 2,049.3 17.9 3,314.6
Revenue for the three months ended June 30, 2020 (i) 118.1 187.5 – 305.6 Revenue for the six months ended June 30, 2020 (i) 374.6 613.6 – 988.2 Property, plant and equipment as at December 31, 2020 631.3 808.1 33.8 1,473.2 Right-of-use assets as at December 31, 2020 109.4 64.4 0.7 174.5 Intangible assets as at December 31, 2020 151.4 274.0 – 425.4 Goodwill as at December 31, 2020 325.7 827.1 – 1,152.8 Total assets as at December 31, 2020 1,528.2 2,248.1 50.0 3,826.3 (i) Restated the revenue from prior period to be comparable with the current period's presentation.

Superior Plus Corp. 80 2021 Second Quarter Condensed Consolidated Financial Statements
23. SUBSEQUENT EVENTS On July 7, 2021, Superior acquired the assets of a retail propane distribution company based in North Carolina, operating under the tradename, Williams Energy Group (“Williams Energy”) for an aggregate purchase price of approximately US $38.0 million (CDN $47.5 million) before adjustments for working capital. A preliminary purchase price allocation is not currently available. On July 14, 2021, Superior announced that one of its wholly owned subsidiaries has entered into an agreement to acquire the equity interest of Kamps Propane Inc., High Country Propane, Inc., Pick Up Propane, Inc., Kiva Energy, Inc., Competitive Capital, Inc. and Propane Construction and Meter Services (collectively, “Kamps”) for an aggregate purchase price of approximately US $240 million (CDN $299 million) before adjustments for working capital. A preliminary purchase price allocation is not currently available.