superionics: crystal structures and conduction … · institute of physics publishing reports on...
TRANSCRIPT

INSTITUTE OF PHYSICS PUBLISHING REPORTS ON PROGRESS IN PHYSICS
Rep. Prog. Phys. 67 (2004) 1233–1314 PII: S0034-4885(04)93704-9
Superionics: crystal structures and conductionprocesses
Stephen Hull
The ISIS Facility, Rutherford Appleton Laboratory, Chilton, Didcot, Oxon, OX11 0QX, UK
Received 16 February 2004Published 14 June 2004Online at stacks.iop.org/RoPP/67/1233doi:10.1088/0034-4885/67/7/R05
Abstract
Superionic conductors are compounds that exhibit exceptionally high values of ionicconductivity within the solid state. Indeed, their conductivities often reach values of theorder of 1 −1 cm−1, which are comparable to those observed in the molten state. FollowingFaraday’s first observation of high ionic conductivity within the solids β-PbF2 and Ag2S in1836, a fundamental understanding of the nature of the superionic state has provided oneof the major challenges in the field of condensed matter science. However, experimentaland theoretical approaches to their study are often made difficult by the extensive dynamicstructural disorder which characterizes superionic conduction and the inapplicability of manyof the commonly used approximations in solid state physics. Nevertheless, a clearer pictureof the nature of the superionic state at the ionic level has emerged within the past few decades.Many different techniques have contributed to these advances, but the most significant insightshave been provided by neutron scattering experiments and molecular dynamics simulations.This review will summarize the state of current knowledge concerning the crystal structuresand conduction processes of superionic conductors, beginning with a comparison of thebehaviour of two of the most widely studied binary compounds, AgI and β-PbF2. Eachcan be considered a parent of two larger families of highly conducting compounds which arerelated by either chemical or structural means. These include perovskite-structured oxides andLi+ containing spinel-structured compounds, which have important commercial applicationsin fuel cells and lightweight batteries, respectively. In parallel with these discussions, therelative importance of factors such as bonding character and the properties of the mobile andimmobile ions (charge, size, polarizability, etc) in promoting the extensive lattice disorderwhich characterizes superionic behaviour will be assessed and the possibilities for predictinga priori which compounds will display high ionic conductivity discussed.
(Some figures in this article are in colour only in the electronic version)
0034-4885/04/071233+82$90.00 © 2004 IOP Publishing Ltd Printed in the UK 1233

1234 S Hull
Contents
Page1. Introduction 12362. Two superionic compounds: AgI and PbF2 1237
2.1. Silver iodide: AgI 12372.2. Factors promoting superionic behaviour 12402.3. Lead fluoride: β-PbF2 12412.4. Type-I and type-II superionic transitions 12442.5. High pressure studies 1245
3. α-AgI: chemical and structural derivatives 12483.1. The family of Ag+ and Cu+ halide superionics 12483.2. The preferred cation sites in α-CuI 12503.3. The role of the immobile sublattice 12523.4. Ion–ion correlations: the Ag+ chalcogenides 12533.5. Stabilizing the α-AgI phase at ambient temperature 12553.6. The room temperature superionic: RbAg4I5 12573.7. The role of dopant cations: Ag2MI4, Ag3MI5 and Ag4MI6 compounds 12583.8. The α-AgI and perovskite structures: Ag3SI 12613.9. Perovskite-structured superionics: MPbF3 compounds 12623.10. Distortions of the cubic perovskite structure: halide perovskites 12653.11. Superionicity in the lower mantle: MgSiO3 12663.12. Selection criteria for high conductivity perovskites: BaCeO3 and LaGaO3 12673.13. Anion-deficient perovskites: Ba2In2O5 and MBi3O5.5 12683.14. Perovskite intergrowth structures: the BiMeVOx compounds 12693.15. B-site deficient perovskites: tysonite-structured LaF3 12713.16. A-site deficient perovskites: La2/3TiO3, La1/3NbO3 and WO3 12723.17. Double perovskites: cryolite-structured Na3AlF6 1274
4. β-PbF2: chemical and structural derivatives 12754.1. The concentration of Frenkel defects 12764.2. The role of cation polarizability 12784.3. Ternary layered fluorite: PbSnF4 12784.4. Cuboctahedral defects: (K1−xBix)F1+2x and (Rb1−xBix)F1+2x 12804.5. Non-stoichiometric fluorites 12814.6. Anion-excess fluorite: (Ca1−xYx)F2+x 12824.7. Anion-deficient fluorite: (Zr1−xYx)O2−x/2 12854.8. Pyrochlore-structured superionics: Zr2M2O7 compounds 12884.9. Heavily defective fluorite: Bi2O3 12904.10. Oxide fluorites: superionicity in UO2 12914.11. The effect of ionic size: anti-fluorite Li2O 12934.12. The ‘paddle-wheel’ and ‘percolation’ mechanisms in α-Li2SO4 12944.13. Spinel-structured superionics: Li2MCl4 compounds 12954.14. Lithium battery applications: LixMn2O4 1297

Crystal structures and conduction processes 1235
4.15. Superionics based on an hcp sublattice: the LISICONs 12984.16. The tetragonal-packed sublattice: Li4SiO4 and Li4GeO4 1298
5. Summary and conclusions 1300Acknowledgments 1301References 1302
1236 S Hull
1. Introduction
Sodium chloride, NaCl, is a typical example of a ‘normal’ ionic solid. At ambient temperature,nominally pure NaCl has an ionic conductivity σi less than ∼10−8 −1 cm−1, the finite valuebeing primarily due to the presence of extrinsic defects associated with cation impurities(see, e.g. [1]). As illustrated in figure 1, σi increases with temperature above ∼500 K as ionictransport becomes dominated by an increasing concentration of intrinsic, thermally activatedSchottky defects, reaching a value of ∼10−5 −1 cm−1 immediately below the melting pointof 1074 K. On melting, σi increases abruptly by around five orders of magnitude, to a value≈3 −1 cm−1 [2].
The first reports of compounds that possess exceptionally high (‘liquid-like’) values ofionic conductivity within the solid state were given by Faraday in the first half of the 19thcentury. In the case of the ‘fluoride of lead’, the extraordinary nature of this behaviour is clearfrom the original text [3]:
‘When a piece of that substance, which had been fused and cooled, was introducedinto the circuit of a voltaic battery, it stopped the current. Being heated, it acquiredconducting powers before it was visibly red hot in daylight. . ..’
β-PbF2 is just one example of a collection of highly conducting solids, which subsequentlybecome known as ‘superionic’ or ‘fast-ionic’ conductors. As shown in figure 1, thereis a continuous and rapid increase in the ionic conductivity of β-PbF2 with temperature.However, σi levels off above ∼700 K at a value of ≈4 −1 cm−1 and, remarkably, showsno measurable change on melting at 1158 K [4–6]. The behaviour of another widely studiedsuperionic compound, AgI, is rather different. At 420 K it undergoes an abrupt increasein σi of over three orders of magnitude associated with a solid → solid phase transition(see figure 1). In the high temperature superionic phase (labelled α-AgI) σi is again very high(σi ≈ 2 −1 cm−1), increases only slowly with temperature and actually decreases by ∼10%on melting at 829 K [7].
The next section of this review will provide a more detailed description of both AgIand β-PbF2, including a comparison of their behaviour, followed by two sections giving adiscussion of the properties of many other highly conducting compounds. The primary aim hereis to summarize the current state of knowledge concerning the crystal structures of the varioussuperionic compounds and the associated thermally induced lattice disorder that underlies thehigh macroscopic ionic conductivity. A comprehensive survey of the entire literature relatingto superionic conductors would be a mammoth undertaking more appropriate to a dedicatedtextbook than a review in Reports on Progress in Physics. Inevitably, the descriptions will berather general in nature and restricted to systems in which the ionic migration occurs in threedimensions throughout the bulk of the material1.
Previous reviews of this subject have categorized the known superionic conductorsaccording to their technological function [23], the nature of the transition to the highlyconducting state (abrupt or continuous) [24], their constituent chemical species [25] or crystalstructures [26]. The rather haphazard scheme suggested by the Contents list of this reviewhas been devised to highlight the similarities, rather than differences, between the variouscompounds. This provides a convenient approach when assessing the relative importance ofthe crystal structure and the properties of the ions themselves (size, charge, polarizability, etc)
1 As a consequence, a number of interesting systems in which the ionic motion is restricted to essentially isolatedone-dimensional channels or two-dimensional planes will be ignored. These include hollandite-structured oxides[8, 9] and the β-aluminas [10, 11], respectively. Similarly, there will be only limited discussion of inhomogeneousmaterials (such as nanometre-scale planar heterostructures [12, 13]), nano-structured materials [14, 15] or materials inwhich the crystallinity is low (including polymer electrolytes [16–19]) or absent (such as superionic glasses [20–22]).

Crystal structures and conduction processes 1237
Figure 1. The variation of the ionic conductivities of NaCl, β-PbF2 and AgI with temperature.The vertical arrows denote the melting points of each compound (schematic compilation using datareported in [1, 2], [4–6] and [7], respectively).
in promoting high ionic conductivity and, in the process, provides clues to the wider questionof why some compounds (such as AgI and PbF2) display superionic behaviour and others(such as NaCl) do not. Of course, superionic conductors are not merely scientific curiositiesand such issues are central to the quest to identify new highly conducting solids for rapidlyexpanding technological applications within lightweight solid state batteries, high power fuelcells and fast-response gas sensors. These ‘applied’ aspects of superionic compounds havebeen the subject of many review articles (for recent examples, see [27–30], [31–34], [35, 36],respectively) and will not, therefore, be discussed in any detail here.
2. Two superionic compounds: AgI and PbF2
Textbooks in solid state chemistry and physics invariably include a section describingsuperionic compounds using one, or both, of the compounds AgI and β-PbF2 as ‘typical’examples. Whilst their impressive high temperature ionic conductivities are well documented,a widely accepted picture of their crystal structures within the superionic state has only emergedwithin the last ten years or so.
2.1. Silver iodide: AgI
Silver iodide, AgI, usually exists as a mixture of the β and γ phases under ambient conditions,which possess the hexagonal wurtzite (P63mc [37]) and cubic zincblende (F43m [38]) crystalstructures, respectively. As illustrated in figure 1, AgI undergoes an abrupt superionic transitionat 420 K [7]. Within the superionic α phase the ionic conductivity is predominantly due to themotion of Ag+, the electronic component σe being ∼107 times lower [39].
The earliest description of the disordered arrangement of ions within superionic α-AgI wasprovided by powder diffraction studies using x-ray radiation [40]. The I− were found to adopta body-centred cubic (bcc) arrangement (space group Im3m). This anion sublattice contains anumber of interstices available as sites for the Ag+, labelled according to the anion co-ordinationof a cation placed at their centre. Specifically, there are 6 octahedral (oct), 12 tetrahedral (tet)

1238 S Hull
a
b.c.c. I
tet
oct
trig
–
Figure 2. The crystal structure of α-AgI, showing the bcc anion sublattice and the locations ofthe octahedral (oct), tetrahedral (tet) and trigonal (trig) interstices. The tet sites are predominantlyoccupied by Ag+ (see section 2.1) and diffusion occurs via the trig sites in the 〈110〉 directionsshown (after [52]). The cubic lattice parameter a is illustrated. Copyright (1993), with permissionfrom Elsevier.
and 24 trigonal (trig) interstices per unit cell2 (see figure 2) and the two Ag+ per unit cellwere proposed to be randomly distributed over all of these 42 positions [40, 41]. This highlydisordered picture approximates to a uniform distribution of cations over all the free volumenot occupied by anions and, coupled with the high values of ionic conductivity [7], encouragedthe use of terms such as ‘molten sublattice’ and ‘liquid-like’ to describe α-AgI. Such notionswere also adopted to discuss the behaviour of other superionic conductors, with the possibilityof some form of ‘two stage melting’ supported by similarities between the entropy changesat the superionic and melting transitions [42]. However, subsequent diffraction studies, usingboth x-ray and neutron radiations, showed that the cations in α-AgI preferentially reside at, ornear, the tet sites [43–48], though opinion differed over the extent to which the time-averageddistribution extended in the 〈100〉 [44, 46] or 〈110〉 [45, 47] directions (implying Ag+ diffusionvia the oct and trig positions, respectively).
The difficulty in obtaining an unambiguous description of the crystal structure of α-AgIusing powder diffraction methods is largely a consequence of the limited number of Braggpeaks observed (see figure 3). This, in turn, stems from the high values of the mean squaredthermal vibrations of both the anion and cation species [46], which lead to a rapid fall-off inBragg intensity with increasing scattering vector Q. Single crystals of β-AgI can be grownfrom solution, but the β → α transition is of first-order and typically causes them to shatteron heating. However, a single crystal of α-AgI of dimensions ≈10 mm3 was prepared bynucleating the β → α transition at one end of a needle shaped single crystal of β-AgI (grownsuch that the hexagonal [001] direction was along its length) and propagating the transitionalong the needle [49]. In this way 28 reflections could be measured using neutron diffractionand the anharmonic thermal vibrations of the Ag+ about the tet sites determined. This indicateda preference for vibration towards the trig positions, with the oct sites forming local densityminima [49].
As illustrated in figure 3, diffraction data collected from α-AgI show clear evidence ofundulating diffuse scattering between the Bragg peaks, arising from short-range instantaneouscorrelations between disordered ions. A wider discussion of diffuse scattering and its treatment
2 Formally, within space group Im3m the bcc anion sublattice comprises the 2(a) sites at 0, 0, 0 and 12 , 1
2 , 12 . The oct
positions are the 6(b) sites at 0, 12 , 1
2 , etc, the tet positions are the 12(d) sites at 14 , 0, 1
2 , etc and the trig positions arethe 24(h) sites at 0, y, y etc with y = 3
8 .

Crystal structures and conduction processes 1239
Scattering Vector Q (Å 1– )
0 2 4 6 8 10 12
Nor
mal
ized
Str
uctu
re F
acto
r F
(Q)
0
2
4
6
8
10
12293K
400K
410K
415K
420K
525K
615K
635K
655K
675K
740K
790K
Figure 3. The evolution of the measured neutron structure factor, F(Q), of AgI on heating from293 K (top) to 790 K (bottom). The β → α transition at 420 K and the diffuse scattering withinthe α-AgI phase (observed as undulations in the ‘background’ scattering) are both clearly visible(after [52]). Copyright (1993), with permission from Elsevier.
is beyond the scope of this review, but its study has provided important insights into the diffusionprocesses within a number of superionic compounds (for a recent textbook on the subject, see[50]). In the case of α-AgI, analysis of the total scattering data shown in figure 3 (i.e. bothBragg and diffuse components) using the so-called Reverse Monte Carlo (RMC) method [51]demonstrated that the Ag+ spend ∼75% of their time on the tet sites, with hops between thesepositions in 〈110〉 directions outnumbering those along 〈100〉 directions by about 6 : 1 [52].These findings were supported by measurements of the distribution of the diffuse scatteringover three-dimensional reciprocal space Q [53, 54], including studies of a large single crystalof α-AgI grown from the melt in situ on the diffractometer [54].
The structural model of α-AgI in which Ag+ diffuse in 〈110〉 directions betweenthe tetrahedrally co-ordinated interstices formed by an essentially rigid bcc anion sublatticeis supported by many other techniques, including extended x-ray absorption fine structure(EXAFS) measurements [55–57] and molecular dynamics (MD) simulations [58–60](for an extensive review of the literature devoted to AgI, see [61]). In the latter case,an acceptable agreement with the experimentally observed Bragg intensities and ionicconductivity of α-AgI initially required the inclusion of ‘harmonic springs’ to stabilize thebcc-structured anion sublattice [58]. However, the subsequent development of the so-calledRahman–Vashishta–Parrinello (RVP) empirical interionic potential removed the need for suchnon-physical artefacts [59]. In this case, the potential between ions i and j has the general form
Vij (r) = Hij
rnij+
ZiZje2
r− 1
2(αiZ
2j + αjZ
2i )
e2
r4− Wij
r6,
where Hij = Aij (ri + rj )nij , nij is typically 7, Aij is the short-range repulsive strength
and ri and rj are the ionic radii. Zi and Zj are the ionic charges, αi and αj the electronicpolarizabilities, and Wij the coefficients of the Van der Waals interaction. The values ofthese coefficients were determined by reference to experimental data, including the phonondispersion curves, compressibility and lattice energy [59]. The MD simulations of α-AgI

1240 S Hull
showed that Ag+ diffusion predominantly occurs by jumps between nearest neighbour tet sites,in good agreement with the experimental diffraction studies. However, following a single hopthere is a bias towards backward jumps (40%) compared to 20% in each of the other threedirections (all would be 25% in an unbiased case) [59].
As will be shown later, the good agreement between the various experimental andsimulation techniques concerning the Ag+ diffusion mechanism within α-AgI is not necessarilythe case in other compounds. Nevertheless, the development of physically meaningful modelsto describe the interionic interactions allows the possibility to vary the properties of the ionswithin simulations and assess the role of, for example, the ionic charge or polarizability inthe development of superionic behaviour. To facilitate later discussions along these lines, it isinstructive at this stage to consider, in very general terms, the factors that might promote highionic conductivity within a solid phase.
2.2. Factors promoting superionic behaviour
In the simplest case, the ionic conductivity of a solid can be written as σi = nZµ, where n isthe concentration of mobile ions, which have charge Z and mobility µ. The superionic phaseα-AgI has σi ∼ 1 −1 cm−1 and n ≈ 1
2 , compared to σi ∼ 10−5 −1 cm−1 and n ∼ 10−4 for atypical ‘normal’ ionic conductor such as NaCl at temperatures immediately below the meltingpoint (figure 1). Whilst naive, the relative similarity of the derived values of the ions’ mobilityin each case implies that the high values of σi characteristic of the superionic phase are primarilya consequence of the extensive lattice disorder (large n), rather than anomalously rapid ionicdiffusion (large µ)3. However, when faced with the task of designing a new compound witha high ionic conductivity for a specific application, both factors need to be maximized. It isthen natural to ask what characteristics are desirable to meet these aims:
• Concentration of mobile ions. Increasing the concentration n of mobile ions within theexpression σi = nZeµ is clearly advantageous, provided there are a sufficient number ofsuitable empty sites to accommodate them.
• Structure of the immobile sublattice. The presence of numerous unoccupied interstitialsites within the immobile sublattice (such as the tet sites in α-AgI) will promote superionicbehaviour, but also requires the presence of low energy pathways (conduction channels)between these sites to enhance the mobility µ.
• Ionic polarizability. Highly polarizable ions within the immobile sublattice can deformto allow diffusing ions to ‘squeeze’ through smaller gaps.
• Bonding character. The preferred co-ordination of a mobile ion (tetrahedral, octahedral,etc) is a manifestation of the bonding character of the material. It has been suggested thatmixed bonding character (such as ionic-covalent) is an essential characteristic of goodsuperionics by allowing the mobile ion to be stable in several different co-ordinationsduring the diffusion process [62–64].
• Ionic charge. Lower charge results in lower Coulomb energies during diffusion [65].• Ionic radius. During the diffusion process a small mobile ion is better able to diffuse
through the gaps in the polyhedral faces formed by the immobile sublattice.
Taking the last item, the small ionic radius of Ag+ (rAg+ = 1.00 Å [66]) might feasiblypromote diffusion in α-AgI by allowing easy migration through the sublattice formed by thelarger anions. However, Na+ is comparable in size (rNa+ = 0.99 Å [66]) but NaI does not form asuperionic phase at elevated temperatures. Indeed, taken to its logical conclusion, superionics
3 On these grounds, the alternative description ‘fast-ion’ conductor is slightly misleading and explains the author’spreference for the term ‘superionic’.

Crystal structures and conduction processes 1241
with highly mobile anions would not be expected, because anions are normally larger thancations (of the commonly encountered cation species, only Rb+ and Cs+ are significantly largerthan the smallest anion, F− [66]). In reality, and as will be demonstrated later in this review,F− and O2− conductors easily outnumber Ag+ ones. Clearly, simplistic discussions of this sortneglect the fact that the various factors listed above are, to varying degrees, interrelated, sothat no single factor can be used in isolation to explain the presence of high ionic conductivity.Nevertheless, such intuitive notions will prove useful later in this review as convenient toolsto explain differences observed in the microscopic and macroscopic behaviour of variousindividual superionic systems.
The discussion above also implies a more general assumption, that the picture of mobileions diffusing between the interstices formed by a rigid sublattice of counter-ions adopted forα-AgI can be used to describe the structural behaviour of all superionic conductors. To assessits validity, the case of β-PbF2 will be considered next.
2.3. Lead fluoride: β-PbF2
As illustrated in figure 1, the ionic conductivity σi of β-PbF2 shows a rapid, though continuous,increase on heating, which levels off at a value indistinguishable from that of the liquid state[4–6]. It is now widely accepted that the high value of ionic conductivity observed in supe-rionic β-PbF2 (and other fluorite-structured compounds [67]) is due almost entirely to aniondiffusion, owing to the comparatively large energy required for cation defect formation [68]and the large electronic band gap [69]. The transition to the superionic state is accompaniedby a so-called λ-type peak in the specific heat Cp, whose maximum is generally taken to definethe superionic transition temperature (Tc = 711 K in β-PbF2 [70]). Anomalous behaviour ofthe elastic constants has also been reported, with a more rapid decrease in the C11 component attemperatures above Tc [71, 72]. The earliest descriptions of the ionic distribution within supe-rionic β-PbF2 proposed a molten anion sublattice (see [73] and references therein). However,whilst there remains some disagreement over the degree of anion disorder (see section 4.1),analysis of the Cp data [70], diffraction studies [74–78] and MD simulations [79–82] all sug-gest that the anion defect concentration is less than ∼10% at temperatures above Tc. This isprobably a consequence of repulsive interactions between defects [26], which suppress thedevelopment of complete sublattice disorder of the type observed in α-AgI (section 2.1).
The cubic fluorite crystal structure (space group Fm3m [83]) can be described as a face-centred cubic (fcc) array of cations in which all the tetrahedrally co-ordinated interstices arefilled with anions and the octahedrally co-ordinated ones are empty4 (see figure 4). However,to describe the nature of the anion disorder it is often more convenient to illustrate the ionicarrangement as a simple cubic array of anions with cations occupying alternate cube centres(see figure 5). At temperatures well below Tc the principal defect clusters are anion Frenkelpairs, with the interstitial anion in one of the empty anion cube centre positions [84] (whichare the oct sites in the fcc cation array, see figure 4) and the vacancy is at least more distantthan the next nearest neighbour anion site [85]. However, as the defect concentration increasesabove ∼1% the presence of F− vacancies at closer distances destabilize the interstitials inthe cube centre sites [85] and there is a fundamental change in the nature of the defects.Neutron diffraction studies using single crystals of β-PbF2 showed that the empty cube centre(oct) positions are not significantly occupied at T > ∼Tc [76]. Instead, an appreciable
4 Within the centrosymmetric space group Fm3m an fcc sublattice is formed by filling the 4(a) sites at 0, 0, 0, etc.The oct and tet positions are in the 4(b) sites at 1
2 , 12 , 1
2 , etc and the 8(c) sites at 14 , 1
4 , 14 , etc, respectively. In the
non-centrosymettric case (F43m), the former are unchanged but the latter are spilt into two inequivalent sets in 4(c)sites at 1
4 , 14 , 1
4 , etc and 4(d) sites at 34 , 3
4 , 34 , etc (see figure 4).

1242 S Hull
f.c.c. X tet2
A Sites Type Structureoct AX rocksalttet1 or tet2 AX zincblendetet1 and tet2 AX α-CuItet1 and tet2 AX2 fluorite
a
tet1 oct
Figure 4. The locations of the octahedral (oct) and tetrahedral (tet1 and tet2) interstices withina generalized fcc-structured sublattice (space group F43m). The cubic lattice parameter a isillustrated. Various structure types generated by occupying these interstices with counterions indifferent ways are listed. Copyright (2003) by the American Physical Society.
M 2+
a
F–
Figure 5. The cubic fluorite crystal structure of a compound of stoichiometry MF2, illustrated as asimple cubic array of anions (F−) with cations (M2+) occupying alternate cube centres. The cubiclattice parameter a is shown.
fraction of the anion lattice sites are vacant and F− are also located at the sites labelledF1 and F2 in figure 6. The former was considered to be the location of the ‘true’ Frenkelinterstitials, situated between the midpoint of the two nearest neighbour anion sites andthe centre of an anion cube in a 〈110〉 direction, whilst the latter was attributed to nearestneighbour lattice anions relaxed off their regular sites in 〈111〉 directions towards the centresof adjacent empty anion cubes [76]. This leads to the construction of the two defect clustermodels labelled 3 : 1 : 2 and 4 : 2 : 2 (where the v : i : r notation is number of vacancies : Frenkelinterstitials : relaxed anions) illustrated in figure 7 [76]. The stability of these clusters, and theprobable location of the charge compensating anion vacancies, was determined by static energycalculations [86].

Crystal structures and conduction processes 1243
Pb2+
F4
F2
F1
F3
F
Figure 6. The sites proposed to be occupied within the superionic phases of the fluorite-structuredcompounds (see section 2.3), within anion-excess fluorite-structured compounds (section 4.6) andin the anti-fluorite-structured superionics (section 4.11). In space group Fm3m the F1, F2, F3 andF4 positions form the 48(g) sites at 1
2 , y, y, etc with y ≈ 0.38, the 32( f ) sites at x, x, x, etc withx ≈ 0.4, the 32( f ) sites at x, x, x, etc with x ≈ 0.3 and the 4(b) sites at 1
2 , 12 , 1
2 , etc, respectively.
V
Pb2+
F1
F2
F
(a) (b)
Figure 7. The dynamic anion Frenkel defect clusters observed within the superionic phases ofthe fluorite-structured halides [76, 77]. These are labelled (a) 3 : 1 : 2 and (b) 4 : 2 : 2, wherethe v : i : r notation denotes the number of vacancies : Frenkel interstitials : relaxed anions. Theprobable locations of the charge compensating anion vacancies were determined by static energycalculations [86] (after [76, 77]).
Further support for the presence of such defect clusters within superionic β-PbF2 wasprovided by the observation of coherent neutron diffuse scattering within well-defined regionsof reciprocal space, indicating that dynamic correlations occur between defective anions [77].Good agreement with the observed diffuse scattering was obtained by calculating the patternexpected using a 9 : 1 : 8 cluster, which is a 3 : 1 : 2 defect of the type illustrated in figure 7(a)but with additional (smaller) outward relaxations of the six next nearest neighbour anionsin 〈111〉 directions towards empty anion cube centres (corresponding to the F3 sites shownin figure 6). The diffuse neutron scattering was found to be broadened in neutron energytransfer, indicating that the anion Frenkel defects are dynamic and have typical lifetimes of∼10−12 s [77]. Using the defect model described above, powder neutron diffraction datacollected at around 100 temperatures over the range 373–1078 K were analysed to probe the

1244 S Hull
Temperature (K)400 600 800 1000
Lat
tice
para
met
er a
(Å)
5.96
5.98
6.00
6.02
6.04
6.06
6.08
6.10
Temperature (K)400 500 600 700 800
Ani
on v
acan
cy c
once
ntra
tion
n V
0.00
0.05
0.10
0.15
0.20
0.25 (a) (b)
Figure 8. The temperature dependence of (a) the anion vacancy concentration, nV, and (b) thelattice parameter a of β-PbF2 (after [78]).
Table 1. Summary of the superionic properties of the compounds AgI and β-PbF2.
Compound AgI β-PbF2
Family Ag+ and Cu+ chalcogenides Fluorite-structured halidesand halides and oxides
Other examples CuI, CuBr, Ag2S, etc CaF2, SrCl2, UO2, etcSuperionic transition 1st-order structural Gradual transition
transition (type-I) (type-II)Mobile species Cations AnionsAmbient T structure Zincblende, wurtzite, etc Cubic fluoriteSuperionic structure bcc/fcc anion sublattice plus Fluorite structure plus dynamic
‘liquid-like’ cations anion Frenkel defects
temperature evolution of the number of anions leaving their regular sites (see figure 8(a)) [78].These data were shown to be consistent with the measured heat capacity anomaly in β-PbF2
and also demonstrate anomalous behaviour of the lattice parameter a in the vicinity of Tc
(figure 8(b)) [87].
2.4. Type-I and type-II superionic transitions
Table 1 summarizes the key features of the superionic properties of α-AgI and β-PbF2 andhighlights the significant differences between their respective behaviour. As sections 3 and 4will show, both are members of wider families which display broadly similar behaviour to theirrespective archetypes. In particular, first-order transitions to the highly conducting state are acommon feature of Ag+ and Cu+ based halides and chalcogenides, whilst a gradual onset ofsuperionic behaviour is characteristic of many halides and oxides that adopt the fluorite crystalstructure. The differing nature of the evolution of the highly conducting state with temperaturehas been used to categorize superionic compounds as type-I (abrupt) or type-II (continuous)[24]. A number of attempts to explain the preferred transition method have recently been made,including theoretical models based on lattice gas methods (see, e.g. [88]) and semi-empiricalderivations more specifically devoted to AgI and β-PbF2 [89, 90].

Crystal structures and conduction processes 1245
Pressure p(GPa)0.0 0.5 1.0 1.5 2.0
Tem
pera
ture
T(K
)
200
400
600
800
1000
1200
(bcc)
LiquidAgI
III(rocksalt)
β/γ
α
IV
Figure 9. The pressure–temperature phase diagram of AgI (after [93]). Under ambient conditionsAgI generally exists as a mixture of the wurtzite-structured β and zincblende-structured γ phases.On increasing temperature the material transforms to the superionic α phase at 420 K, whilstincreasing pressure favours transformation to the rocksalt-structured phase III via the tetragonalintermediate phase IV [94]. The dashed line shows the locus of the proposed superionic transitionwithin AgI-IV [97, 98]. Copyright (1996) by the American Physical Society.
A plot of the free enthalpy of a crystal versus its defect concentration n generally showsa minimum at low concentration, due to the counterplay of positive formation enthalpyand configurational entropy gain. However, including an additional term describing thecontribution due to defect–defect interactions can lead to a further minimum at higher n [89].If the second minimum becomes lower than the first, a phase transition occurs from the lowdefective state to the highly defective (superionic) state. Its nature (type-I or type-II) dependson the balance between various terms in the free enthalpy which are, in turn, functions of thedefect–defect interaction, the defect formation enthalpy and the defect configuration (numberof interstitials, etc). The former, and in particular its dependence on n, has been shownto be particularly important [89]. For the compounds AgI and β-PbF2, a cube root term,3√
n, yields an excellent agreement with the experimentally determined transition temperaturesand ionic conductivity and is consistent with the defect concentrations obtained from MDand Monte Carlo (MC) simulations for both compounds (see [91, 92] and [81], respectively).However, this approach does not, in itself, explain the experimentally observed preference fortype-I transitions within the Ag+ and Cu+ based binary halides [24] and type-II transitionswithin the fluorite-structured halides and oxides. As a consequence, it is instructive to askwhether this distinction holds as a general ‘rule’ for such compounds and, if so, what specificphysical properties underlie it. This question is addressed in the next subsection.
2.5. High pressure studies
The pressure–temperature (p–T ) phase diagram of AgI (figure 9, [93]) shows that theapplication of hydrostatic pressure at ambient temperature transforms the material from a twophase mixture of the wurtzite-structured β and zincblende-structured γ phases to a rocksalt-structured form (labelled AgI-III) via an intermediate phase (AgI-IV). The latter has a tetragonalstructure [94] and is stable over a sufficiently narrow pressure range that it can be ignoredfor our purposes. The mechanisms of the pressure-induced wurtzite/zincblende → rocksalt

1246 S Hull
Temperature (K)300 400 500 600 700
Cat
ion
vaca
ncy
conc
entr
atio
n n V
-0.1
0.0
0.1
0.2
0.3
0.4
Temperature (K)300 400 500 600 700
Lat
tice
para
met
er a
(Å)
6.04
6.06
6.08
6.10
6.12
6.14
6.16
6.18
6.20
6.22
(a) (b)
Figure 10. The temperature dependence of (a) the cation vacancy concentration, nV, and (b) thelattice parameter a of rocksalt-structured AgI-III (after [100]). Copyright (1996) by the AmericanPhysical Society.
transitions have been extensively studied (see, e.g. [95, 96] and references therein) and involvesan increase in the co-ordination of both cations and anions from tetrahedral to octahedral(see figure 4). Ionic conductivity measurements showed a rapid increase in σi on increasingtemperature within the stability field of AgI-III, followed by a small discontinuous increaseat the transition to the α-AgI phase [97]. This is indicative of a type-II superionic transitionwithin the rocksalt-structured modification. Whilst MD simulations using RVP-type interionicpotentials were able to accurately reproduce the locations of many of the phase boundarieswithin the p–T phase diagram, they provided conflicting evidence for [98] and against [99]extensive Ag+ disorder within the AgI-III phase. However, a recent neutron diffraction study onincreasing temperature at p = 1.1 GPa showed clearly that an increasing fraction of Ag+ leavethe oct sites characteristic of the rocksalt arrangement and reside on the tet sites at T > ∼550 K[100]. The extent of this Frenkel disorder reaches nV ∼ 0.3, before the material transformsto α-AgI at a temperature of ≈700 K. As illustrated in figure 10, the behaviour of nV and thelattice parameter a on increasing temperature both mirror that observed in β-PbF2 at ambientpressure (figure 8 [78]) and confirm that AgI-III undergoes a type-II superionic transition withTc ≈ 580 K. Interestingly, the ‘cube-root’ model for describing the defect–defect interactionsdiscussed at the end of the previous subsection [89] can correctly reproduce the change inthe character of the superionic transition within AgI from type-I to type-II under pressure,though a rigorous test of this semi-empirical method is made difficult by the lack of suitableexperimental data for the entropy of defect formation at elevated pressure (for a discussion,see [100]).
In common with AgI, PbF2 also generally exists as a mixture of two phases under ambientconditions, these being the cubic fluorite-structured β form and the metastable orthorhombic,cotunnite-structured (α) phase (space group Pnma) [101]. α-PbF2 is approximately 10% moredense than the β form and the anion sublattice contains two symmetry independent anions(see [102]), such that the Pb2+ are surrounded by an irregular co-ordination shell containingnine anions. The p–T phase diagram (figure 11, see [102] and references therein) showsthat the irreversible β → α transition occurs at relatively modest pressures (≈0.5 GPa) atambient temperature whilst the opposite α → β transition is also irreversible and can beachieved by heating to temperatures in excess of 600–610 K [103]. High pressure differential
Crystal structures and conduction processes 1247
α/β
βPbF2
α
β
α
α
β
β α
Pressure p(GPa)0.01 0.1 1
Tem
pera
ture
T(K
)
300
400
500
600
700
800
900
1000
?
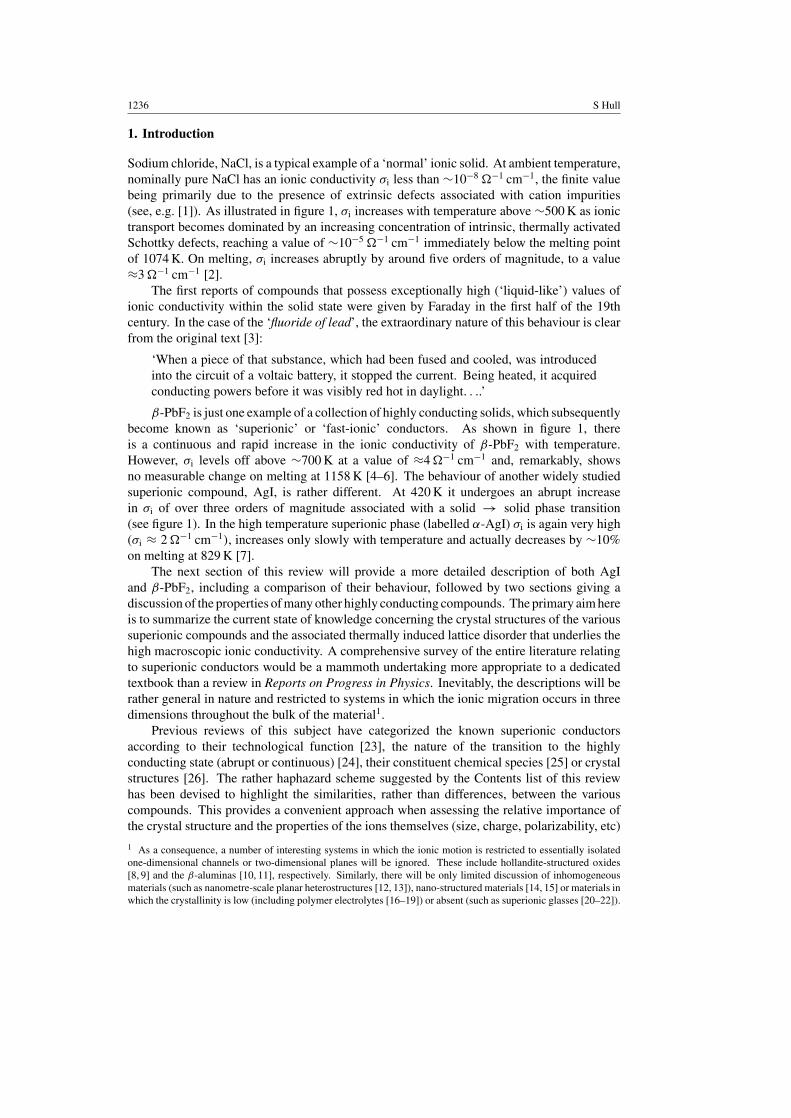
Figure 11. The pressure–temperature phase diagram of PbF2 (see [102] and references therein).Under ambient conditions PbF2 exists as a mixture of the fluorite-structured β phase and thecotunnite-structured α phase, of which the former is stable at elevated temperatures and the latterfavoured at high pressures. The dashed line shows the (possible) locus of the superionic transitionwithin β-PbF2 on increasing pressure. Copyright (1998) by the American Physical Society.
thermal analysis (DTA) studies showed evidence of a type-II superionic transition withinthe stability field of α-PbF2 [103, 104] (see figure 11), though later investigations using thesame technique questioned these observations [105]. Intuitively, extensive lattice disorderwould not be expected within the cotunnite-structured α phase because there are no largeempty cavities to accommodate interstitial anions. Nevertheless, indirect support for limitedanion disorder within α-PbF2 was provided by evidence of an anomalous increase in theionic conductivity of PbCl2 (which adopts the cotunnite structure at ambient pressure) ina narrow temperature range just below its melting point [106] and by observations of rapidhops between the two symmetry independent anion sites in nuclear magnetic resonance (NMR)studies of α-PbF2 [107, 108]. The question of superionic behaviour within α-PbF2 has recentlybeen resolved by both powder neutron diffraction [102] and MD studies [109]. The formershowed that the mean occupancies of both anion sites remain equal to unity (within error)at all temperatures, whilst the latter demonstrated that significant F− disorder requires thepresence of vacancies on the anion sublattice. As a consequence, heating PbF2 at pressures inexcess of ≈0.5 GPa results in a type-I superionic transition at the α → β structural transition(see figure 11).
In summary, the application of hydrostatic pressure changes the character of the superionictransition from type-I to type-II in AgI and from type-II to type-I in PbF2. Therefore, the natureof the superionic transition within each family of compounds listed in table 1 is not inherently‘fixed’ and future structural studies might show evidence of, for example, type-I transitionswithin other binary halide compounds [67]. In a wider context, the experimental studiesdescribed in this subsection are examples of the increasing use of high pressure techniques toprobe the structural behaviour of superionics, despite the practical difficulties in performingdiffraction studies at elevated pressures and temperatures. Further examples will be given laterin this review.
1248 S Hull
3. α-AgI: chemical and structural derivatives
This section begins with a discussion of the structural properties of superionic phases within thewider family of binary Ag+ and Cu+ compounds, followed by descriptions of several ternary(chemical) derivatives of AgI. These will be illustrated using the same generalized pictureused to describe the structure of α-AgI in the previous section, with mobile ions performingjump diffusion between the interstices formed by an immobile sublattice. This approachis inevitably an approximation to the real situation and ignores, for example, the extremeanharmonic thermal vibrations [110, 111] and the increased probability that an ion undergoinga forward hop will subsequently hop backwards [59] or induce local relaxations within theimmobile sublattice [112–114]. Nevertheless, this simplistic picture is a convenient methodof visualizing the essential features of the conduction processes and is particularly valuablewhen comparing the conduction mechanisms within a number of compounds which, on purelychemical grounds, appear unrelated.
3.1. The family of Ag+ and Cu+ halide superionics
Silver iodide, AgI, is a member of a family of binary compounds that display high ionicconductivities at elevated temperatures, as summarized in table 2 (and see [111]). Thisgrouping includes its fellow halides AgBr and AgCl, the three copper based counterparts CuI,CuBr and CuCl and the three silver chalcogenides Ag2Te, Ag2Se and Ag2S. The structuralproperties of the copper analogues to the latter have also been investigated [115–117], thoughthe ease with which they form non-stoichiometric phases such as Cu2−δS has led to a degree ofinconsistency between different experimental studies (see, e.g. the phase transition sequencein ‘Cu2Te’ [118–121]) and they will not be considered here.
The two compounds AgCl and AgBr adopt the rocksalt arrangement under ambientconditions (see figure 4) and retain this structure up to their melting points, Tm. However, bothcompounds show anomalous increases in their ionic conductivity in the temperature region∼100–150 K below Tm, reaching values of σi ≈ 0.5 −1 cm−1 [7]. Ionic conductivity andquasi-elastic neutron scattering studies of AgBr were interpreted in terms of hopping of Ag+
between the lattice oct and interstitial tet sites [122], whilst powder neutron diffraction studiesperformed at temperatures up to ≈0.3 K below the melting point of 701 K indicated that theAg+ vibrate anisotropically about the oct sites, with an increasing occupancy of the tet positionsas Tm is approached [123]. Just below Tm the concentration of these cation Frenkel defectsis n ∼ 0.04 [123]. This implies that AgBr starts to undergo a type-II superionic transition[124], which is interrupted by the melting transition before reaching a highly disordered stateof the type observed within β-PbF2 (section 2.3) and the high pressure rocksalt-structuredphase of AgI (section 2.5). This hypothesis is supported by anomalous behaviour of the elasticconstants of AgBr at temperatures above ∼500 K [125], analogous to that observed duringthe type-II superionic transition in β-PbF2 [71, 72]. However, the premature melting of AgBrmay be due to the co-incident formation of a small (but significant) concentration of Schottkydefects, which induce disorder on the anion sublattice and promote melting [124].
In contrast, the three copper halides CuCl, CuBr and CuI all adopt ambient temperature(γ ) phases with the cubic zincblende structure [83], though powder neutron diffraction studiesshow strongly anharmonic thermal vibrations of the tetrahedrally co-ordinated Cu+ in 〈111〉directions towards the oct positions [126–128]. However, as shown in table 2, the behaviour ofthe three Cu+ halides on increasing temperature is very different. CuCl transforms to a wurtzite-structured β phase at 681 K before melting at 703 K [129]. The wurtzite structure (P 63mc)comprises a hexagonal close-packed (hcp) anion sublattice in which the cations are ordered

Crystal structures and conduction processes 1249
Table 2. Summary of the phases observed in the family of Ag+ and Cu+ halides and Ag+
chalcogenides (for references, see sections 2.1, 2.5, 3.1, 3.2, 3.3 and 3.4 and [24, 111, 678]). Phasesdenoted by ∗ are only stable at elevated pressures. The structures labelled bcc, fcc and hcp indicatethe sublattice formed by the immobile anions within superionic phases.
Temperature SpaceCompound Phase range Structure group
AgI γ <420K Zincblende F43mβ <420 K Wurtzite P63mcα 420–829 K bcc Im3mIII ∗ Rocksalt Fm3m
AgBr <701 K Rocksalt Fm3m
AgCl <728 K Rocksalt Fm3m
CuI γ <642 K Zincblende F43mβ 642–680 K hcp P3m1α 680–878 K fcc Fm3mVII ∗ bcc Im3m
CuBr γ <664 K Zincblende F43mβ 664–744 K hcp P63mcα 744–765 K bcc Im3m
CuCl γ <681 K Zincblende F43mβ 681–703 K Wurtzite P63mcIII ∗ bcc Im3m
Ag2Te β <423 K Monoclinic P 21/c
α 423–1075 K fcc Fm3mγ 1075–1223 K bcc Im3m
Ag2Se β <406 K Orthorhombic P212121
α 406–1170 K bcc Im3m
Ag2S γ <452 K Monoclinic P 21/c
β 452–873 K bcc Im3mα 873–1115 K fcc Fm3m
over half the tet interstices5 (see figure 12). The ionic conductivity of β-CuCl is relatively high(σi ∼ 0.1 −1 cm−1, see [57] and references therein) but the cations predominantly remainon the tet sites and it is not a true superionic phase [129]. CuBr undergoes structural phasetransitions at 664 and 744 K and shows a dramatic change in the long-range structure of theimmobile Br− sublattice, from fcc(γ ) → hcp(β) → bcc(α) [130]. However, total neutronscattering studies indicated that relatively little change in the local structure of the Cu+ occurs,with essentially tetrahedral co-ordination in all three phases [131]. The cations in β-CuBr aredistributed over the two pairs of tet sites which are filled and empty within the fully orderedwurtzite-structured arrangement (tet1 + tet2 and tet3 + tet4 in figure 12) in approximately theratio 3 : 1 [131]. Since α-CuBr is also characterized by predominantly tetrahedral co-ordinationof the cations within a bcc anion sublattice, it is isostructural with α-AgI [130, 131]. The thirdcompound in this series, CuI, will be discussed in more detail in the following subsection.
A glance at the periodic table shows that the Ag+ and Cu+ halides can considered as ‘I–VII’compounds, which are end members of the series IV → III–V → II–VI → I–VII. At the
5 The highest symmetry description of an hcp sublattice uses the 2(c) sites of space group P 63/mmc at positions13 , 2
3 , 14 and 2
3 , 13 , 3
4 . The oct and tet interstices within this sublattice are located in the 2(a) sites at 0, 0, 0 and 0, 0, 12
and the 4( f ) sites at 13 , 2
3 , z, etc with z = 58 , respectively. For ideal close packing, the lattice parameters should have
c/a =√
83 = 1.6330.

1250 S Hull
h.c.p. X
A Sites Type Structure oct AX NiAstet1 and tet2 AX wurtzitetet2 and tet3 AX ‘β-CuI’
a
ctet2
octtet1
tet4
tet3
Figure 12. The locations of the octahedral (oct) and various tetrahedral (tet1 to tet4) intersticeswithin an hcp-structured sublattice. The most common structure types generated by filling theseinterstices with counterions in different manners are listed. The lattice parameters a and c are alsoshown.
left-hand end, the group IV elemental semiconductors such as Si and Ge are predominantlycovalently bonded and the degree of ionicity increases with increasing separation of the twoconstituent elements within the periodic table. Quantitatively, the Ag+ and Cu+ halides havef ∼ 0.7–0.8 on the Phillips scale of ionicity and span the boundary between a predominantlyionic and predominantly covalent character located at fc = 0.785 [132]. This feature isclearly seen in the crystal structures adopted under ambient conditions (see table 2), whichchange from the tetrahedral co-ordination characteristic of covalent bonding (zincblende and/orwurtzite structures for AgI, CuCl, CuBr and CuI) to the octahedral environment typicallyobserved in ionic compounds (as in the cases of rocksalt-structured AgCl and AgBr). As aconsequence, it has been proposed that the oct and tet sites are of comparable energy, suchthat the local bonding character is very sensitive to interionic distance and small fluctuations(comparable to the lattice vibration amplitude) can change the overlap integral and promoteextensive ionic motion [62–64]. Whilst the electronic structure is undoubtedly influential inpromoting superionic behaviour within the Ag+ and Cu+ halides [133], this argument is not asufficient condition for superionic behaviour, since a number of poorly conducting compoundsalso have ionicities close to the ionic–covalent ‘boundary’ (such as Mg2S and Mg2Se, bothwith f ≈ 0.78 [24]). Furthermore, such models imply that ionic conduction occurs betweentet interstices via the oct ones. This is not true in bcc-structured α-AgI [52] and, as will bediscussed in the next subsection, is not the case in the fcc-based phase α-CuI either.
3.2. The preferred cation sites in α-CuI
CuI transforms from the zincblende-structured γ phase to its β phase at 642 K, in which theanions form an hcp sublattice [130, 134, 135]. The Cu+ are distributed in the approximate ratio

Crystal structures and conduction processes 1251
5 : 1 over two sets of tetrahedral interstices, though the preferentially occupied sites differ fromthose observed in β-CuBr, such that the space group is P3m1 rather than P63mc (see figure 12)[135]. On further heating, the anion sublattice reverts to an fcc arrangement at the transitionto the superionic α phase at 680 K [130, 134, 135].
The distribution of the mobile Cu+ within α-CuI has been the subject of some debatewithin the literature. Early diffraction studies proposed that α-CuI possesses the zincblendestructure (i.e. isostructural with the ambient temperature γ -CuI phase, with either the tet1 ortet2 sites in figure 4 fully occupied) but with large displacements of the Cu+ in 〈111〉 directions[134], or the Cu+ are predominantly distributed over all the tetrahedrally co-ordinated sites (tet1and tet2 in figure 4), but with ∼25% situated on the oct positions [136]. The latter model wassupported by EXAFS measurements [57], though neutron diffraction studies consistently foundno evidence for significant occupancy of the oct sites [127, 128, 130]. A series of MD studiesusing a slightly modified RVP potential supported the neutron studies, with cation diffusionbetween the supernumerary tet positions occurring principally in 〈100〉 directions [137–140].However, other simulations using essentially the same interionic potentials claimed that ∼35%of Cu+ were located in the oct positions [141]. The apparent disagreement can largely be tracedto differences in interpretation of the mean ionic distributions within the simulations [128],with the latter workers dividing the unit cell of α-CuI into eight tetrahedra and four octahedrajoined via triangular faces formed by the immobile (fcc) anions. Thus, an oct site is ‘occupied’if the Cu+ lies within the octahedron, and so forth. The discrepancy arises because the Cu+
within the tet cavities undergo extensive anharmonic thermal vibrations in the 〈111〉 directionsand will, on occasion, venture into a neighbouring octahedron. However, the cation doesnot undergo diffusion in this direction and quickly returns to the tetrahedron. The centres ofthe octahedra are actually density minima and the oct sites should, therefore, be consideredlocations that are ‘avoided’ rather than ‘occupied’ [128].
Clearly, this issue highlights the difficulties in interpreting the results of MD simulationsand the limitations of structural models which inherently assume that the ions perform hopsbetween well-defined crystallographic sites (tet, oct, etc) whilst ignoring the presence ofextensive anharmonic thermal vibrations. Indeed, the reliability of such MD simulationsof α-CuI using RVP-type interionic potentials has recently been questioned [142], since thederived partial pair distribution functions gCuI(r) and gCuCu(r) are very different from thosemeasured by neutron diffraction [128] and EXAFS methods [142] (though there is no perfectagreement between these two experimental techniques either). In particular, the MD methoddoes not reproduce the observed Cu+–Cu+ contacts of ≈2.5 Å observed experimentally withinα-CuI, which probably correspond to simultaneous occupancy of nearest neighbour tet sites in〈100〉 directions [142]. Similar problems have been encountered in reconciling the simulatedand experimental values for the Cu+ diffusion coefficient [137, 138], probably due to the neglectof three-body effects which are a consequence of the high polarizability of I− [140].
Whilst a detailed description of the short-range correlations between the cations withinα-CuI remains the subject of some debate, the time-averaged structure can, to a goodapproximation, be described by a random distribution of Cu+ over all the tet cavities within anfcc anion sublattice [127, 130]. Recalling that the ambient temperature zincblende-structuredγ phase has the Cu+ ordered over half the tet interstices in an fcc array, the γ → α transitioncan be interpreted as a gradual (type-II) superionic transition interrupted by the presence of thetwo first-order γ → β and β → α structural transitions. Support for this notion was providedby x-ray diffraction studies of CuI on increasing temperature, which showed that extrapolationof the temperature dependence of the intensities of the Bragg peaks observed in the γ phaseacross the ‘gap’ in which the β phase is stable meet those measured in the α phase [134].In addition, there is evidence of the onset of Cu+ disorder within γ -CuI at the upper region

1252 S Hull
Figure 13. The mean ionic density of I− and Cu+ within the (110) plane of CuI at temperaturesof (a) 600 K, (b) 660 K and (c) 670 K, simulated by MD methods. The I− densities are centred at0, 0, 0, 1
2 , 12 , 0, etc and form an fcc-structured sublattice. All other contours correspond to Cu+
density. The ionic distributions are calculated within a slice of thickness 0.1 perpendicular to theplane. The locations of the octahedrally (oct) and tetrahedrally (tet1 and tet2) co-ordinated sites areillustrated in (a). The type-I superionic transition, corresponding to dynamic disorder of the Cu+
over all the tet sites, occurs at ≈665 K (after [149]). Copyright (2003) by the American PhysicalSociety.
of its temperature regime provided by ionic conductivity [143], NMR [144], Raman [145],MD [137] and neutron diffraction [127, 128] data. The latter two techniques indicate that∼5% of Cu+ leave the zincblende lattice sites and reside on the alternative set of tet cavities attemperatures immediately below the γ → β transition. Conversely, calorimetry measurements[134] and earlier MD simulations [146] both showed that γ -CuI and α-CuI have substantiallydifferent lattice energies, suggestive of a type-I superionic transition. To resolve this issue, thepossibility that the β phase might be eliminated under pressure was proposed [147]. However,subsequent diffraction measurements indicated that at p > ≈0.3 GPa the γ → α transitiondoes not become second order but, instead, occurs via a different intermediate phase withrhombohedral symmetry [148]. Instead, this issue has recently been resolved by the additionof small quantities of Cs+ to CuI, which destabilizes the β phase. The resultant doped materialwas shown to undergo a type-I γ → α transition at 643(2) K [149]. MD simulations of pureCuI on increasing temperature, with the tendency to form the hexagonal phase removed byconstraining the shape of the simulation box to remain cubic, also showed an abrupt transitionfrom a slightly disordered γ phase to the fully disordered (superionic) α phase at ≈665 K (seefigure 13) [149].
3.3. The role of the immobile sublattice
It is difficult to systematically assess the influence of the structure of the immobile sublatticeon the superionic behaviour within the Ag+ and Cu+ halides because the number of phasesobserved is rather small (see table 2). However, as illustrated by the case of AgI in section 2.5,many superionic compounds undergo structural phase transitions at relatively low pressures6.If the high pressure phases display superionic behaviour then their study can give important
6 This may not be merely coincidental, since the presence of phase transitions within many superionic compounds atlow pressures has been attributed to the ‘structural instabilities’ that are a consequence of the borderline covalent-ionicnature of the bonding discussed at the end of section 3.1 [150].

Crystal structures and conduction processes 1253
insights, by allowing the nature of lattice disorder to be studied within different phases of thesame compound (and, by extension, within different compounds with the same structure).
Intuitively, the application of hydrostatic pressure would not be expected to promotesuperionic behaviour, because compression favours structural phase transitions to more denselypacked arrangements of the immobile ions, leaving a smaller ‘free volume’ available forthe mobile ones. However, this intuitive notion is contradicted by the presence of a type-IIsuperionic transition in AgI-III (section 2.5), despite it having a density almost 20% higher thanthe ambient pressure form [94]. CuCl provides an even more dramatic example, since it doesnot possess a true superionic phase at ambient pressure [129] (see section 3.1), but does have ahigh pressure superionic bcc-structured phase (CuCl-III) at p > ≈0.2 GPa and T > ≈700 K[151, 152]. CuI has also been shown to adopt a bcc-structured superionic phase (CuI-VII)at p > ≈1.2 GPa and T > ≈920 K, in addition to its (ambient pressure) fcc-structured α
phase [148, 151]. In principle, the four bcc-structured superionic phases α-AgI, α-CuBr,CuCl-III and CuI-VII allow the preferred cation locations to be studied for different sizes ofcations and anions. Neutron diffraction studies [46, 52, 130, 131], including those performedat elevated p and T [148, 152], indicate that such steric factors have little influence on theionic conduction process, since all four phases are characterized by predominantly tetrahedralcation site occupancy. This preference is also a feature of the fcc (AgI-III [100] and α-CuI[127, 135]) and hcp (β-CuBr [131] and β-CuI [127, 135]) based phases.
A consequence of the cations’ favoured occupancy of the tetrahedrally co-ordinatedcavities within the Ag+ and Cu+ halide superionics is that bcc-based phases should possesshigher ionic conductivities than fcc and hcp-based ones, because there are six tet sites availablefor each mobile ion rather than two (compare figures 2, 4 and 12). Furthermore, the differentstacking sequences of close-packed layers which construct the fcc and hcp lattices result inedge- and corner-sharing of anion tetrahedra in the former but face-, edge- and corner-sharingin the latter. The pairs of face-sharing tetrahedra parallel to [001]hex in the hcp case produceshort cation–cation contacts (of separation c/2, where c is the hexagonal lattice parameter,see figure 12) and, in practice, these pairs of sites cannot be simultaneously occupied. Thus,the number of available tetrahedrally co-ordinated holes for each mobile ion within an hcpsublattice is only 1. This probably accounts for the presence of only partial disorder observedwithin those phases which possess an hcp immobile sublattice (β-CuBr [131] and β-CuI[127, 135]). These simple geometric considerations imply that the ionic conductivity ofsuperionic phases will decrease in the sequence bcc → fcc → hcp. This prediction is broadlyin accord with experimental data for the Ag+ and Cu+ halides [24] and also holds for the Ag+
chalcogenides (next subsection) and several ternary derivatives of AgI (section 3.7).
3.4. Ion–ion correlations: the Ag+ chalcogenides
The three silver chalcogenides Ag2S, Ag2Se and Ag2Te all adopt low symmetry orderedphases under ambient conditions (space groups P 21/c [153], P 212121 [154] and P 21/c
[155], respectively) and form at least one high temperature phase characterized by extensivedynamic Ag+ disorder within an immobile anion sublattice (see table 2). Numerous diffraction[116, 156–161] and MD [161–169] studies of these superionic phases have been reported,principally to compare their structural properties with the Ag+ halides and assess the effectsof the doubled density of mobile cations.
The most recent neutron diffraction studies of the two fcc-structured phases α-Ag2S [161]and α-Ag2Te [160] showed their time-averaged structures to be very similar, with the majorityof the cations located in the tet interstices but with a significant fraction (up to around half)located close to the oct positions. Following the discussion given in the previous subsection,
1254 S Hull
(a) (b)
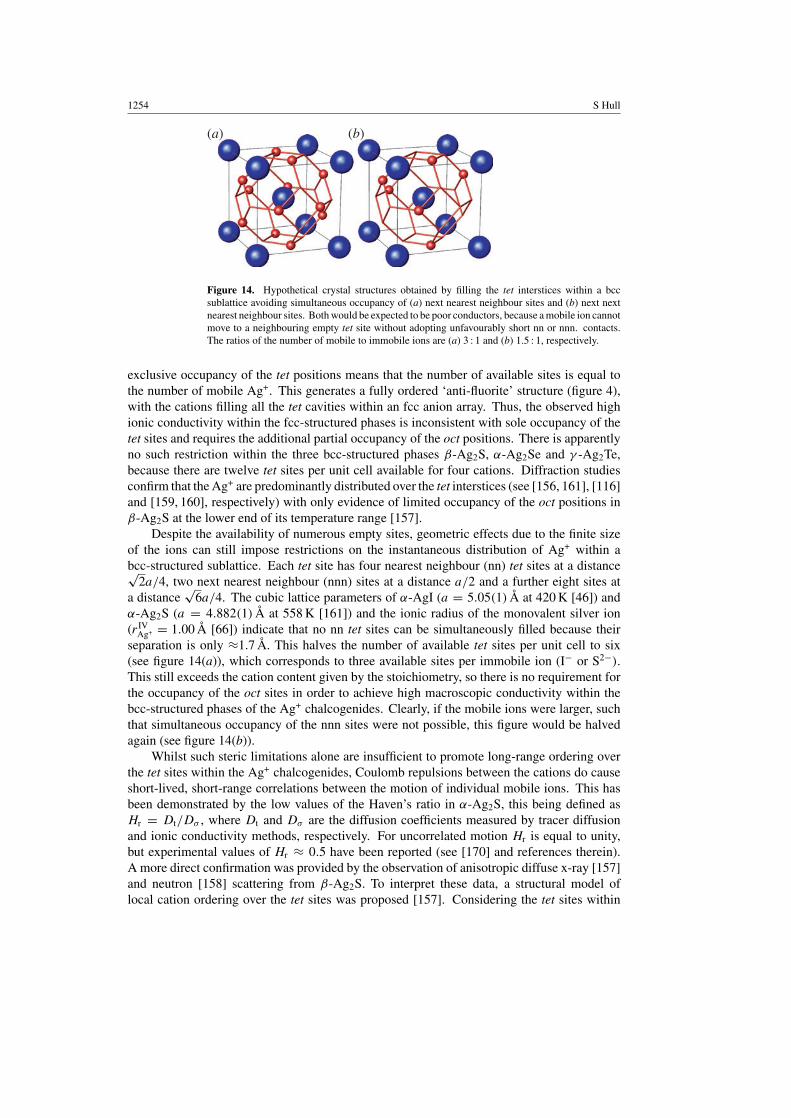
Figure 14. Hypothetical crystal structures obtained by filling the tet interstices within a bccsublattice avoiding simultaneous occupancy of (a) next nearest neighbour sites and (b) next nextnearest neighbour sites. Both would be expected to be poor conductors, because a mobile ion cannotmove to a neighbouring empty tet site without adopting unfavourably short nn or nnn. contacts.The ratios of the number of mobile to immobile ions are (a) 3 : 1 and (b) 1.5 : 1, respectively.
exclusive occupancy of the tet positions means that the number of available sites is equal tothe number of mobile Ag+. This generates a fully ordered ‘anti-fluorite’ structure (figure 4),with the cations filling all the tet cavities within an fcc anion array. Thus, the observed highionic conductivity within the fcc-structured phases is inconsistent with sole occupancy of thetet sites and requires the additional partial occupancy of the oct positions. There is apparentlyno such restriction within the three bcc-structured phases β-Ag2S, α-Ag2Se and γ -Ag2Te,because there are twelve tet sites per unit cell available for four cations. Diffraction studiesconfirm that the Ag+ are predominantly distributed over the tet interstices (see [156, 161], [116]and [159, 160], respectively) with only evidence of limited occupancy of the oct positions inβ-Ag2S at the lower end of its temperature range [157].
Despite the availability of numerous empty sites, geometric effects due to the finite sizeof the ions can still impose restrictions on the instantaneous distribution of Ag+ within abcc-structured sublattice. Each tet site has four nearest neighbour (nn) tet sites at a distance√
2a/4, two next nearest neighbour (nnn) sites at a distance a/2 and a further eight sites ata distance
√6a/4. The cubic lattice parameters of α-AgI (a = 5.05(1) Å at 420 K [46]) and
α-Ag2S (a = 4.882(1) Å at 558 K [161]) and the ionic radius of the monovalent silver ion(r IV
Ag+ = 1.00 Å [66]) indicate that no nn tet sites can be simultaneously filled because theirseparation is only ≈1.7 Å. This halves the number of available tet sites per unit cell to six(see figure 14(a)), which corresponds to three available sites per immobile ion (I− or S2−).This still exceeds the cation content given by the stoichiometry, so there is no requirement forthe occupancy of the oct sites in order to achieve high macroscopic conductivity within thebcc-structured phases of the Ag+ chalcogenides. Clearly, if the mobile ions were larger, suchthat simultaneous occupancy of the nnn sites were not possible, this figure would be halvedagain (see figure 14(b)).
Whilst such steric limitations alone are insufficient to promote long-range ordering overthe tet sites within the Ag+ chalcogenides, Coulomb repulsions between the cations do causeshort-lived, short-range correlations between the motion of individual mobile ions. This hasbeen demonstrated by the low values of the Haven’s ratio in α-Ag2S, this being defined asHr = Dt/Dσ , where Dt and Dσ are the diffusion coefficients measured by tracer diffusionand ionic conductivity methods, respectively. For uncorrelated motion Hr is equal to unity,but experimental values of Hr ≈ 0.5 have been reported (see [170] and references therein).A more direct confirmation was provided by the observation of anisotropic diffuse x-ray [157]and neutron [158] scattering from β-Ag2S. To interpret these data, a structural model oflocal cation ordering over the tet sites was proposed [157]. Considering the tet sites within

Crystal structures and conduction processes 1255
Figure 15. Structural model for a microdomain of ordered Ag+ arranged over the tet sites withinfour unit cells of bcc-structured β-Ag2S (after [157]). Copyright (1980) by the American PhysicalSociety.
4
3
2
1
4 0
3 2 1 0
k in
[0k
0]
h in [h00]
(a)
(b)
Figure 16. Comparison of (a) the calculated diffuse scattering using the microdomain modelillustrated in figure 15 with (b) a schematic representation of the observed diffuse x-ray scatteringfrom β-Ag2S in the (001) plane of reciprocal space (after [157]). Copyright (1980) by the AmericanPhysical Society.
the unit cell to form a cuboctahedron allows the construction of an idealized microdomainof ordered Ag+ sites (figure 15) consisting of four connected cuboctahedra. The calculateddiffuse scattering based on this model is in good agreement with that measured experimentally(see figure 16 [157]).
The presence of short-range correlations between the motions of the diffusing cations doesnot have a significant detrimental effect on the magnitude of the ionic conductivities of thethree silver chalcogenides Ag2S, Ag2Se and Ag2Te (see figure 17, [171]), which exceed that ofα-AgI [7] by a factor of ∼3. Ag2S and Ag2Te possess both fcc- and bcc-structured superionicphases and the higher ionic conductivities of the latter in both compounds is consistent withthe discussion of the relative number of available interstices given in the previous subsection,despite their order on increasing temperature being reversed.
3.5. Stabilizing the α-AgI phase at ambient temperature
Despite having a lower cation density than the bcc-structured phases of the Ag+ chalcogenides,a number of reports of correlations between the motions of the cations within α-AgI at the
1256 S Hull
4
6
2
103
6 8
4
σ iT
(Ω
−1cm
−1K
)
1.0 1.4 1.8 2.2 1000/T (K−1)
400K800K1000K
Ag2Te
Ag2S
α
α β
γ600K 500K
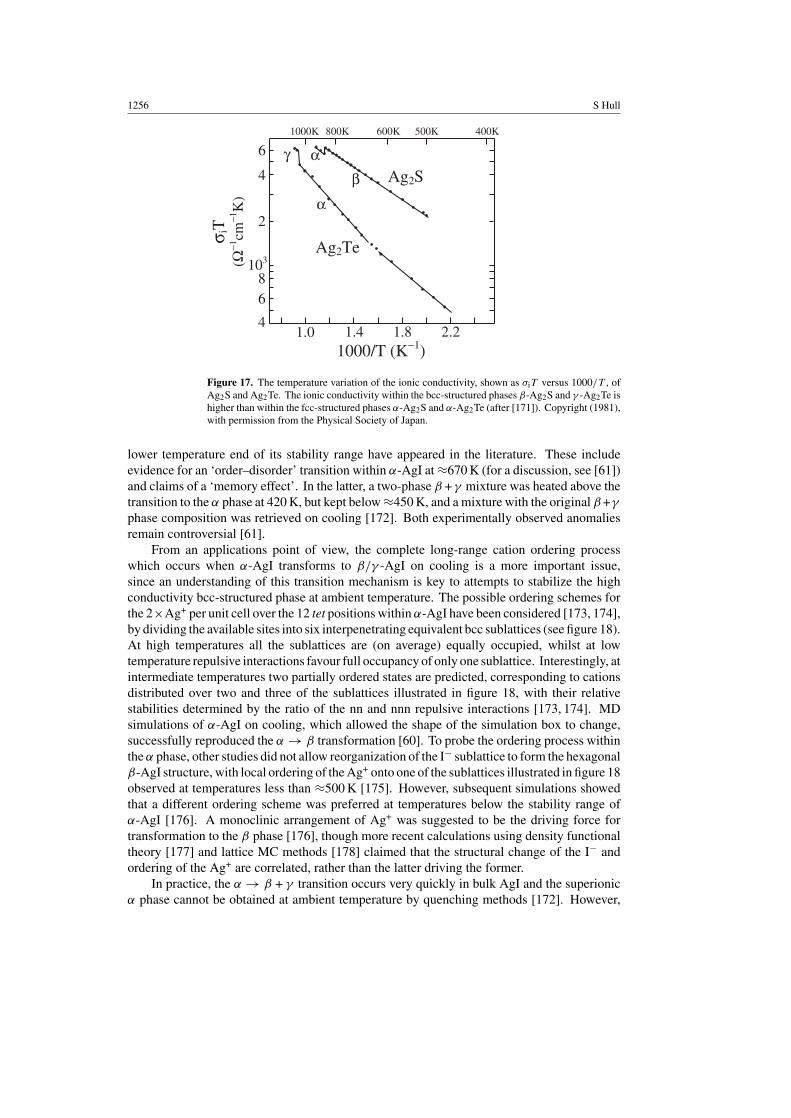
Figure 17. The temperature variation of the ionic conductivity, shown as σiT versus 1000/T , ofAg2S and Ag2Te. The ionic conductivity within the bcc-structured phases β-Ag2S and γ -Ag2Te ishigher than within the fcc-structured phases α-Ag2S and α-Ag2Te (after [171]). Copyright (1981),with permission from the Physical Society of Japan.
lower temperature end of its stability range have appeared in the literature. These includeevidence for an ‘order–disorder’ transition within α-AgI at ≈670 K (for a discussion, see [61])and claims of a ‘memory effect’. In the latter, a two-phase β +γ mixture was heated above thetransition to the α phase at 420 K, but kept below ≈450 K, and a mixture with the original β +γ
phase composition was retrieved on cooling [172]. Both experimentally observed anomaliesremain controversial [61].
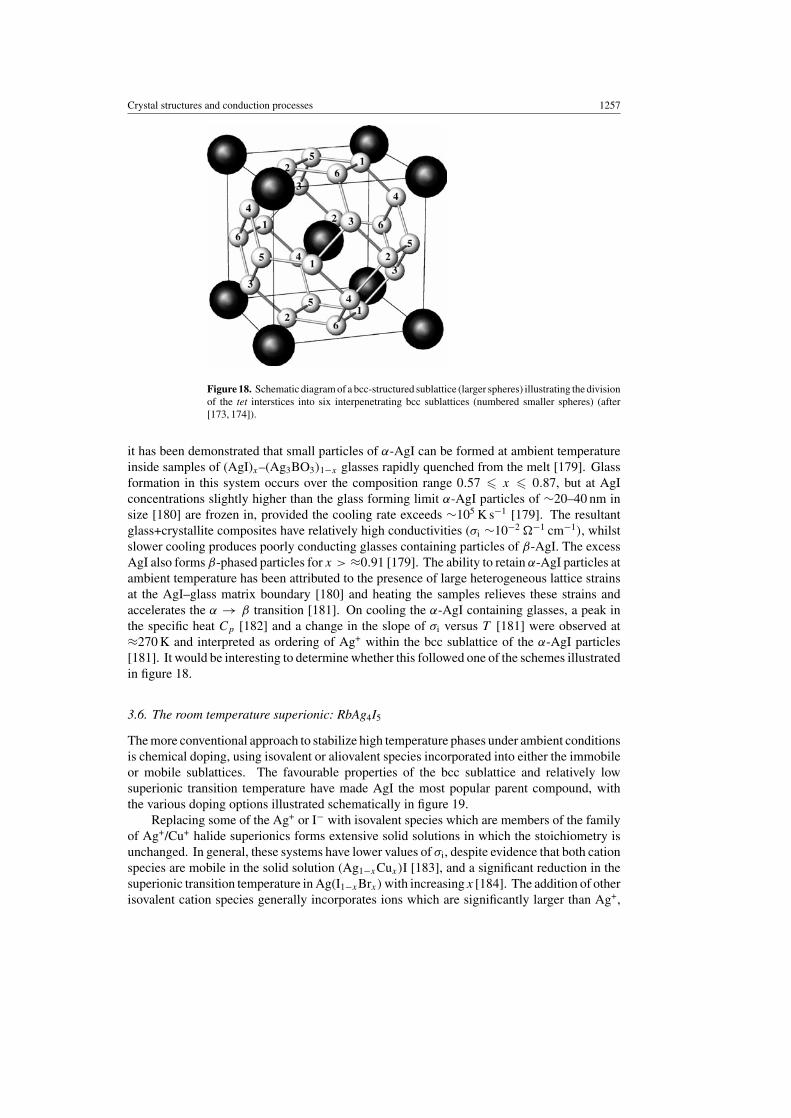
From an applications point of view, the complete long-range cation ordering processwhich occurs when α-AgI transforms to β/γ -AgI on cooling is a more important issue,since an understanding of this transition mechanism is key to attempts to stabilize the highconductivity bcc-structured phase at ambient temperature. The possible ordering schemes forthe 2×Ag+ per unit cell over the 12 tet positions within α-AgI have been considered [173, 174],by dividing the available sites into six interpenetrating equivalent bcc sublattices (see figure 18).At high temperatures all the sublattices are (on average) equally occupied, whilst at lowtemperature repulsive interactions favour full occupancy of only one sublattice. Interestingly, atintermediate temperatures two partially ordered states are predicted, corresponding to cationsdistributed over two and three of the sublattices illustrated in figure 18, with their relativestabilities determined by the ratio of the nn and nnn repulsive interactions [173, 174]. MDsimulations of α-AgI on cooling, which allowed the shape of the simulation box to change,successfully reproduced the α → β transformation [60]. To probe the ordering process withinthe α phase, other studies did not allow reorganization of the I− sublattice to form the hexagonalβ-AgI structure, with local ordering of the Ag+ onto one of the sublattices illustrated in figure 18observed at temperatures less than ≈500 K [175]. However, subsequent simulations showedthat a different ordering scheme was preferred at temperatures below the stability range ofα-AgI [176]. A monoclinic arrangement of Ag+ was suggested to be the driving force fortransformation to the β phase [176], though more recent calculations using density functionaltheory [177] and lattice MC methods [178] claimed that the structural change of the I− andordering of the Ag+ are correlated, rather than the latter driving the former.
In practice, the α → β + γ transition occurs very quickly in bulk AgI and the superionicα phase cannot be obtained at ambient temperature by quenching methods [172]. However,
Crystal structures and conduction processes 1257
Figure 18. Schematic diagram of a bcc-structured sublattice (larger spheres) illustrating the divisionof the tet interstices into six interpenetrating bcc sublattices (numbered smaller spheres) (after[173, 174]).
it has been demonstrated that small particles of α-AgI can be formed at ambient temperatureinside samples of (AgI)x–(Ag3BO3)1−x glasses rapidly quenched from the melt [179]. Glassformation in this system occurs over the composition range 0.57 x 0.87, but at AgIconcentrations slightly higher than the glass forming limit α-AgI particles of ∼20–40 nm insize [180] are frozen in, provided the cooling rate exceeds ∼105 K s−1 [179]. The resultantglass+crystallite composites have relatively high conductivities (σi ∼10−2 −1 cm−1), whilstslower cooling produces poorly conducting glasses containing particles of β-AgI. The excessAgI also forms β-phased particles for x > ≈0.91 [179]. The ability to retain α-AgI particles atambient temperature has been attributed to the presence of large heterogeneous lattice strainsat the AgI–glass matrix boundary [180] and heating the samples relieves these strains andaccelerates the α → β transition [181]. On cooling the α-AgI containing glasses, a peak inthe specific heat Cp [182] and a change in the slope of σi versus T [181] were observed at≈270 K and interpreted as ordering of Ag+ within the bcc sublattice of the α-AgI particles[181]. It would be interesting to determine whether this followed one of the schemes illustratedin figure 18.
3.6. The room temperature superionic: RbAg4I5
The more conventional approach to stabilize high temperature phases under ambient conditionsis chemical doping, using isovalent or aliovalent species incorporated into either the immobileor mobile sublattices. The favourable properties of the bcc sublattice and relatively lowsuperionic transition temperature have made AgI the most popular parent compound, withthe various doping options illustrated schematically in figure 19.
Replacing some of the Ag+ or I− with isovalent species which are members of the familyof Ag+/Cu+ halide superionics forms extensive solid solutions in which the stoichiometry isunchanged. In general, these systems have lower values of σi, despite evidence that both cationspecies are mobile in the solid solution (Ag1−xCux)I [183], and a significant reduction in thesuperionic transition temperature in Ag(I1−xBrx) with increasing x [184]. The addition of otherisovalent cation species generally incorporates ions which are significantly larger than Ag+,
1258 S Hull
AgI
Isovalent
(Ag1-xCux)IKAg4I5
RbAg4I5
Complete
Ag2S Ag2SeAg2Te
Aliovalent
Ag2HgI4
Ag3SnI5
Ag4PbI6
Partial
Ag(BrxI1-x)Ag3SI
Ag5Te2I
ANION REPLACEMENT CATION REPLACEMENT
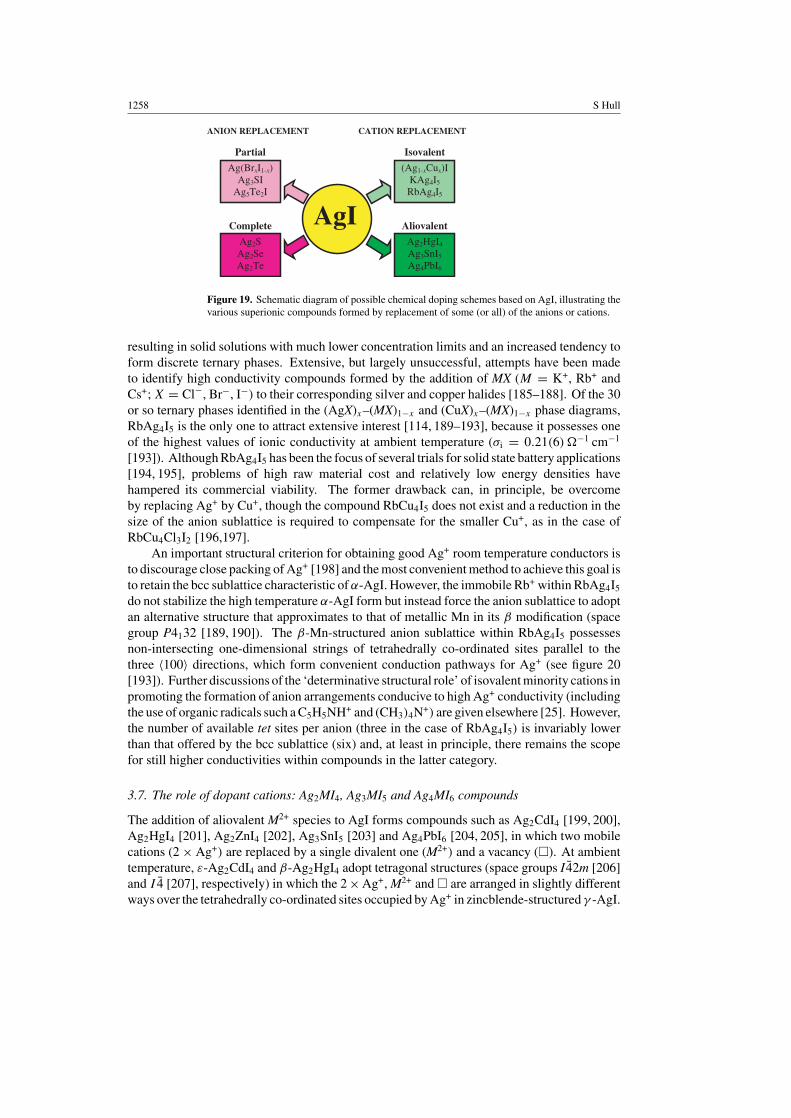
Figure 19. Schematic diagram of possible chemical doping schemes based on AgI, illustrating thevarious superionic compounds formed by replacement of some (or all) of the anions or cations.
resulting in solid solutions with much lower concentration limits and an increased tendency toform discrete ternary phases. Extensive, but largely unsuccessful, attempts have been madeto identify high conductivity compounds formed by the addition of MX (M = K+, Rb+ andCs+; X = Cl−, Br−, I−) to their corresponding silver and copper halides [185–188]. Of the 30or so ternary phases identified in the (AgX)x–(MX)1−x and (CuX)x–(MX)1−x phase diagrams,RbAg4I5 is the only one to attract extensive interest [114, 189–193], because it possesses oneof the highest values of ionic conductivity at ambient temperature (σi = 0.21(6) −1 cm−1
[193]). Although RbAg4I5 has been the focus of several trials for solid state battery applications[194, 195], problems of high raw material cost and relatively low energy densities havehampered its commercial viability. The former drawback can, in principle, be overcomeby replacing Ag+ by Cu+, though the compound RbCu4I5 does not exist and a reduction in thesize of the anion sublattice is required to compensate for the smaller Cu+, as in the case ofRbCu4Cl3I2 [196,197].
An important structural criterion for obtaining good Ag+ room temperature conductors isto discourage close packing of Ag+ [198] and the most convenient method to achieve this goal isto retain the bcc sublattice characteristic of α-AgI. However, the immobile Rb+ within RbAg4I5
do not stabilize the high temperature α-AgI form but instead force the anion sublattice to adoptan alternative structure that approximates to that of metallic Mn in its β modification (spacegroup P4132 [189, 190]). The β-Mn-structured anion sublattice within RbAg4I5 possessesnon-intersecting one-dimensional strings of tetrahedrally co-ordinated sites parallel to thethree 〈100〉 directions, which form convenient conduction pathways for Ag+ (see figure 20[193]). Further discussions of the ‘determinative structural role’ of isovalent minority cations inpromoting the formation of anion arrangements conducive to high Ag+ conductivity (includingthe use of organic radicals such a C5H5NH+ and (CH3)4N+) are given elsewhere [25]. However,the number of available tet sites per anion (three in the case of RbAg4I5) is invariably lowerthan that offered by the bcc sublattice (six) and, at least in principle, there remains the scopefor still higher conductivities within compounds in the latter category.
3.7. The role of dopant cations: Ag2MI4, Ag3MI5 and Ag4MI6 compounds
The addition of aliovalent M2+ species to AgI forms compounds such as Ag2CdI4 [199, 200],Ag2HgI4 [201], Ag2ZnI4 [202], Ag3SnI5 [203] and Ag4PbI6 [204, 205], in which two mobilecations (2 × Ag+) are replaced by a single divalent one (M2+) and a vacancy (). At ambienttemperature, ε-Ag2CdI4 and β-Ag2HgI4 adopt tetragonal structures (space groups I 42m [206]and I 4 [207], respectively) in which the 2 × Ag+, M2+ and are arranged in slightly differentways over the tetrahedrally co-ordinated sites occupied by Ag+ in zincblende-structured γ -AgI.
Crystal structures and conduction processes 1259
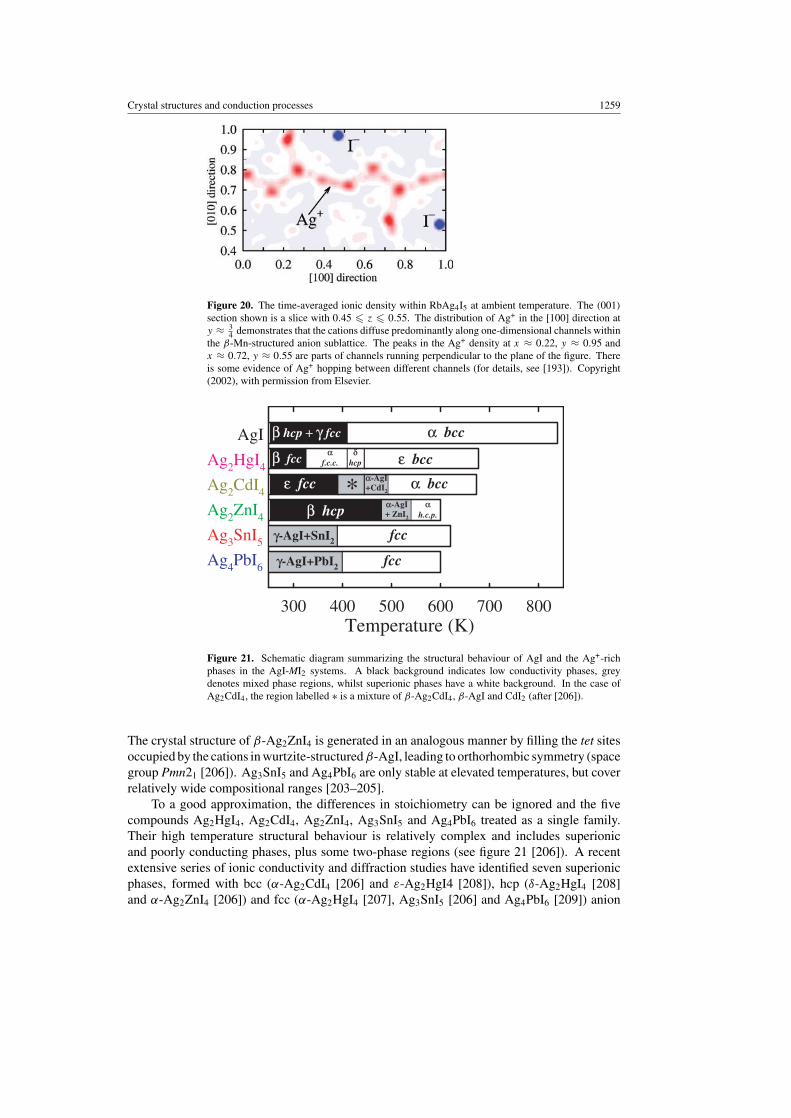
Figure 20. The time-averaged ionic density within RbAg4I5 at ambient temperature. The (001)
section shown is a slice with 0.45 z 0.55. The distribution of Ag+ in the [100] direction aty ≈ 3
4 demonstrates that the cations diffuse predominantly along one-dimensional channels withinthe β-Mn-structured anion sublattice. The peaks in the Ag+ density at x ≈ 0.22, y ≈ 0.95 andx ≈ 0.72, y ≈ 0.55 are parts of channels running perpendicular to the plane of the figure. Thereis some evidence of Ag+ hopping between different channels (for details, see [193]). Copyright(2002), with permission from Elsevier.
Temperature (K)300 400 500 600 700 800
Ag2HgI4
AgI
Ag2CdI4
Ag2ZnI4
Ag3SnI5
Ag4PbI6
β hcp + + γ fcc
ε fcc
β fcc
γ-AgI+PbI2
γ-AgI+SnI2 fcc
fcc
δhcp ε ε bcc
β β hcp α-AgI+ ZnI2
α-AgI+CdI2∗
αh.c.p.
αf.c.c.
α bcc
α bcc
Figure 21. Schematic diagram summarizing the structural behaviour of AgI and the Ag+-richphases in the AgI-MI2 systems. A black background indicates low conductivity phases, greydenotes mixed phase regions, whilst superionic phases have a white background. In the case ofAg2CdI4, the region labelled ∗ is a mixture of β-Ag2CdI4, β-AgI and CdI2 (after [206]).
The crystal structure of β-Ag2ZnI4 is generated in an analogous manner by filling the tet sitesoccupied by the cations in wurtzite-structured β-AgI, leading to orthorhombic symmetry (spacegroup Pmn21 [206]). Ag3SnI5 and Ag4PbI6 are only stable at elevated temperatures, but coverrelatively wide compositional ranges [203–205].
To a good approximation, the differences in stoichiometry can be ignored and the fivecompounds Ag2HgI4, Ag2CdI4, Ag2ZnI4, Ag3SnI5 and Ag4PbI6 treated as a single family.Their high temperature structural behaviour is relatively complex and includes superionicand poorly conducting phases, plus some two-phase regions (see figure 21 [206]). A recentextensive series of ionic conductivity and diffraction studies have identified seven superionicphases, formed with bcc (α-Ag2CdI4 [206] and ε-Ag2HgI4 [208]), hcp (δ-Ag2HgI4 [208]and α-Ag2ZnI4 [206]) and fcc (α-Ag2HgI4 [207], Ag3SnI5 [206] and Ag4PbI6 [209]) anion
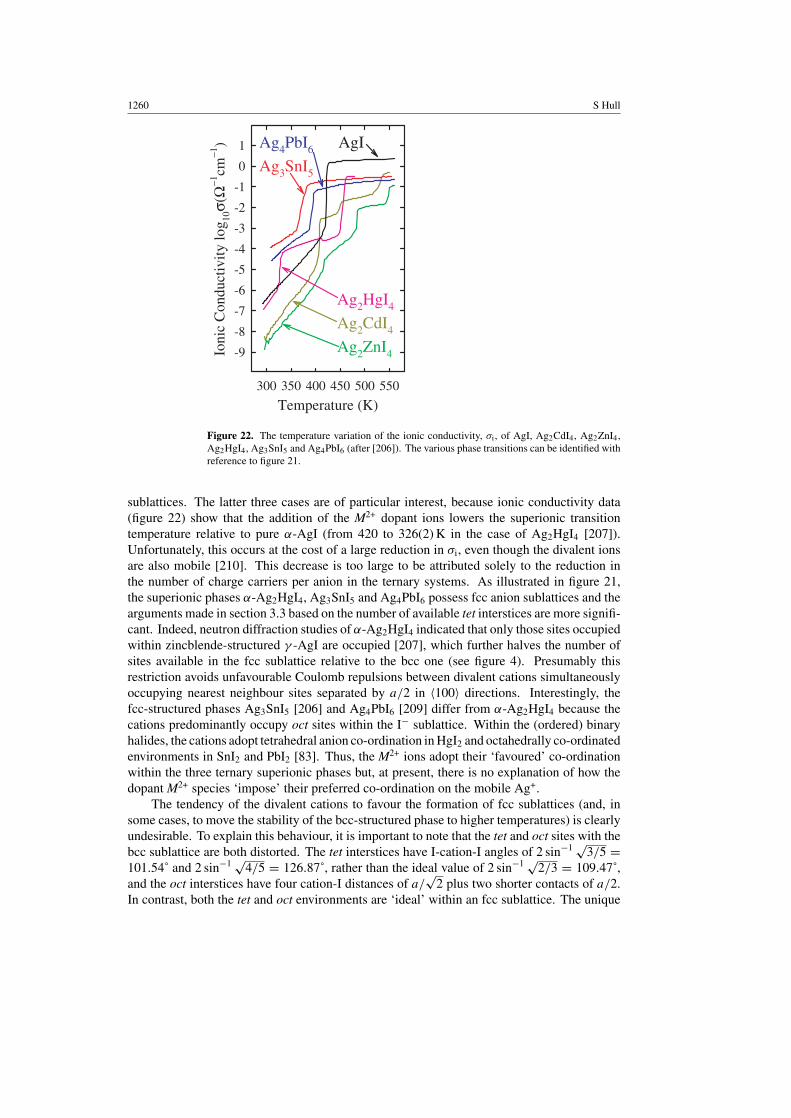
1260 S Hull
Temperature (K)300 350 400 450 500 550
-9
-8
-7
-6
-5
-4
-3
-2
-1
0
1
Ioni
c C
ondu
ctiv
ity lo
g 10σ(
Ω−1
cm−1
)
Ag2HgI4
Ag2CdI4
Ag2ZnI4
Ag4PbI6 AgI
Ag3SnI5
Figure 22. The temperature variation of the ionic conductivity, σi, of AgI, Ag2CdI4, Ag2ZnI4,Ag2HgI4, Ag3SnI5 and Ag4PbI6 (after [206]). The various phase transitions can be identified withreference to figure 21.
sublattices. The latter three cases are of particular interest, because ionic conductivity data(figure 22) show that the addition of the M2+ dopant ions lowers the superionic transitiontemperature relative to pure α-AgI (from 420 to 326(2) K in the case of Ag2HgI4 [207]).Unfortunately, this occurs at the cost of a large reduction in σi, even though the divalent ionsare also mobile [210]. This decrease is too large to be attributed solely to the reduction inthe number of charge carriers per anion in the ternary systems. As illustrated in figure 21,the superionic phases α-Ag2HgI4, Ag3SnI5 and Ag4PbI6 possess fcc anion sublattices and thearguments made in section 3.3 based on the number of available tet interstices are more signifi-cant. Indeed, neutron diffraction studies of α-Ag2HgI4 indicated that only those sites occupiedwithin zincblende-structured γ -AgI are occupied [207], which further halves the number ofsites available in the fcc sublattice relative to the bcc one (see figure 4). Presumably thisrestriction avoids unfavourable Coulomb repulsions between divalent cations simultaneouslyoccupying nearest neighbour sites separated by a/2 in 〈100〉 directions. Interestingly, thefcc-structured phases Ag3SnI5 [206] and Ag4PbI6 [209] differ from α-Ag2HgI4 because thecations predominantly occupy oct sites within the I− sublattice. Within the (ordered) binaryhalides, the cations adopt tetrahedral anion co-ordination in HgI2 and octahedrally co-ordinatedenvironments in SnI2 and PbI2 [83]. Thus, the M2+ ions adopt their ‘favoured’ co-ordinationwithin the three ternary superionic phases but, at present, there is no explanation of how thedopant M2+ species ‘impose’ their preferred co-ordination on the mobile Ag+.
The tendency of the divalent cations to favour the formation of fcc sublattices (and, insome cases, to move the stability of the bcc-structured phase to higher temperatures) is clearlyundesirable. To explain this behaviour, it is important to note that the tet and oct sites with thebcc sublattice are both distorted. The tet interstices have I-cation-I angles of 2 sin−1 √
3/5 =101.54˚ and 2 sin−1 √
4/5 = 126.87˚, rather than the ideal value of 2 sin−1 √2/3 = 109.47˚,
and the oct interstices have four cation-I distances of a/√
2 plus two shorter contacts of a/2.In contrast, both the tet and oct environments are ‘ideal’ within an fcc sublattice. The unique
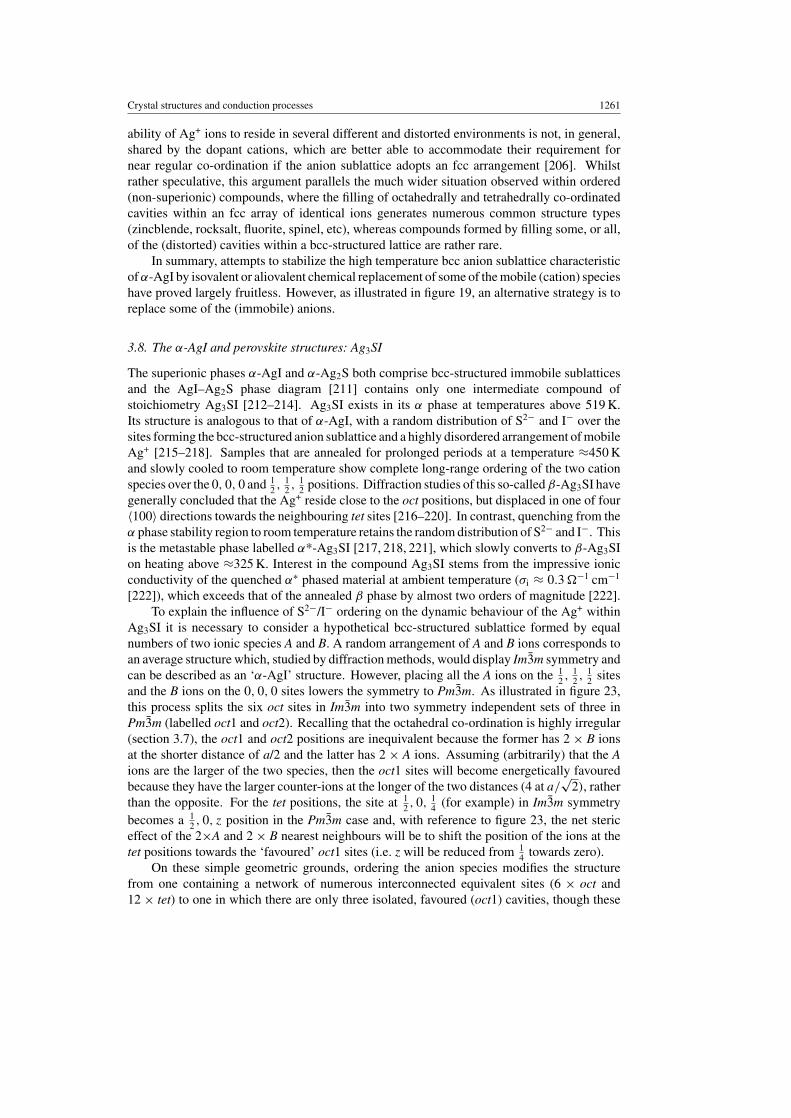
Crystal structures and conduction processes 1261
ability of Ag+ ions to reside in several different and distorted environments is not, in general,shared by the dopant cations, which are better able to accommodate their requirement fornear regular co-ordination if the anion sublattice adopts an fcc arrangement [206]. Whilstrather speculative, this argument parallels the much wider situation observed within ordered(non-superionic) compounds, where the filling of octahedrally and tetrahedrally co-ordinatedcavities within an fcc array of identical ions generates numerous common structure types(zincblende, rocksalt, fluorite, spinel, etc), whereas compounds formed by filling some, or all,of the (distorted) cavities within a bcc-structured lattice are rather rare.
In summary, attempts to stabilize the high temperature bcc anion sublattice characteristicof α-AgI by isovalent or aliovalent chemical replacement of some of the mobile (cation) specieshave proved largely fruitless. However, as illustrated in figure 19, an alternative strategy is toreplace some of the (immobile) anions.
3.8. The α-AgI and perovskite structures: Ag3SI
The superionic phases α-AgI and α-Ag2S both comprise bcc-structured immobile sublatticesand the AgI–Ag2S phase diagram [211] contains only one intermediate compound ofstoichiometry Ag3SI [212–214]. Ag3SI exists in its α phase at temperatures above 519 K.Its structure is analogous to that of α-AgI, with a random distribution of S2− and I− over thesites forming the bcc-structured anion sublattice and a highly disordered arrangement of mobileAg+ [215–218]. Samples that are annealed for prolonged periods at a temperature ≈450 Kand slowly cooled to room temperature show complete long-range ordering of the two cationspecies over the 0, 0, 0 and 1
2 , 12 , 1
2 positions. Diffraction studies of this so-called β-Ag3SI havegenerally concluded that the Ag+ reside close to the oct positions, but displaced in one of four〈100〉 directions towards the neighbouring tet sites [216–220]. In contrast, quenching from theα phase stability region to room temperature retains the random distribution of S2− and I−. Thisis the metastable phase labelled α*-Ag3SI [217, 218, 221], which slowly converts to β-Ag3SIon heating above ≈325 K. Interest in the compound Ag3SI stems from the impressive ionicconductivity of the quenched α∗ phased material at ambient temperature (σi ≈ 0.3 −1 cm−1
[222]), which exceeds that of the annealed β phase by almost two orders of magnitude [222].To explain the influence of S2−/I− ordering on the dynamic behaviour of the Ag+ within
Ag3SI it is necessary to consider a hypothetical bcc-structured sublattice formed by equalnumbers of two ionic species A and B. A random arrangement of A and B ions corresponds toan average structure which, studied by diffraction methods, would display Im3m symmetry andcan be described as an ‘α-AgI’ structure. However, placing all the A ions on the 1
2 , 12 , 1
2 sitesand the B ions on the 0, 0, 0 sites lowers the symmetry to Pm3m. As illustrated in figure 23,this process splits the six oct sites in Im3m into two symmetry independent sets of three inPm3m (labelled oct1 and oct2). Recalling that the octahedral co-ordination is highly irregular(section 3.7), the oct1 and oct2 positions are inequivalent because the former has 2 × B ionsat the shorter distance of a/2 and the latter has 2 × A ions. Assuming (arbitrarily) that the Aions are the larger of the two species, then the oct1 sites will become energetically favouredbecause they have the larger counter-ions at the longer of the two distances (4 at a/
√2), rather
than the opposite. For the tet positions, the site at 12 , 0, 1
4 (for example) in Im3m symmetrybecomes a 1
2 , 0, z position in the Pm3m case and, with reference to figure 23, the net stericeffect of the 2×A and 2 × B nearest neighbours will be to shift the position of the ions at thetet positions towards the ‘favoured’ oct1 sites (i.e. z will be reduced from 1
4 towards zero).On these simple geometric grounds, ordering the anion species modifies the structure
from one containing a network of numerous interconnected equivalent sites (6 × oct and12 × tet) to one in which there are only three isolated, favoured (oct1) cavities, though these

1262 S Hull
3Im m
3Pm m
(a)
(b)
tet
tet
oct
oct1oct2
A
B
Figure 23. Schematic diagram showing the effect of ordering of two different ionic species Aand B over the 1
2 , 12 , 1
2 and 0, 0, 0 positions that form a bcc sublattice. The lowering of symmetryfrom (a) Im3m to (b) Pm3m splits the octahedrally co-ordinated oct sites into two independentsets, of which those labelled oct1 are more favourable because they have the larger A counterionat the larger distance (i.e. in 〈110〉 directions rather than 〈100〉). The favoured positions of thetetrahedrally co-ordinated sites (tet) are also moved in 〈100〉 directions towards the oct1 sites, asshown by the arrow. For clarity, only one tet site is illustrated. Overall, this process corresponds tothe transition from (a) an α-AgI type phase to (b) an (anti-) perovskite-structured one (after [227]).
are somewhat larger and extend towards the tet positions in four 〈100〉 directions. For A = I−
and B = S2− (where rI− = 2.20 Å and rS2− = 1.84 Å [66]), the number of oct1 sites within theordered β-Ag3SI phase equals the population of Ag+. Clearly, this discussion offers a plausibleexplanation for the lower ionic conductivity of the β-phased material compared to α∗-Ag3SIand is consistent with the Ag+ distribution determined experimentally by neutron diffractionmethods [218]. As illustrated in figure 24, the structural model which provides the best fit tothe diffraction data distributes the cations over sites situated approximately midway betweenthe tet and oct1 sites. These sites are grouped in fours and, with one Ag+ per group, an equallyvalid description of the time-averaged distribution has the cations occupying the oct1 positionsand undergoing extensive, anisotropic and anharmonic thermal vibrations towards the tet sites.For this reason, the crystal structure of β-Ag3SI is often described as an ‘anti-perovskite’arrangement. However, perovskite-structured compounds, in which two cation species formthe immobile bcc sublattice and anions sit in (or close to) the oct1 positions, are far morenumerous than anti-perovskite-structured ones [223].
3.9. Perovskite-structured superionics: MPbF3 compounds
Exchanging the roles of the cations and anions to transform the anti-perovskite structure ofβ-Ag3SI into the perovskite one has a number of consequences for possible ionic diffusion.
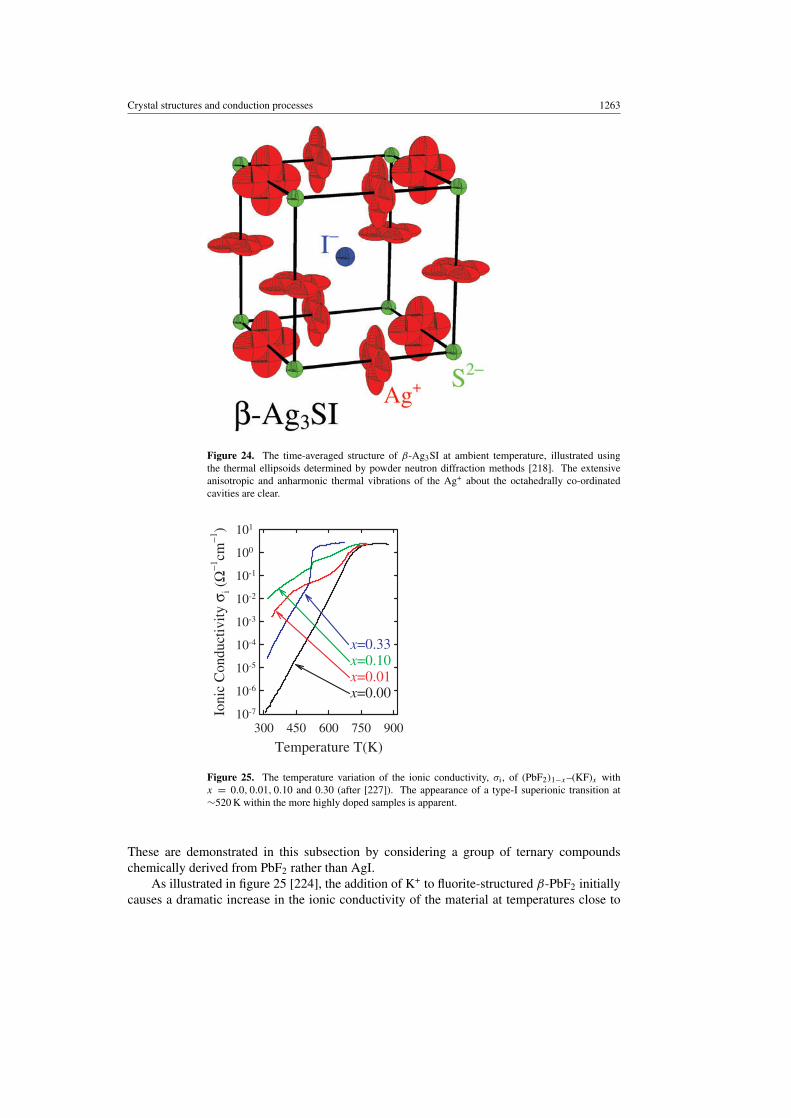
Crystal structures and conduction processes 1263
Figure 24. The time-averaged structure of β-Ag3SI at ambient temperature, illustrated usingthe thermal ellipsoids determined by powder neutron diffraction methods [218]. The extensiveanisotropic and anharmonic thermal vibrations of the Ag+ about the octahedrally co-ordinatedcavities are clear.
Temperature T(K)300 450 600 750 900
Ioni
c C
ondu
ctiv
ityσ i
( Ω−1
cm−1
) 101
100
10-1
10-2
10-3
10-4
10-5
10-6
10-7
x=0.33x=0.10x=0.01x=0.00
Figure 25. The temperature variation of the ionic conductivity, σi, of (PbF2)1−x–(KF)x withx = 0.0, 0.01, 0.10 and 0.30 (after [227]). The appearance of a type-I superionic transition at∼520 K within the more highly doped samples is apparent.
These are demonstrated in this subsection by considering a group of ternary compoundschemically derived from PbF2 rather than AgI.
As illustrated in figure 25 [224], the addition of K+ to fluorite-structured β-PbF2 initiallycauses a dramatic increase in the ionic conductivity of the material at temperatures close to
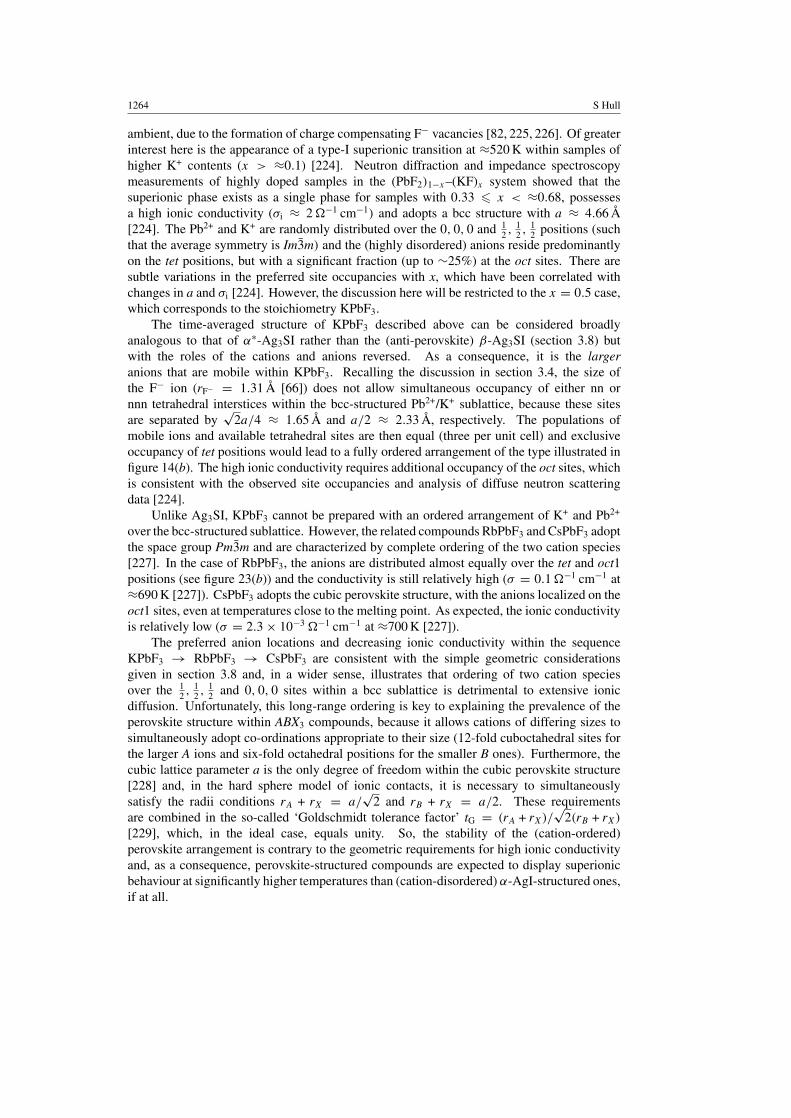
1264 S Hull
ambient, due to the formation of charge compensating F− vacancies [82, 225, 226]. Of greaterinterest here is the appearance of a type-I superionic transition at ≈520 K within samples ofhigher K+ contents (x > ≈0.1) [224]. Neutron diffraction and impedance spectroscopymeasurements of highly doped samples in the (PbF2)1−x–(KF)x system showed that thesuperionic phase exists as a single phase for samples with 0.33 x < ≈0.68, possessesa high ionic conductivity (σi ≈ 2 −1 cm−1) and adopts a bcc structure with a ≈ 4.66 Å[224]. The Pb2+ and K+ are randomly distributed over the 0, 0, 0 and 1
2 , 12 , 1
2 positions (suchthat the average symmetry is Im3m) and the (highly disordered) anions reside predominantlyon the tet positions, but with a significant fraction (up to ∼25%) at the oct sites. There aresubtle variations in the preferred site occupancies with x, which have been correlated withchanges in a and σi [224]. However, the discussion here will be restricted to the x = 0.5 case,which corresponds to the stoichiometry KPbF3.
The time-averaged structure of KPbF3 described above can be considered broadlyanalogous to that of α∗-Ag3SI rather than the (anti-perovskite) β-Ag3SI (section 3.8) butwith the roles of the cations and anions reversed. As a consequence, it is the largeranions that are mobile within KPbF3. Recalling the discussion in section 3.4, the size ofthe F− ion (rF− = 1.31 Å [66]) does not allow simultaneous occupancy of either nn ornnn tetrahedral interstices within the bcc-structured Pb2+/K+ sublattice, because these sitesare separated by
√2a/4 ≈ 1.65 Å and a/2 ≈ 2.33 Å, respectively. The populations of
mobile ions and available tetrahedral sites are then equal (three per unit cell) and exclusiveoccupancy of tet positions would lead to a fully ordered arrangement of the type illustrated infigure 14(b). The high ionic conductivity requires additional occupancy of the oct sites, whichis consistent with the observed site occupancies and analysis of diffuse neutron scatteringdata [224].
Unlike Ag3SI, KPbF3 cannot be prepared with an ordered arrangement of K+ and Pb2+
over the bcc-structured sublattice. However, the related compounds RbPbF3 and CsPbF3 adoptthe space group Pm3m and are characterized by complete ordering of the two cation species[227]. In the case of RbPbF3, the anions are distributed almost equally over the tet and oct1positions (see figure 23(b)) and the conductivity is still relatively high (σ = 0.1 −1 cm−1 at≈690 K [227]). CsPbF3 adopts the cubic perovskite structure, with the anions localized on theoct1 sites, even at temperatures close to the melting point. As expected, the ionic conductivityis relatively low (σ = 2.3 × 10⁻³ −1 cm−1 at ≈700 K [227]).
The preferred anion locations and decreasing ionic conductivity within the sequenceKPbF3 → RbPbF3 → CsPbF3 are consistent with the simple geometric considerationsgiven in section 3.8 and, in a wider sense, illustrates that ordering of two cation speciesover the 1
2 , 12 , 1
2 and 0, 0, 0 sites within a bcc sublattice is detrimental to extensive ionicdiffusion. Unfortunately, this long-range ordering is key to explaining the prevalence of theperovskite structure within ABX3 compounds, because it allows cations of differing sizes tosimultaneously adopt co-ordinations appropriate to their size (12-fold cuboctahedral sites forthe larger A ions and six-fold octahedral positions for the smaller B ones). Furthermore, thecubic lattice parameter a is the only degree of freedom within the cubic perovskite structure[228] and, in the hard sphere model of ionic contacts, it is necessary to simultaneouslysatisfy the radii conditions rA + rX = a/
√2 and rB + rX = a/2. These requirements
are combined in the so-called ‘Goldschmidt tolerance factor’ tG = (rA + rX)/√
2(rB + rX)
[229], which, in the ideal case, equals unity. So, the stability of the (cation-ordered)perovskite arrangement is contrary to the geometric requirements for high ionic conductivityand, as a consequence, perovskite-structured compounds are expected to display superionicbehaviour at significantly higher temperatures than (cation-disordered) α-AgI-structured ones,if at all.
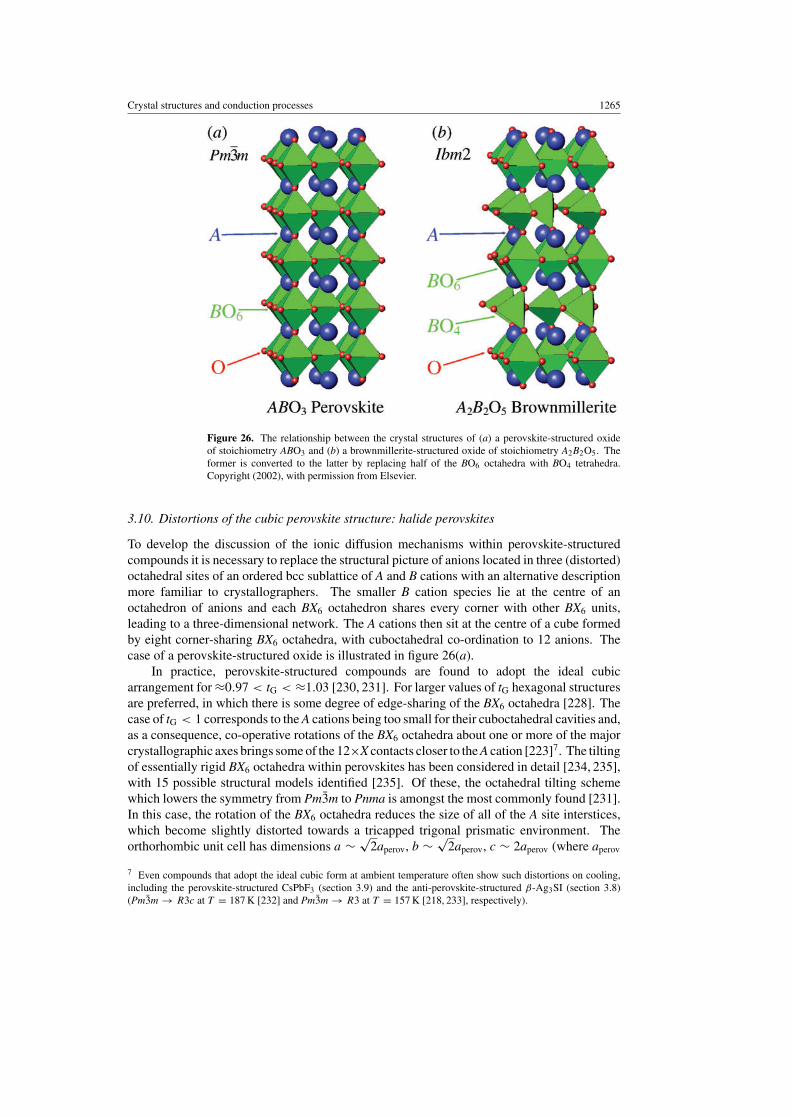
Crystal structures and conduction processes 1265
Figure 26. The relationship between the crystal structures of (a) a perovskite-structured oxideof stoichiometry ABO3 and (b) a brownmillerite-structured oxide of stoichiometry A2B2O5. Theformer is converted to the latter by replacing half of the BO6 octahedra with BO4 tetrahedra.Copyright (2002), with permission from Elsevier.
3.10. Distortions of the cubic perovskite structure: halide perovskites
To develop the discussion of the ionic diffusion mechanisms within perovskite-structuredcompounds it is necessary to replace the structural picture of anions located in three (distorted)octahedral sites of an ordered bcc sublattice of A and B cations with an alternative descriptionmore familiar to crystallographers. The smaller B cation species lie at the centre of anoctahedron of anions and each BX6 octahedron shares every corner with other BX6 units,leading to a three-dimensional network. The A cations then sit at the centre of a cube formedby eight corner-sharing BX6 octahedra, with cuboctahedral co-ordination to 12 anions. Thecase of a perovskite-structured oxide is illustrated in figure 26(a).
In practice, perovskite-structured compounds are found to adopt the ideal cubicarrangement for ≈0.97 < tG < ≈1.03 [230, 231]. For larger values of tG hexagonal structuresare preferred, in which there is some degree of edge-sharing of the BX6 octahedra [228]. Thecase of tG < 1 corresponds to the A cations being too small for their cuboctahedral cavities and,as a consequence, co-operative rotations of the BX6 octahedra about one or more of the majorcrystallographic axes brings some of the 12×X contacts closer to the A cation [223]7. The tiltingof essentially rigid BX6 octahedra within perovskites has been considered in detail [234, 235],with 15 possible structural models identified [235]. Of these, the octahedral tilting schemewhich lowers the symmetry from Pm3m to Pnma is amongst the most commonly found [231].In this case, the rotation of the BX6 octahedra reduces the size of all of the A site interstices,which become slightly distorted towards a tricapped trigonal prismatic environment. Theorthorhombic unit cell has dimensions a ∼ √
2aperov, b ∼ √2aperov, c ∼ 2aperov (where aperov
7 Even compounds that adopt the ideal cubic form at ambient temperature often show such distortions on cooling,including the perovskite-structured CsPbF3 (section 3.9) and the anti-perovskite-structured β-Ag3SI (section 3.8)(Pm3m → R3c at T = 187 K [232] and Pm3m → R3 at T = 157 K [218, 233], respectively).

1266 S Hull
is the lattice parameter of the parent cubic form) and contains four ABX3 formula units, withthe anions arranged over two symmetry independent sites [228].
The two perovskite-structured compounds KMgF3 and NaMgF3 have tG = 1.024 and0.938, respectively [66]. As expected, the former possesses the undistorted cubic perovskitestructure over a wide temperature range (4.2 T (K) 1223 [236]) whilst NaMgF3
adopts the Pnma variant [237] due to co-operative rotations of the MgF6 octahedra byaround 14˚ [238]. NaMgF3 transforms to the cubic form at ≈1170 K and was reportedto undergo a type-II superionic transition just below the melting point (Tm = 1303 K) inwhich σi reaches ≈1.3 −1 cm−1 [239]. However, a subsequent MD simulation failed toobserve any significant diffusion of either the anions or cations, even with strong superheating[240]. Subsequent measurements of the ionic conductivity of NaMgF3 found no evidencefor any abnormal increase in σi at elevated temperatures and suggested that the previousmeasurements resulted from spurious surface electronic conduction [241]. Indeed, the presenceof superionic behaviour within many fluoride perovskites has been the subject of much debatewithin the literature, with conflicting evidence for and against extensive F− ion diffusionin compounds such as KMgF3 [241, 242], NaMgF3 [237, 239–243], KCaF3 [242, 244–246]and KZnF3 [241, 244, 247, 248] on the basis of ionic conductivity measurements, NMRstudies, neutron diffraction experiments, MD simulations and investigations of the mechanicalproperties.
3.11. Superionicity in the lower mantle: MgSiO3
A major motivation for the high temperature studies of halide perovskites such as NaMgF3
stems from their role as structural analogues to the perovskite-structured oxide magnesiumsilicate. MgSiO3 is a major constituent of the earth’s lower mantle, which extends froma depth below the surface of ≈670 to ≈2900 km and constitutes approximately half of thevolume of our planet. Probable pressure and temperature ranges within the lower mantleare ≈24 < p(GPa) < ≈135 and ∼2000 < T (K) < ∼3000 [249]. Under these conditions,MgSiO3 exists in a perovskite-structured phase and metastable samples quenched from elevatedpressures and temperatures to ambient conditions show the Pnma modification discussed inthe previous subsection [250].
Considerable research effort has been devoted to elucidating the structural properties ofMgSiO3 within its p–T stability field, following suggestions that it may display superionicbehaviour within the lower mantle [251]. The presence of an ionically conducting solid phasewould have consequences for the earth’s geophysical behaviour, because the conductivity ofthe lower mantle controls the transmission of geomagnetic signals from the core to the surface.This may, in turn, help to explain the abrupt ‘jerks’ in the magnetic field such as that observedin 1969 [251]. Indeed, the propagation of geomagnetic field variations was used to estimatethat the conductivity of the lower mantle increases from ∼0.01 to ∼1 −1 cm−1 when the depthis increased [252, 253]. However, other workers attributed these high values to the presenceof water [254] and argued that extensive O2− disorder in MgSiO3 is unlikely because pressureincreases the activation energy for ionic diffusion [255]. MD studies suggested that a transitionfrom the orthorhombic (Pnma) structure to a highly disordered cubic perovskite phase (Pm3m)
occurs with increasing temperature at pressures greater than 10 GPa [256]. Within the cubicphase, anion motion occurred along the edge of the SiO6 octahedra in 〈110〉 directions [257].Subsequent MD studies have both supported [258, 259] and contradicted [260] these findings,though a consistent aspect of these simulations is that extensive anion disorder is only observedwithin the cubic, rather than the orthorhombic, form. Experimentally, recent synchrotron x-raystudies using samples encapsulated in laser-heated diamond anvil cells find no evidence of a

Crystal structures and conduction processes 1267
transition to the cubic phase at high pressures and temperatures [261, 262] and, therefore, tendnot to support the presence of a superionic lower mantle.
3.12. Selection criteria for high conductivity perovskites: BaCeO3 and LaGaO3
Compounds that exhibit high oxygen ion conductivities at elevated temperatures are verydesirable for use as solid electrolytes to provide ‘clean’ electrical power in high energydensity fuel cells [31, 33, 34]. Putting aside any commercial, environmental and fabricationconsiderations, the key requirements for this role are a high ionic conductivity, σi, coupled witha low electrical conductivity, σe. A number of systematic selection criteria have been proposedas a means of identifying promising candidate materials, based largely on steric considerationsand ‘chemical sense’ [263–269]. In the case of perovskite-structured ABO3 oxides, these canbe summarized as follows:
• The material should possess low metal–oxygen binding energies to allow the O2− to ‘breakfree’ and diffuse through the lattice.
• B site cations with multiple valence states should be avoided, since they can give rise toan unwanted contribution from electronic conduction.
• The Goldschmidt tolerance factor tG should be close to unity, so that the material adoptsthe ideal cubic perovskite structure. This enhances σi by making all the oxygen sitescrystallographically (and, therefore, energetically) equivalent, but this is not the case forthe distorted Pnma variant of the perovskite structure discussed in the previous subsections.
• The ‘free volume’ (VFree = a3 − ∑A,B,O
43πr3) should be as large as possible to maximize
the space available for O2− diffusion. However, it has been shown that VFree increaseswith decreasing tG, which is contrary to the requirement of the previous criterion [268].As a compromise, an optimum value of tG ≈ 0.96 has been proposed [268].
• On the assumption that anion diffusion in perovskites occurs in 〈110〉 directionsalong the edges of the B-centred octahedra [270], the O2− must diffuse througha triangular ‘aperture’ formed by 2 × A and 1 × B cations and its radius(rCrit = (r2
A + 3a2/4 − √2arB + r2
B)/(2rA +√
2a − 2rB)) must be greater than rO2−
[265, 266]. However, this concept has been questioned, because computer simulationsshowed that the O2− follow a curved path along the edge of the octahedra to avoid the Bsite cation and significant outward relaxations of the A and B cations occur [271, 272].
The points listed above may appear rather naive, but their validity can be demonstratedwith reference to real compounds [268]. For example, the last two criteria require that the Acation be as large as possible. In the case of A3+B3+O3 perovskites, the largest suitable trivalentcation is La3+ and the requirement for tG ≈ 0.96 makes Ga3+ the most appropriate B site cation.LaGaO3 and its derivatives are indeed excellent oxide-ion conducting perovskites (see, e.g.[273]). Similar arguments for the case of A2+B4+O3 perovskites can be used to ‘predict’ theimpressive conducting properties of BaCeO3. However, whilst oxide ion conductivity in thiscompound dominates at temperatures in excess of ∼1100 K [274], protonic charge carriers canbe incorporated into the oxide perovskite lattice via the absorption of water molecules from theair, leading to an enhanced conductivity at lower temperatures [275, 276]. Due to its small sizeand high polarizing power, the bare proton does not conduct in the same way as other ions andH+-ion conductors will not be discussed here (though there are a number of comprehensivereviews of this important issue, including [277–279]).
To derive meaningful empirical relationships between the crystal structure (includingany distortions of the perovskite lattice) and the bulk O2− conduction the former needs to beaccurately determined, especially at the elevated temperatures at which high ionic conductivity
1268 S Hull
is observed. LaGaO3 and BaCeO3 both adopt the Pnma distorted perovskite arrangement atambient temperature, but their structural behaviour on heating has proved controversial (see[280–285] and [286–288], respectively). In the latter compound, three high temperature phasesare observed [288], but major discrepancies between the space group symmetries determinedby Raman spectroscopy and diffraction methods have been reported. It is often difficult toextract the correct description of the crystal structure using x-ray diffraction, because the tiltsof the BO6 octahedra primarily involve displacements of the lighter O2− and the reflectionsthat violate the parent cubic Pm3m symmetry tend, therefore, to be very weak. In addition, thedistortions of the unit cell are generally small, resulting in only slight splittings of the Braggpeaks. Consequently, high resolution neutron diffraction techniques have proved to be the mostappropriate for their study [288]. Attempts to reconcile the previous Raman and diffractiondata for BaCeO3 have recently been made [287] and favour the Pnma—563 K → Imma—673 K → R3c—1173 K → Pm3m sequence of transitions determined by neutron diffractionmethods [286, 288].
The absence of large empty cavities within the perovskite structure effectively precludesthe formation of anion- and cation-excess perovskites by aliovalent chemical doping methods.However, the alternative possibility of replacing some of the B-site cations by species of alower valence to generate charge compensating anion vacancies has long been established asa means of enhancing the ionic conductivity at lower temperatures [275]. In this case, twoadditional criteria to those listed above have been proposed [265, 268]:
• The dopant cation should possess a similar radius to the B site cation it replaces, to avoidchanging tG and introducing local distortions into the lattice, which would hinder anionmigration.
• The introduction of O2− vacancies increases the free volume available for anion diffusion,causing an initial increase in σi with δ in ABO3−δ (see, e.g. [289]). However, a systematicstudy of the published literature on oxide-ion perovskites shows that an optimum value ofoxygen non-stoichiometry is δ ∼ 0.2, because reductions in σi occur at higher δ valuesdue to short-range interactions between anion vacancies [268].
An example of the ‘radius matched’ doping scheme is provided by Ba(Ce1−xYx)O3−x/2
and its Gd3+ and Nd3+ doped analogues, which have significantly higher ionic conductivitiesthan pure BaCeO3 [32]. Neutron diffraction studies indicated that the extrinsic vacancies arepreferentially located on one of the two sets of anion positions [290] though (as in the purematerial) there has been disagreement between Raman [291] and neutron diffraction [292]studies concerning the symmetry changes induced by doping. In the case of LaGaO3, par-tial replacement of both the A and B sites with comparably sized cations leads to the system(La1−xSrx)(Ga1−yMgy)O3−x/2−y/2, which has been studied by conductivity [273, 293–296],diffraction [282, 284, 285] and computer modelling techniques [272, 297, 298]. For x ≈0.1 and y ≈ 0.1, its ionic conductivity is ≈0.1 −1 cm−1 at ∼1100 K [273, 296].(La1−xSrx)(Ga1−yMgy)O3−x/2−y/2 is thus a promising solid electrolyte to allow oxide fuelcells to operate at lower temperatures than the current ‘best’ material, the anion-deficientfluorite-structured (Zr1−xYx)O2−x/2 (which will be discussed in section 4.7) [299, 300].
3.13. Anion-deficient perovskites: Ba2In2O5 and MBi3O5.5
The onset of short-range correlations between the positions of the O2− vacancies, whichcauses the reduction in the ionic conductivity of anion-deficient ABO3−δ-type perovskites forδ > ∼0.2, tends towards long-range ordering as the vacancy concentration increases further.This process is illustrated by the δ = 0.5 case, which corresponds to the stoichiometry A2B2O5.
Crystal structures and conduction processes 1269
There are many possible patterns of vacancy ordering, with some of the BO6 octahedra replacedby BO5 square pyramids (Ca2Mn2O5), BO4 square planar units (La2Ni2O5), BO4 tetrahedra(Ca2Fe2O5) or combinations thereof [301]. The formation of BO4 tetrahedra leads to theso-called brownmillerite structure type and is particularly relevant in the context of highlyconducting solids. The brownmillerite arrangement is an orthorhombic superstructure of thecubic perovskite structure, with a ∼ √
2aperov, b ∼ 4aperov and c ∼ √2aperov. In the [010]
direction there is an alternating sequence of corner-sharing octahedra and tetrahedra, withalternate rows of the latter having different orientations (see figure 26(b)). However, slightdisplacements of the ions away from their idealized positions occur and the correct symmetriesof brownmillerite-structured compounds have been the subject of some debate, with closelyrelated descriptions in space groups Icmm, Ibm2 and Pcmn proposed [302].
The brownmillerite-structured compound Ba2In2O5 has been reported to undergo a type-Isuperionic transition at ≈1200 K, with σi ≈ 0.1 −1 cm−1 immediately above the transition[303]). The crystal structure of Ba2In2O5 under ambient conditions has recently beendetermined to possess Icmm symmetry [304] (in contrast to a previous report [305]) andcontains (static) disorder of the InO4 tetrahedra over their two different orientations. Thisleads to a rather complex microstructure [304]. Diffraction studies performed at temperaturesin excess of ≈1300 K show that Ba2In2O5 adopts an anion-deficient cubic perovskite structure[304, 306, 307], in which the O2− sites have a mean occupancy of 5
6 and the anions undergohighly anisotropic thermal vibrations [304]. However, there is disagreement over the presenceof an intermediate tetragonal phase (space group I4cm) between the orthorhombic and cubicforms and it is not clear whether the high ionic conductivity is associated with the tetragonaland/or cubic-structured phases [304, 306–308]. Despite these uncertainties, several attempts tosynthesize highly anion-deficient cubic perovskite-structured compounds based on Ba2In2O5
have been made, including compositions around Ba2InCoO5 (δ = 0.5) [309] and Ba3In2ZrO8
(δ = 0.333) [303, 304, 310].A second example of anion-deficient phases derived from the cubic perovskite structure is
provided by compounds of stoichiometry MBi3O5.5, which correspond to δ = 0.25. Specifi-cally, the M = Cd2+ and Ba2+ materials have been reported to possess high ionic conductivitiesat elevated temperatures [311]. The relative similarity between the ionic sizes of Cd2+ andBi3+ (rCd2+ = 1.24 Å and rBi3+ = 1.31 Å [66]) and the arguments presented in sections 3.8 and3.9 suggest that CdBi3O5.5 will adopt a perovskite-structured arrangement with the two cationspecies disordered over the A and B cation sites. This has been confirmed experimentally, andthe O2− found to reside in the tet sites of space group Im3m [312]. For the M = Ba2+ ana-logue, the significantly larger size of the divalent cation (rBa2+ = 1.56 Å) favours ordering ofthe Ba2+ and Bi3+ and the resultant displacement of the anions onto the oct1 sites of space groupPm3m (see figure 23). However, x-ray diffraction studies of BaBi3O5.5 initially suggested thatthe material possesses Im3m symmetry, with disordered cations and the anions randomly dis-tributed over all six equivalent oct cavities [313]. This apparent paradox has been resolved bysubsequent neutron diffraction, electron diffraction and high resolution electron microscopy(HREM) studies [314, 315], showing that short-range ordering of both cations and anionvacancies occurs. This leads to a complex structure formed by an intergrowth of regions of com-position BaBiO3 (with close to the ideal cation-ordered perovskite structure) and rocksalt-likeBi2O2−x blocks, in a manner similar to the so-called ‘Ruddlesden–Popper’ phases [316, 317].
3.14. Perovskite intergrowth structures: the BiMeVOx compounds
A second example of layered structures based on sections of a perovskite-structured latticeis provided by the so-called Aurivillius phases [318–320], which can be described as an
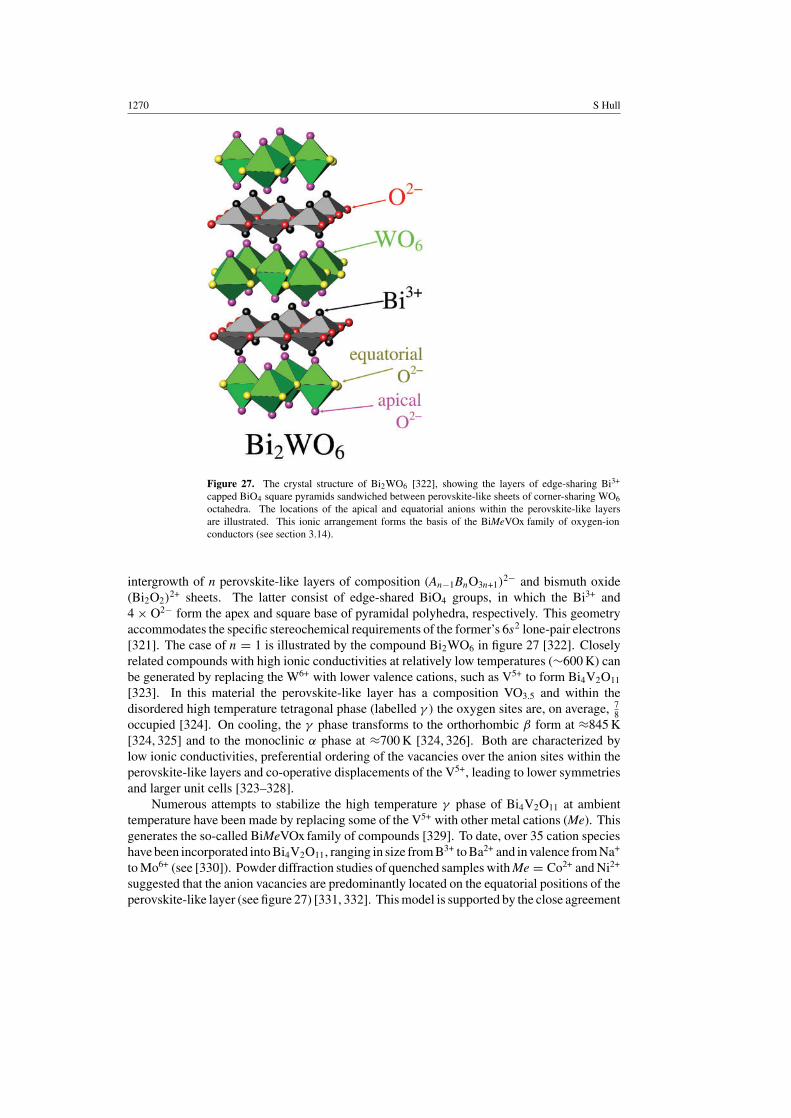
1270 S Hull
Figure 27. The crystal structure of Bi2WO6 [322], showing the layers of edge-sharing Bi3+
capped BiO4 square pyramids sandwiched between perovskite-like sheets of corner-sharing WO6octahedra. The locations of the apical and equatorial anions within the perovskite-like layersare illustrated. This ionic arrangement forms the basis of the BiMeVOx family of oxygen-ionconductors (see section 3.14).
intergrowth of n perovskite-like layers of composition (An−1BnO3n+1)2− and bismuth oxide
(Bi2O2)2+ sheets. The latter consist of edge-shared BiO4 groups, in which the Bi3+ and
4 × O2− form the apex and square base of pyramidal polyhedra, respectively. This geometryaccommodates the specific stereochemical requirements of the former’s 6s2 lone-pair electrons[321]. The case of n = 1 is illustrated by the compound Bi2WO6 in figure 27 [322]. Closelyrelated compounds with high ionic conductivities at relatively low temperatures (∼600 K) canbe generated by replacing the W6+ with lower valence cations, such as V5+ to form Bi4V2O11
[323]. In this material the perovskite-like layer has a composition VO3.5 and within thedisordered high temperature tetragonal phase (labelled γ ) the oxygen sites are, on average, 7
8occupied [324]. On cooling, the γ phase transforms to the orthorhombic β form at ≈845 K[324, 325] and to the monoclinic α phase at ≈700 K [324, 326]. Both are characterized bylow ionic conductivities, preferential ordering of the vacancies over the anion sites within theperovskite-like layers and co-operative displacements of the V5+, leading to lower symmetriesand larger unit cells [323–328].
Numerous attempts to stabilize the high temperature γ phase of Bi4V2O11 at ambienttemperature have been made by replacing some of the V5+ with other metal cations (Me). Thisgenerates the so-called BiMeVOx family of compounds [329]. To date, over 35 cation specieshave been incorporated into Bi4V2O11, ranging in size from B3+ to Ba2+ and in valence from Na+
to Mo6+ (see [330]). Powder diffraction studies of quenched samples with Me = Co2+ and Ni2+
suggested that the anion vacancies are predominantly located on the equatorial positions of theperovskite-like layer (see figure 27) [331, 332]. This model is supported by the close agreement
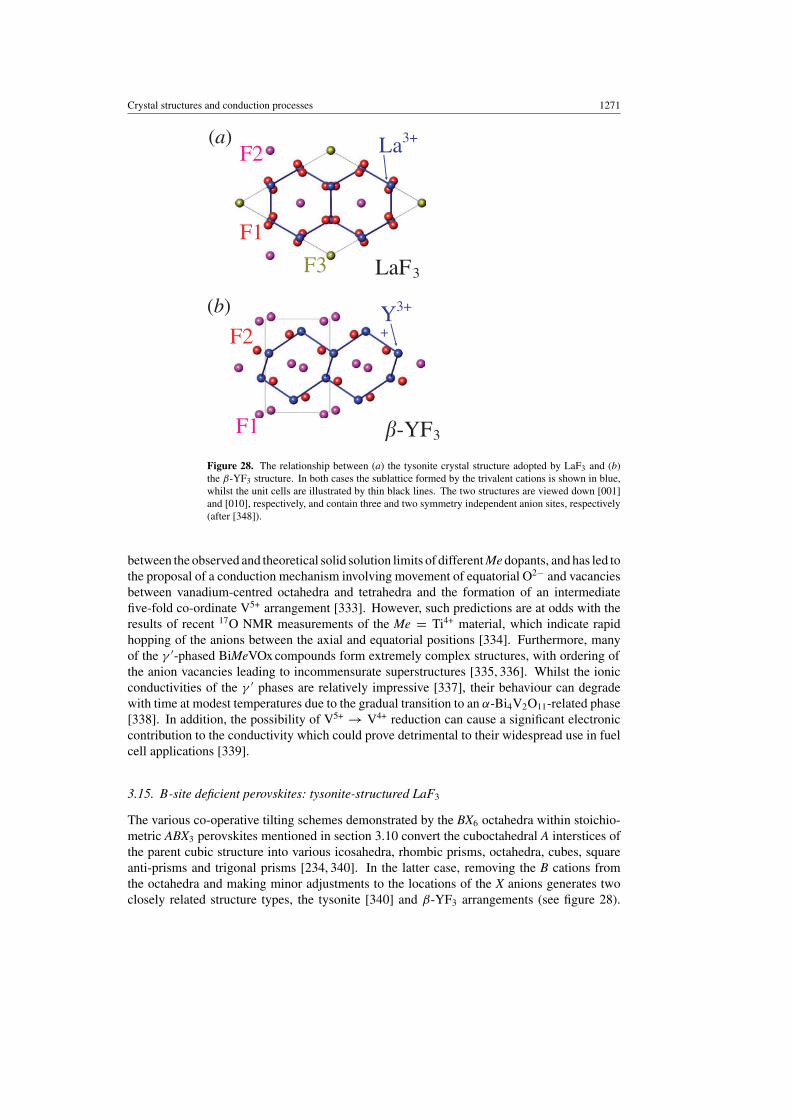
Crystal structures and conduction processes 1271
LaF3
-YF3
F1
F3
F1
F2
F2 La3+
Y3+
+
(a)
(b)
Figure 28. The relationship between (a) the tysonite crystal structure adopted by LaF3 and (b)the β-YF3 structure. In both cases the sublattice formed by the trivalent cations is shown in blue,whilst the unit cells are illustrated by thin black lines. The two structures are viewed down [001]and [010], respectively, and contain three and two symmetry independent anion sites, respectively(after [348]).
between the observed and theoretical solid solution limits of different Me dopants, and has led tothe proposal of a conduction mechanism involving movement of equatorial O2− and vacanciesbetween vanadium-centred octahedra and tetrahedra and the formation of an intermediatefive-fold co-ordinate V5+ arrangement [333]. However, such predictions are at odds with theresults of recent 17O NMR measurements of the Me = Ti4+ material, which indicate rapidhopping of the anions between the axial and equatorial positions [334]. Furthermore, manyof the γ ′-phased BiMeVOx compounds form extremely complex structures, with ordering ofthe anion vacancies leading to incommensurate superstructures [335, 336]. Whilst the ionicconductivities of the γ ′ phases are relatively impressive [337], their behaviour can degradewith time at modest temperatures due to the gradual transition to an α-Bi4V2O11-related phase[338]. In addition, the possibility of V5+ → V4+ reduction can cause a significant electroniccontribution to the conductivity which could prove detrimental to their widespread use in fuelcell applications [339].
3.15. B-site deficient perovskites: tysonite-structured LaF3
The various co-operative tilting schemes demonstrated by the BX6 octahedra within stoichio-metric ABX3 perovskites mentioned in section 3.10 convert the cuboctahedral A interstices ofthe parent cubic structure into various icosahedra, rhombic prisms, octahedra, cubes, squareanti-prisms and trigonal prisms [234, 340]. In the latter case, removing the B cations fromthe octahedra and making minor adjustments to the locations of the X anions generates twoclosely related structure types, the tysonite [340] and β-YF3 arrangements (see figure 28).
1272 S Hull
The former is adopted by the lighter rare-earth trifluorides (ReF3 for Re = La–Ho) and thelatter is favoured by the remainder (Re = Er–Lu) and by YF3 itself [341].
On heating, the tysonite-structured compounds with Re = La–Pm retain this structuralarrangement up to their melting points [342]. However, evidence for a type-II superionictransition within LaF3 at T ≈ 1200 K was provided by specific heat data [343]. In contrast, theother tysonite-structured rare-earth trifluorides (Re = Sm–Ho) undergo a first-order structuraltransition to the β-YF3 arrangement (space group Pnma [344]) at elevated temperatures[342, 345], whilst those adopting this structure at ambient temperature all transform to anα-YF3-structured form (space group P3m1 [346]) on heating [342]. Ionic conductivitymeasurements showed that the change from the β-YF3 to the α-YF3 ionic arrangements inYF3 and LuF3 is associated with type-I superionic transitions [347], though the structuralbasis of the disorder within the high temperature phases has not been studied.
Recent attention has focused on the relationship between the ambient temperature β-YF3
and tysonite arrangements [345, 348]. As mentioned above, both structure types can bedescribed as heavily distorted ABX3 perovskites with all the B sites empty and the A (Re3+)
cations situated inside irregular trigonal prisms. In the β-YF3 arrangement additional anionsare situated close to the three rectangular faces (resulting in a nine-fold co-ordination) whilstthe tysonite structure has additional anions occupying sites close to all the faces of the distortedtrigonal prisms (3×rectangular and 2×triangular), such that the anion environment surroundingthe cations is closer to 11-fold co-ordination [345]. The increased co-ordination within thelatter has been proposed to result in a rather weaker bonding between the cations and themore distant of the anions and explain the relatively higher ionic conductivities displayedby tysonite-structured compounds [348]. Of these, LaF3 has been the most widely studiedbut, unfortunately, the literature is confused by the use of subtly different models to describeits structure. Specifically, the F− have been proposed to be distributed over two (P 63/mmc[349, 350]), three (P 3c1 [351–354]) or four (P 63cm [355]) symmetry independent sublattices.The sites are labelled from F1 up to F4, with the F1 sites identical in all three models. TheF3 and F4 sites within the P 63cm description are equivalent (and labelled F3) in the P 3c1structure. Similarly, the F2 and F3 sites of the latter form a single set labelled F2 in the simplestP 63/mmc model (see [355, 356]).
NMR studies initially favoured the P63/mmc structural description for LaF3 and showedthat F− motion is restricted to hops between only the F1 sites at relatively low temperatures[357]. On heating, an increasing number of F1 ↔ F2 hops between the two sublatticeswere observed, prior to the onset of free diffusion amongst all sites at T > ≈600 K (see[357] and references therein). However, the validity of the P63/mmc structural model hasbeen questioned on geometric grounds [356] and subsequent NMR studies assuming the P 3c1structural description have shown a higher activation energy for F1 ↔ F2 hops over F1 ↔ F3ones [358]. Single crystal neutron diffraction data collected from LaF3 indicated that theP 3c1 model provides the correct structural description [353]. Interpretation of the stronglyanharmonic thermal vibrations suggested that ionic conduction in the [001] direction occursalong channels of F3 sites, whilst diffusion within the (001) plane proceeds via F1 ↔ F2and F1 ↔ F3 hops. As a consequence, all the anions are involved in the conduction process[353]. This model appears consistent with the similarity between the ionic conductivity ofLaF3 measured parallel and perpendicular to [001] [359].
3.16. A-site deficient perovskites: La2/3TiO3, La1/3NbO3 and WO3
Stoichiometric ABO3 oxide perovskites do not, in general, show significant cation migration.However, cation vacancies can be generated on the cuboctahedral A sites by increasing the
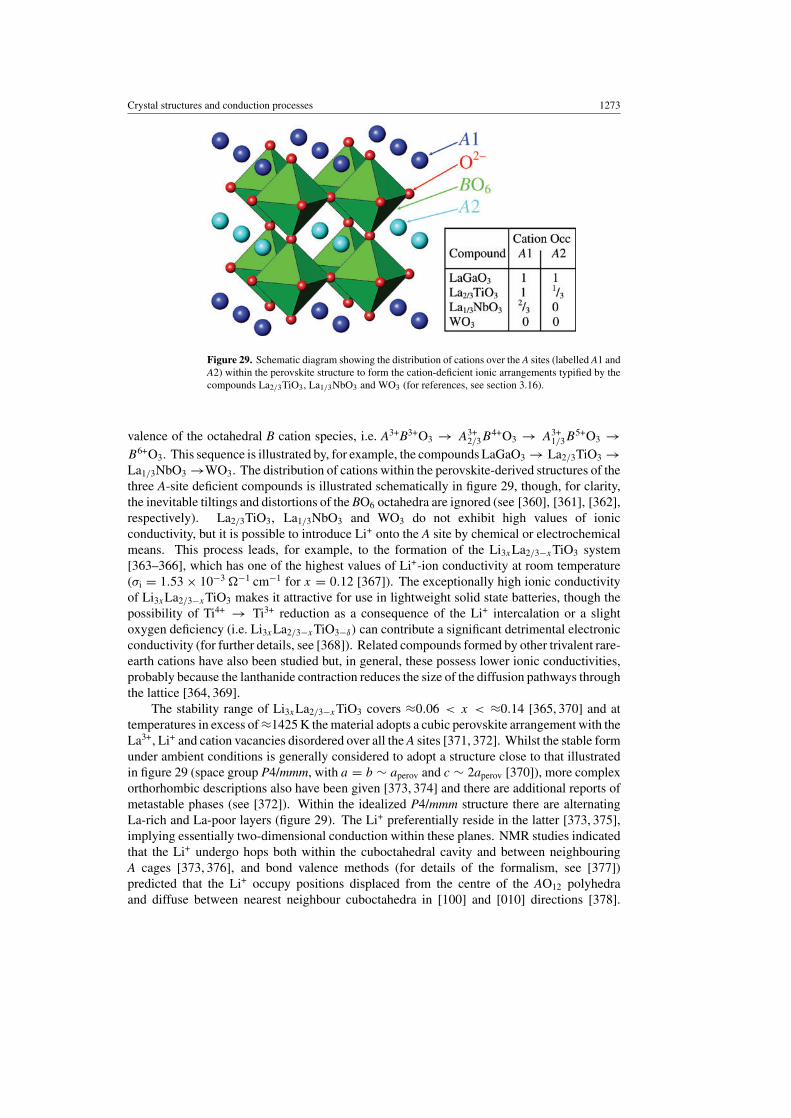
Crystal structures and conduction processes 1273
Figure 29. Schematic diagram showing the distribution of cations over the A sites (labelled A1 andA2) within the perovskite structure to form the cation-deficient ionic arrangements typified by thecompounds La2/3TiO3, La1/3NbO3 and WO3 (for references, see section 3.16).
valence of the octahedral B cation species, i.e. A3+B3+O3 → A3+2/3B
4+O3 → A3+1/3B
5+O3 →B6+O3. This sequence is illustrated by, for example, the compounds LaGaO3 → La2/3TiO3 →La1/3NbO3 →WO3. The distribution of cations within the perovskite-derived structures of thethree A-site deficient compounds is illustrated schematically in figure 29, though, for clarity,the inevitable tiltings and distortions of the BO6 octahedra are ignored (see [360], [361], [362],respectively). La2/3TiO3, La1/3NbO3 and WO3 do not exhibit high values of ionicconductivity, but it is possible to introduce Li+ onto the A site by chemical or electrochemicalmeans. This process leads, for example, to the formation of the Li3xLa2/3−xTiO3 system[363–366], which has one of the highest values of Li+-ion conductivity at room temperature(σi = 1.53 × 10⁻³ −1 cm−1 for x = 0.12 [367]). The exceptionally high ionic conductivityof Li3xLa2/3−xTiO3 makes it attractive for use in lightweight solid state batteries, though thepossibility of Ti4+ → Ti3+ reduction as a consequence of the Li+ intercalation or a slightoxygen deficiency (i.e. Li3xLa2/3−xTiO3−δ) can contribute a significant detrimental electronicconductivity (for further details, see [368]). Related compounds formed by other trivalent rare-earth cations have also been studied but, in general, these possess lower ionic conductivities,probably because the lanthanide contraction reduces the size of the diffusion pathways throughthe lattice [364, 369].
The stability range of Li3xLa2/3−xTiO3 covers ≈0.06 < x < ≈0.14 [365, 370] and attemperatures in excess of ≈1425 K the material adopts a cubic perovskite arrangement with theLa3+, Li+ and cation vacancies disordered over all the A sites [371, 372]. Whilst the stable formunder ambient conditions is generally considered to adopt a structure close to that illustratedin figure 29 (space group P4/mmm, with a = b ∼ aperov and c ∼ 2aperov [370]), more complexorthorhombic descriptions also have been given [373, 374] and there are additional reports ofmetastable phases (see [372]). Within the idealized P4/mmm structure there are alternatingLa-rich and La-poor layers (figure 29). The Li+ preferentially reside in the latter [373, 375],implying essentially two-dimensional conduction within these planes. NMR studies indicatedthat the Li+ undergo hops both within the cuboctahedral cavity and between neighbouringA cages [373, 376], and bond valence methods (for details of the formalism, see [377])predicted that the Li+ occupy positions displaced from the centre of the AO12 polyhedraand diffuse between nearest neighbour cuboctahedra in [100] and [010] directions [378].
1274 S Hull
Unfortunately, neutron diffraction studies could not unambiguously determine the favoured Li+
positions [374] and this two-dimensional diffusion model is not supported by measurementsof the ionic conductivity, which is essentially isotropic (σi = 5.8 × 10⁻⁴ −1 cm−1 and6.8 × 10−4 −1 cm−1 parallel and perpendicular to [001], respectively [379]).
The analogous system containing B5+ cations, Li3xLa1/3−xNbO3, possesses an A-sitedeficient perovskite-structured phase for 0 < x < ≈0.06 [380, 381] and also formsa disordered cubic phase at high temperatures [382]. Its idealized structure at ambienttemperature is similar to that of Li3xLa2/3−xTiO3, except that the ‘La-rich’ layers are23 occupied, the ‘La-poor’ ones are empty (figure 29) and it is best described using an
orthorhombic unit cell of size a ∼ √2aperov, b ∼ √
2aperov, c ∼ 2aperov [361, 381, 383–385].However, the ionic conductivity of the Li3xLa1/3−xNbO3 system (σi = 4.3 × 10⁻⁵ −1 cm−1
at 300 K for the x = 0.04 compound [381]) is somewhat lower than its Ti4+ counterpart and,as a consequence, it has been less extensively studied.
WO3 is the extreme example of an A-site deficient perovskite (figure 29) and itsstructural behaviour is very complex [362, 386–389]. According to the most recent reports[362, 386], six phase transitions occur on heating (Pc—230 K → P 1—300 K → P21/n—620 K → Pbcn—1000 K → P21/c—1070 K → P4/ncc—1170 K → P4/nmm), prior tomelting at ≈1750 K. Interestingly, WO3 does not form an ideal cubic-structured phase (Pm3m)
at elevated temperature, with all seven phases showing distortions of the high symmetry form[362, 386–389]. Ionically conducting phases can be produced by intercalation of H+ or Li+,though more interest has focused on the use of such compounds within thin film electrochromicdevices (‘smart windows’), due to the colour centres associated with the concomitant reductionof W6+ → W5+ [390]. In the case of LixWO3, the addition of Li+ gradually transforms thematerial from the ambient temperature monoclinic phase to a tetragonal-structured one overthe range 0.01 x 0.082 and then to a cubic-structured modification that is stable for0.13 x 0.36 [391]. Neutron diffraction studies of an x = 0.36 sample showed the latterto possess Im3 symmetry [392], with the distortion of the perovskite-like network of corner-sharing WO6 octahedra producing two crystallographically distinct A sites. These are 12-foldand four-fold co-ordinated to anions and the Li+ probably occupy the latter [392].
3.17. Double perovskites: cryolite-structured Na3AlF6
The elpasolite structure is derived from the perovskite arrangement by ordering of two differentcation species over the B sites, i.e. 2×ABX3 →A2BB′X6. As illustrated in figure 30, the BX6 andB ′X6 octahedra alternate along the three cubic 〈100〉 axes, so that the ideal elpasolite structurehas a ∼ 2aperov and adopts space group Fm3m. In practice, the corner-sharing network ofBX6 and B ′X6 polyhedra undergoes co-operative tilts and distortions of the type seen in theparent perovskite-structured compounds, leading to a variety of lower symmetry derivativesand numerous temperature- and pressure-induced phase transitions [393–395]. Relativelylittle attention has been paid to possible thermally induced ionic disorder within elpasolite-structured compounds. However, if identical cations occupy the A and B ′ sites, such that thestoichiometry is A3BX6, the cryolite structure is formed. The most widely studied example ofa superionic compound with this ionic arrangement is the mineral cryolite itself, which has thechemical composition Na3AlF6.
At ambient temperature, slight tilting and deformation of the AlF6 octahedra lowers thesymmetry of Na3AlF6 to P 21/n [396]. On heating, abrupt increases in the ionic conductivitywere reported at 838 and 1153 K and the former attributed to a structural transition to the‘ideal’ cubic modification [397, 398]. The latter was assigned to a type-I superionic transitioncharacterized by extensive, dynamic F− disorder [399], based on the observation that the ionic

Crystal structures and conduction processes 1275
6 6
Figure 30. The elpasolite crystal structure of a compound of stoichiometry A2BB ′X6 derived fromthe perovskite arrangement by alternating BX6 and B ′X6 octahedra along the 〈100〉 directions. Thecubic lattice parameter a is illustrated.
conductivity of Na3AlF6 only increases by ∼10× on melting, compared to ∼7000× for NaF[399]. However, recent single crystal diffraction studies and 27Al, 23Na and 19F NMR studieshave completely revised this picture [396]. The high temperature phase was shown to possessan orthorhombic distortion of the idealized cubic arrangement, with symmetry Immm. TheF− undergo extensive anisotropic thermal vibrations as the AlF6 octahedra perform extensivelibrations, but it is the Na+ which become mobile [396]. NMR studies indicated that the highionic conductivity is characterized by hopping of Na+ between the six (octahedral B site) andeight (distorted cuboctahedral A site) co-ordinated environments [400]. Recent MD studiesdemonstrated that the AlF6 octahedra rotate about the central Al3+ at temperatures above 600 K,so that the structure can be viewed as an fcc array of spinning AlF6 units, with all the octahedraland tetrahedral cavities filled with Na+ [401]. The AlF6 octahedra are isolated and there isno long-range migration of F−, whilst the Na+ diffusion proceeds via the formation of doublyoccupied octahedral interstices [401].
The differing timescales for AlF6 rotation and Na+ diffusion within Na3AlF6 at elevatedtemperatures suggests that these two processes are unrelated [401]. This hypothesis issupported by studies of the chiolite-structured compound Na5Al3F14, in which the sheetsof AlF6 octahedra are interlayered with edge-sharing NaF6 octahedra [402]. This more rigidlinkage appears to hinder large thermal motion of the F−, though 23Na NMR studies show thatextensive diffusion of Na+ still occurs within Na5Al3F14 [400]. However, the wider question ofcorrelations between the ionic diffusion and the rotational motion of rigid polyhedra within such‘rotator’ phases has proved to be a rather contentious one and will be revisited in section 4.12.
4. β-PbF2: chemical and structural derivatives
This section begins by assessing the extent to which the Frenkel model of anion disorderdescribed for β-PbF2 in section 2.3 can be applied to other fluorite-structured halides and

1276 S Hull
Table 3. Summary of the superionic transition temperatures, Tc, and the melting temperatures,Tm, of various fluorite-structured halides and oxides and anti-fluorite-structured compounds (forreferences, see sections 2.3, 4.1, 4.10 and 4.11 and [24, 26]).
Compound Tc (K) Tm (K) Tc/Tm
CaF2 1430 1633 0.88SrF2 1400 1723 0.81BaF2 1275 1550 0.82β-PbF2 711 1158 0.61SrCl2 1001 1146 0.87
UO2 2610 3120 0.84ThO2 ∼2950 3663 ∼0.81
Li2O ∼1200 1705 ∼0.7Na2O ∼1240 1403 ∼0.9Na2S ∼1270 1442 ∼0.9K2S 1050 1221 0.86
oxides. In an analogous manner to section 3, chemical derivatives of the parent binarycompounds (including anion-excess and anion-deficient systems) will be considered, followedby a discussion of structurally related superionic compounds which can be derived by filling thevarious interstices within an fcc sublattice in different ways. Finally, the comparative meritsof the fcc and hcp sublattices in promoting superionic behaviour will be assessed.
4.1. The concentration of Frenkel defects
The fluorite-structured halides SrF2, CaF2, BaF2 and SrCl2 all undergo type-II superionictransitions when the temperature is increased (see table 3, [26, 67, 73] and references therein),and their macroscopic behaviour (ionic conductivity, specific heat, thermal expansion, etc)closely resembles that of β-PbF2. At the ionic level, neutron diffraction studies indicatedthat the same dynamic Frenkel defect cluster model (figure 7) could also account for thecoherent diffuse scattering observed from CaF2 and SrCl2 above Tc (see figure 31), withminor differences in the extent of the outward relaxations of the surrounding anions consistentwith the relative sizes of the ions [77]. From the experimental point-of-view, SrCl2 is aparticularly interesting example because the chlorine nucleus possesses a significant incoherentscattering cross-section for neutrons and the energy broadening of the incoherent (ratherthan coherent) diffuse scattering can be used to probe the geometry of the anion diffusionprocess8. Analysis of data collected at 1053 K using the Chudley-Elliott [404] and Wolf [405]encounter models showed that 73(5)% of Cl− hops occur between nearest neighbour anionpositions in 〈100〉 directions, with the remainder between next nearest neighbour sites in 〈110〉directions [406].
MD simulations of β-PbF2 [79], CaF2 [407–409] and SrCl2 [410–412] reproduced thekey experimentally observed features characteristic of the superionic state, including thepreference for discrete hops between nearest neighbour anion sites in 〈100〉 directions, the highanion diffusion coefficients and the absence of anions at the empty cube centre F4 positions(see figure 6) [413]. However, significant differences were reported concerning the extent of
8 Formally, the coherent and incoherent contributions to the measured diffuse scattering are related by a doubleFourier transform to the time-dependent total pair correlation function G(r, t) and the time-dependent self correlationfunction GS(r, t), respectively. Given an ion at the origin at t = 0, G(r, t)dr gives the probability that any ion(including the same one) will be found within a volume dr at time t , whilst GS(r, t)dr gives the probability that thesame ion will be found within a volume dr at time t (for a more detailed discussion, see [403]).

Crystal structures and conduction processes 1277
(a)
(b)
Figure 31. Comparison of (a) the measured distribution of neutron diffuse scattering from CaF2in the (011) and (010) planes of reciprocal space at 1473 K with (b) that calculated using a modelof dynamic Frenkel defects of the type illustrated in figure 7 (after [77]).
anion disorder within the superionic phase, with values of n ≈ 0.02 predicted by MD methods[79, 410] and n ∼ 0.3–0.5 determined by neutron diffraction studies [76–78] at comparabletemperatures. The absence of identifiable discrete defect clusters of the type illustrated infigure 7 within the MD studies (possibly due to the relatively small size of the simulation box)suggests that the apparent discrepancy may arise from differences in the interpretation of thestructural behaviour of such highly disordered systems. Analysis of MD simulations typicallygives the number of ion jumps, whilst diffraction experiments measure the total number ofanions leaving their normal lattice sites. With reference to figure 7, the latter includes both‘true’ Frenkel interstitials and those neighbouring ions merely relaxed off their regular latticesites, whose relative populations differ by a factor dependent on the model of the defect clusterused to fit the data (i.e. by a factor of 3 or 9 for 3 : 1 : 2 and 9 : 1 : 8 clusters, respectively).This explanation was supported by calculations of the Bragg structure factors using the time-averaged ionic distribution simulated for β-PbF2 at 991 K, which were then analysed usingFrenkel defect models [79]. The resultant defect concentration of n ≈ 0.27 was in broad

1278 S Hull
agreement with that found experimentally (n ≈ 0.47 at 973 K [76]) and considerably inexcess of the value of n ≈ 0.02 obtained by analysis of the anion hops within the simulatedsystem.
4.2. The role of cation polarizability
The MD simulations of the halide fluorites discussed in the previous subsection used theso-called ‘rigid-ion’ and ‘shell’ models to describe the interionic potentials [79, 407–412].The latter includes harmonic springs coupling the ionic core to a massless shell, which mimicthe effect of polarizability of the ions (for details, see [414]). In the case of CaF2, the useof a shell model was found to have little impact on the simulated ionic motion, implyingthat polarization effects have minimal influence on the superionic behaviour [409]. However,the physical justification for the use of these types of interionic potentials has recently beenquestioned [80] and alternative formulations developed on an ab initio basis from electronicstructure calculations. These incorporate, for example, the adaption of the size of the anionto its instantaneous environment [415] and demonstrate that cation polarizability is a ratherimportant factor. For example, the number of anion defects in CaF2 at 1400 K increases bya factor of around four with its inclusion [416]. In simple terms, this can be understood bynoting that polarization lowers the energies of anions in lower symmetry environments (of thetype experienced during hopping) relative to higher symmetry ones.
Such arguments are even more important for the case of β-PbF2, because the 6s2 groundstate of Pb2+ leads to a greatly enlarged dipole polarizability [80, 416]. A recent MD study[80] demonstrated that cation polarization is essential to explain the lower superionic transitiontemperature of β-PbF2, both in absolute (Tc) and relative (Tc/Tm) terms, compared to otherfluorite-structured halides with comparably sized cations (such as SrF2 and BaF2, see table 3).Indeed, the simulations were also able to successfully reproduce the considerably lower fluoriteto cotunnite transition pressure observed in β-PbF2 (see figure 11) and differences in themeasured phonon dispersion curves [80]. Clearly, the development of interionic potentialsthat include realistic representations of distinct physical effects such as ionic polarizability isessential to provide meaningful simulations of ionic diffusion processes. A recent example ofthe progress in this direction is given in the next subsection.
4.3. Ternary layered fluorite: PbSnF4
Intuitively, the addition of Sn2+ to fluorite-structured β-PbF2 does not appear to be a promisingmethod to enhance its ionic conducting properties. Doping with isovalent cations does notintroduce mobile charge-compensating anion vacancies or interstitials and the smaller sizeof Sn2+ would be expected to lower σi by reducing the size of the unit cell. Nevertheless,the ternary compound PbSnF4 has one of the highest values of ionic conductivity at ambienttemperature of any F− ion conductor (σi ∼ 10−3 −1 cm−1 [417]), which has led to potentialapplications within fast response oxygen gas sensors [418, 419].
PbSnF4 adopts the cubic fluorite structure with a random arrangement of the Pb2+ andSn2+ cations within its γ phase (space group Fm3m), which is stable in a narrow temperaturerange (≈10 K) below its melting point of 663 K [417, 420]. However, the crystal chemistryof PbSnF4 under ambient conditions is rather more complex, because several closely relatedphases are formed depending on the preparation method (see [421] and references therein).Most possess structures closely related to that of fluorite, but with cation ordering in thesequence PbPbSnSnPbPbSnSn. . . along one of the pseudocubic 〈100〉 axes, which causes majorrearrangements of the anion sublattice [422–429]. In the α-PbSnF4 polymorph commonly

Crystal structures and conduction processes 1279
Figure 32. The time-averaged ionic density within the tetragonal unit cell of α-PbSnF4 at ambienttemperature determined by powder neutron diffraction methods and projected down the [010]direction (after [430]). The PbPbSnSnPbPbSnSn. . . cation ordering sequence along the [001]axis is evident. The F− in the Pb2+–Pb2+ layers are localized close to the anion sites occupiedwithin the equivalent fluorite-structured lattice, whilst the Sn2+–Sn2+ layers are essentially empty.The displaced anions are distributed in a highly disordered manner within the Pb2+–Sn2+ layers,implying that anisotropic F− conduction occurs predominantly within these (001) planes.
synthesized by solid state reaction of the constituent binary fluorides (space group P4/nmm[427]) the F− between the two Pb2+ layers lie close to the tetrahedrally co-ordinated sitesoccupied within the equivalent fluorite structure. In contrast, the Sn2+–Sn2+ layers havea low [427] or zero [424] population of anions. The displaced anions are located in theempty F8 cubes between the Pb2+ and Sn2+ sheets (see figure 32 [430]). NMR studies ofthe isostructural compound BaSnF4 (which is a somewhat poorer conductor, such that thetimescales of fluorine motion lie within the accessible range of the technique) confirm that theF− located in the Ba2+–Ba2+ layers are immobile but those in the Ba2+–Sn2+ layers (and a fewalso in the Sn2+–Sn2+ layers) are in rapid exchange with one another leading to predominantlytwo-dimensional conduction [431, 432].
The dominant role of the Sn2+ cations in stabilizing the layered structure adoptedby α-PnSnF4 under ambient conditions has generally been attributed to their 5s2 electronlone-pairs. These point into the interlayer space between the two Sn2+ sheets, creating cation-centred pseudo-octahedral SnF5E units (where E represents the lone-pair). However, thetime-averaged anion density and two-dimensional diffusion within α-PbSnF4 have recentlybeen successfully reproduced within MD simulations, which essentially treat the ‘lone-pairs’ as an extreme manifestation of cation polarizability [401, 430]. As a consequence,the structural behaviour of α-PbSnF4 can be interpreted in terms of a higher ‘effective’polarizability of the smaller Sn2+ ion. The ability to derive realistic interionic potentialsfor highly polarizable cations conventionally described in terms of stereochemically active
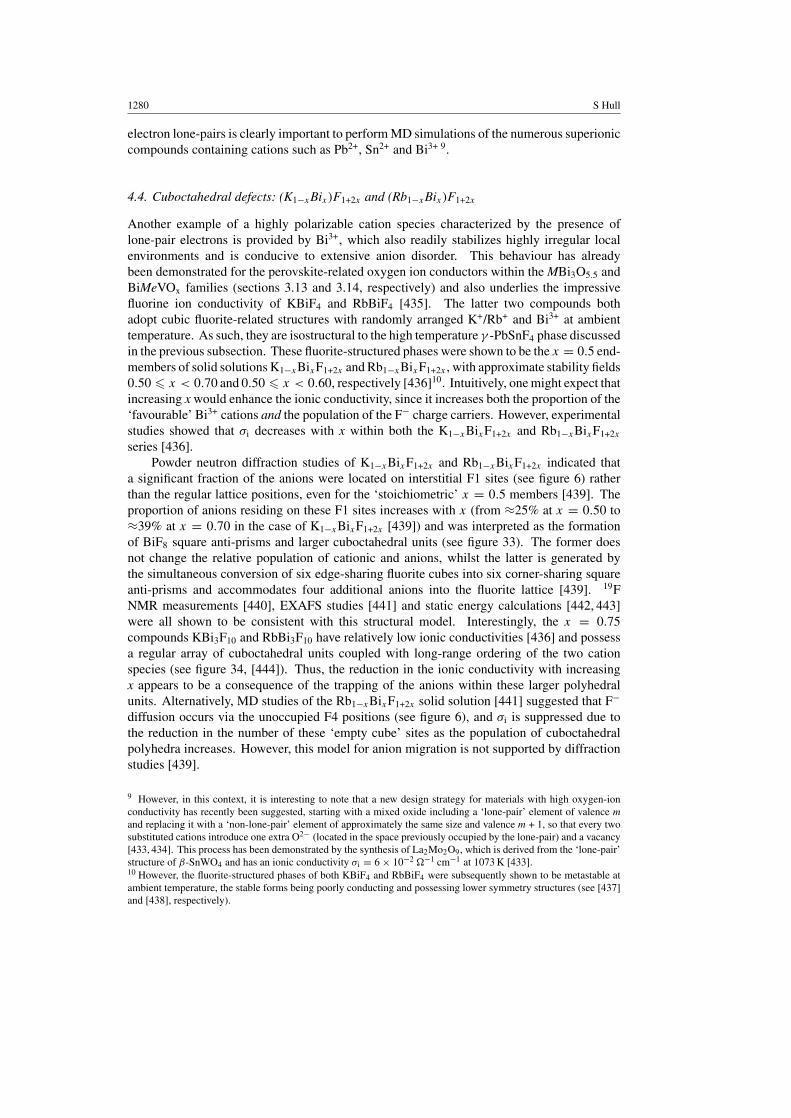
1280 S Hull
electron lone-pairs is clearly important to perform MD simulations of the numerous superioniccompounds containing cations such as Pb2+, Sn2+ and Bi3+ 9.
4.4. Cuboctahedral defects: (K1−xBix)F1+2x and (Rb1−xBix)F1+2x
Another example of a highly polarizable cation species characterized by the presence oflone-pair electrons is provided by Bi3+, which also readily stabilizes highly irregular localenvironments and is conducive to extensive anion disorder. This behaviour has alreadybeen demonstrated for the perovskite-related oxygen ion conductors within the MBi3O5.5 andBiMeVOx families (sections 3.13 and 3.14, respectively) and also underlies the impressivefluorine ion conductivity of KBiF4 and RbBiF4 [435]. The latter two compounds bothadopt cubic fluorite-related structures with randomly arranged K+/Rb+ and Bi3+ at ambienttemperature. As such, they are isostructural to the high temperature γ -PbSnF4 phase discussedin the previous subsection. These fluorite-structured phases were shown to be the x = 0.5 end-members of solid solutions K1−xBixF1+2x and Rb1−xBixF1+2x , with approximate stability fields0.50 x < 0.70 and 0.50 x < 0.60, respectively [436]10. Intuitively, one might expect thatincreasing x would enhance the ionic conductivity, since it increases both the proportion of the‘favourable’ Bi3+ cations and the population of the F− charge carriers. However, experimentalstudies showed that σi decreases with x within both the K1−xBixF1+2x and Rb1−xBixF1+2x
series [436].Powder neutron diffraction studies of K1−xBixF1+2x and Rb1−xBixF1+2x indicated that
a significant fraction of the anions were located on interstitial F1 sites (see figure 6) ratherthan the regular lattice positions, even for the ‘stoichiometric’ x = 0.5 members [439]. Theproportion of anions residing on these F1 sites increases with x (from ≈25% at x = 0.50 to≈39% at x = 0.70 in the case of K1−xBixF1+2x [439]) and was interpreted as the formationof BiF8 square anti-prisms and larger cuboctahedral units (see figure 33). The former doesnot change the relative population of cationic and anions, whilst the latter is generated bythe simultaneous conversion of six edge-sharing fluorite cubes into six corner-sharing squareanti-prisms and accommodates four additional anions into the fluorite lattice [439]. 19FNMR measurements [440], EXAFS studies [441] and static energy calculations [442, 443]were all shown to be consistent with this structural model. Interestingly, the x = 0.75compounds KBi3F10 and RbBi3F10 have relatively low ionic conductivities [436] and possessa regular array of cuboctahedral units coupled with long-range ordering of the two cationspecies (see figure 34, [444]). Thus, the reduction in the ionic conductivity with increasingx appears to be a consequence of the trapping of the anions within these larger polyhedralunits. Alternatively, MD studies of the Rb1−xBixF1+2x solid solution [441] suggested that F−
diffusion occurs via the unoccupied F4 positions (see figure 6), and σi is suppressed due tothe reduction in the number of these ‘empty cube’ sites as the population of cuboctahedralpolyhedra increases. However, this model for anion migration is not supported by diffractionstudies [439].
9 However, in this context, it is interesting to note that a new design strategy for materials with high oxygen-ionconductivity has recently been suggested, starting with a mixed oxide including a ‘lone-pair’ element of valence mand replacing it with a ‘non-lone-pair’ element of approximately the same size and valence m + 1, so that every twosubstituted cations introduce one extra O2− (located in the space previously occupied by the lone-pair) and a vacancy[433, 434]. This process has been demonstrated by the synthesis of La2Mo2O9, which is derived from the ‘lone-pair’structure of β-SnWO4 and has an ionic conductivity σi = 6 × 10⁻² −1 cm−1 at 1073 K [433].10 However, the fluorite-structured phases of both KBiF4 and RbBiF4 were subsequently shown to be metastable atambient temperature, the stable forms being poorly conducting and possessing lower symmetry structures (see [437]and [438], respectively).
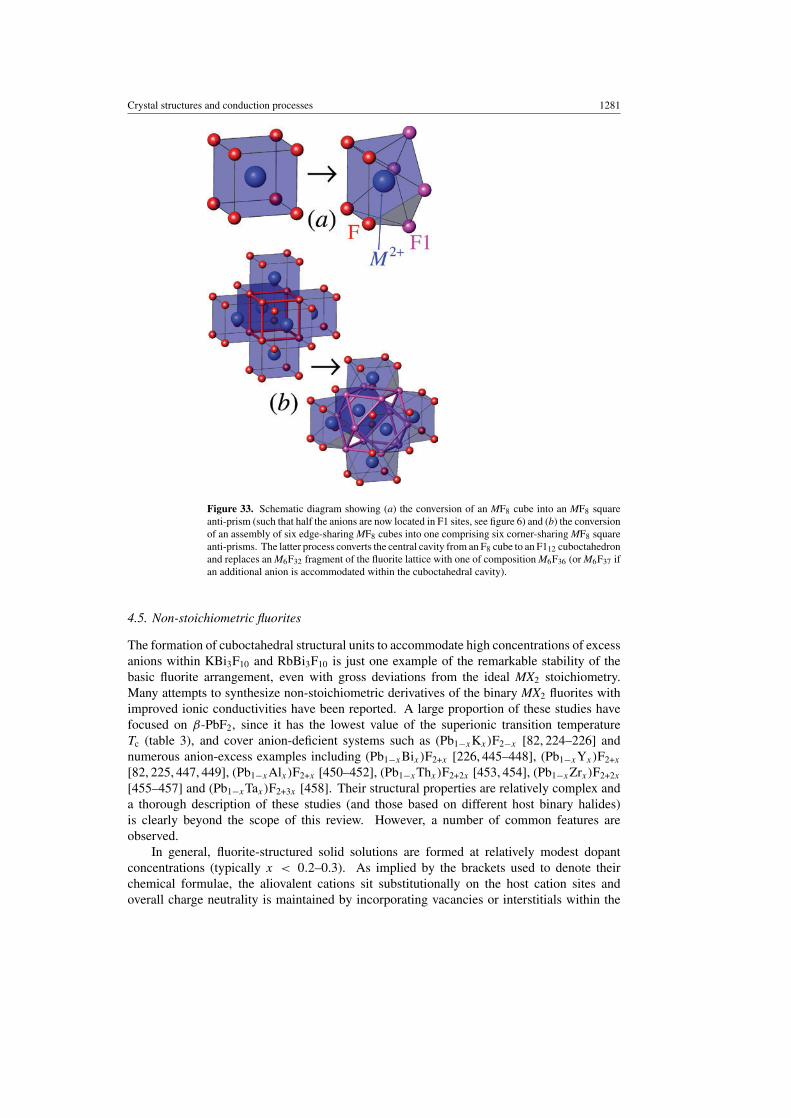
Crystal structures and conduction processes 1281
Figure 33. Schematic diagram showing (a) the conversion of an MF8 cube into an MF8 squareanti-prism (such that half the anions are now located in F1 sites, see figure 6) and (b) the conversionof an assembly of six edge-sharing MF8 cubes into one comprising six corner-sharing MF8 squareanti-prisms. The latter process converts the central cavity from an F8 cube to an F112 cuboctahedronand replaces an M6F32 fragment of the fluorite lattice with one of composition M6F36 (or M6F37 ifan additional anion is accommodated within the cuboctahedral cavity).
4.5. Non-stoichiometric fluorites
The formation of cuboctahedral structural units to accommodate high concentrations of excessanions within KBi3F10 and RbBi3F10 is just one example of the remarkable stability of thebasic fluorite arrangement, even with gross deviations from the ideal MX2 stoichiometry.Many attempts to synthesize non-stoichiometric derivatives of the binary MX2 fluorites withimproved ionic conductivities have been reported. A large proportion of these studies havefocused on β-PbF2, since it has the lowest value of the superionic transition temperatureTc (table 3), and cover anion-deficient systems such as (Pb1−xKx)F2−x [82, 224–226] andnumerous anion-excess examples including (Pb1−xBix)F2+x [226, 445–448], (Pb1−xYx)F2+x
[82, 225, 447, 449], (Pb1−xAlx)F2+x [450–452], (Pb1−xThx)F2+2x [453, 454], (Pb1−xZrx)F2+2x
[455–457] and (Pb1−xTax)F2+3x [458]. Their structural properties are relatively complex anda thorough description of these studies (and those based on different host binary halides)is clearly beyond the scope of this review. However, a number of common features areobserved.
In general, fluorite-structured solid solutions are formed at relatively modest dopantconcentrations (typically x < 0.2–0.3). As implied by the brackets used to denote theirchemical formulae, the aliovalent cations sit substitutionally on the host cation sites andoverall charge neutrality is maintained by incorporating vacancies or interstitials within the

1282 S Hull
(a) MF2 (b) KBi3F10
Figure 34. The crystal structures of (a) a fluorite-structured compound of stoichiometry MF2 and(b) the compound KBi3F10 [444]. To illustrate their relationship, empty F8 cubes and empty F12cuboctahedra are shown. As demonstrated in figure 33(b), the conversion of each cube into acuboctahedron incorporates four additional anions into the lattice.
anion sublattice. These extrinsic defects are often responsible for a significant increase in theionic conductivity with x at temperatures close to ambient (see, e.g. figure 25). However, asthe aliovalent cation content x increases beyond ∼0.1, σi levels off and then, in many cases,falls (see, e.g. [65, 459, 460]). Following the discussion given in the previous subsection, thedecrease in σi with x can be attributed to the formation of extrinsic defect clusters which trappotentially mobile anion vacancies and interstitials. The nature of these defects and theirinfluence on the high temperature superionic behaviour has been the subject of much debatewithin the literature, with the two most widely studied anion-excess and anion-deficient systemsbeing (Ca1−xYx)F2+x and (Zr1−xYx)O2−x/2, respectively.
4.6. Anion-excess fluorite: (Ca1−xYx)F2+x
The stable defect cluster at low dopant concentrations (x < ∼0.01) within anion-excess halidefluorites formed by the addition of trivalent cations comprises a substitutional M3+ dopant anda charge compensating anion interstitial located in either the nearest neighbour or next nearestneighbour F4 site (see figure 6), depending on the relative sizes of the host and dopant cationspecies [461, 462]. Extensive diffraction studies of more heavily doped CaF2, BaF2, PbF2
and SrCl2 compounds (see, e.g. [65, 463] and references therein) have identified a number ofcrystallographic sites in which the charge compensating anion interstitials are accommodated,which essentially correspond to the F1, F2, F3 and F4 sites illustrated in figure 6.
In the specific case of (Ca1−xYx)F2+x , the earliest studies of samples with 0.06 x 0.32using neutron diffraction [464–466] concluded that the anions preferentially reside at the F1and F2 positions. The mean occupancies of these two sites were comparable and consistentwith defect clusters comprising a pair of F1 interstitials and outward relaxations of the twonearest neighbour lattice anions into F2 positions (see figure 35(a)). At higher values of

Crystal structures and conduction processes 1283
Figure 35. Extrinsic defect clusters proposed to accommodate additional F− within the anion-excess fluorite-structured compound (Ca1−xYx)F2+x [465]. These are labelled (a) 2 : 2 : 2 and(b) 3 : 4 : 2, where the v : i : r notation denotes the number of vacancies : interstitials : relaxed anions.The (charge compensating) interstitials reside in F1 sites and cause the two nearest neighbour anionsto relax in 〈111〉 directions into F2 sites.
x extended clusters (figure 35(b)) were also identified. In the notation used in section 2.3,these extrinsic defects are 2 : 2 : 2 and 3 : 4 : 2 clusters, respectively, and can be considered asstatic counterparts to the dynamic Frenkel 3 : 1 : 2 defects observed within the pure fluorites attemperatures above Tc (see figure 7). However, the former contain anomalously short (<2 Å)contacts between the two F1 ions in the 〈110〉 directions and a re-analysis of the earlier dataprovided slightly different occupancies of the F1 and F2 positions [467]. A series of alternativedefect clusters were then proposed, formed by the conversion of a cation-centred (Ca,Y)F8
cube into a square anti-prism (see figure 33(a)), with between one and four interstitial anionslocated in F2 positions adjacent to the rotated face. However, a subsequent single crystalstudy [468] suggested that the apparent occupancy of the F2 sites is an artefact of the analysisprocedure [469] and that a good fit to the experimental structure factors could be obtained withexcess anions only occupying the F1 positions, provided that their thermal vibrations weretreated as anisotropic. The most recent neutron diffraction study of the (Ca1−xYx)F2+x systemconfirmed the absence of a measurable anion density at the F2 positions [463]. Instead, the F−
were distributed over the F1 and F3 sites in the approximate ratio 1 : 2, which is consistent withthe presence of cuboctahedral defects (figure 33(b)) with additional slight outward relaxationsof the surrounding 24 lattice anions in 〈111〉 directions into the F3 positions. Detailed analysisof the coherent diffuse neutron scattering using the various defect cluster models [464–467]confirmed that the excess anions are predominantly accommodated within cuboctahedralclusters (see figure 36), which possibly contain an additional anion within the central cavity(an F4 site) [463].
Neutron diffraction [470–472] and EXAFS [473–475] studies have demonstrated thatcuboctahedral defect clusters of the type found in (Ca1−xYx)F2+x are a common feature withinmany anion-excess halide fluorites. Static energy calculations [476] have confirmed that theirformation is preferable to other defect types, provided that the M3+ dopant cations are relativelysmall. Similarities in the 19F NMR spectra of (Ca1−xYx)F2+x samples on increasing x [477] arealso consistent with the increasing concentration of excess anions being accommodated into thestructure by an increasing number of cuboctahedral units. Their density eventually becomes
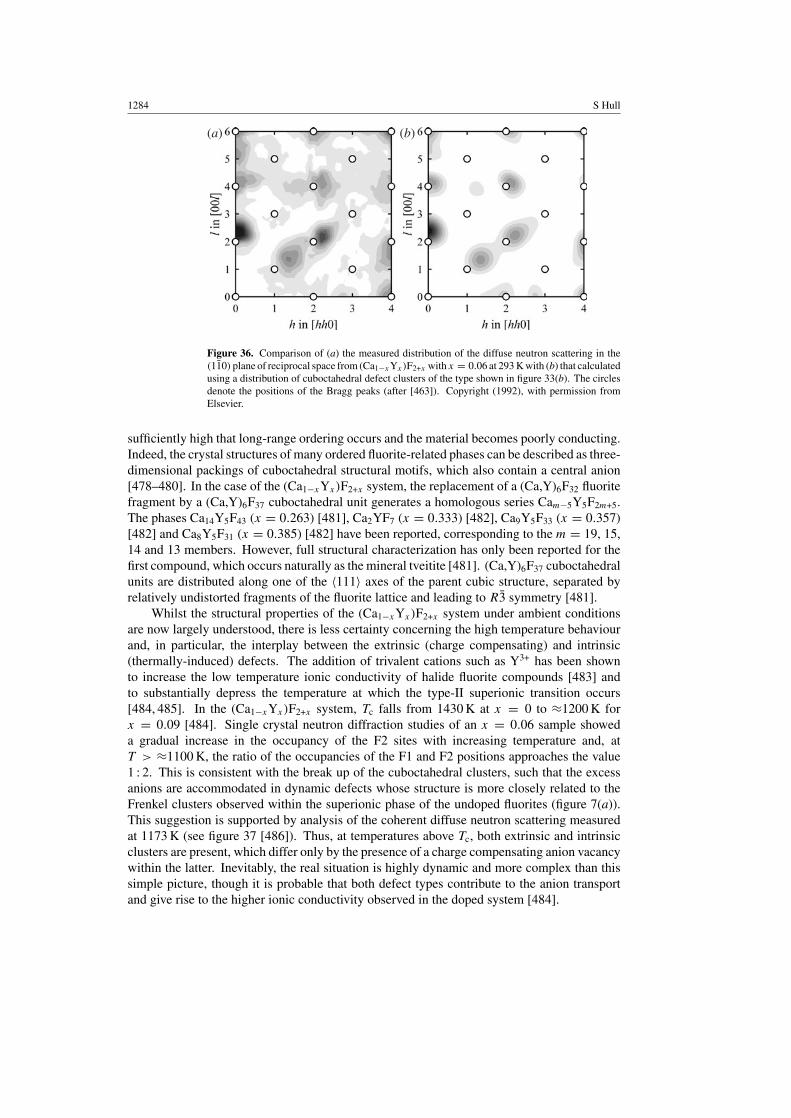
1284 S Hull
(a) (b)
Figure 36. Comparison of (a) the measured distribution of the diffuse neutron scattering in the(110) plane of reciprocal space from (Ca1−xYx)F2+x with x = 0.06 at 293 K with (b) that calculatedusing a distribution of cuboctahedral defect clusters of the type shown in figure 33(b). The circlesdenote the positions of the Bragg peaks (after [463]). Copyright (1992), with permission fromElsevier.
sufficiently high that long-range ordering occurs and the material becomes poorly conducting.Indeed, the crystal structures of many ordered fluorite-related phases can be described as three-dimensional packings of cuboctahedral structural motifs, which also contain a central anion[478–480]. In the case of the (Ca1−xYx)F2+x system, the replacement of a (Ca,Y)6F32 fluoritefragment by a (Ca,Y)6F37 cuboctahedral unit generates a homologous series Cam−5Y5F2m+5.The phases Ca14Y5F43 (x = 0.263) [481], Ca2YF7 (x = 0.333) [482], Ca9Y5F33 (x = 0.357)[482] and Ca8Y5F31 (x = 0.385) [482] have been reported, corresponding to the m = 19, 15,14 and 13 members. However, full structural characterization has only been reported for thefirst compound, which occurs naturally as the mineral tveitite [481]. (Ca,Y)6F37 cuboctahedralunits are distributed along one of the 〈111〉 axes of the parent cubic structure, separated byrelatively undistorted fragments of the fluorite lattice and leading to R3 symmetry [481].
Whilst the structural properties of the (Ca1−xYx)F2+x system under ambient conditionsare now largely understood, there is less certainty concerning the high temperature behaviourand, in particular, the interplay between the extrinsic (charge compensating) and intrinsic(thermally-induced) defects. The addition of trivalent cations such as Y3+ has been shownto increase the low temperature ionic conductivity of halide fluorite compounds [483] andto substantially depress the temperature at which the type-II superionic transition occurs[484, 485]. In the (Ca1−xYx)F2+x system, Tc falls from 1430 K at x = 0 to ≈1200 K forx = 0.09 [484]. Single crystal neutron diffraction studies of an x = 0.06 sample showeda gradual increase in the occupancy of the F2 sites with increasing temperature and, atT > ≈1100 K, the ratio of the occupancies of the F1 and F2 positions approaches the value1 : 2. This is consistent with the break up of the cuboctahedral clusters, such that the excessanions are accommodated in dynamic defects whose structure is more closely related to theFrenkel clusters observed within the superionic phase of the undoped fluorites (figure 7(a)).This suggestion is supported by analysis of the coherent diffuse neutron scattering measuredat 1173 K (see figure 37 [486]). Thus, at temperatures above Tc, both extrinsic and intrinsicclusters are present, which differ only by the presence of a charge compensating anion vacancywithin the latter. Inevitably, the real situation is highly dynamic and more complex than thissimple picture, though it is probable that both defect types contribute to the anion transportand give rise to the higher ionic conductivity observed in the doped system [484].
Crystal structures and conduction processes 1285
(a) (b)
Figure 37. Comparison of (a) the measured distribution of the diffuse neutron scattering in the(110) plane of reciprocal space from (Ca1−xYx)F2+x with x = 0.06 at 1173 K with that calculatedusing a distribution of Frenkel type defects (see text). The circles denote the positions of the Braggpeaks (after [486]).
4.7. Anion-deficient fluorite: (Zr1−xYx)O2−x/2
The binary oxide zirconia, ZrO2, only adopts the cubic fluorite structure within a relativelynarrow temperature range immediately below its melting point (≈2643 K < T < Tm ≈2988 K [487, 488]). Below ≈2643 K, this cubic phase (c-ZrO2) transforms to a tetragonal form(t-ZrO2, space group P 42/nmc [489]), in which alternate 110 planes of anions are displacedin opposite directions along the [001] axis by ≈0.3 Å. A further structural change occurs oncooling below ≈1370 K, such that the Zr4+ co-ordination shell becomes an irregular polyhedronof seven anions within the monoclinic baddelyite-structured phase (m-ZrO2, P 21/c [490]). Itis well known that the addition of suitable divalent (Ca2+, Mg2+, etc) and trivalent (Y3+, Sc3+,Nd3+, etc) cation species can stabilize the two high temperature forms under ambient conditions(see, e.g. [491]). In these ‘stabilized’ tetragonal (t*-ZrO2) and cubic (c∗-ZrO2) zirconias thedopant cations are located substitutionally on the Zr4+ sites and a fraction of the oxygen sitesbecome empty to retain overall electrical neutrality. The presence of high concentrationsof anion vacancies gives rise to impressive values of ionic conductivity at relatively modesttemperatures. Coupled with their very low electronic conductivities, this makes stabilizedzirconia ceramics highly attractive for technological applications within, for example, fuelcells and oxygen sensors [492].
Ionic conductivity measurements [493, 494] and quasi-elastic light scattering studies [495]have confirmed that the high ionic conductivity shown by stabilized zirconias at elevatedtemperatures is due to mobile O2− vacancies. However, a simple picture of uncorrelateddiffusion of anion vacancies through the crystal lattice cannot account for the variation of σi
with dopant concentration x, which generally shows a maximum close to the lower limit ofstability of the c∗ phase [496–498]. This observation has provided a challenge to theoreticalattempts to model the microscopic diffusion mechanism using MC [499–501], MD [502–506]and other [507–513] methods. A simple model of a bound dopant cation–anion vacancy pairreproduced the peak in σi, but its rapid decrease with increasing x within the c∗ phase couldonly be reproduced by including a free energy-like function describing the ordering of O2−
vacancies by long-range defect–defect interactions [514]. Similarly, defect clusters formedby the aggregation of dopant cations have been shown to create deep traps that immobilizevacancies and give a qualitative agreement with the observed concentration dependence of

1286 S Hull
x in (Zr1-xYx)O2-x/2
0.1 0.2 0.3
Ioni
c C
ondu
ctiv
ityσ i
( Ω−1
cm−1
)
10-4
10-3
10-2
10-1
100
1000K
1250K
1667K
t*→c*
Figure 38. The variation of the ionic conductivityσi of (Zr1−xYx)O2−x/2 with dopant concentrationx at three different temperatures. The maximum in σi occurs close to the lower limit of stability ofthe stabilized cubic form (c∗) (schematic representation based on data published in [496, 497]).
σi [507]. However, the precise structure(s) of the extrinsic defects present within stabilizedzirconias have been the subject of numerous diffraction studies, especially in the case of(Zr1−xYx)O2−x/2.
The m → t∗ and t∗ → c∗ transitions occur within the (Zr1−xYx)O2−x/2 system at x ≈ 0.05and x ≈ 0.16, respectively, though there is a degree of co-existence between the neighbour-ing phases [487]. The latter coincides roughly with the maximum value of σi (see figure 38[496]). Electron [515–522], x-ray [523–528] and neutron [529–536] diffraction studies of thec∗-(Zr1−xYx)O2−x/2 phase have shown that significant fractions of both the anions and cationsare displaced off their regular lattice sites. However, the detailed description of the local struc-ture has proved controversial. For example, the observed diffuse x-ray scattering could besuccessfully simulated by allowing only the cations to move in 〈110〉 directions, with the extentof their individual relaxations depending on the proximity of oxygen vacancies [526]. Con-versely, single crystal neutron diffraction studies showed that the anions are displaced from theirlattice sites predominantly in 〈100〉 directions and, to a lesser extent, in 〈111〉 directions [535].
A recent comprehensive study of the structural properties of c∗-(Zr1−xYx)O2−x/2 as afunction of both composition (0.182 x 0.388) and temperature (293 K T 2780 K)analysed the Bragg and coherent diffuse scattering from single crystals measured by bothneutron and x-ray radiations, exploiting their increased sensitivity to the locations of the anionsand cations, respectively [536]. As might be expected, the defect structure is rather complex.At lower Y3+ concentrations (x < ≈0.26) there are regions of the crystal typically ∼20 Åin size, containing relatively few oxygen vacancies, in which the anion sublattice undergoesa slight tetragonal distortion of the type observed in the t∗ phase which is stable at lower xvalues [530]. As x increases, an increasing number of single vacancies and pairs of vacanciesaligned along 〈111〉 directions appear. Both of these defect types are surrounded by relaxationfields characterized by displacements of the neighbouring anions in 〈100〉 directions towardsthe vacancies and nearest neighbour cations in 〈111〉 directions away from the vacancies (seefigure 39). The cation-centred 〈111〉 vacancy pairs tend to pack together in 〈112〉 directions

Crystal structures and conduction processes 1287
(a) (b)
Figure 39. The defect structures observed within the c∗ phase of (Zr1−xYx)O2−x/2. These are (a)an isolated single vacancy with associated relaxations of nearest neighbour anions and cations and(b) a cation-centred vacancy pair along a 〈111〉 direction with relaxations of the surrounding anionsand cations (after [536]). The latter pack together in 〈112〉 directions to form aggregates ∼15 Å insize containing six- and seven-fold co-ordinated cation sites (labelled M1 and M2, respectively).Copyright (1999) by the American Physical Society.
to form aggregates ∼15 Å in diameter. Measurements of the quasi-elastic energy broadeningof the coherent diffuse scattering arising from each defect type showed these aggregates to beessentially static, even at very high temperatures close to the melting point [536]. In contrast,the isolated anion vacancies become mobile at T > ∼1000 K (see figure 40) and are clearlyresponsible for the high macroscopic ionic conductivity. Using this structural model, the rapiddecrease in σi with increasing x within the c∗ phase was attributed to a decrease in the mobilityof the isolated vacancies, since both the number and size of the (static) aggregates increase withx [536] such that they effectively block the diffusion pathways. This hypothesis is supportedby observations of a maximum in the O2− diffusion coefficient at x ≈ 0.18 [537] and by MDsimulations [505].
The stability of the vacancy aggregate clusters within the c∗ phase of (Zr1−xYx)O2−x/2
at elevated temperatures contrasts with the behaviour of the extrinsic cuboctahedral clustersobserved within the anion-excess fluorite (Ca1−xYx)F2+x (see section 4.6), since the latter breakup on heating and enhance, rather than hinder, the onset of high ionic conductivity. However,the tendency to form ordered compounds at higher values of x via long-range packing of theirrespective defect units is a common feature to both systems. The ionic arrangement within thevacancy-pair aggregates observed within c∗-(Zr1−xYx)O2−x/2 closely resembles the structureof the compound Zr3Y4O12 [538,539]. Zr3Y4O12 is the only ordered intermediate phase inthe (Zr1−xYx)O2−x/2 system and corresponds to x = 0.571 [488]. Its crystal structure isderived from the ‘ideal’ fluorite arrangement by ordering of the 〈111〉 vacancy pairs, loweringthe symmetry from cubic to rhombohedral (space group R3 [538]) and giving an effectivestoichiometry of M1M26O122 (where denotes an anion vacancy). The cation sites M1 andM2 correspond to the six-fold and seven-fold co-ordinated positions within the defect aggregate,respectively (see figure 39(b)). Computer simulations of a variety of doped zirconia systemssuggested that the anion vacancies are preferentially located close to whichever of the twocation species (host or dopant) is the smallest [510, 513]. Unfortunately, the relative similaritybetween the neutron and x-ray scattering powers of Zr4+ and Y3+ does not allow the distributionof the two cation species over the M1 and M2 sites to be established by diffraction methods

1288 S Hull
Neu
tron
Cou
nts
0
2000
4000
6000
8000(a)
(b)
(c)
Q=1.4,1.4,1.8T=300K
0
1000
2000
3000
4000
5000Q=1.4,1.4,1.8T=1800K
Energy Transfer (meV)-2 -1 0 1 2
0
1000
2000
3000Q=1.7,1.7,1.0T=1800K
G
L*G
B
L*G
G
B
Figure 40. Quasi-elastic scans of the neutron energy transfer at constant scattering vector Q
through the coherent diffuse scattering from a (Zr1−xYx)O2−x/2 sample with x = 0.126(5) atthe temperatures shown. The experimental data are fitted by a combination of an instrumentalresolution limited Gaussian peak (G), a broadened Lorentzian component convolved with theGaussian instrumental resolution function (L ∗ G) and a linear background contribution (B). Theprofile at Q = 1.4, 1.4, 1.8 does not broaden significantly on increasing the temperature from (a)300 K to (b) 1800 K, indicating that the aggregates of cation-centred vacancy pairs which give riseto the diffuse scattering at this Q position remain stable up to high temperatures. In contrast, (c)
the diffuse scattering at Q = 1.7, 1.7, 1.0 arises predominantly from isolated O2− vacancies andits significant quasi-elastic energy broadening clearly indicates that these defects are mobile andcontribute to the macroscopically observed ionic conductivity (after [536]). Copyright (1999) bythe American Physical Society.
[539]. In principle, the EXAFS technique can probe the individual co-ordination polyhedrasurrounding each cation type, but the published studies provide opposing reports favouringpreferential association of the vacancies with the host Zr4+ [540, 541] and dopant Y3+ [542]cations. Contradictory findings have also been reported on the basis of MD simulations (see[502, 503] and [505], respectively).
4.8. Pyrochlore-structured superionics: Zr2M2O7 compounds
The ionic conductivities of the stabilized c∗ phases formed by the addition of trivalent rare-earth cations (Re3+) to ZrO2 show similar behaviour to that discussed for (Zr1−xYx)O2−x/2

Crystal structures and conduction processes 1289
(a) (b)
Figure 41. The relationship between the crystal structures of (a) a fluorite-structured oxide ofstoichiometry AO2 and (b) a pyrochlore-structured oxide of stoichiometry A2B2O7. The formeris converted into the latter by replacement of half the AO8 cubes by AO6 distorted octahedra.The two symmetry independent anion sites (O1 and O2) within the pyrochlore arrangement areillustrated.
in the previous subsection (see, e.g. [31, 491, 498]). However, fluorite-related phases ofstoichiometry Zr3Re4O12 (x = 4
7 ) are only observed for smaller Re3+ ions [543]. ForrRe3+ > rTb3+ (which includes Re3+ = Gd3+, Sm3+, Nd3+ and Pr3+), increasing x insteadfavours the formation of phases of composition Zr2Re2O7 (x = 1
2 ) with the cubic pyrochlorestructure (space group Fd3m) [544, 545]. The pyrochlore structure is a superstructure of thecubic fluorite arrangement with aPyro = 2aFluorite, so that the unit cell contains 16 × Zr4+,16×Re3+ and 56×O2−. The two cation species are ordered into rows in 〈110〉 directions. The64 anion positions in the equivalent fluorite arrangement are described using Fd3m symmetryby a 48-fold set (labelled O1) plus two eight-fold sets (labelled O2 and O3)11. Both the O1 andO2 positions are fully occupied within an ‘ideal’ pyrochlore, whilst the O3 sites are completelyempty. As a consequence, the O1 anions relax in 〈100〉 directions towards the vacant O3 sites,such that their positional parameter x is typically less than 3
8 [546]. The smaller Zr4+ then sitsat the centre of a distorted octahedron whilst the Re3+ has a distorted cubic environment (seefigure 41).
The relationship between the pyrochlore and fluorite crystal structures is analogous tothat between the brownmillerite and perovskite arrangements (see figure 26 and section 3.13).This correspondence suggests that Zr2Re2O7 compounds will adopt disordered anion-deficientcubic fluorite-structured phases at elevated temperatures. Whilst this behaviour is observedexperimentally [547], many pyrochlore-structured oxides also exhibit high values of oxygen-ion conductivity at lower temperatures [548]. For example, Zr2Gd2O7 has σi ≈ 8 ×10⁻³ −1 cm−1 at 1000 K [549] but the transition to the disordered, anion-deficient fluorite-structured phase does not occur until ∼1800 K [547]. X-ray diffraction studies of Zr2Gd2O7
showed anisotropic thermal vibrations of the O1 anions towards the (empty) O3 positions,suggesting that this is the preferred diffusion route [550]. Static energy calculations [551, 552]
11 Within space group Fd3m the Zr4+ and Re3+ are located in the 16(c) sites at 0, 0, 0, etc and the 16(d) sites at 12 , 1
2 , 12 ,
etc, respectively. The oxygen positions within the equivalent fluorite-structured anion sublattice are located in the48( f ) sites at x, 1
8 , 18 , etc with x = 3
8 (O1), the 8(b) sites at 38 , 3
8 , 38 , etc (O2) and the 8(a) sites at 1
8 , 18 , 1
8 , etc (O3).
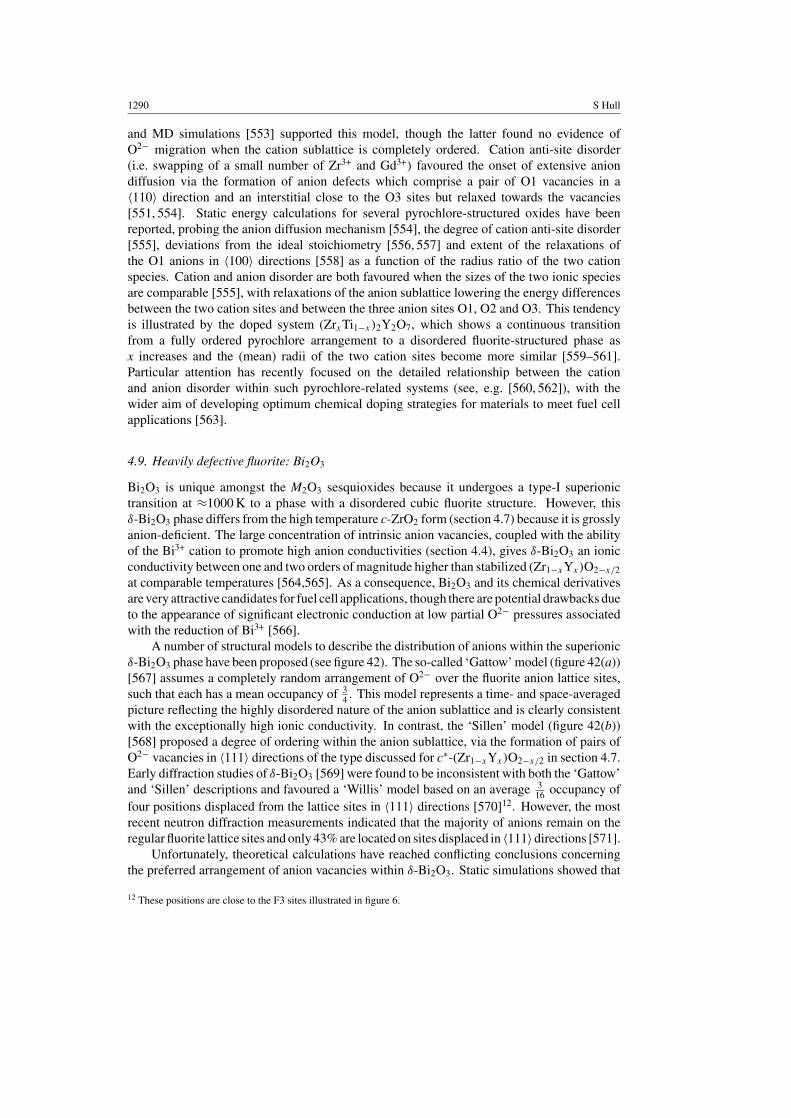
1290 S Hull
and MD simulations [553] supported this model, though the latter found no evidence ofO2− migration when the cation sublattice is completely ordered. Cation anti-site disorder(i.e. swapping of a small number of Zr3+ and Gd3+) favoured the onset of extensive aniondiffusion via the formation of anion defects which comprise a pair of O1 vacancies in a〈110〉 direction and an interstitial close to the O3 sites but relaxed towards the vacancies[551, 554]. Static energy calculations for several pyrochlore-structured oxides have beenreported, probing the anion diffusion mechanism [554], the degree of cation anti-site disorder[555], deviations from the ideal stoichiometry [556, 557] and extent of the relaxations ofthe O1 anions in 〈100〉 directions [558] as a function of the radius ratio of the two cationspecies. Cation and anion disorder are both favoured when the sizes of the two ionic speciesare comparable [555], with relaxations of the anion sublattice lowering the energy differencesbetween the two cation sites and between the three anion sites O1, O2 and O3. This tendencyis illustrated by the doped system (ZrxTi1−x)2Y2O7, which shows a continuous transitionfrom a fully ordered pyrochlore arrangement to a disordered fluorite-structured phase asx increases and the (mean) radii of the two cation sites become more similar [559–561].Particular attention has recently focused on the detailed relationship between the cationand anion disorder within such pyrochlore-related systems (see, e.g. [560, 562]), with thewider aim of developing optimum chemical doping strategies for materials to meet fuel cellapplications [563].
4.9. Heavily defective fluorite: Bi2O3
Bi2O3 is unique amongst the M2O3 sesquioxides because it undergoes a type-I superionictransition at ≈1000 K to a phase with a disordered cubic fluorite structure. However, thisδ-Bi2O3 phase differs from the high temperature c-ZrO2 form (section 4.7) because it is grosslyanion-deficient. The large concentration of intrinsic anion vacancies, coupled with the abilityof the Bi3+ cation to promote high anion conductivities (section 4.4), gives δ-Bi2O3 an ionicconductivity between one and two orders of magnitude higher than stabilized (Zr1−xYx)O2−x/2
at comparable temperatures [564,565]. As a consequence, Bi2O3 and its chemical derivativesare very attractive candidates for fuel cell applications, though there are potential drawbacks dueto the appearance of significant electronic conduction at low partial O2− pressures associatedwith the reduction of Bi3+ [566].
A number of structural models to describe the distribution of anions within the superionicδ-Bi2O3 phase have been proposed (see figure 42). The so-called ‘Gattow’ model (figure 42(a))[567] assumes a completely random arrangement of O2− over the fluorite anion lattice sites,such that each has a mean occupancy of 3
4 . This model represents a time- and space-averagedpicture reflecting the highly disordered nature of the anion sublattice and is clearly consistentwith the exceptionally high ionic conductivity. In contrast, the ‘Sillen’ model (figure 42(b))[568] proposed a degree of ordering within the anion sublattice, via the formation of pairs ofO2− vacancies in 〈111〉 directions of the type discussed for c∗-(Zr1−xYx)O2−x/2 in section 4.7.Early diffraction studies of δ-Bi2O3 [569] were found to be inconsistent with both the ‘Gattow’and ‘Sillen’ descriptions and favoured a ‘Willis’ model based on an average 3
16 occupancy offour positions displaced from the lattice sites in 〈111〉 directions [570]12. However, the mostrecent neutron diffraction measurements indicated that the majority of anions remain on theregular fluorite lattice sites and only 43% are located on sites displaced in 〈111〉directions [571].
Unfortunately, theoretical calculations have reached conflicting conclusions concerningthe preferred arrangement of anion vacancies within δ-Bi2O3. Static simulations showed that
12 These positions are close to the F3 sites illustrated in figure 6.
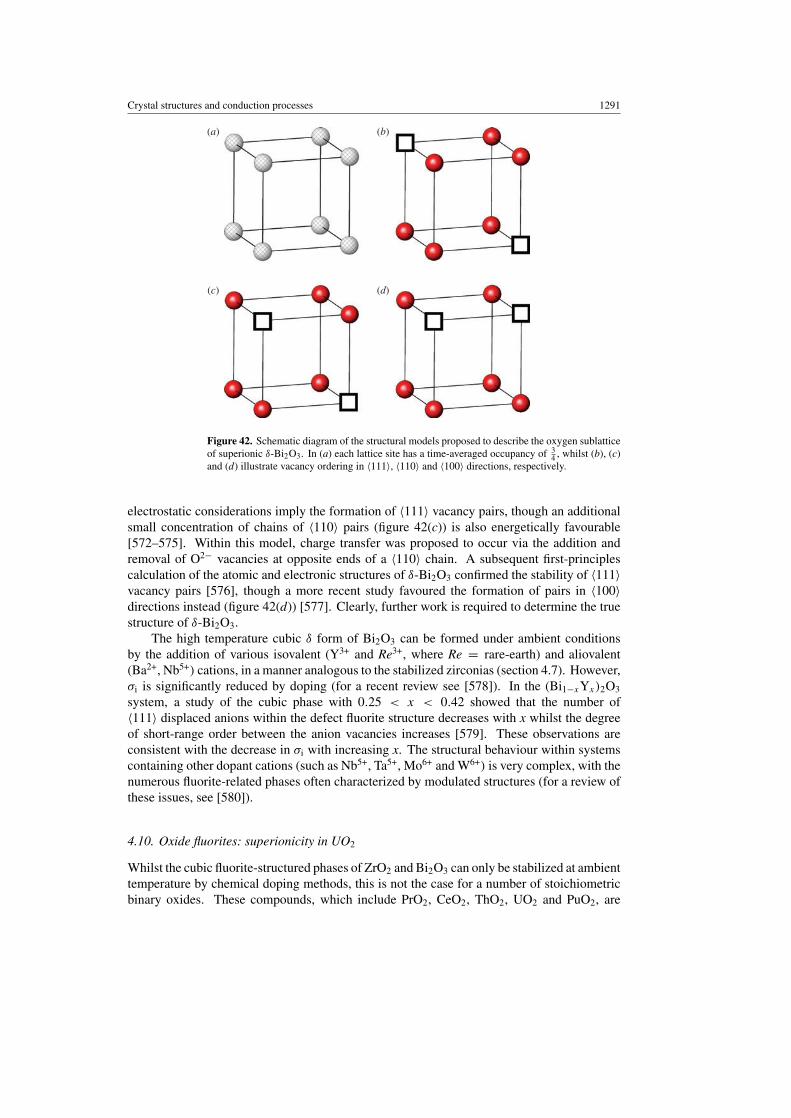
Crystal structures and conduction processes 1291
(a) (b)
(c) (d)
Figure 42. Schematic diagram of the structural models proposed to describe the oxygen sublatticeof superionic δ-Bi2O3. In (a) each lattice site has a time-averaged occupancy of 3
4 , whilst (b), (c)and (d) illustrate vacancy ordering in 〈111〉, 〈110〉 and 〈100〉 directions, respectively.
electrostatic considerations imply the formation of 〈111〉 vacancy pairs, though an additionalsmall concentration of chains of 〈110〉 pairs (figure 42(c)) is also energetically favourable[572–575]. Within this model, charge transfer was proposed to occur via the addition andremoval of O2− vacancies at opposite ends of a 〈110〉 chain. A subsequent first-principlescalculation of the atomic and electronic structures of δ-Bi2O3 confirmed the stability of 〈111〉vacancy pairs [576], though a more recent study favoured the formation of pairs in 〈100〉directions instead (figure 42(d)) [577]. Clearly, further work is required to determine the truestructure of δ-Bi2O3.
The high temperature cubic δ form of Bi2O3 can be formed under ambient conditionsby the addition of various isovalent (Y3+ and Re3+, where Re = rare-earth) and aliovalent(Ba2+, Nb5+) cations, in a manner analogous to the stabilized zirconias (section 4.7). However,σi is significantly reduced by doping (for a recent review see [578]). In the (Bi1−xYx)2O3
system, a study of the cubic phase with 0.25 < x < 0.42 showed that the number of〈111〉 displaced anions within the defect fluorite structure decreases with x whilst the degreeof short-range order between the anion vacancies increases [579]. These observations areconsistent with the decrease in σi with increasing x. The structural behaviour within systemscontaining other dopant cations (such as Nb5+, Ta5+, Mo6+ and W6+) is very complex, with thenumerous fluorite-related phases often characterized by modulated structures (for a review ofthese issues, see [580]).
4.10. Oxide fluorites: superionicity in UO2
Whilst the cubic fluorite-structured phases of ZrO2 and Bi2O3 can only be stabilized at ambienttemperature by chemical doping methods, this is not the case for a number of stoichiometricbinary oxides. These compounds, which include PrO2, CeO2, ThO2, UO2 and PuO2, are
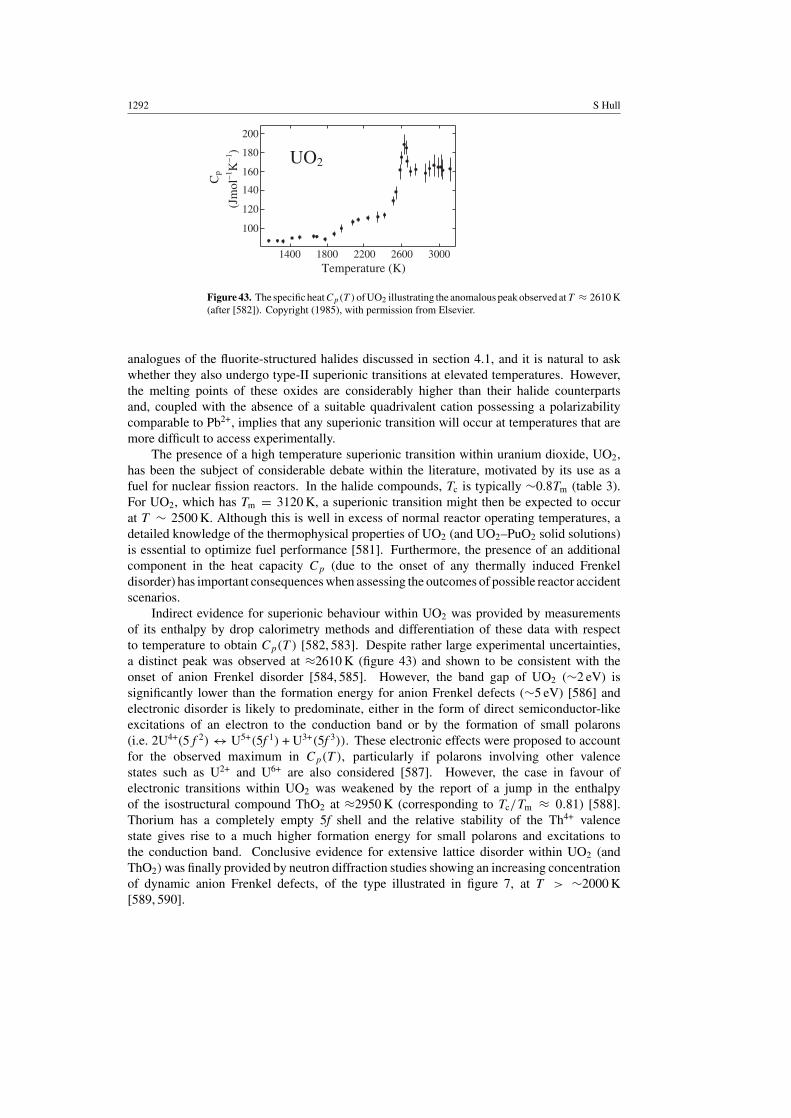
1292 S Hull
Cp
(Jm
ol− 1
K− 1
)
Temperature (K) 1400 1800 2200 2600 3000
200
180
160
140
120
100
UO2
Figure 43. The specific heatCp(T )of UO2 illustrating the anomalous peak observed atT ≈ 2610 K(after [582]). Copyright (1985), with permission from Elsevier.
analogues of the fluorite-structured halides discussed in section 4.1, and it is natural to askwhether they also undergo type-II superionic transitions at elevated temperatures. However,the melting points of these oxides are considerably higher than their halide counterpartsand, coupled with the absence of a suitable quadrivalent cation possessing a polarizabilitycomparable to Pb2+, implies that any superionic transition will occur at temperatures that aremore difficult to access experimentally.
The presence of a high temperature superionic transition within uranium dioxide, UO2,has been the subject of considerable debate within the literature, motivated by its use as afuel for nuclear fission reactors. In the halide compounds, Tc is typically ∼0.8Tm (table 3).For UO2, which has Tm = 3120 K, a superionic transition might then be expected to occurat T ∼ 2500 K. Although this is well in excess of normal reactor operating temperatures, adetailed knowledge of the thermophysical properties of UO2 (and UO2–PuO2 solid solutions)is essential to optimize fuel performance [581]. Furthermore, the presence of an additionalcomponent in the heat capacity Cp (due to the onset of any thermally induced Frenkeldisorder) has important consequences when assessing the outcomes of possible reactor accidentscenarios.
Indirect evidence for superionic behaviour within UO2 was provided by measurementsof its enthalpy by drop calorimetry methods and differentiation of these data with respectto temperature to obtain Cp(T ) [582, 583]. Despite rather large experimental uncertainties,a distinct peak was observed at ≈2610 K (figure 43) and shown to be consistent with theonset of anion Frenkel disorder [584, 585]. However, the band gap of UO2 (∼2 eV) issignificantly lower than the formation energy for anion Frenkel defects (∼5 eV) [586] andelectronic disorder is likely to predominate, either in the form of direct semiconductor-likeexcitations of an electron to the conduction band or by the formation of small polarons(i.e. 2U4+(5f 2) ↔ U5+(5f 1) + U3+(5f 3)). These electronic effects were proposed to accountfor the observed maximum in Cp(T ), particularly if polarons involving other valencestates such as U2+ and U6+ are also considered [587]. However, the case in favour ofelectronic transitions within UO2 was weakened by the report of a jump in the enthalpyof the isostructural compound ThO2 at ≈2950 K (corresponding to Tc/Tm ≈ 0.81) [588].Thorium has a completely empty 5f shell and the relative stability of the Th4+ valencestate gives rise to a much higher formation energy for small polarons and excitations tothe conduction band. Conclusive evidence for extensive lattice disorder within UO2 (andThO2) was finally provided by neutron diffraction studies showing an increasing concentrationof dynamic anion Frenkel defects, of the type illustrated in figure 7, at T > ∼2000 K[589, 590].

Crystal structures and conduction processes 1293
Temperature (K)300 600 900 1200 1500
Cat
ion
vaca
ncy
conc
entr
atio
n n V
0.00
0.05
0.10
0.15
0.20
Tm
Li2O
Figure 44. The temperature dependence of the cation vacancy concentration, nV, within Li2O(after [596]). The melting temperature, Tm, is illustrated.
4.11. The effect of ionic size: anti-fluorite Li2O
The similarities between the observed superionic behaviour shown by the various fluorite-structured halides and oxides (sections 4.1 and 4.10, respectively) implies that the anion’scharge plays a relatively minor role in promoting extensive lattice disorder. By studyinganti-fluorite-structured oxides such as Li2O, in which the positions of the anions and cationsare reversed with respect to the fluorite crystal structure, it is possible to assess the influenceof the mobile ion’s size.
Lithium oxide, Li2O, is a leading contender for use as a blanket breeding material in futurenuclear fusion reactors [591, 592], its purpose being to convert energetic neutrons to usableheat, and breed the tritium necessary to sustain the D–T reaction (6
3Li + 10n → 4
2He + 31T ).
The principal advantages of Li2O for this role lie in its relatively high melting temperature(Tm = 1705 K) and its impressive lithium density, which exceeds that of lithium metal by afactor of around two.
Experimental confirmation of a type-II superionic transition within anti-fluorite-structuredLi2O analogous to that seen in the fluorite-structured compounds is made difficult by theextreme moisture sensitivity of the material, which readily absorbs water from the atmosphereto form LiOH. The measured conductivity of Li2O is rather sensitive to the LiOH content [593],though tentative evidence for the onset of a superionic transition at ≈1300 K was reported[594]. NMR and ionic conductivity measurements confirmed that Li+ are the mobile speciesand showed that the electronic contribution to the measured conductivity is negligible [595].Once again, single crystal neutron diffraction studies were required to characterize the natureof the thermally induced disorder and confirm the presence of a superionic transition withTc ≈ 1200 K [596]. The anti-fluorite crystal structure with anharmonic thermal vibrations ofthe Li+ provided a good fit to the structure factors measured at temperatures up to ≈850 K,but an acceptable agreement could only be obtained at higher temperatures by including anincreasing fraction of cation Frenkel defects of the 3 : 1 : 2 type observed within the superionicphase of the fluorite-structured compounds (figure 7(a)). The concentration of Frenkel defectswithin Li2O reaches n = 0.17(3) at 1603 K (see figure 44) [596]. However, in comparison
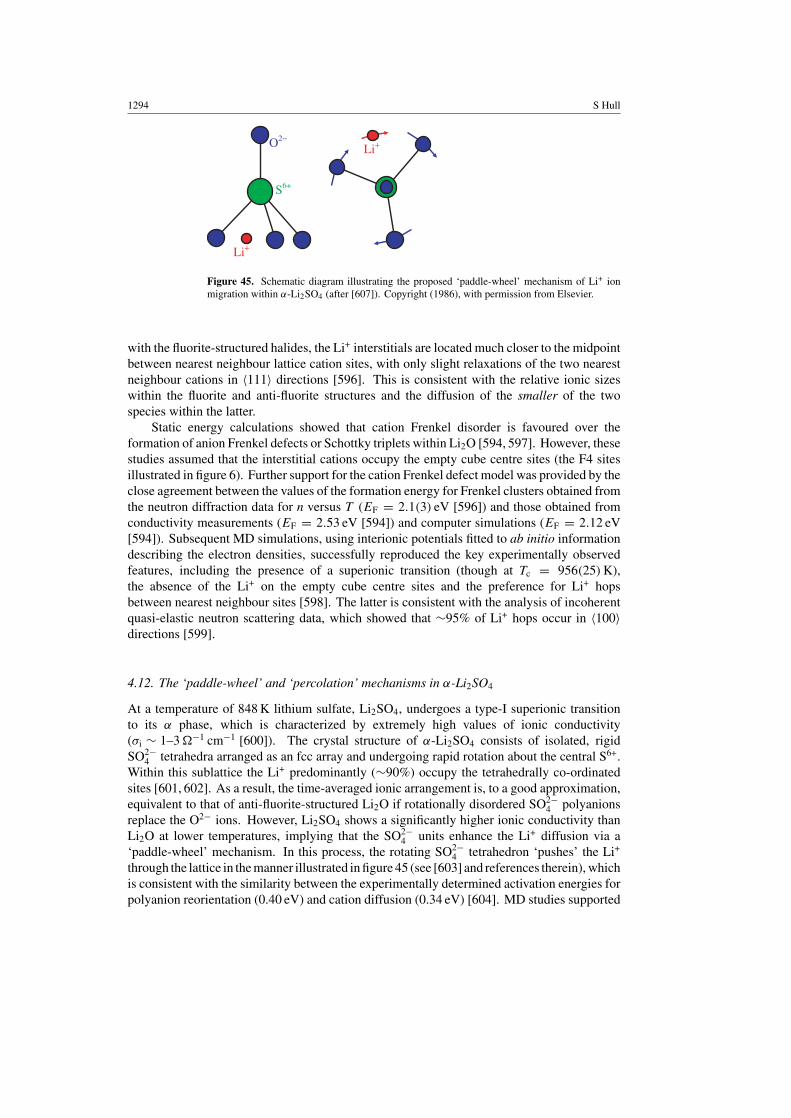
1294 S Hull
Li+
Li+
S6+
O2−
Figure 45. Schematic diagram illustrating the proposed ‘paddle-wheel’ mechanism of Li+ ionmigration within α-Li2SO4 (after [607]). Copyright (1986), with permission from Elsevier.
with the fluorite-structured halides, the Li+ interstitials are located much closer to the midpointbetween nearest neighbour lattice cation sites, with only slight relaxations of the two nearestneighbour cations in 〈111〉 directions [596]. This is consistent with the relative ionic sizeswithin the fluorite and anti-fluorite structures and the diffusion of the smaller of the twospecies within the latter.
Static energy calculations showed that cation Frenkel disorder is favoured over theformation of anion Frenkel defects or Schottky triplets within Li2O [594, 597]. However, thesestudies assumed that the interstitial cations occupy the empty cube centre sites (the F4 sitesillustrated in figure 6). Further support for the cation Frenkel defect model was provided by theclose agreement between the values of the formation energy for Frenkel clusters obtained fromthe neutron diffraction data for n versus T (EF = 2.1(3) eV [596]) and those obtained fromconductivity measurements (EF = 2.53 eV [594]) and computer simulations (EF = 2.12 eV[594]). Subsequent MD simulations, using interionic potentials fitted to ab initio informationdescribing the electron densities, successfully reproduced the key experimentally observedfeatures, including the presence of a superionic transition (though at Tc = 956(25) K),the absence of the Li+ on the empty cube centre sites and the preference for Li+ hopsbetween nearest neighbour sites [598]. The latter is consistent with the analysis of incoherentquasi-elastic neutron scattering data, which showed that ∼95% of Li+ hops occur in 〈100〉directions [599].
4.12. The ‘paddle-wheel’ and ‘percolation’ mechanisms in α-Li2SO4
At a temperature of 848 K lithium sulfate, Li2SO4, undergoes a type-I superionic transitionto its α phase, which is characterized by extremely high values of ionic conductivity(σi ∼ 1–3 −1 cm−1 [600]). The crystal structure of α-Li2SO4 consists of isolated, rigidSO2−
4 tetrahedra arranged as an fcc array and undergoing rapid rotation about the central S6+.Within this sublattice the Li+ predominantly (∼90%) occupy the tetrahedrally co-ordinatedsites [601, 602]. As a result, the time-averaged ionic arrangement is, to a good approximation,equivalent to that of anti-fluorite-structured Li2O if rotationally disordered SO2−
4 polyanionsreplace the O2− ions. However, Li2SO4 shows a significantly higher ionic conductivity thanLi2O at lower temperatures, implying that the SO2−
4 units enhance the Li+ diffusion via a‘paddle-wheel’ mechanism. In this process, the rotating SO2−
4 tetrahedron ‘pushes’ the Li+
through the lattice in the manner illustrated in figure 45 (see [603] and references therein), whichis consistent with the similarity between the experimentally determined activation energies forpolyanion reorientation (0.40 eV) and cation diffusion (0.34 eV) [604]. MD studies supported

Crystal structures and conduction processes 1295
the presence of correlations between the rotations of the SO2−4 units and diffusion of the Li+
[605] and also indicated that the Li+ partially occupy the octahedrally co-ordinated positions[606]. However, this ‘paddle-wheel’ mechanism predicts that the ionic conductivity of Li2SO4
would be reduced if it is doped with Li2WO4, because the heavier WO2−4 polyhedra would have
a slower rotation [607]. In fact, experimental studies showed that the addition of∼10% Li2WO4
to Li2SO4 increased σi by ∼5× [607], leading to the development of a counter-argument basedon a ‘percolation model’ in which the dominant factor in determining the ionic conductivity isthe free volume available for Li+ diffusion. Within this alternative description, the increase inσi on doping results from the expansion of the lattice caused by the incorporation of the largerWO2−
4 units [607].The relative importance of the ‘paddle-wheel’ and ‘percolation’ models of ion transport
within α-Li2SO4 has been the subject of a vitriolic debate within the literature (see, e.g.[601, 603, 608–611] and [612–614], respectively), which has also been extended to other‘rotator’ phases, including those in which the rotationally disordered polyanions form bcc andhcp sublattices (such as LiNaSO4 [615] and LiKSO4 [616], respectively). The high temperatureα phase of Na3PO4 has also attracted recent attention, because the fcc sublattice of tetrahedralPO3−
4 units are rotationally disordered about one of the P5+–O2− bonds aligned along a cubic〈100〉 axis [617]. More importantly, the increased cation population is accommodated byfilling all the tet and oct cavities with Na+. This higher cation density makes the percolationmodel harder to visualize [618] but, nevertheless, the ionic conductivity of α-Na3PO4 is stillrelatively high (σi = 2.9 × 10⁻² −1 cm−1 at 873 K [619]). Neutron diffraction [615,620]and quasi-elastic scattering [618, 621] studies have been unable to unambiguously resolve the‘paddle-wheel’ versus ‘percolation model’ debate, with the former study concluding that bothmechanisms are probably operative [615]. Indeed, the distinction between the two effects isprobably not clear-cut, since phase transitions to rotationally disordered phases are invariablyaccompanied by an increase in volume. Likewise, an increase in volume will favour the onsetof rotational disorder [622].
4.13. Spinel-structured superionics: Li2MCl4 compounds
As discussed in the previous two subsections, the diffusing Li+ within the anti-fluorite-structured superionic phases of Li2O and Li2SO4 predominantly occupy the tet sites within thefcc anion (or polyanion) sublattice, with only limited occupancy of the oct positions (figure 4).The cubic spinel-structured compounds considered in this subsection are also impressive Li+
conductors [623, 624] (σ ≈ 0.3 −1 cm−1 at ≈670 K for Li2CdCl4 [624]) but the cations aredistributed over both the oct and tet positions.
There are eight formula units of stoichiometry A2BX4 within the cubic unit cell of the spinelstructure (space group Fd3m), so that the fcc-structured anion sublattice contains 32×X anionsand generates 32 octahedrally and 64 tetrahedrally co-ordinated interstices. As illustrated infigure 46, the former comprise two 16-fold sets of sites (labelled oct1 and oct2) whilst the latterare formed by two eight-fold sets (tet1 and tet2) and a single 48-fold set (tet3)13. Filling all thetet positions with 64 cations would generate the anti-fluorite structure, but the stoichiometry ofspinel-structured compounds provides only 16 × A and 8 × B cations. In a so-called ‘normal’spinel, the A cations reside in the oct2 sites and the B cations are located in the tet1 positions,
13 Within space group Fd3m the fcc sublattice of the spinel structure is formed by the 32(e) sites at x, x, x, etc withx = 1
4 . The oct1 and oct2 positions are located in the 16(c) sites at 0, 0, 0, etc and the 16(d) sites at 12 , 1
2 , 12 , etc,
respectively. The tet1, tet2 and tet3 positions are located in the 8(a) sites at 18 , 1
8 , 18 , etc, the 8(b) sites at 3
8 , 38 , 3
8 , etc
and the 48( f ) sites at x, 18 , 1
8 , etc with x = 38 , respectively.
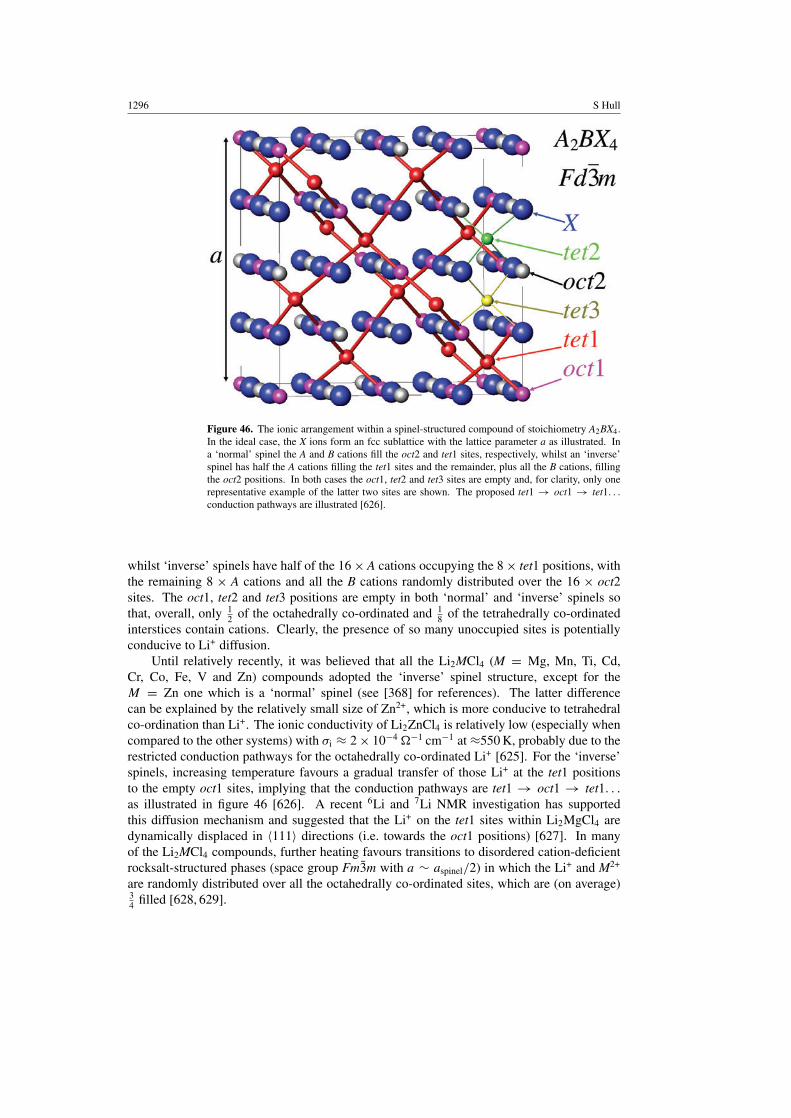
1296 S Hull
Figure 46. The ionic arrangement within a spinel-structured compound of stoichiometry A2BX4.In the ideal case, the X ions form an fcc sublattice with the lattice parameter a as illustrated. Ina ‘normal’ spinel the A and B cations fill the oct2 and tet1 sites, respectively, whilst an ‘inverse’spinel has half the A cations filling the tet1 sites and the remainder, plus all the B cations, fillingthe oct2 positions. In both cases the oct1, tet2 and tet3 sites are empty and, for clarity, only onerepresentative example of the latter two sites are shown. The proposed tet1 → oct1 → tet1. . .
conduction pathways are illustrated [626].
whilst ‘inverse’ spinels have half of the 16 × A cations occupying the 8 × tet1 positions, withthe remaining 8 × A cations and all the B cations randomly distributed over the 16 × oct2sites. The oct1, tet2 and tet3 positions are empty in both ‘normal’ and ‘inverse’ spinels sothat, overall, only 1
2 of the octahedrally co-ordinated and 18 of the tetrahedrally co-ordinated
interstices contain cations. Clearly, the presence of so many unoccupied sites is potentiallyconducive to Li+ diffusion.
Until relatively recently, it was believed that all the Li2MCl4 (M = Mg, Mn, Ti, Cd,Cr, Co, Fe, V and Zn) compounds adopted the ‘inverse’ spinel structure, except for theM = Zn one which is a ‘normal’ spinel (see [368] for references). The latter differencecan be explained by the relatively small size of Zn2+, which is more conducive to tetrahedralco-ordination than Li+. The ionic conductivity of Li2ZnCl4 is relatively low (especially whencompared to the other systems) with σi ≈ 2 × 10⁻⁴ −1 cm−1 at ≈550 K, probably due to therestricted conduction pathways for the octahedrally co-ordinated Li+ [625]. For the ‘inverse’spinels, increasing temperature favours a gradual transfer of those Li+ at the tet1 positionsto the empty oct1 sites, implying that the conduction pathways are tet1 → oct1 → tet1. . .
as illustrated in figure 46 [626]. A recent 6Li and 7Li NMR investigation has supportedthis diffusion mechanism and suggested that the Li+ on the tet1 sites within Li2MgCl4 aredynamically displaced in 〈111〉 directions (i.e. towards the oct1 positions) [627]. In manyof the Li2MCl4 compounds, further heating favours transitions to disordered cation-deficientrocksalt-structured phases (space group Fm3m with a ∼ aspinel/2) in which the Li+ and M2+
are randomly distributed over all the octahedrally co-ordinated sites, which are (on average)34 filled [628, 629].
Crystal structures and conduction processes 1297
Recently, the structures adopted by many of the Li2MCl4 compounds under ambientconditions have been revisited and several have been shown to possess distortions of the‘inverse’ spinel structure [630]. Compounds with closely related stoichiometries have alsobeen identified, including the ordered rocksalt-structured Li5CrCl8 [631] and the so-called‘Suzuki’ phase Li6FeCl8 [632]. Despite the high values of ionic conductivity shown by manyof these materials at relatively modest temperatures, their application within solid state batteriesis limited by a relatively low decomposition potential of ≈1.1–1.3 V [633].
4.14. Lithium battery applications: LixMn2O4
Lightweight, high power density rechargeable batteries capable of operating at voltages greaterthan around 2 V are increasingly in demand for laptop computers, mobile phones and otherportable electronic equipment. As a consequence, considerable research effort has beendevoted to the quest for economically viable cells based on compounds that contain mobileLi+ [28–30]. Of particular interest here is the spinel-structured compound LixMn2O4, whichis a promising material owing to its wide stability range (≈0 < x < ≈2.25) and low costand toxicity when compared to existing compounds such as LiCoO2 [634, 635]. Its use withinbattery applications has been described elsewhere [28, 29] and the discussion here is restrictedto its structural properties.
LiMn2O4 adopts the ‘normal’ spinel structure (see section 4.13), with an average valenceof Mn3.5+ on the oct2 sites (see figure 46). The Li+ are located in the tet1 sites andthe surrounding tetrahedron of anions shares four common faces with empty oct1-centredoctahedra [636]. Atomistic simulations [637] and 7Li NMR studies [638] have confirmed thatthe three-dimensional network of tet1 → oct1 → tet1. . . sites forms the favoured migrationroute for Li+, as it does in the ‘inverse’ spinel-structured halides discussed in the previoussubsection. Li+ is removed from and inserted into the cathode material during charge anddischarge cycles of the battery, respectively, with a corresponding oxidation or reduction ofthe manganese ions. However, the Mn2O4 framework remains essentially intact during thisprocess [636]. In the regime 0 < x < 1, electrochemical cells based on spinel-structuredLixMn2O4 operate at ≈4 V, with Li+ gradually removed from the tet1 sites as the materialtends towards completely delithiated λ-MnO2 [639, 640]. As x increases from x = 1.0, thecell voltage falls to ≈3 V but then remains essentially constant up to x ≈ 2.0 [635]. In thisregion, Li+ enters the empty oct1 sites and the Li+ already present also tend to migrate from thetet1 to the oct1 positions [639]. This process eventually leads to the formation of a compoundof composition Li2Mn2O4 possessing an ordered rocksalt-like structure. The insertion of Li+
causes an increase in the concentration of the Jahn–Teller active Mn3+ ions, whose preferencefor a distorted local environment leads to a reduction in symmetry from cubic to tetragonal[636]. Over discharged LixMn2O4 with x > ≈2.2 shows a drop in the open circuit voltage to≈1.2 V, probably due to shearing of the fcc O2− sublattice towards hcp as the material tendstowards the layered structure adopted by Li4Mn2O4 (Li2MnO2) [641].
A major commercial limitation to the use of LiMn2O4-based cells is the loss of capacityafter repeated charge–discharge cycles. A number of explanations for this behaviour have beenproposed (for details, see [29, 642]). These include the detrimental effects of the Jahn–Tellerdistortions which occur when the average Mn charge approaches +3.5, because the severetetragonal distortion (c/a = 1.16 [639]) damages the structural integrity of the material anddegrades the contacts between neighbouring particles. Partial Mn3+/Mn4+ charge orderingalso promotes a first-order structural phase transition within spinel-structured LiMn2O4 attemperatures just below ambient [643–645]. Introducing an excess of Li+ (i.e. Li1+xMn2−xO4)
reduces the transition temperature (from 282 K for x = 0 to 214 K for x = 0.035 [644]) and

1298 S Hull
improves the rechargeable capacity [646]. However, there is increasing evidence that the Li+
removal/insertion process involves complex microstructural changes, including ordering ofthe Li+ [647, 648] and the formation of additional Li–Mn–O phases [649]. Such issues areincreasingly being probed by in situ diffraction studies of electrochemical devices whilst theyare charged/discharged within the x-ray [650, 651] or neutron [652] beam.
4.15. Superionics based on an hcp sublattice: the LISICONs
Intuitively, the close structural similarity between the fcc and hcp lattices suggests that largefamilies of highly conducting compounds will exist possessing hexagonal structures equivalentto the cubic fluorite, pyrochlore and spinel arrangements already discussed. However, asmentioned in section 3.3, the different stacking sequences of the two-dimensional close-packedlayers generates pairs of tetrahedrally co-ordinated sites within the hcp lattice that are too closeto be filled simultaneously (such as the tet1 and tet3 positions shown in figure 12). Since theoccupancy of sites with tetrahedral environments is a common feature of most superionics,hcp-based ones are actually less common that their cubic analogues. Those that are observedare usually characterized by a somewhat lower concentration of mobile ions.
A large number of ternary and quarternary compounds with stoichiometries ABO2,A3BO4 and A2BCO4 possess structures formed by filling the (available) tetrahedrallyco-ordinated interstices within an hcp anion sublattice. The possible arrangements adoptedby these so-called ‘tetrahedral’ structures have been reviewed elsewhere [653, 654]. Thestoichiometries listed above all contain equal numbers of cations and anions and are derivativesof the binary hexagonal wurtzite structure (adopted by, e.g. β-AgI [37]). At relatively lowtemperatures, compounds such as LiGaO2 and Li3PO4 adopt ‘β’ phases in which the twocation species are ordered over the tet sites occupied within the wurtzite arrangement, such thatthe cation-centred tetrahedra share only corners (see figure 47). At elevated temperatures thecations typically occupy other tetrahedrally co-ordinated sites as well, so that edge-sharing (butnot face-sharing) of the cation-centred tetrahedra occurs. The different tetrahedral linkages andcation ordering schemes generate numerous structure types, including the so-called γ -phasesof LiAlO2 and Li3PO4 [653].
The structure of γ -Li3PO4 (space group Pnma) contains edge-shared LiO4 tetrahedra butonly corner-sharing occurs between the PO4 units. Together with the isostructural counterpartsLi3VO4 and Li2ZnGeO4, it forms an important class of superionic material for high temperaturebattery applications (see [368]). The stoichiometric compounds possess relatively low ionicconductivities because the Li+ are ‘built’ into the structure. However, aliovalent dopingcan dramatically enhance σi to form, for example, Li3+x(P1−xSix)O4, Li3+x(V1−xGex)O4 andLi2+2xZn1−xGeO4. These are the so-called lithium superionic conductors (LISICONs). Forthe reasons given above, the excess Li+ cannot be accommodated on tet sites within the hcpanion sublattice without producing anomalously short cation–cation contacts. In the case ofLi2+2xZn1−xGeO4, additional Li+ have been proposed to occupy octahedrally co-ordinatedinterstitial sites [655, 656], though it has also been suggested that three Li+ form a morecomplex defect cluster, which moves as a whole [657, 658].
4.16. The tetragonal-packed sublattice: Li4SiO4 and Li4GeO4
A distortion of the hcp sublattice generates the so-called ‘tetragonal-packed’ (tp) array [659]and is a mechanism which allows additional cations to be accommodated on tetrahedrallyco-ordinated sites. During the hcp → tp conversion the former’s six-fold axis is lost but a new

Crystal structures and conduction processes 1299
Figure 47. Comparison of the crystal structures of (a) β-AgI, (b) LiGaO2 and (c) Li3PO4. Theformer comprises a network of corner-sharing AgI4 tetrahedra. The structures of the latter two ‘β’phases are derived from the wurtzite structure by ordering of the GaO4 (PO4) tetrahedra and theLiO4 tetrahedra. Their respective unit cells are shown as narrow lines.
four-fold axis is created, leading to a corrugated layer structure (see figure 48) with 11-foldrather than 12-fold co-ordination14. Half of the tet and oct sites within the hcp sublatticeremain undistorted but the remainder are replaced by a larger number of sites with irregularoctahedrally and tetrahedrally co-ordinated environments [660]. For each ion forming thetp sublattice it is possible to accommodate 5
4 counterions on tetrahedrally co-ordinated siteswithout face-sharing of the tetrahedra, rather than the one possible within an hcp array. Thisprocess is illustrated by the crystal structures of Li4SiO4 and Li4GeO4 [660] in which the anionarray approximates to tp. Whilst the tp array is not particularly ‘open’ (its highest packingdensity of 71.9% is only slightly less than the ideal hcp value of 74.1%), it does contain relativelylarge channels comprising sites with four-fold and six-fold co-ordination which are favourablefor high cation mobility. This is especially advantageous for Li+ which, owing to its smallsize, can be readily accommodated in the distorted tetrahedrally and octahedrally co-ordinated
14 The ideal 11-fold co-ordinated tp structure has a tetragonal unit cell, with space group P42/mnm and c/a =2/(2 +
√2) = 0.5858. The lattice is formed by filling the 4( f ) sites at x, x, 0, etc with x = 1 − √
2/2 = 0.2929[659]. The locations of the various interstices are given elsewhere [660].
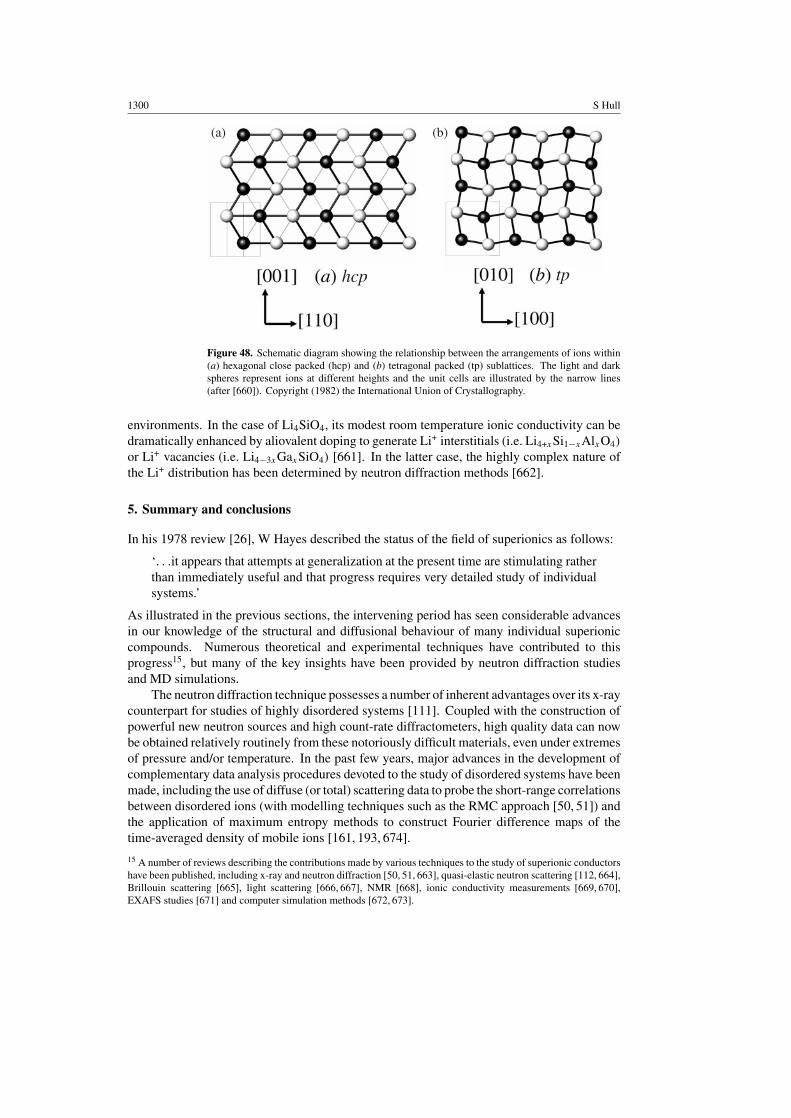
1300 S Hull
(a) (b)
hcp tp
Figure 48. Schematic diagram showing the relationship between the arrangements of ions within(a) hexagonal close packed (hcp) and (b) tetragonal packed (tp) sublattices. The light and darkspheres represent ions at different heights and the unit cells are illustrated by the narrow lines(after [660]). Copyright (1982) the International Union of Crystallography.
environments. In the case of Li4SiO4, its modest room temperature ionic conductivity can bedramatically enhanced by aliovalent doping to generate Li+ interstitials (i.e. Li4+xSi1−xAlxO4)
or Li+ vacancies (i.e. Li4−3xGaxSiO4) [661]. In the latter case, the highly complex nature ofthe Li+ distribution has been determined by neutron diffraction methods [662].
5. Summary and conclusions
In his 1978 review [26], W Hayes described the status of the field of superionics as follows:
‘. . .it appears that attempts at generalization at the present time are stimulating ratherthan immediately useful and that progress requires very detailed study of individualsystems.’
As illustrated in the previous sections, the intervening period has seen considerable advancesin our knowledge of the structural and diffusional behaviour of many individual superioniccompounds. Numerous theoretical and experimental techniques have contributed to thisprogress15, but many of the key insights have been provided by neutron diffraction studiesand MD simulations.
The neutron diffraction technique possesses a number of inherent advantages over its x-raycounterpart for studies of highly disordered systems [111]. Coupled with the construction ofpowerful new neutron sources and high count-rate diffractometers, high quality data can nowbe obtained relatively routinely from these notoriously difficult materials, even under extremesof pressure and/or temperature. In the past few years, major advances in the development ofcomplementary data analysis procedures devoted to the study of disordered systems have beenmade, including the use of diffuse (or total) scattering data to probe the short-range correlationsbetween disordered ions (with modelling techniques such as the RMC approach [50, 51]) andthe application of maximum entropy methods to construct Fourier difference maps of thetime-averaged density of mobile ions [161, 193, 674].
15 A number of reviews describing the contributions made by various techniques to the study of superionic conductorshave been published, including x-ray and neutron diffraction [50, 51, 663], quasi-elastic neutron scattering [112, 664],Brillouin scattering [665], light scattering [666, 667], NMR [668], ionic conductivity measurements [669, 670],EXAFS studies [671] and computer simulation methods [672, 673].

Crystal structures and conduction processes 1301
The increased availability of high power computer hardware has facilitated the growing useof MD simulations to probe the diffusion processes at the ionic level. However, their successis critically dependent on the development of reliable potentials to describe the interionicinteractions. Whilst empirically determined potentials have proved very successful for studiesof the superionic behaviour within many compounds (such as the RVP formalism used toinvestigate cation motion within many Ag+ and Cu+ conductors and described in sections 2.1and 3.2), they tend to be specific to the particular phase being considered and not easilytransferable to different phases of the same material or its chemical derivatives. Progress inthis area clearly requires the development of ab initio interionic potentials incorporating many-body effects and based on electronic structure calculations [415, 675]. Significant progresshas recently made, particularly in revealing the role of ionic polarizability in promotingextensive ionic disorder within compounds containing cations such as Pb2+, Sn2+ and Bi3+
[80, 82, 109, 416, 462, 676]).Taking a broader view of the field of superionic conductors, some progress has been made
by both experimental [100,102,149] and computational [89,149] methods to reconcile thedifferent superionic transition mechanisms within the Ag+/Cu+ conductors and the fluorite-structured compounds (see section 2). A number of experimental observations continue tobe discussed with reference to the molten state, including anomalous features in the radialdistribution functions of CuI [142] and observations of low frequency modes in β-PbF2 [677].However, the earliest structural description of superionics as ‘a liquid electrolyte poured into acrystalline cage’ has now largely been superseded by a model of mobile ions performing hopsbetween discrete crystallographic sites. This approach is inherently oversimplistic, but has theadvantage of providing an accessible description of the structural properties of most superioniccompounds. Its value in describing the relationships between different systems has, hopefully,been demonstrated within the previous sections of this review. Nevertheless, it is clear thata consistent picture to describe the disordered structure of all superionic compounds is yet toemerge. There remains, for example, a need to rationalize the picture of the superionic state ofthe fluorite-structured compounds in terms of dynamic Frenkel clusters (section 2.3) with thecorrelated hopping mechanism used to describe the Ag+ motion within α-AgI (section 2.1).
The increasing demands for cheap, efficient and environmentally benign power sources forapplications ranging from portable electronic devices to the new generation of ‘green’ electricvehicles will continue to provide a major incentive for the development of new materials withhigh ionic conductivities. Investigations of the behaviour of these compounds at the ionic levelby both experimental and theoretical means will, of course, remain key to their understanding.The use of computational techniques to predict routes to new high conductivity phases remainsa challenging goal and, for now, the quest for new materials to meet the expanding technologicaldemands lies principally in the hands of solid state synthetic chemists.
Acknowledgments
The author is extremely grateful to W Hayes and M T Hutchings for introducing him to thestudy of superionics during his post-doctoral research position at the Clarendon and HarwellLaboratories. It is also a pleasure to thank all those who have collaborated in various aspectsof his work in this field, particularly P Berastegui, S G Eriksson, T W D Farley, J P Goff,M Hofmann, D A Keen, P A Madden and M Wilson, and to acknowledge the financial supportprovided by the UK Engineering and Physical Sciences Research Council (grants P:AK:113C2 and GR/M38711). The author also thanks M T Hutchings, G J Hyland, D A Keen,R L McGreevy, S Miyatani, E A Secco, G Szabo and A R West for their kind permissionto reproduce figures from their work in this review.

1302 S Hull
References
[1] Hooton I E and Jacobs P W M 1988 Can. J. Chem. 66 830–5[2] Mohandas K S, Sanil N and Rodriguez P 2000 Bull. Electrochem. 16 1–4[3] Faraday M 1838 Phil. Trans. R. Soc. 90[4] Derrington C E and O’Keeffe M 1973 Nature Phys. Sci. 246 44–6[5] Benz R 1975 Z. Phys. Chem. 95 25–32[6] Carr V M, Chadwick A V and Saghafian R 1978 J. Phys. C: Solid State Phys. 11 L637–41[7] Tubandt C and Lorenz E 1914 Z. Phys. Chem. 87 513–42[8] Bernasconi J, Beyeler H U, Strassler S and Alexander S 1979 Phys. Rev. Lett. 42 819–22[9] Michiue Y and Watanabe M 1999 Phys. Rev. B 59 11298–302
[10] Collin G, Boilot J P, Colomban P and Comes R 1986 Phys. Rev. B 34 5838–49[11] Collin G, Boilot J P and Comes R 1986 Phys. Rev. B 34 5850–61[12] Sata N, Eberman K, Eberl K and Maier J 2000 Nature 408 946–9[13] Liang J-J and Kung P W-C 2002 J. Mater. Res. 17 1686–91[14] Tuller H L 2000 Solid State Ion. 131 143–57[15] Schoonman J 2000 Solid State Ion. 135 5–19[16] Hayes W 1985 Contemp. Phys. 26 421–41[17] Bruce P G, Gray F M, Shi J and Vincent C A 1991 Phil. Mag. A 64 1091–9[18] Chandrasekhar V 1998 Adv. Polym. Sci. 135 139–205[19] Meyer W H 1998 Adv. Mater. 10 439–48[20] Ingram M D 1997 Current Opinion Solid State Mater. Sci. 2 399–404[21] Bunde A, Funke K and Ingram M D 1998 Solid State Ion. 105 1–13[22] Boolchand P and Bresser W J 2001 Nature 410 1070–3[23] Goodenough J B 1984 Proc. R. Soc. Lond. A 393 215–36[24] Boyce J B and Huberman B A 1979 Phys. Rep. 51 189–265[25] Chandra S 1981 Superionic Solids: Principles and Applications (Amsterdam: North-Holland)[26] Hayes W 1978 Contemp. Phys. 19 469–86[27] Salomon M and Scrosati B 1996 Gazetta Chim. Ital. 126 415–27[28] Bruce P G 1996 Phil. Trans. R. Soc. Lond. A 354 1577–94[29] Bruce P G 1997 Chem. Comm. 1817–24[30] Tarascon J-M and Armand M 2001 Nature 414 359–67[31] Minh N Q 1993 J. Am. Ceram. Soc. 76 563–88[32] Bonanos N, Knight K S and Ellis B 1995 Solid State Ion. 79 161–70[33] Kawada T and Yokohawa H 1997 Key Eng. Mater. 125–126 187–248[34] Carette L, Friedrich K A and Stimming U 2000 Chem. Phys. Chem. 1 162–93[35] Fergus J W 1997 Sensors Actuators B 42 119–30[36] Imanaka N and Adachi G 1997 J. Alloys Compounds 250 492–500[37] Burley G 1963 J. Chem. Phys. 38 2807–12[38] Wilsey R B 1921 Phil. Mag. 42 262–3[39] Jost W and Weiss K 1954 Z. Phys. Chem. Neue Folge 2 112–14[40] Strock L W 1934 Z. Phys. Chem. B 25 441–59[41] Strock L W 1936 Z. Phys. Chem. B 31 132–6[42] O’Keeffe M and Hyde B G 1976 Phil. Mag. 33 219–24[43] Hoshino S 1954 J. Phys. Soc. Japan 9 295[44] Buhrer W and Halg W 1974 Helv. Phys. Acta 47 27–9[45] Hoshino S, Sakuma T and Fujii Y 1977 Solid State Commun. 22 763–5[46] Wright A F and Fender B E F 1977 J. Phys. C: Solid State Phys. 10 2261–7[47] Cooper M J and Sakata M 1979 Acta Crystallogr. A35 989–91[48] Tsuchiya Y, Tamaki S and Waseda Y 1979 J. Phys. C: Solid State Phys. 12 5361–9[49] Cava R J, Reidinger F and Wuensch B J 1977 Solid State Commun. 24 411–16[50] Nield V M and Keen D A 2000 Diffuse Neutron Scattering from Crystalline Materials (Oxford: Oxford
University Press)[51] McGreevy R L 2001 J. Phys.: Condens. Matter 13 R877–913[52] Nield V M, Keen D A, Hayes W and McGreevy R L 1993 Solid State Ion. 66 247–58[53] Cava R J, Fleming R M and Rietman E A 1983 Solid State Ion. 9–10 1347–52[54] Keen D A, Nield V M and McGreevy R L 1994 J. Appl. Cryst. 27 393–8[55] Boyce J B, Hayes T M, Stutius W and Mikkelsen J C Jr 1977 Phys. Rev. Lett. 38 1362–5

Crystal structures and conduction processes 1303
[56] Hayes T M, Boyce J B and Beeby J L 1978 J. Phys. C: Solid State Phys. 11 2931–7[57] Boyce J B, Hayes T M and Mikkelsen J C Jr 1981 Phys. Rev. B 23 2876–96[58] Schommers W 1977 Phys. Rev. Lett. 38 1536–9[59] Vashishta P and Rahman A 1978 Phys. Rev. Lett. 40 1337–40[60] Parrinello M, Rahman A and Vashishta P 1983 Phys. Rev. Lett. 50 1073–6[61] Nield V M and Hayes W 1995 Defect Diffus. Forum 125–126 37–64[62] Aniya M 1994 Solid State Ion. 70–71 673–7[63] Rakitin A and Kobayashi M 1996 Phys. Rev. B 53 3088–94[64] Kowada Y, Yamada Y, Tatsumisago M, Minami T and Adachi H 2000 Solid State Ion. 136–137 393–7[65] Reau J-M and Grannec J 1985 Inorganic Solid Fluorides: Chemistry and Physics ed P Hagenmuller (London:
Academic) 423–67[66] Shannon R D 1976 Acta Crystallogr. A 32 751–67[67] Derrington C E, Lindner A and O’Keeffe M 1975 J. Solid State Chem. 15 171–4[68] Catlow C R A and Norgett M J 1973 J. Phys. C: Solid State Phys. 6 1325–39[69] Hodby J W 1974 Crystals with the Fluorite Structure ed W Hayes (Oxford: Clarendon) pp 1–42[70] Schroter W and Nolting J 1980 J. Phys. Coll. C6 41 20–3[71] Catlow C R A, Comins J D, Germano F A, Harley R T and Hayes W 1978 J. Phys. C: Solid State Phys. 11
3197–212[72] Dickens M H, Hayes W, Hutchings M T and Kleppmann W G 1979 J. Phys. C: Solid State Phys. 12
17–25[73] Chadwick A V 1983 Solid State Ion. 8 209–20[74] Shapiro S M and Reidinger F 1979 Physics of superionic conductors Topics in Current Physics vol 15,
ed M B Salamon (Berlin: Springer) pp 45–75[75] Koto K, Schulz H and Huggins R A 1980 Solid State Ion. 1 355–65[76] Dickens M H, Hayes W, Hutchings M T and Smith C 1982 J. Phys. C: Solid State Phys. 15 4043–60[77] Hutchings M T, Clausen K, Dickens M H, Hayes W, Kjems J K, Schnabel P G and Smith C 1984 J. Phys. C:
Solid State Phys. 17 3903–40[78] Goff J P, Hayes W, Hull S and Hutchings M T 1991 J. Phys.: Condens. Matter 3 3677–87[79] Walker A B, Dixon M and Gillan M J 1982 J. Phys. C: Solid State Phys. 15 4061–73[80] Castiglione M J, Wilson M and Madden P A 1999 J. Phys.: Condens. Matter 11 9009–24[81] Zimmer F, Ballone P, Parrinello M and Maier J 2000 Solid State Ion. 127 277–84[82] Castiglione M J and Madden P A 2001 J. Phys.: Condens. Matter 13 9963–83[83] Wyckoff R W G 1982 Crystal Structures vol 1 (Malabar, Fl: Krieger)[84] Lidiard A B 1974 Crystals with the Fluorite Structure ed W Hayes (Oxford: Clarendon) pp 101–84[85] Gillan M J and Richardson D D 1979 J. Phys. C: Solid State Phys. 12 L61–5[86] Catlow C R A and Hayes W 1982 J. Phys. C: Solid State Phys. 15 L9–13[87] Roberts R B and White G K 1986 J. Phys. C: Solid State Phys. 19 7167–72[88] Dickman R 2001 Phys. Rev. E 64 016124[89] Hainovsky N and Maier J 1995 Phys. Rev. B 51 15789–97[90] Ishii T and Kamishima O 2001 J. Phys. Soc. Japan 70 159–66[91] Zimmer F, Ballone P, Maier J and Parrinello M 1997 Ber. Bunsenges. Phys. Chem. 101 1333–8[92] Zimmer F, Ballone P, Maier J and Parrinello M 2000 J. Chem. Phys. 112 6416–23[93] Mellander B E, Bowling J E and Baranowski B 1980 Phys. Scr. 22 541–4[94] Keen D A and Hull S 1993 J. Phys.: Condens. Matter 5 23–32[95] Wilson M and Madden P A 2002 J. Phys.: Condens. Matter 14 4629–43[96] Wilson M, Hutchinson F and Madden P A 2002 Phys. Rev. B 65 094109[97] Mellander B-E 1982 Phys. Rev. B 26 5886–96[98] Tallon J L 1988 Phys. Rev. B 38 9069–79[99] Rains C A, Ray J R and Vashishta P 1991 Phys. Rev. B 44 9228–39
[100] Keen D A, Hull S, Hayes W and Gardner N J G 1996 Phys. Rev. Lett. 77 4914–17[101] Portella K F, Rattmann K R, de Souza G P, Garcia C M, Cantao M P and Muccillo R 2000 J. Mater. Sci. 35
3263–8[102] Hull S and Keen D A 1998 Phys. Rev. B 58 14837–44[103] Samara G A 1979 J. Phys. Chem. Solids 40 509–22[104] Klement W Jr 1976 J. Phys. C: Solid State Phys. 9 L333–5[105] Klement W Jr and Cohen L H 1979 J. Electrochem. Soc. 126 1403–5[106] Melo F E A, Garrett K W, Mendes-Filho J and Moreira J E 1979 Solid State Commun. 31 29–33[107] Wang F and Grey C P 1995 J. Am. Chem. Soc. 117 6637–8

1304 S Hull
[108] Wang F and Grey C P 1998 J. Am. Chem. Soc. 120 970–80[109] Castiglione M J, Wilson M, Madden P A and Grey C P 2001 J. Phys.: Condens. Matter 13 51–66[110] Schulz H 1982 Ann. Rev. Mater. Sci. 12 351–76[111] Wuensch B J 1993 Mater. Sci. Eng. B 18 186–200[112] Funke K 1991 Phil. Mag. A 64 1025–103[113] Funke K 1995 Z. Phys. Chem. 188 243–57[114] Funke K, Banhatti R D, Bruckner S, Cramer C, Krieger C, Mandanici A, Martiny C and Ross I 2002 Phys.
Chem. Chem. Phys. 4 3155–67[115] Cava R J, Reidinger F and Wuensch B J 1981 Solid State Ion. 5 501–4[116] Oliveria M, McMullen R K and Wuensch B J 1988 Solid State Ion. 28–30 1332–7[117] Yamamoto K and Kashida S 1991 Solid State Ion. 48 241–8[118] Bougnot J, Guastavino F, Luquet H and Sodini D 1970 Mater. Res. Bull. 5 763–8[119] Asadov Y G, Rustamova L V, Gasimov G B, Jafarov K M and Babajev A G 1992 Phase Transit. 38 247–59[120] Yakshibaev R A, Mukhamadeeva N N and Almukhametov R F 1988 Phys. Status Solidi a 108 135–41[121] Vouroutzis N and Manolikas C 1989 Phys. Status Solidi a 111 491–7[122] Funke K, Lauxtermann T, Wilmer D and Bennington S M 1995 Z. Naturf. A 50 509–20[123] Nield V M, Keen D A, Hayes W and McGreevy R L 1992 J. Phys.: Condens. Matter 4 6703–14[124] Andreoni W and Tosi M P 1983 Solid State Ion. 11 49–55[125] Cain L S and Hu G 2001 Phys. Rev. B 64 104104[126] Altorfer F, Graneli B, Fischer P and Buhrer W 1994 J. Phys.: Condens. Matter 6 9949–62[127] Keen D A and Hull S 1995 J. Phys.: Condens. Matter 7 5793–804[128] Chahid A and McGreevy R L 1998 J. Phys.: Condens. Matter 10 2597–609[129] Graneli B, Dahlborg U and Fischer P 1988 Solid State Ion. 28–30 284–93[130] Buhrer W and Halg W 1977 Electrochem. Acta 22 701–4[131] Nield V M, McGreevy R L, Keen D A and Hayes W 1994 Physica B 202 159–66[132] Phillips J C 1970 Rev. Mod. Phys. 42 317–56[133] Kikuchi H, Iyetome H and Hasegawa A 1998 J. Phys.: Condens. Matter 10 11439–48[134] Miyake S, Hoshino S and Takenaka T 1952 J. Phys. Soc. Japan 7 19–24[135] Keen D A and Hull S 1994 J. Phys.: Condens. Matter 6 1637–44[136] Krug J and Sieg L 1952 Z. Naturf. A 7 369–71[137] Zheng-Johansson J X M, Ebbsjo I and McGreevy R L 1995 Solid State Ion. 82 115–22[138] Zheng-Johansson J X M and McGreevy R L 1996 Solid State Ion. 83 35–48[139] McGreevy R L, Zheng-Johansson J X M and Ebbsjo I 1996 Physica B 226 107–12[140] McGreevy R L and Zheng-Johansson J X M 1997 Solid State Ion. 95 215–20[141] Ihata K and Okazaki H 1997 J. Phys.: Condens. Matter 9 1477–92[142] Trapananti A, di Cicco A and Minicucci M 2002 Phys. Rev. B 66 014202[143] Wagner J B and Wagner C J 1957 J. Chem. Phys. 26 1597–601[144] Boyce J B and Huberman B A 1977 Solid State Commun. 21 31–5[145] Burns G, Dacol F H and Shafer M W 1977 Solid State Commun. 24 753–7[146] Vashishta P and Rahman A 1979 Fast Ion Transport in Solids ed P Vashishta et al (New York: Elsevier/North-
Holland) pp 527–33[147] Salamon M B 1979 Physics of superionic conductors Topics in Current Physics vol 15, ed M B Salamon
(Berlin: Springer) pp 175–99[148] Hull S, Keen D A, Hayes W and Gardner N J G 1998 J. Phys.: Condens. Matter 10 10941–54[149] Keen D A, Hull S, Berastegui P, Barnes A C, Crichton W A, Madden P A, Tucker M G and Wilson M 2003
Phys. Rev. B 68 014117[150] Aniya M 1992 Solid State Ion. 50 125–9[151] Rapoport E and Pistorius C W F T 1968 Phys. Rev. 172 838–47[152] Hull S and Keen D A 1996 J. Phys.: Condens. Matter 8 6191–8[153] Sadanaga R and Sueno S 1967 Miner. J. Japan 5 124–43[154] Wiegers G A 1971 Am. Miner. 56 1882–8[155] van der Lee A and de Boer J L 1993 Acta Crystallogr. C49 1444–6[156] Cava R J, Reidinger F and Wuensch B J 1980 J. Solid State Chem. 31 69–80[157] Cava R J and McWhan D B 1980 Phys. Rev. Lett. 45 2046–50[158] Grier B H, Shapiro S M and Cava R J 1984 Phys. Rev. B 29 3810–14[159] Schneider J and Schulz H 1993 Z. Kristallogr. 203 1–15[160] Keen D A and Hull S 1998 J. Phys.: Condens. Matter 10 8217–34[161] Hull S, Keen D A, Sivia D S, Madden P A and Wilson M 2002 J. Phys.: Condens. Matter 14 L9–17

Crystal structures and conduction processes 1305
[162] Vashishta P, Ebbsjo I, Dejus R and Skold K 1985 J. Phys. C: Solid State Phys. 18 L291–6[163] Ebbsjo I, Vashishta P, Dejus R and Skold K 1987 J. Phys. C: Solid State Phys. 20 L441–7[164] Rino J P, Hornos Y M M, Antonio G A, Ebbsjo I, Kalia R K and Vashishta P 1988 J. Chem. Phys. 89
7542–55[165] Tachibana F, Kobayashi M and Okazaki H 1988 Solid State Ion. 28–30 41–5[166] Rino J P, Hornos Y M M, Antonio G A, Ebbsjo I, Kalia R K and Vashishta P 1989 Solid State Ion. 32–33
968–73[167] Shimojo F and Okazaki H 1991 J. Phys. Soc. Japan 60 3745–53[168] Shimojo F and Okazaki H 1992 J. Phys. Soc. Japan 61 4465–73[169] Shimojo F and Okazaki H 1993 J. Phys.: Condens. Matter 5 3405–16[170] Kobayashi M 1990 Solid State Ion. 39 121–49[171] Miyatani S 1981 J. Phys. Soc. Japan 50 3415–18[172] Burley G 1967 Acta Crystallogr. 23 1–5[173] Szabo G 1986 J. Phys. C: Solid State Phys. 19 3775–87[174] Szabo G and Kertesz J 1986 J. Phys. C: Solid State Phys. 19 L273–7[175] O’Sullivan K, Chiarotti G and Madden P A 1991 Phys. Rev. B 43 13536–48[176] Madden P A, O’Sullivan K F and Chiarotti G 1992 Phys. Rev. B 45 10206–12[177] Seok C and Oxtoby D W 1997 Phys. Rev. B 56 11485–92[178] Seok C and Oxtoby D W 1998 Phys. Rev. B 58 5146–8[179] Tatsumisago M, Shinkuma Y and Minami T 1991 Nature 354 217–18[180] Saito T, Torata N, Tatsumisago M and Minami T 1995 J. Phys. Chem. 99 10691–93[181] Minami T, Saito T and Tatsumisago M 1996 Solid State Ion. 86–88 415–20[182] Hanaya M, Nakayama M, Oguni M, Tatsumisago M, Saito T and Minami T 1993 Solid State Commun. 87
585–8[183] Kusakabe M, Shirakawa Y, Tamaki S and Ito Y 1995 J. Phys. Soc. Japan 64 170–6[184] Shahi K and Wagner J B Jr 1981 Phys. Rev. B 23 6417–21[185] Bradley J N and Greene P D 1966 Trans. Faraday Soc. 62 2069–75[186] Bradley J N and Greene P D 1967 Trans. Faraday Soc. 63 424–30[187] Kanno R, Takeda K, Masuyama Y, Yamamoto O and Takahashi T 1983 Solid State Ion. 11 221–6[188] Yamamoto O 1993 Fast-Ion Transport in Solids (NATO ASI Series E) vol 250, ed B Scrosati et al (Dordrecht:
Kluwer) pp 203–11[189] Bradley J N and Greene P D 1967 Trans. Faraday Soc. 63 2516–21[190] Geller S 1967 Science 157 310–12[191] Kuhs W F 1983 Acta Crystallogr. A 39 148–58[192] Wilmer D, Funke K, Kloidt T and Carlile C J 1991 Ber. Bunsenges. Phys. Chem. 95 1137–9[193] Hull S, Keen D A, Sivia D S and Berastegui P 2002 J. Solid State Chem. 165 363–71[194] Owens B B, Patel B K, Skarstad P M and Warburton D L 1983 Solid State Ion. 9–10 1241–6[195] Owens B B and Bottelberghe J R 1993 Solid State Ion. 62 243–9[196] Geller S, Akridge J R and Wilber S A 1979 Phys. Rev. B 19 5396–402[197] Kanno R, Ohno K, Kawamoto Y, Takeda Y, Yamamoto O, Kamiyama T, Asano H, Izumi F and Kondo S 1993
J. Solid State Chem. 102 79–92[198] Andreoni W 1983 Il Nuovo Cimento 2D 1664–1673[199] Brightwell J W, Buckley C N, Miller L S and Ray B 1983 Phys. Status Solidi a 76 391–8[200] Brightwell J W, Buckley C N, Hollyoak R C and Ray B 1984 J. Mater. Sci. Lett. 3 443–6[201] Otsubo Y, Nitta A, Iwata Y and Ueki A 1966 J. Chem. Soc. Japan: Indust. Chem. 69 1716–21[202] Blachnik R and Stoter U 1989 Thermochim. Acta 145 93–9[203] Blachnik R and Stoter U 1987 Thermochim. Acta 112 47–50[204] Brightwell J W, Buckley C N and Ray B 1985 Solid State Ion. 15 61–3[205] Blachnik R and Stoter U 1989 Thermochim. Acta 141 293–6[206] Hull S, Keen D A and Berastegui P 2002 J. Phys.: Condens. Matter 14 13579–96[207] Hull S and Keen D A 2000 J. Phys.: Condens. Matter 12 3751–65[208] Hull S and Keen D A 2001 J. Phys.: Condens. Matter 13 5597–610[209] Hull S, Keen D A and Berastegui P 2002 Solid State Ion. 147 97–106[210] Armstrong R D, Bulmer R S and Dickinson T 1973 J. Solid State Chem. 8 219–28[211] Blachnik R and Dreisbach H A 1985 J. Solid State Chem. 60 115–22[212] Reuter B and Hardel K 1965 Z. Anorg. Allg. Chem. 340 158–67[213] Reuter B and Hardel K 1965 Z. Anorg. Allg. Chem. 340 168–80[214] Reuter B and Hardel K 1966 Ber. Bunsenges. 70 82–6

1306 S Hull
[215] Perenthaler E and Schulz H 1981 Solid State Ion. 2 43–6[216] Didisheim J-J, McMullan R K and Wuensch B J 1986 Solid State Ion. 18–19 1150–62[217] Cho N, Kikkawa S, Kanamaru F and Yoshiasa A 1994 Solid State Ion. 68 57–63[218] Hull S, Keen D A, Gardner N J G and Hayes W 2001 J. Phys.: Condens. Matter 13 2295–316[219] Hoshino S, Sakuma T and Fujii Y 1979 J. Phys. Soc. Japan 47 1252–9[220] Matsunaga S 2003 J. Phys. Soc. Japan 72 1396–402[221] Hoshino S, Shapiro S M, Fujishita H and Sakuma T 1988 J. Phys. Soc. Japan 57 4199–205[222] Chiodelli G, Magistris A and Schiraldi A 1979 Z. Phys. Chem. Neue Folge 118 177–86[223] Mitchell R H 2002 Perovskites. Modern and Ancient (Ontario: Almaz)[224] Hull S, Berastegui P, Eriksson S-G and Gardner N J G 1998 J. Phys.: Condens. Matter 10 8429–46[225] Liang C C and Joshi A V 1975 J. Electrochem. Soc. 122 466–70[226] Kennedy J H and Miles R C 1976 J. Electrochem. Soc. 123 47–51[227] Hull S and Berastegui P 1999 J. Phys.: Condens. Matter 11 5257–72[228] Hyde B G and Andersson S 1989 Inorganic Crystal Structures (New York: Wiley)[229] Goldschmidt V M 1926 Naturwissenschaften 14 477–85[230] Woodward P M 1997 Acta Crystallogr. B 53 44–66[231] Woodward P M 1997 Acta Crystallogr. B 53 32–43[232] Berastegui P, Hull S and Eriksson S-G 2001 J. Phys.: Condens. Matter 13 5077–88[233] Keen D A and Hull S 2001 J. Phys.: Condens. Matter 13 L343–47[234] Glazer A M 1972 Acta Crystallogr. B 28 3384–92[235] Howard C J and Stokes H T 1998 Acta Crystallogr. B 54 782–9[236] Wood I G, Knight K S, Price G D and Stuart J A 2002 J. Appl. Cryst. 35 291–5[237] Street J N, Wood I G, Knight K S and Price G D 1997 J. Phys.: Condens. Matter 9 L647–55[238] Thomas N W 1996 Acta Crystallogr. B 52 16–31[239] O’Keeffe M and Bovin J-O 1979 Science 206 599–600[240] Cheeseman P A and Angell C A 1981 Solid State Ion. 5 597–600[241] Andersen N H, Kjems J K and Hayes W 1985 Solid State Ion. 17 143–5[242] Chadwick A V, Strange J H, Ranieri G A and Terenzi M 1983 Solid State Ion. 9–10 555–8[243] Zhou L X, Hardy J R and Cao H Z 1997 Geophys. Res. Lett. 24 747–50[244] Watson G W, Parker S C and Wall A 1992 J. Phys.: Condens. Matter 4 2097–108[245] Watson G W, Wall A and Parker S C 1995 Phys. Earth Planet. Inter. 89 137–44[246] Boyett R E, Ford M G and Cox P A 1995 Solid State Ion. 81 61–8[247] Poirier J P, Peyronneau J, Gesland J Y and Brebec G 1983 Phys. Earth Planet. Inter. 32 273–87[248] Ridou C, Rousseau M, Pernot B and Bouillot J 1986 J. Phys. C: Solid State Phys. 19 4847–53[249] Liu L-G and Bassett W A 1986 Elements, Oxides and Silicates. High Pressure Phases with Implications for
the Earth’s Interior (Oxford: Oxford University Press)[250] Yagi T, Mao H-K and Bell P M 1978 Phys. Chem. Miner. 3 97–110[251] Cahn R W 1984 Nature 308 493–4[252] Achache J, le Mouel J L and Courtillot V 1981 Geophys. J. R. Astron. Soc. 65 579–601[253] Parkinson W D 1988 Surv. Geophys. 9 235–43[254] Li X and Jeanloz R 1991 Nature 350 332–4[255] Li X and Jeanloz R 1990 J. Geophys. Res. 95 5067–78[256] Matsui M and Price G D 1991 Nature 351 735–7[257] Kapusta B and Guillope M 1988 Phil. Mag. A 58 809–16[258] Wall A and Price G D 1989 Phys. Earth Planet. Inter. 58 192–204[259] Chaplot S L, Choudhury N and Rao K R 1998 Am. Miner. 83 937–41[260] Wentzcovitch R M, Martins J L and Price G D 1993 Phys. Rev. Lett. 70 3947–50[261] Fiquet G, Dewaele A, Andrault D, Kunz M and le Bihan T 2000 Geophys. Res. Lett. 27 21–4[262] Shim S-H, Duffy T S and Shen G 2001 Science 293 2437–40[263] Kilner J A and Brook R J 1982 Solid State Ion. 6 237–52[264] Shlichta P J 1988 Solid State Ion. 28–30 480–7[265] Cook R L and Sammells A F 1991 Solid State Ion. 45 311–21[266] Sammells A F, Cook R L, White J H, Osborne J J and MacDuff R C 1992 Solid State Ion. 52 111–23[267] Nomura K and Tanase S 1997 Solid State Ion. 98 229–36[268] Hayashi H, Inaba H, Matsuyama M, Lan N G, Dokiya M and Tagawa H 1999 Solid State Ion. 122 1–15[269] Boivin J-C 2001 Int. J. Inorg. Mater. 3 1261–1266[270] Kilner J A 1981 Phil. Mag. A 43 1473–82[271] Cherry M, Islam M S and Catlow C R A 1995 J. Solid State Chem. 118 125–32

Crystal structures and conduction processes 1307
[272] Islam M S 2002 Solid State Ion. 154–155 75–85[273] Ishihara T, Matsuda H and Takita Y 1994 J. Am. Chem. Soc. 116 3801–3[274] Iwahara H, Yajima T and Ushida H 1994 Solid State Ion. 70–71 267–71[275] Iwahara H 1992 Solid State Ion. 52 99–104[276] Bonanos N 2001 Solid State Ion. 145 265–74[277] Nowick A S and Du Y 1995 Solid State Ion. 77 137–46[278] Iwahara H 1996 Solid State Ion. 86–88 9–15[279] Kreuer K D 1996 Chem. Mater. 8 610–41[280] Marti W, Fischer P, Altorfer F, Scheel H J and Tadin M 1994 J. Phys.: Condens. Matter 6 127–35[281] Sanjuan M L, Orera V M, Merino R I and Blasco J 1998 J. Phys.: Condens. Matter 10 11687–702[282] Slater P R, Irvine J T S, Ishihara T and Takita Y 1998 J. Solid State Chem. 139 135–43[283] Howard C J and Kennedy B J 1999 J. Phys.: Condens. Matter 11 3229–36[284] Lerch M, Boysen H and Hansen T 2001 J. Phys. Chem. Solids 62 445–55[285] Boysen H, Lerch M, Gilles R, Krimmer B and Tobbens D M 2002 Appl. Phys. A 74 (Suppl.) S966–8[286] Knight K S 1994 Solid State Ion. 74 109–17[287] Genet F, Loridant S, Ritter C and Lucazeau G 1999 J. Phys. Chem. Solids 60 2009–21[288] Knight K S 2001 Solid State Ion. 145 273–94[289] Bonanos N, Ellis B, Knight K S and Mahmood M N 1989 Solid State Ion. 35 179–88[290] Knight K S, Soar M and Bonanos N 1992 J. Mater. Chem. 2 709–12[291] Scherban T, Villeneuve R, Abello L and Lucazeau G 1993 J. Raman Spectrosc. 24 805–14[292] Knight K S and Bonanos N 1995 Solid State Ion. 77 189–94[293] Huang K, Tichy R S and Goodenough J B 1998 J. Am. Ceram. Soc. 81 2565–75[294] Huang K, Tichy R S and Goodenough J B 1998 J. Am. Ceram. Soc. 81 2576–80[295] Huang K, Tichy R S and Goodenough J B 1998 J. Am. Ceram. Soc. 81 2581–5[296] Lybye D, Poulsen F W and Mogensen M 2000 Solid State Ion. 128 91–103[297] Khan M S, Islam M S and Bates D R 1998 J. Phys. Chem. B 102 3099–104[298] de Souza R A and Maier J 2003 Phys. Chem. Chem. Phys. 5 740–8[299] Goodenough J B 1997 Solid State Ion. 94 17–25[300] Koruda K, Hashimoto I, Adachi K, Akikusa J, Tamou Y, Komada N, Ishihara T and Takita Y 2000 Solid State
Ion. 132 199–208[301] Anderson M T, Vaughey J T and Poeppelmeier K R 1993 Chem. Mater. 5 151–65[302] Greaves C, Jacobson A J, Tofield B C and Fender B E F 1975 Acta Crystallogr. B 31 641–6[303] Goodenough J B, Ruiz-Diaz J E and Zhen Y S 1990 Solid State Ion. 44 21–31[304] Berastegui P, Hull S, Garcıa-Garcıa F J and Eriksson S-G 2002 J. Solid State Chem. 164 119–30[305] Gregory D H and Weller M T 1993 J. Solid State Chem. 107 134–48[306] Adler S B, Reimer J A, Baltisberger J and Werner U 1994 J. Am. Ceram. Soc. 116 675–81[307] Speakman S A, Richardson J W, Mitchell B J and Misture S T 2002 Solid State Ion. 149 247–59[308] Hashimoto T, Ueda Y, Yoshinaga M, Komazaki K, Asaoka K and Wang S R 2002 J. Electrochem. Soc. 149
A1381–4[309] Istomin S Y, Koutcenko V A, Antipov E V, Svensson G and Attfield J P 2002 J. Mater. Chem. 12 2352–5[310] Adler S, Russek S, Reimer J, Fendorf M, Stacy A, Huang Q, Santoro A, Lynn J, Baltisberger J and Werner U
1994 Solid State Ion. 68 193–211[311] Graia T, Conflant P, Boivin J C and Thomas D 1986 Solid State Ion. 18–19 751–5[312] Graia T, Conflant P, Nowogrocki G, Boivin J C and Thomas D 1986 J. Solid State Chem. 63 160–5[313] Michel C, Pelloquin D, Hervieu M, Raveau B, Abbattista F and Vallino M 1994 J. Solid State Chem.
109 122–6[314] Esmaeilzadeh S, Berastegui P, Grins J and Rundlof H 2000 J. Solid State Chem. 152 435–40[315] Nikolaichik V I, Amelinckx S, Klinkova L A, Barkovskii N V, Lebedev O I and van Tendeloo G 2002 J. Solid
State Chem. 163 44–64[316] Ruddlesden S N and Popper P 1957 Acta Crystallogr. 10 538–9[317] Ruddlesden S N and Popper P 1958 Acta Crystallogr. 11 54–5[318] Aurivillius B 1949 Ark. Kemi. 1 463–80[319] Aurivillius B 1949 Ark. Kemi. 1 499–512[320] Aurivillius B 1950 Ark. Kemi. 2 519–27[321] Pirovano C, Islam M S, Vannier R N, Nowogrocki G and Mairesse G 2001 Solid State Ion. 140 115–23[322] Knight K S 1992 Miner. Mag. 56 399–409[323] Abraham F, Debreuille-Gresse M F, Mairesse G and Nowogrocki G 1988 Solid State Ion. 28–30 529–32[324] Vannier R N, Pernot B, Anne M, Isnard O, Nowogrocki G and Mairesse G 2003 Solid State Ion. 157 147–53

1308 S Hull
[325] Vannier R N, Mairesse G, Abraham F, Nowogrocki G, Pernot E, Anne M, Bacmann M, Strobel P and Fouletier J1995 Solid State Ion. 78 183–9
[326] Joubert O, Jouanneaux A and Ganne M 1994 Mater. Res. Bull. 29 175–84[327] Touboul M, Lokaj J, Tessier L, Kettman V and Vrabel V 1992 Acta Crystallogr. C 48 1176–9[328] Sooryanarayana K, Guru T N Row and Varma K B R 1997 Mater. Res. Bull. 32 1651–6[329] Abraham F, Boivin J C, Mairesse G and Nowogrocki G 1990 Solid State Ion. 40–41 934–7[330] Kendall K R, Navas C, Thomas J K and zur Loye H-C 1996 Chem. Mater. 8 642–9[331] Abrahams I, Krok F and Nelstrop J A G 1996 Solid State Ion. 90 57–65[332] Abrahams I, Nelstrop J A G, Krok F and Bogusz W 1998 Solid State Ion. 110 95–101[333] Abrahams I and Krok F 2002 J. Mater. Chem. 12 3351–62[334] Kim N and Grey C P 2002 Science 297 1317–20[335] Pernot E, Anne M, Bacmann M, Strobel P, Fouletier J, Vannier R N, Mairesse G, Abraham F and Nowogrocki G
1994 Solid State Ion. 70–71 259–63[336] Krok F, Abrahams I, Bangobango D G, Bogusz W and Nelstrop J A G 1996 Solid State Ion. 86–88
261–6[337] Lazure S, Vernochet C, Vannier R N, Nowogrocki G and Mairesse G 1996 Solid State Ion. 90 117–23[338] Watanabe A and Das K 2002 J. Solid State Chem. 163 224–30[339] Huve M, Vannier R-N, Nowogrocki G, Mairesse G and van Tendeloo G 1996 J. Mater. Chem. 6 1339–45[340] O’Keeffe M and Hyde B G 1977 Acta Crystallogr. B 33 3802–13[341] Thoma R E and Brunton G D 1966 Inorg. Chem. 5 1937–9[342] Sobolev B P, Garashina L S, Federov P P, Tkachenko N L and Seiranyan K B 1974 Sov. Phys.—Crystallogr.
18 473–6[343] Lyon W G, Osborne D W, Flotow H E, Grandjean F, Hubbard W N and Johnson G K 1978 J. Chem. Phys. 69
167–73[344] Cheetham A K and Norman N 1974 Acta Chim. Scand. A 28 55–60[345] Rotereau K, Daniel P, Desert A and Gesland J Y 1998 J. Phys.: Condens. Matter 10 1431–46[346] Sobolev B P and Federov P P 1973 Sov. Phys.—Crystallogr. 18 392[347] O’Keeffe M 1973 Science 180 1276–7[348] Trnovcova V, Garashina L S, Skubla A, Federov P P, Cicka A, Krivandina E A and Sobolev B P 2003 Solid
State Ion. 157 195–201[349] Schlyter K 1952 Ark. Kemi. 5 73–82[350] Goldman M and Shen L 1966 Phys. Rev. 144 321–31[351] Cheetham A K, Fender B E F, Fuess H and Wright A F 1976 Acta Crystallogr. B 32 94–7[352] Brach I and Schulz H 1985 Solid State Ion. 15 135–8[353] Belzner A, Schulz H and Heger G 1994 Z. Kristallogr. 209 239–48[354] Muller-Bunz H and Schleid T 1999 Z. Anorg. Allg. Chem. 625 1377–83[355] Jordan W M and Catlow C R A 1987 Cryst. Latt. Def. Amorph. Mater. 15 81–7[356] Rhandour A, Reau J-M, Matar S F, Tian S B and Hagenmuller P 1985 Mater. Res. Bull. 20 1309–27[357] Privalov A F, Vieth H-M and Murin I V 1989 J. Phys. Chem. Solids 50 395–8[358] Wang F and Grey C P 1997 Chem. Mater. 9 1068–70[359] Schoonman J, Oversluizen G and Wapenaar K E D 1980 Solid State Ion. 1 211–21[360] Abe M and Uchino K 1974 Mater. Res. Bull. 9 147–56[361] Nadiri A, le Flem G and Dalmas C 1988 J. Solid State Chem. 73 338–47[362] Howard C J, Luca V and Knight K S 2002 J. Phys.: Condens. Matter 14 377–87[363] Inaguma Y, Liquan C, Itoh M, Makamura T, Uchida T, Ikuta M and Wakihara M 1993 Solid State Commun.
86 689–93[364] Kawai H and Kuwano J 1994 J. Electrochem. Soc. 141 L78–9[365] Robertson A D, Garcia-Martin S, Coats A and West A R 1995 J. Mater. Chem. 5 1405–12[366] Bohnke O, Bohnke C and Fourquet J L 1996 Solid State Ion. 91 21–31[367] Harada Y, Ishigaki T, Kawai H and Kuwano J 1998 Solid State Ion. 108 407–13[368] Robertson A D, West A R and Richie A G 1997 Solid State Ion. 104 1–11[369] Itoh M, Inaguma Y, Jung W-H, Chen L and Nakamura T 1994 Solid State Ion. 70–71 203–7[370] Fourquet J L, Duroy H and Crosnier-Lopez M P 1996 J. Solid State Chem. 127 283–94[371] Harada Y, Hirakoso Y, Kawai H and Kuwano J 1999 Solid State Ion. 121 245–51[372] Bohnke O, Duroy H, Fourquet J-L, Ronchetti S and Mazza D 2002 Solid State Ion. 149 217–26[373] Paris M A, Sanz J, Leon C, Santamaria J, Ibarra J and Varez A 2000 Chem. Mater. 12 1694–701[374] Sanz J, Alonso J A, Varez A and Fernandez-Diaz M T 2002 J. Chem. Soc.: Dalton Trans. 1406–8[375] Ruiz A I, Lopez M L, Veiga M L and Pico C 1999 J. Solid State Chem. 148 329–32
Crystal structures and conduction processes 1309
[376] Emery J, Bohnke O, Fourquet J L, Buzare J Y, Florian P and Massiot D 2002 J. Phys.: Condens. Matter 14523–39
[377] Brown I D 2002 The Chemical Bond in Inorganic Chemistry. The Bond Valence Method (Oxford: OxfordUniversity Press)
[378] Mazza D, Ronchetti S, Bohnke O, Duroy H and Fourquet J L 2002 Solid State Ion. 149 81–8[379] Inaguma Y, Yu J, Katsumata T and Itoh M 1997 J. Ceram. Soc. Japan 105 548–50[380] Belous A G 1996 Solid State Ion. 90 193–6[381] Garcia-Martın S, Rojo J M, Tsukamoto H, Moran E and Alario-Franco M A 1999 Solid State Ion. 116 11–18[382] Torii Y, Sekiya T and Yamamoto T 1982 Mater. Res. Bull. 17 727–32[383] Latie L, Villeneuve G, Conte D and le Flem G 1984 J. Solid State Chem. 51 293–9[384] Kawakami Y, Ikuta H and Wakihara M 1998 J. Solid State Electrochem. 2 206–10[385] Garcia-Martın S and Alario-Franco M A 1999 J. Solid State Chem. 148 93–9[386] Salje E K H, Rehmann S, Pobell F, Morris D, Knight K S, Herrmannsdorfer T and Dove M T 1997 J. Phys.:
Condens. Matter 9 6563–77[387] Locherer K R, Swainson I P and Salje E K H 1999 J. Phys.: Condens. Matter 11 4143–56[388] Locherer K R, Swainson I P and Salje E K H 1999 J. Phys.: Condens. Matter 11 6737–56[389] Vogt T, Woodward P M and Hunter B A 1999 J. Solid State Chem. 144 209–15[390] Granqvist C G 1999 Electrochem. Acta 44 3005–15[391] Zhong Q, Dahn J R and Colbow K 1992 Phys. Rev. B 46 2554–60[392] Wiseman P J and Dickens P G 1976 J. Solid State Chem. 17 91–100[393] Flerov I N, Gorev M V, Aleksandrov K S, Tressaud A, Grannec J and Couzi M 1998 Mater. Sci. Eng. R 24
81–151[394] Bock O and Muller U 2002 Acta Crystallogr. B 58 594–606[395] Flerov I N, Gorev M V, Grannec J and Tressaud A 2002 J. Fluorine Chem. 116 9–14[396] Yang H, Ghose S and Hatch D M 1993 Phys. Chem. Miner. 19 528–44[397] Steward E G and Rooksby H P 1953 Acta Crystallogr. 6 49–52[398] Holm J L 1965 Acta Chim. Scand. 19 261–3[399] Landon G J and Ubbelohde A R 1957 Proc. R. Soc. Lond. A 240 160–72[400] Spearing D R, Stebbins J F and Farnan I 1994 Phys. Chem. Miner. 21 373–86[401] Castiglione M J 2000 PhD Thesis University of Oxford[402] Jacoboni C, Leble A and Rousseau J J 1981 J. Solid State Chem. 36 297–304[403] van Hove 1954 L Phys. Rev. 95 249–62[404] Chudley C T and Elliott R J 1961 Proc. R. Soc. 77 353–61[405] Wolf D 1977 Solid State Commun. 23 853–8[406] Dickens M H, Hayes W, Schnabel P, Hutchings M T, Lechner R E and Renker B 1983 J. Phys. C: Solid State
Phys. 16 L1–6[407] Gillan M J 1986 J. Phys. C: Solid State Phys. 19 3391–411[408] Gillan M J 1986 J. Phys. C: Solid State Phys. 19 3517–33[409] Lindan P J D and Gillan M J 1993 J. Phys.: Condens. Matter 5 1019–30[410] Gillan M J and Dixon M 1980 J. Phys. C: Solid State Phys. 13 1901–17[411] Dixon M and Gillan M J 1980 J. Phys. C: Solid State Phys. 13 1919–29[412] Gillan M J and Dixon M 1980 J. Phys. C: Solid State Phys. 13 L835–9[413] Gillan M J 1985 Physica B 131 157–74[414] Catlow C R A and Mackrodt W C (ed) 1982 Computer Simulation of Solids (Berlin: Springer)[415] Madden P A and Wilson M 1996 Chem. Soc. Rev. 25 339–50[416] Wilson N T, Wilson M, Madden P A and Pyper N C 1996 J. Chem. Phys. 105 11209–19[417] Reau J-M, Lucat C, Portier J, Hagenmuller P, Cot L and Vilminot S 1978 Mater. Res. Bull. 13 877–82[418] Wakagi A, Kuwano J, Kato M and Hanamoto H 1994 Solid State Ion. 70 601–5[419] Wakagi A and Kuwano J 1994 J. Mater. Chem. 4 973–5[420] Perez G, Vilminot S, Granier W and Cot L 1980 Mater. Res. Bull. 15 587–93[421] Collin A, Denes G, le Roux D, Madamba M C, Parris J M and Salaun A 1999 Int. J. Inorg. Mater. 1 289–301[422] Vilminot S, Perez G, Granier W and Cot L 1981 Solid State Ion. 2 87–90[423] Vilminot S, Perez G, Granier W and Cot L 1981 Solid State Ion. 2 91–4[424] Chernov S V, Moskvin A L and Murin I V 1991 Solid State Ion. 47 71–3[425] Denes G, Yu Y H, Tyliszczak T and Hitchcock A P 1991 J. Solid State Chem. 91 1–15[426] Denes G, Yu Y H, Tyliszczak T and Hitchcock A P 1993 J. Solid State Chem. 104 239–52[427] Kanno R, Ohno K, Izumi H, Kawamoto Y, Kamiyama T, Asano H and Izumi F 1994 Solid State Ion. 70–71
253–8

1310 S Hull
[428] Ito Y, Mukoyama T, Funatomi H, Yoshikado S and Tanaka T 1994 Solid State Ion. 67 301–5[429] Ito Y, Mukoyama T and Yoshikado S 1995 Solid State Ion. 80 317–20[430] Castiglione M, Madden P A, Berastegui P and Hull S in preparation[431] Durand-Le Floch M, Pannetier J and Denes G 1986 Phys. Rev. B 33 632–4[432] Chaudhuri S, Wang F and Grey C P 2002 J. Am. Chem. Soc. 124 11746–57[433] Lacorre P, Goutenoire F, Bohnke O, Retoux R and Laligant Y 2000 Nature 404 856–8[434] Lacorre P 2000 Solid State Sci. 2 755–8[435] Lucat C, Sorbe P, Portier J, Reau J-M and Hagenmuller P 1977 Mater. Res. Bull. 12 145–50[436] Matar S, Reau J-M, Lucat C, Grannec J and Hagenmuller P 1980 Mater. Res. Bull. 15 1295–301[437] Matar S, Reau J-M, Grannec J and Rabardel L 1983 J. Solid State Chem. 50 1–6[438] Matar S F, Reau J-M, Rabardel L, Grannec J and Hagenmuller P 1983 Mater. Res. Bull. 18 1485–92[439] Soubeyroux J L, Reau J-M, Matar S, Villeneuve G and Hagenmuller P 1982 Solid State Ion. 6 103–111[440] Laborde P, Villeneuve G, Reau J-M and Hagenmuller P 1986 Z. Anorg. Allg. Chem. 537 40–52[441] Cox P A, Catlow C R A and Chadwick A V 1994 J. Mater. Sci. 29 2725–33[442] Matar S F, Reau J-M, Hagenmuller P and Catlow C R A 1984 J. Solid State Chem. 52 114–23[443] Matar S F, Reau J-M, Laborde P and Rhandour A 1988 J. Phys. Chem. Solids 49 285–8[444] Pierce J W and Hong H Y-P 1973 Proc. 10th Rare Earth Research Conf. (Carefree, Arizona) pp 527–37[445] Lucat C, Campet G, Claverie J, Portier J, Reau J-M and Hagenmuller P 1976 Mater. Res. Bull. 11 167–72[446] Lucat C, Portier J, Reau J-M, Hagenmuller P and Soubeyroux J-L 1980 J. Solid State Chem. 32 279–87[447] Ito Y, Koto K, Yoshikado S and Ohachi T 1986 Solid State Ion. 18–19 1202–7[448] Reau J-M, el Omari M, Senegas J and Hagenmuller P 1989 Mater. Res. Bull. 24 1441–52[449] Reau J M, Rederov P P, Rabardel L, Matar S F and Hagenmuller P 1983 Mater. Res. Bull. 18 1235–46[450] Joshi A V and Liang C C 1977 J. Electrochem. Soc. 124 1253–7[451] el Omari M, Senegas J and Reau J-M 1997 Solid State Ion. 100 233–40[452] el Omari M, Senegas J and Reau J-M 1997 Solid State Ion. 100 241–6[453] Soubeyroux J L, Reau J-M, Matar S, Hagenmuller P and Lucat C 1981 Solid State Ion. 2 215–29[454] Reau J-M, Jun X Y, Senegas J and Hagenmuller P 1995 Solid State Ion. 78 315–31[455] Laval J P, Depierrefixe C, Frit B and Roult G 1984 J. Solid State Chem. 54 260–76[456] Senegas J, Laval J P and Frit B 1986 J. Fluorine Chem. 32 197–211[457] Reau J-M, Senegas J, el Omari M and Soubeyroux J L 1990 J. Fluorine Chem. 49 87–98[458] Rhandour A, Reau J-M and Hagenmuller P 1986 J. Solid State Chem. 61 197–202[459] Ivanov-Shits A K, Sorokin N I, Federov P P and Sobolev B P 1990 Solid State Ion. 37 125–37[460] Reau J-M and Hagenmuller P 1995 Bull. Electrochem. 11 34–46[461] Corish J, Catlow C R A, Jacobs P W M and Ong S H 1982 Phys. Rev. B 25 6425–38[462] Jiang H, Costales A, Blanco M A, Gu M, Pandey R and Gale J D 2000 Phys. Rev. B 62 803–9[463] Hull S and Wilson C C 1992 J. Solid State Chem. 100 101–14[464] Cheetham A K, Fender B E F, Steele D, Taylor R I and Willis B T M 1970 Solid State Commun. 8 171–3[465] Cheetham A K, Fender B E F and Cooper M J 1971 J. Phys. C: Solid State Phys. 4 3107–21[466] Steele D, Childs P E and Fender B E F 1972 J. Phys. C: Solid State Phys. 5 2677–88[467] Laval J P and Frit B 1983 J. Solid State Chem. 49 237–46[468] Otroshchenko L P, Aleksandrov V B, Bydanov N N, Simonov V I and Sobolev B P 1988 Sov. Phys.—Crystallogr.
33 449–51[469] Muradyan L A, Maksimov B A, Aleksandrov V B, Otroshchenko L P, Bydanov N N, Sirota M I and Simonov V I
1986 Sov. Phys.—Crystallogr. 31 390–2[470] Bendall P J, Catlow C R A and Fender B E F 1984 J. Phys. C: Solid State Phys. 17 797–814[471] Laval J P, Mikou A, Frit B and Roult G 1988 Solid State Ion. 28–30 1300–4[472] Goff J P, Hutchings M T, Hull S, Fak B and Hayes W 1992 J. Phys.: Condens. Matter 4 1433–46[473] Catlow C R A, Chadwick A V, Greaves G N and Moroney L M 1984 Nature 312 601–4[474] Catlow C R A, Chadwick A V, Corish J, Moroney L M and O’Reilly A N 1989 Phys. Rev. B 39 1897–907[475] Laval J P, Abaouz A, Frit B and le Bail A 1990 J. Solid State Chem. 85 133–43[476] Bendall P J, Catlow C R A, Corish J and Jacobs P W M 1984 J. Solid State Chem. 51 159–69[477] Wang F and Grey C P 1998 Chem. Mater. 10 3081–91[478] Bevan D J M, Greis O and Strahle J 1980 Acta Crystallogr. A 36 889–90[479] Bevan D J M and Lawton S E 1986 Acta Crystallogr. B 42 55–8[480] Golubev A M and Simonov V I 1986 Sov. Phys.—Crystallogr. 31 281–7[481] Bevan D J M, Strahle J and Greis O 1982 J. Solid State Chem. 44 75–81[482] Gettmann W and Greis O 1978 J. Solid State Chem. 26 255–63[483] Federov P P, Turkina T M, Sobolev B P, Mariani E and Svantner M 1982 Solid State Ion. 6 331–5
Crystal structures and conduction processes 1311
[484] Catlow C R A, Comins J D, Germano F A, Harley R T, Hayes W and Owen I B 1981 J. Phys. C: Solid StatePhys. 14 329–35
[485] Archer J A, Chadwick A V, Jack I R and Zeqiri B 1983 Solid State Ion. 9–10 505–10[486] Hofmann M, Hull S, McIntyre G J and Wilson C C 1997 J. Phys.: Condens. Matter 9 845–57[487] Scott H G 1975 J. Mater. Sci. 10 1527–35[488] Stubican V S, Hink R C and Ray S P 1978 J. Am. Ceram. Soc. 61 17–21[489] Teufer G 1962 Acta Crystallogr. 15 1187[490] Howard C J, Hill R J and Reichert B E 1988 Acta Crystallogr. B 44 116–20[491] Etsell T H, Spyridon N and Flengas S N 1970 Chem. Rev. 70 339–76[492] Birkby I and Stevens R 1996 Key Eng. Mater. 122–124 527–52[493] Solier J D, Cachadina I and Dominguez-Rodriguez A 1993 Phys. Rev. B 48 3704–12[494] Leon C, Lucıa M L and Santamarıa J 1997 Phys. Rev. B 55 882–7[495] Perry C H and Feinberg A 1980 Solid State Commun. 36 519–22[496] Subbarao E C and Ramakrishnan T V 1979 Fast Ion Transport in Solids ed P Vashishta et al (New York:
Elsevier/North-Holland) 653–6[497] Nakamura A and Wagner J B Jr 1986 J. Electrochem. Soc. 133 1542–8[498] Arachi Y, Sakai H, Yamamoto O, Takeda Y and Imanishai N 1999 Solid State Ion. 121 133–9[499] Khanna R, Welberry T R and Withers R L 1993 J. Phys.: Condens. Matter 5 4251–62[500] Meyer M and Nicoloso N 1997 Ber. Bunsenges. Phys. Chem. 101 1393–8[501] Meyer M, Nicoloso N and Jaenisch V 1997 Phys. Rev. B 56 5961–6[502] Shimojo F, Okabe T, Tachibana F, Kobayashi M and Okazaki H 1992 J. Phys. Soc. Japan 61 2848–57[503] Shimojo F and Okazaki H 1992 J. Phys. Soc. Japan 61 4106–18[504] Brinkman H W, Briels W J and Verweij H 1995 Chem. Phys. Lett. 247 386–90[505] Li X and Hafskjold B 1995 J. Phys.: Condens. Matter 7 1255–71[506] Sawaguchi N and Ogawa H 2000 Solid State Ion. 128 183–9[507] Catlow C R A 1984 Solid State Ion. 12 67–73[508] Mackrodt W C and Woodrow P M 1986 J. Am. Ceram. Soc. 69 277–80[509] Stefanovich E V, Shluger A L and Catlow C R A 1994 Phys. Rev. B 49 11560–71[510] Khan M S, Islam M S and Bates D R 1998 J. Mater. Chem. 8 2299–307[511] Stapper G, Bernasconi M, Nicoloso N and Parrinello M 1999 Phys. Rev. B 59 797–810[512] Zacate M O, Minervini L, Bradfield D J, Grimes R W and Sickafus K E 2000 Solid State Ion. 128 243–54[513] Bogicevic A, Wolverton C, Crosbie G M and Stechel E B 2001 Phys. Rev. B 64 014106[514] Hohnke D K 1981 Solid State Ion. 5 531–4[515] Schoenlein L H, Hobbs L W and Heuer A H 1980 J. Appl. Cryst. 13 375–9[516] Suzuki S, Tanaka M and Ishigame M 1985 Japan. J. Appl. Phys. 24 401–10[517] Suzuki S, Tanaka M and Ishigame M 1987 J. Phys. C: Solid State Phys. 20 2963–72[518] Suzuki S, Tanaka M and Ishigame M 1987 Japan. J. Appl. Phys. 26 1983–7[519] McClellan K, Xiao J S-Q, Lagerlof K P D and Heuer A H 1994 Phil. Mag. A 70 185–200[520] Dai Z R, Wang Z L, Chen Y R, Wu H Z and Liu W X 1996 Phil. Mag. A 73 415–30[521] Dai Z R, Wang Z L and Liu W X 1996 Phil. Mag. A 73 1685–98[522] Gallardo-Lopez A, Martınez-Fernandez J, Domınguez-Rodrıguez A and Ernst F 2001 Phil. Mag. A 81 1675–89[523] Morinaga M, Cohen J B and Faber J Jr 1979 Acta Crystallogr. A 35 789–95[524] Morinaga M, Cohen J B and Faber J Jr 1980 Acta Crystallogr. A 36 520–30[525] Welberry T R, Withers R L, Thompson J G and Butler B D 1992 J. Solid State Chem. 100 71–89[526] Welberry T R, Butler B D, Thompson J G and Withers R L 1993 J. Solid State Chem. 106 461–75[527] Welberry T R, Withers R L and Mayo S C 1995 J. Solid State Chem. 115 43–54[528] Ishizawa N, Matsushima Y, Hayashi M and Ueki M 1999 Acta Crystallogr. B55 726–35[529] Steele D and Fender B E F 1974 J. Phys. C: Solid State Phys. 7 1–11[530] Faber J Jr, Mueller M H and Cooper B R 1978 Phys. Rev. B 17 4884–8[531] Horiuchi H, Schultz A J, Leung P C W and Williams J M 1984 Acta Crystallogr. B 40 367–72[532] Hull S, Farley T W D, Hackett M A, Hayes W, Osborn R, Andersen N H, Clausen K, Hutchings M T and
Stirling W G 1988 Solid State Ion. 28–30 488–92[533] Argyriou D N 1994 J. Appl. Cryst. 27 155–8[534] Kahlert H, Frey F, Boysen H and Lassak K 1995 J. Appl. Crystallogr. 28 812–19[535] Argyriou D M, Elcombe M M and Larson A C 1996 J. Phys. Chem. Solids 57 183–93[536] Goff J P, Hayes W, Hull S, Hutchings M T and Clausen K N 1999 Phys. Rev. B 59 14202–19[537] Suemoto T and Ishigame M 1986 Solid State Ion. 21 225–9[538] Scott H G 1977 Acta Crystallogr. B 33 281–2
1312 S Hull
[539] Ray S P, Stubican V S and Cox D E 1980 Mater. Res. Bull. 15 1419–23[540] Catlow C R A, Chadwick A V, Greaves G N and Moroney L M 1986 J. Am. Ceram. Soc. 69 272–7[541] Li P, Chen I-W and Penner-Hahn J E 1993 Phys. Rev. B 48 10074–81[542] Tuilier M H, Dexpert-Ghys J, Dexpert H and Lagarde P 1987 J. Solid State Chem. 69 153–61[543] Rossell H J 1976 J. Solid State Chem. 19 103–11[544] Subramanian M A, Aravamudan G and Subba Rao G V 1983 Prog. Solid State Chem. 15 55–143[545] Withers R L, Thompson J G and Barlow P J 1991 J. Solid State Chem. 94 89–105[546] Chakoumakos B 1984 J. Solid State Chem. 53 120–9[547] Michel D, Perez y Jorba M and Collongues R 1974 Mater. Res. Bull. 9 1457–68[548] Yamamura H, Nishino H, Kakinuma K and Nomura K 2003 Solid State Ion. 158 359–65[549] van Dijk M P, de Vries K J and Burggraaf A J 1983 Solid State Ion. 9–10 913–20[550] Moriga T, Yoshiasa A, Kanamaru F, Koto K, Yoshimura M and Somiya S 1989 Solid State Ion. 31 319–28[551] van Dijk M P, Burggraaf A J, Cormack A N and Catlow C R A 1985 Solid State Ion. 17 159–67[552] Wilde P J and Catlow C R A 1998 Solid State Ion. 112 173–83[553] Wilde P J and Catlow C R A 1998 Solid State Ion. 112 185–95[554] Pirzada M, Grimes R W, Minervini L, Maguire J F and Sickafus K E 2001 Solid State Ion. 140 201–8[555] Minervini L, Grimes R W and Sickafus K E 2000 J. Am. Ceram. Soc. 83 1873–8[556] Stanek C R, Minervini L and Grimes R W 2002 J. Am. Ceram. Soc. 85 2792–8[557] Pirzada M, Grimes R W and Maguire J F 2003 Solid State Ion. 161 81–91[558] Minervini L, Grimes R W, Tabira Y, Withers R L and Sickafus K E 2002 Phil. Mag. A 82 123–35[559] Heremans C, Wuensch B J, Stalick J K and Prince E 1995 J. Solid State Chem. 117 108–21[560] Wuensch B J, Eberman K W, Heremans C, Ku E M, Onnerud P, Yeo E M E, Haile S M, Stalick J K and
Jorgensen J D 2000 Solid State Ion. 129 111–33[561] Glerup M, Nielsen O F and Poulsen F W 2001 J. Solid State Chem. 160 25–32[562] Thomson J B, Armstrong A R and Bruce P G 1999 J. Solid State Chem. 148 56–62[563] Norby T 2001 J. Mater. Chem. 11 11–18[564] Harwig H A and Gerards A G 1978 J. Solid State Chem. 26 265–74[565] Takahashi T and Iwahara H 1978 Mater. Res. Bull. 13 1447–53[566] Shuk P, Wienhofer H-D, Guth U, Gopel W and Greenblatt M 1996 Solid State Ion. 89 179–96[567] Gattow G and Schroder H 1962 Z. Anorg. Allg. Chem. 318 176–89[568] Sillen L G 1937 Ark. Kemi. Mineral. Geol. A 12 1–15[569] Harwig H A 1978 Z. Anorg. Allg. Chem. 444 151–66[570] Willis B T M 1965 Acta Crystallogr. 18 75–6[571] Battle P D, Catlow C R A, Drennan J and Murray A D 1983 J. Phys. C: Solid State Phys. 16 L561–6[572] Jacobs P W M and Mac Donaill D A 1986 Solid State Ion. 18–19 209–13[573] Jacobs P W M and Mac Donaill D A 1987 Solid State Ion. 23 279–93[574] Jacobs P W M and Mac Donaill D A 1987 Solid State Ion. 23 295–305[575] Jacobs P W M and Mac Donaill D A 1987 Solid State Ion. 23 307–18[576] Medvedeva N I, Zhukov V P, Gubanov V A, Novikov D L and Klein B M 1996 J. Phys. Chem. Solids 57
1243–50[577] Carlsson J M, Hellsing B, Domingos H S and Bristowe P D 2002 Phys. Rev. B 65 205122[578] Sammes N M, Tompsett G A, Nafe H and Aldinger F 1999 J. Eur. Ceram. Soc. 19 1801–26[579] Battle P D, Catlow C R A, Heap J W and Moroney L M 1986 J. Solid State Chem. 63 8–15[580] Ling C D, Withers R L, Schimd S and Thompson J G 1998 J. Solid State Chem. 137 42–61[581] Carbajo J J, Yoder G L, Popov S G and Ivanov V K 2001 J. Nucl. Mater. 299 181–98[582] Ralph J and Hyland G J 1985 J. Nucl. Mater. 132 76–9[583] Ralph J 1987 Nucl. Energy 26 259–63[584] Browning P, Hyland G J and Ralph J 1983 High Temp.—High Press. 15 169–78[585] Hyland G J and Ralph J 1983 High Temp.—High Press. 15 179–90[586] MacInnes D A 1978 J. Nucl. Mater. 78 225–7[587] Winter P W and MacInnes D A 1986 J. Nucl. Mater. 137 161–6[588] Fischer D F, Fink J L and Liebowitz L 1981 J. Nucl. Mater. 102 220–2[589] Clausen K, Hayes W, Macdonald J E, Osborn R and Hutchings M T 1984 Phys. Rev. Lett. 52 1238–41[590] Hutchings M T 1987 J. Chem. Soc.: Faraday Trans. II 83 1083–103[591] Donato A 1998 Fusion Eng. Des. 38 369–92[592] van der Laan J G, Kawamura H, Roux N and Yamaki D 2000 J. Nucl. Mater. 283–287 99–109[593] Ohno H, Konishi S, Noda K, Takeshita H, Yoshida H, Watanabe H and Matsuo T 1983 J. Nucl. Mater. 118
242–7
Crystal structures and conduction processes 1313
[594] Chadwick A V, Flack F W, Strange J H and Harding J 1988 Solid State Ion. 28–30 185–8[595] Strange J H, Rageb S M, Chadwick A V, Flack K W and Harding J H 1990 J. Chem. Soc.: Faraday Trans. 86
1239–41[596] Farley T W D, Hayes W, Hull S, Hutchings M T and Vrtis M 1991 J. Phys.: Condens. Matter 3 4761–81[597] de Vita A, Manassidis I, Lin J S and Gillan M J 1992 Europhys. Lett. 19 605–10[598] Fracchia R M, Barrera G D, Allan N L, Barron T H K and Mackrodt W C 1998 J. Phys. Chem. Solids 59
435–45[599] Farley T W D, Hayes W, Hull S, Hutchings M T, Alba M and Vrtis M 1989 Physica B 156 99–102[600] Kvist A and Lunden A 1965 Z. Naturf. A 20 235–8[601] Andersen N H, Bandaranayake P W S K, Careem M A, Dissanayake M A K L, Wijayasekera C N, Kaber R,
Lunden A, Mellander B-E, Nilsson L and Thomas J O 1992 Solid State Ion. 57 203–9[602] Kaber R, Nilsson L, Andersen N H, Lunden A and Thomas J O 1992 J. Phys.: Condens. Matter 4 1925–33[603] Lunden A 1995 Z. Naturf. A 50 1067–76[604] Borjesson L and Torell L M 1985 Phys. Rev. B 32 2471–7[605] Ferrario M, Klein M L and McDonald I R 1995 Mol. Phys. 86 923–38[606] Impey R W, Klein M L and McDonald I R 1984 J. Phys. C: Solid State Phys. 17 3941–4[607] Gundusharma U M, MacLean C and Secco E A 1986 Solid State Commun. 57 479–81[608] Lunden A 1988 Solid State Commun. 65 1237–40[609] Lunden A 1988 Solid State Ion. 28–30 163–7[610] Dissanayake M A K L, Careem M A, Bandaranayake P W S K and Wijayasekera C N 1991 Solid State Ion. 48
277–81[611] Lunden A 1994 Solid State Ion. 68 77–80[612] Babu C S and Tembe B L 1992 Chem. Phys. Lett. 194 351–4[613] Secco E A 1993 Solid State Ion. 60 233–5[614] Secco E A 1992 J. Solid State Chem. 96 366–75[615] Karlsson L and McGreevy R L 1995 Solid State Ion. 76 301–8[616] Pimenta M A, Echegut P, Gervais F and Abelard P 1988 Solid State Ion. 28–30 224–7[617] Wiench D M and Jansen M 1980 Z. Anorg. Allg. Chem. 461 101–8[618] Wilmer D, Funke K, Witschas M, Banhatti R D, Jansen M, Korus G, Fitter J and Lechner R E 1999 Physica B
266 60–8[619] Zhu B, Mellander B-E and Chen J 1993 Mater. Res. Bull. 28 321–8[620] Zetterstrom P, McGreevy R L, Mellergård A and Eriksen J 2002 Appl. Phys. A 74 (Suppl.) S995–7[621] Wilmer D, Feldmann H, Combet J and Lechner R E 2001 Physica B 301 99–104[622] Jansen M 1991 Angew. Chem. Int. Edn Engl. 30 1547–58[623] Lutz H D, Schmidt W and Haeuseler H 1981 J. Phys. Chem. Solids, 42 287–9[624] Kanno R, Takeda Y and Yamamoto O 1981 Mater. Res. Bull. 16 999–1005[625] Kanno R, Takeda Y, Mori M and Yamamoto O 1989 Chem. Lett. 223–6[626] Soubeyroux J L, Cros C, Gang W, Kanno R and Pouchard M 1985 Solid State Ion. 15 293–300[627] Nagel R, Groß T W, Gunther H and Lutz H D 2002 J. Solid State Chem. 165 303–11[628] Kanno R, Takeda Y and Yamamoto O 1988 Solid State Ion. 28–30 1276–81[629] Steiner H J and Lutz H D 1992 J. Solid State Chem. 99 1–11[630] Lutz H D, Partik M, Schneider M and Wickel C 1997 Z. Kristallogr. 212 418–22[631] Aghapoor K, Kuske P, Steiner H-J and Lutz H D 1993 Mater. Res. Bull. 28 347–52[632] Riedel E, Prick D, Pfitzner A and Lutz H D 1993 Z. Anorg. Allg. Chem. 619 901–4[633] Kanno R, Takeda Y, Takeda K and Yamamoto O 1984 J. Electrochem. Soc. 131 469–74[634] Thackeray M M 1995 J. Electrochem. Soc. 142 2558–63[635] Thackeray M M 1997 Prog. Solid State Chem. 25 1–71[636] Goodenough J B, Thackeray M M, David W I F and Bruce P G 1984 Rev. Chim. Miner. 21 435–55[637] Ammundsen B, Roziere J and Islam M S 1997 J. Phys. Chem. B 101 8156–63[638] Verhoeven V W J, de Schepper I M, Nachtegaal G, Kentgens A P M, Kelder E M, Shoonman J and Mulder F M
2001 Phys. Rev. Lett. 86 4314–7[639] David W I F, Thackeray M M, de Picciotto L A and Goodenough J B 1987 J. Solid State Chem. 67 316–23[640] Fong C, Kennedy B J and Elcombe M M 1994 Z. Kristallogr. 209 941–5[641] David W I F, Goodenough J B, Thackeray M M and Thomas M G S R 1983 Rev. Chim. Miner. 20 636–42[642] Thackeray M M 1999 J. Am. Ceram. Soc. 82 3347–54[643] Yamada A and Tanaka M 1995 Mater. Res. Bull. 30 715–21[644] Yamada A 1996 J. Solid State Chem. 122 160–5[645] Rodrıguez-Carvajal J, Rousse G, Masquelier C and Hervieu M 1998 Phys. Rev. Lett. 81 4660–3

1314 S Hull
[646] Gummow R J, de Kock A and Thackeray M M 1994 Solid State Ion. 69 59–67[647] Ammundsen B, Burns G R, Islam M S, Kanoh H and Roziere J 1999 J. Phys. Chem. B 103 5175–80[648] Bjork H, Gustafsson T, Thomas J O, Lidin S and Petricek V 2003 J. Mater. Chem. 13 585–89[649] Dupont L, Hervieu M, Rousse G, Masquelier C, Palacın M R, Chabre Y and Tarascon J M 2000 J. Solid State
Chem. 155 394–408[650] Lee Y J, Wang F, Mukerjee S, McBreen J and Grey C P 2000 J. Electrochem. Soc. 147 803–12[651] Sun X, Yang X Q, Balasubramanian M, McBreen J, Xia Y and Sakai T 2002 J. Electrochem. Soc. 149
A842–8[652] Berg H, Rundlov H and Thomas J O 2001 Solid State Ion. 144 65–9[653] West A R 1975 Z. Kristallogr. 141 422–36[654] O’Keeffe M and Hyde B G 1978 Acta Crystallogr. B 34 3519–28[655] Abrahams I, Bruce P G, West A R and David W I F 1988 J. Solid State Chem. 75 390–6[656] Abrahams I, Bruce P G, David W I F and West A R 1989 Acta Crystallogr. B 45 457–62[657] Bruce P G, Abrahams I and West A R 1990 Solid State Ion. 40–41 293–9[658] Abrahams I and Bruce P G 1991 Phil. Mag. A 64 1113–18[659] Baur W H 1981 Mater. Res. Bull. 16 339–45[660] West A R and Bruce P G 1982 Acta Crystallogr. B 38 1891–6[661] West A R 1995 Solid State Electrochemistry ed P G Bruce (Cambridge: Cambridge University Press) pp 7–42[662] Smith R I and West A R 1991 J. Mater. Chem. 1 91–6[663] Schulz H and Zucker U H 1981 Solid State Ion. 5 41–6[664] Lechner R E 1993 Solid State Ion. 61 3–11[665] Comins J D, Ngoepe P E and Catlow C R A 1990 J. Chem. Soc.: Faraday Trans. 86 1183–92[666] Hayes W 1982 Topics Appl. Phys. 51 93–120[667] Ishigame M, Shin S and Suemoto T 1991 Solid State Ion. 47 1–34[668] Brinkmann D 1992 Prog. NMR Spectrosc. 24 527–52[669] Chadwick A V 1991 Phil. Mag. A 64 983–98[670] Jiang S P, Love J G and Badwal S P S 1997 Key Eng. Mater. 125–126 81–132[671] Dalba G, Fornasini P, Gotter R, Grazioli M and Rocca F 1995 Phil. Mag. B 71 751–60[672] Catlow C R A 1992 Solid State Ion. 53–56 955–63[673] Catlow C R A, Bell R G and Gale J D 1994 J. Mater. Chem. 4 781–92[674] Sivia D S and David W I F 2001 J. Phys. Chem. Solids 62 2119–27[675] Wilson M and Madden P A 1993 J. Phys.: Condens. Matter 5 2687–706[676] Wilson M, Madden P A and Costa Cabral B J 1996 J. Phys. Chem. 100 1227–37[677] Radulescu A, Padureanu I, Rapeanu S N, Beldiman A, Ion M, Kozlov Z A and Semenov V A 1999 Phys. Rev.
B 59 3270–3[678] Delaney M J and Ushioda S 1979 Physics of superionic conductors Topics in Current Physics vol 15,
ed M B Salamon (Berlin: Springer) pp 111–39