superintendent of schools
TRANSCRIPT
BOARD OF SCHOOL TRUSTEES 2008-2009 Terri Janison, President, District E
Carolyn Edwards, Vice President, District F
Sheila R. Moulton, Clerk, District G
Chris Garvey, Member, District B
Larry P. Mason, Member, District D
Deanna L. Wright, Member, District A
Linda E. Young, Member, District C
SUPERINTENDENT OF SCHOOLS
Walt Rulffes
DEPUTY SUPERINTENDENT OF INSTRUCTION
Lauren Kohut-Rost
DEPUTY SUPERINTENDENT OF STUDENT SUPPORT SERVICES
Charlene Green
ADMINISTRATION
Andre B. Denson, Area Service Center 1, Associate Superintendent
Robert Alfaro, Area Service Center 2, Associate Superintendent
Jolene Wallace, Area Service Center 3, Associate Superintendent
TBD, Area Service Center 4, Associate Superintendent
Edward Goldman, Education Services, Associate Superintendent
Billie Rayford, Superintendent’s Schools, Associate Superintendent
TABLE OF CONTENTS
Clark County School District Accountability Report 2008-09 School Year
I. Introduction
II. Demographic Profile
III. Student Attendance
IV. Transiency/Discipline, Truancy
V. Retentions/Class Size
VI. Graduation/Drop-out Rates (Class of 2008)
VII. Fiscal Information
VIII. Personnel
IX. Parent Involvement
X. AYP/Assessments
CCSD Accountability Department August, 2009
Website: www.nevadareportcard.com Clark County School District
For more information visit www.nevadareportcard.com
Clark County School District
Ph: 702-799-5000 Fax: 702-799-5125
Website: www.ccsd.net
5100 W. Sahara
Dr. Walt Rulffes, Superintendent
Las Vegas, NV 89146
Board Members
Sheila R. Moulton, Clerk, District G
Chris Garvey, Member, District B
Terri Janison, President, District E
Carolyn Edwards, Vice-President, District F
Dr. Linda E. Young, Member, District C
Deanna L. Wright, Member, District A
Larry P. Mason, Member, District D
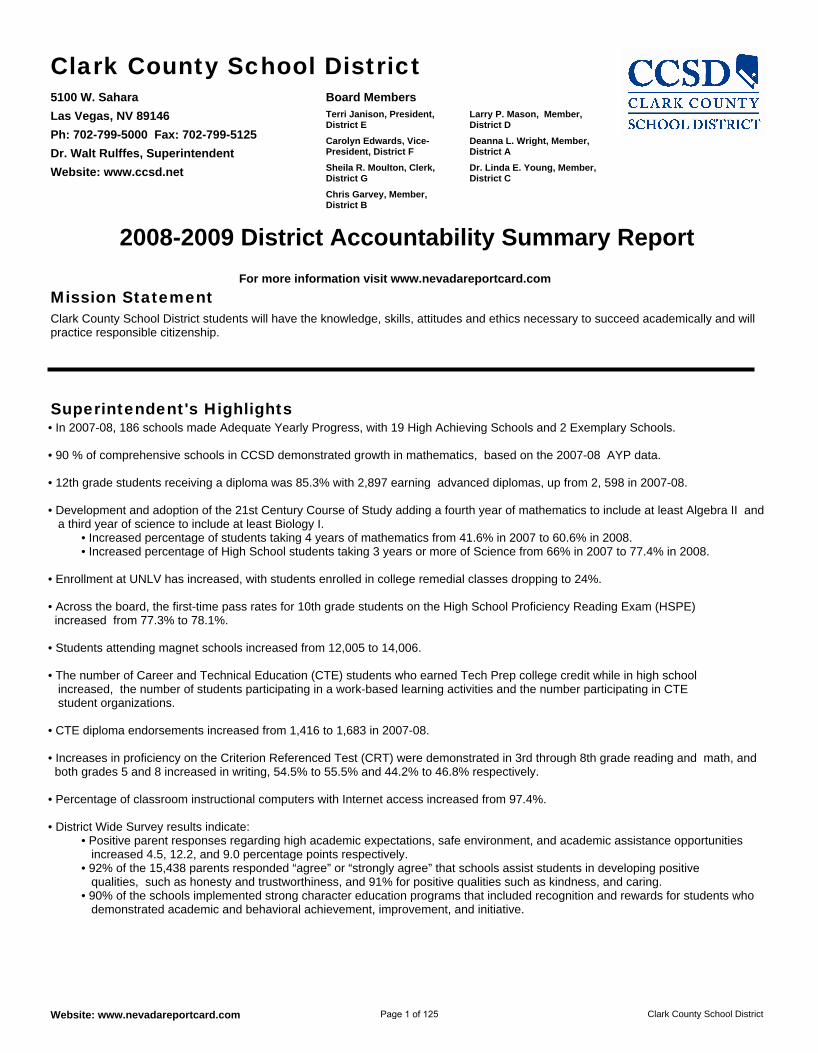
Mission StatementClark County School District students will have the knowledge, skills, attitudes and ethics necessary to succeed academically and will practice responsible citizenship.
2008-2009 District Accountability Summary Report
Superintendent's Highlights• In 2007-08, 186 schools made Adequate Yearly Progress, with 19 High Achieving Schools and 2 Exemplary Schools. • 90 % of comprehensive schools in CCSD demonstrated growth in mathematics, based on the 2007-08 AYP data. • 12th grade students receiving a diploma was 85.3% with 2,897 earning advanced diplomas, up from 2, 598 in 2007-08. • Development and adoption of the 21st Century Course of Study adding a fourth year of mathematics to include at least Algebra II and a third year of science to include at least Biology I. • Increased percentage of students taking 4 years of mathematics from 41.6% in 2007 to 60.6% in 2008. • Increased percentage of High School students taking 3 years or more of Science from 66% in 2007 to 77.4% in 2008. • Enrollment at UNLV has increased, with students enrolled in college remedial classes dropping to 24%. • Across the board, the first-time pass rates for 10th grade students on the High School Proficiency Reading Exam (HSPE) increased from 77.3% to 78.1%. • Students attending magnet schools increased from 12,005 to 14,006. • The number of Career and Technical Education (CTE) students who earned Tech Prep college credit while in high school increased, the number of students participating in a work-based learning activities and the number participating in CTE student organizations. • CTE diploma endorsements increased from 1,416 to 1,683 in 2007-08. • Increases in proficiency on the Criterion Referenced Test (CRT) were demonstrated in 3rd through 8th grade reading and math, and both grades 5 and 8 increased in writing, 54.5% to 55.5% and 44.2% to 46.8% respectively. • Percentage of classroom instructional computers with Internet access increased from 97.4%. • District Wide Survey results indicate: • Positive parent responses regarding high academic expectations, safe environment, and academic assistance opportunities increased 4.5, 12.2, and 9.0 percentage points respectively. • 92% of the 15,438 parents responded “agree” or “strongly agree” that schools assist students in developing positive qualities, such as honesty and trustworthiness, and 91% for positive qualities such as kindness, and caring. • 90% of the schools implemented strong character education programs that included recognition and rewards for students who demonstrated academic and behavioral achievement, improvement, and initiative.
Page 1 of 125
2008-2009 Accountability Report
Website: www.nevadareportcard.com Clark County School District
• Percent of LEP students that increased proficient in English by one level was 49.8%, while another 13% increased proficiency in English by two levels. • Over half of all high and middle school students participated in fine arts activities during the 2007-08 school year. • The number of AP exams taken increased from 8,097 to 9,124 in 2007-08 and the number scoring 3 or above increased to 4,278. • The number of students who took AP courses increased from 12,904 to 13,911 in 2008-2009. • High school students passing a secondary foreign language Level III or IV course was 93.9%. • During the 2008-09 school year, 45,970 students were involved in clubs that did 209,942 hours in community service. • 104 students in grades 6, 7, and 8 competed in the Region Spelling Bee.
Goals and Objectives
GOAL 1: The District will demonstrate increased student achievement in English language arts, mathematics, and science, reduce the achievement gap between disaggregated populations, decrease the number of high school dropouts, and increase achievement of ELL and IEP students by institutionalizing scientifically research-based instructional systems as evidenced in the Quality Assurance Framework baseline data. MEASURABLE OBJECTIVE 1: CCSD students will demonstrate increased academic achievement in English language arts, mathematics, and science as measured by Nevada AYP standards in June 2009, such that there will be at least a 10% decrease in non-proficient students. MEASURABLE OBJECTIVE 2: The District will demonstrate a reduction in the achievement gap between disaggregated populations. MEASURABLE OBJECTIVE 3: The District will demonstrate a decrease in the percentage of high school dropouts. MEASURABLE OBJECTIVE 4: The District will demonstrate increased achievement as measured by the AMAO objectives such that: a. 50% of all LEP students must achieve a 25 point gain in overall ELPA scaled scores each year, b. 14% of all LEP students must achieve English language proficiency each year, and c. LEP students must make adequate yearly progress (AYP) as determined by Title I. GOAL 2: The District will coordinate, design, deliver and evaluate ongoing professional development aligned to District instructional initiatives. MEASURABLE OBJECTIVE 1: The District will align professional development to meet District instructional initiatives and identified student needs. GOAL 3: The District will expand recruitment, support, and retention of qualified staff including teachers, administrators, and support staff. MEASURABLE OBJECTIVE 1: The District will improve retention of qualified teachers such that there will be a decrease in the attrition of teachers by 10%.
Page 2 of 125
2008-2009 Accountability Report
Website: www.nevadareportcard.com Clark County School District
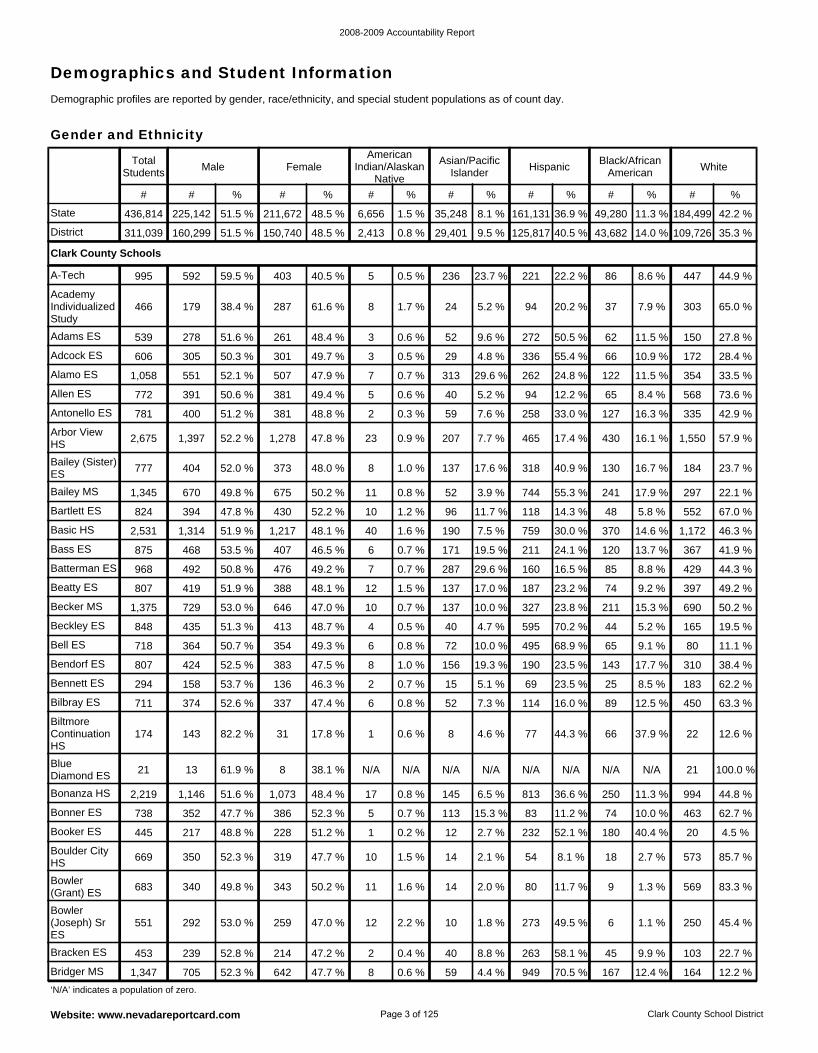
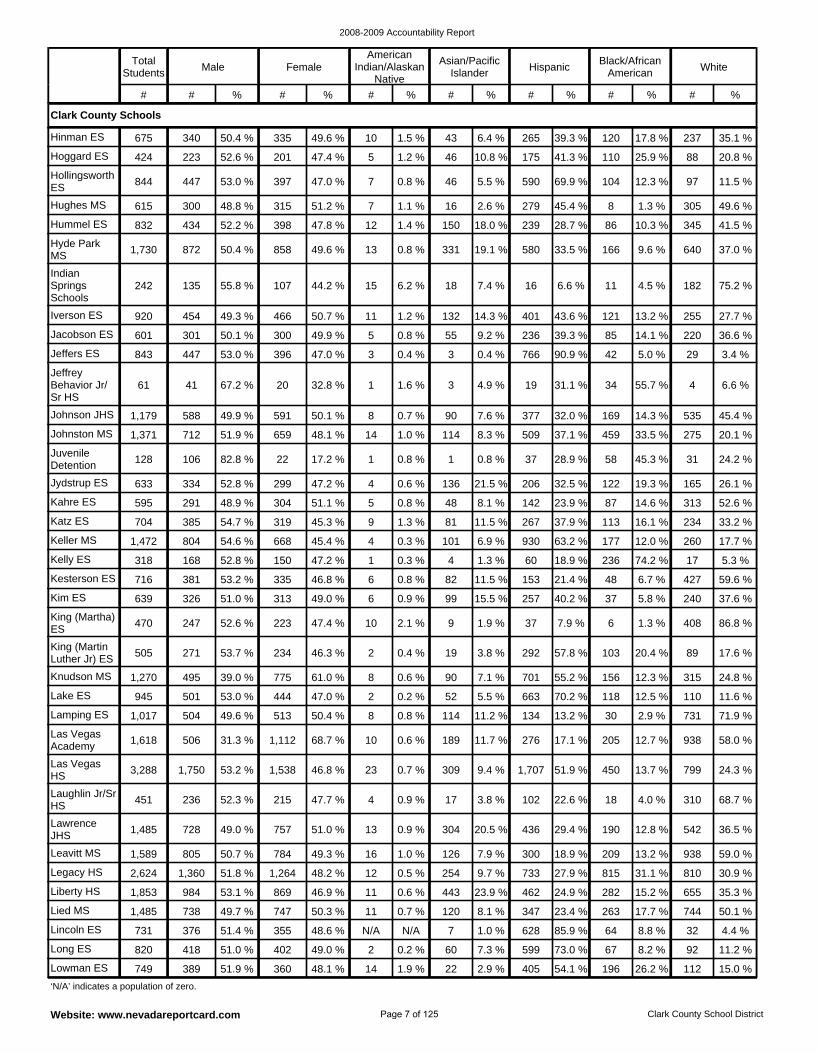
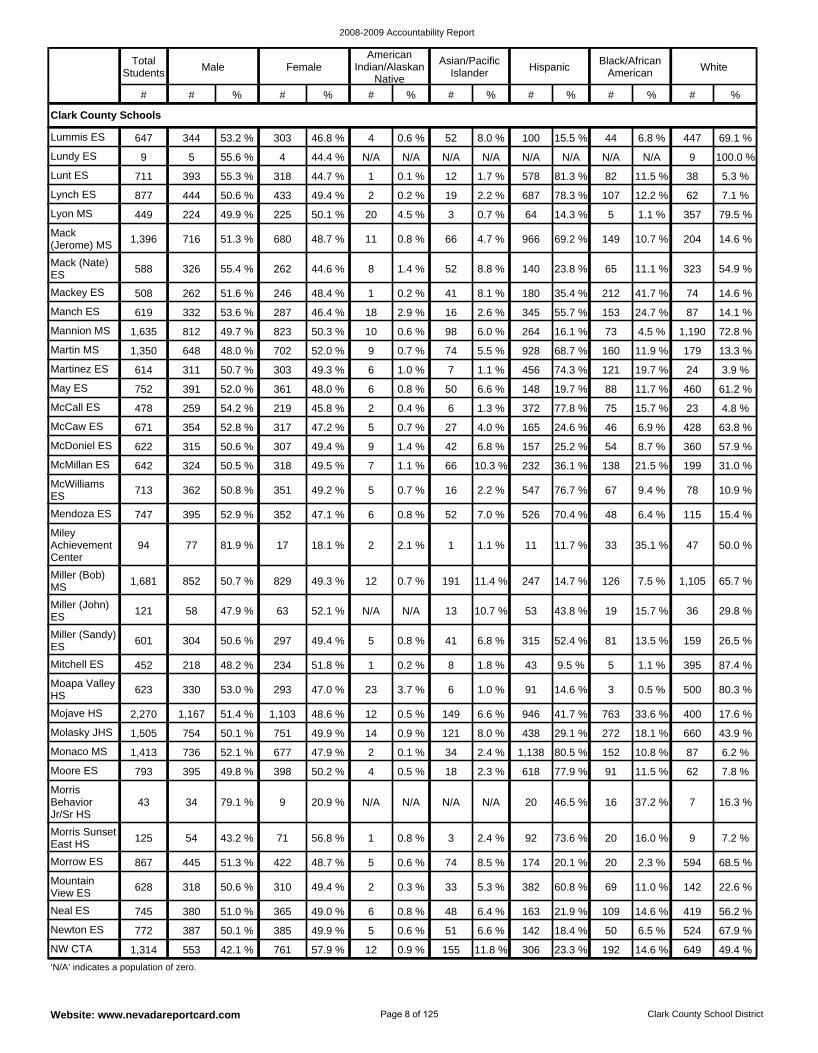
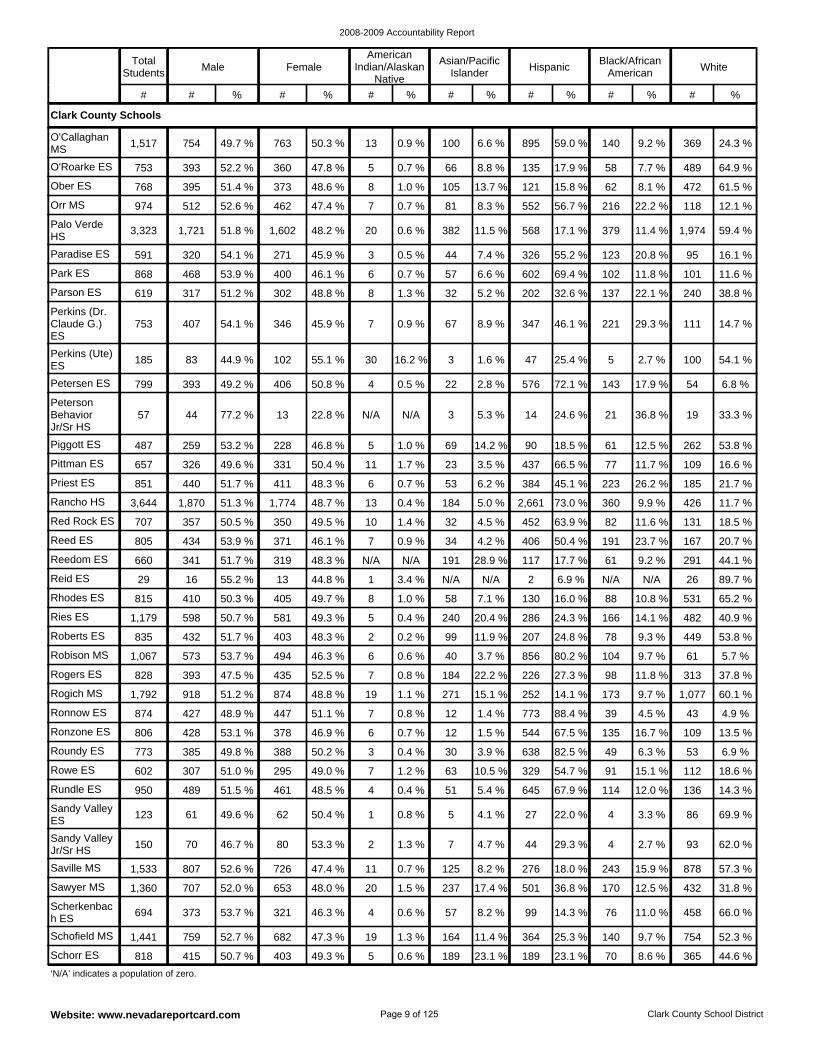
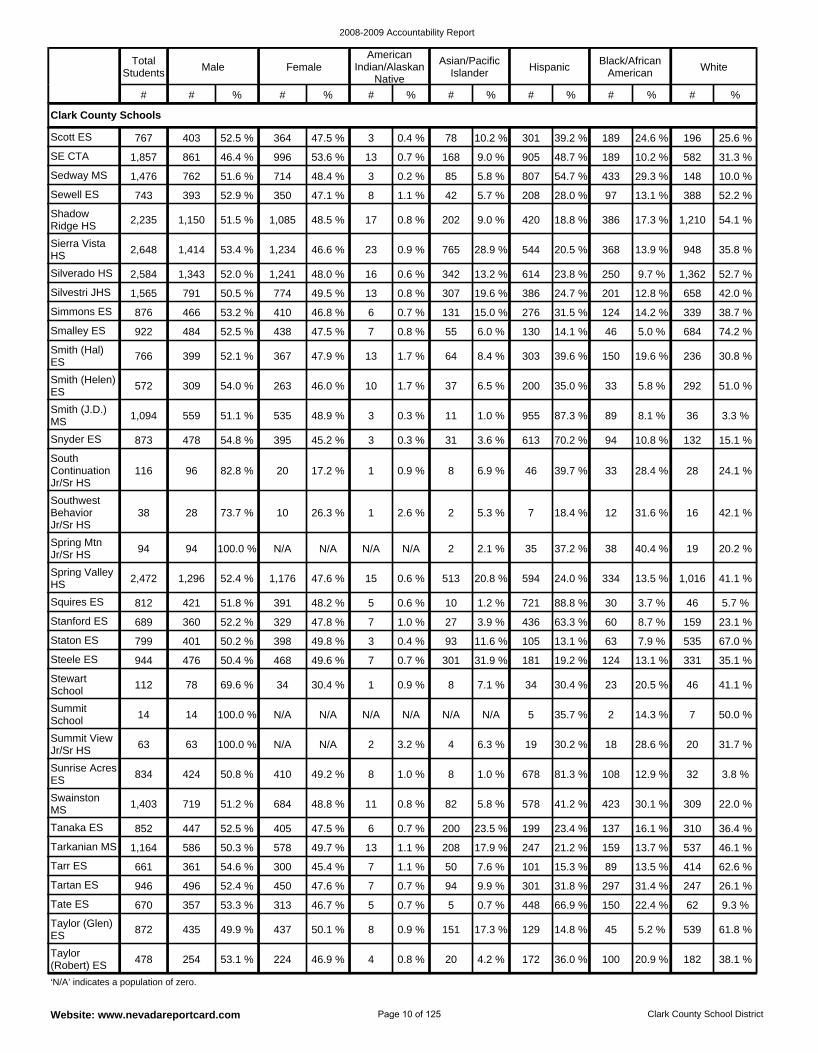
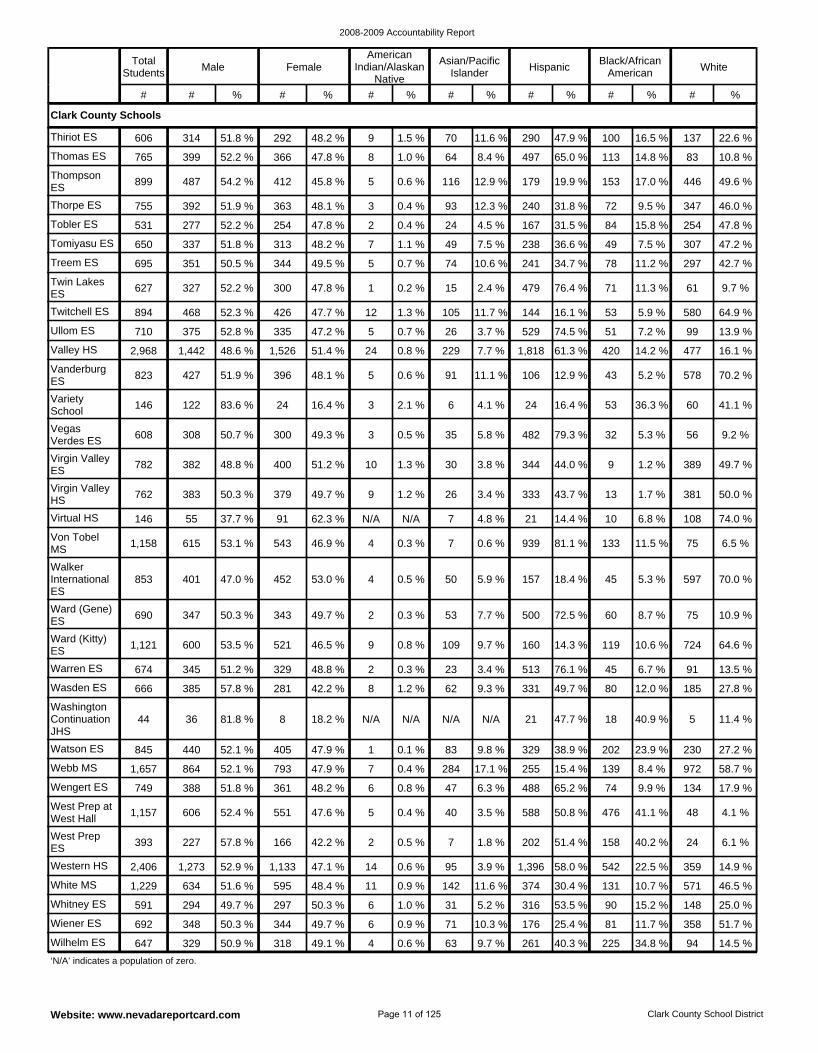
Demographics and Student InformationDemographic profiles are reported by gender, race/ethnicity, and special student populations as of count day.
Gender and Ethnicity
Bracken ES 453 239 52.8 % 214 47.2 % 2 0.4 % 40 8.8 % 263 58.1 % 45 9.9 % 103 22.7 %
Bowler (Joseph) Sr ES
551 292 53.0 % 259 47.0 % 12 2.2 % 10 1.8 % 273 49.5 % 6 1.1 % 250 45.4 %
Bowler (Grant) ES 683 340 49.8 % 343 50.2 % 11 1.6 % 14 2.0 % 80 11.7 % 9 1.3 % 569 83.3 %
Bridger MS 1,347 705 52.3 % 642 47.7 % 8 0.6 % 59 4.4 % 949 70.5 % 167 12.4 % 164 12.2 %
Bonanza HS 2,219 1,146 51.6 % 1,073 48.4 % 17 0.8 % 145 6.5 % 813 36.6 % 250 11.3 % 994 44.8 %
Blue Diamond ES 21 13 61.9 % 8 38.1 % N/A N/A N/A N/A N/A N/A N/A N/A 21 100.0 %
Boulder City HS 669 350 52.3 % 319 47.7 % 10 1.5 % 14 2.1 % 54 8.1 % 18 2.7 % 573 85.7 %
Booker ES 445 217 48.8 % 228 51.2 % 1 0.2 % 12 2.7 % 232 52.1 % 180 40.4 % 20 4.5 %
Bonner ES 738 352 47.7 % 386 52.3 % 5 0.7 % 113 15.3 % 83 11.2 % 74 10.0 % 463 62.7 %
Bilbray ES 711 374 52.6 % 337 47.4 % 6 0.8 % 52 7.3 % 114 16.0 % 89 12.5 % 450 63.3 %
Allen ES 772 391 50.6 % 381 49.4 % 5 0.6 % 40 5.2 % 94 12.2 % 65 8.4 % 568 73.6 %
Alamo ES 1,058 551 52.1 % 507 47.9 % 7 0.7 % 313 29.6 % 262 24.8 % 122 11.5 % 354 33.5 %
Antonello ES 781 400 51.2 % 381 48.8 % 2 0.3 % 59 7.6 % 258 33.0 % 127 16.3 % 335 42.9 %
Bailey (Sister) ES 777 404 52.0 % 373 48.0 % 8 1.0 % 137 17.6 % 318 40.9 % 130 16.7 % 184 23.7 %
Arbor View HS 2,675 1,397 52.2 % 1,278 47.8 % 23 0.9 % 207 7.7 % 465 17.4 % 430 16.1 % 1,550 57.9 %
Adcock ES 606 305 50.3 % 301 49.7 % 3 0.5 % 29 4.8 % 336 55.4 % 66 10.9 % 172 28.4 %
Biltmore Continuation HS
174 143 82.2 % 31 17.8 % 1 0.6 % 8 4.6 % 77 44.3 % 66 37.9 % 22 12.6 %
A-Tech 995 592 59.5 % 403 40.5 % 5 0.5 % 236 23.7 % 221 22.2 % 86 8.6 % 447 44.9 %
Adams ES 539 278 51.6 % 261 48.4 % 3 0.6 % 52 9.6 % 272 50.5 % 62 11.5 % 150 27.8 %
Academy Individualized Study
466 179 38.4 % 287 61.6 % 8 1.7 % 24 5.2 % 94 20.2 % 37 7.9 % 303 65.0 %
Beckley ES 848 435 51.3 % 413 48.7 % 4 0.5 % 40 4.7 % 595 70.2 % 44 5.2 % 165 19.5 %
Becker MS 1,375 729 53.0 % 646 47.0 % 10 0.7 % 137 10.0 % 327 23.8 % 211 15.3 % 690 50.2 %
Bell ES 718 364 50.7 % 354 49.3 % 6 0.8 % 72 10.0 % 495 68.9 % 65 9.1 % 80 11.1 %
Bennett ES 294 158 53.7 % 136 46.3 % 2 0.7 % 15 5.1 % 69 23.5 % 25 8.5 % 183 62.2 %
Bendorf ES 807 424 52.5 % 383 47.5 % 8 1.0 % 156 19.3 % 190 23.5 % 143 17.7 % 310 38.4 %
Beatty ES 807 419 51.9 % 388 48.1 % 12 1.5 % 137 17.0 % 187 23.2 % 74 9.2 % 397 49.2 %
Bailey MS 1,345 670 49.8 % 675 50.2 % 11 0.8 % 52 3.9 % 744 55.3 % 241 17.9 % 297 22.1 %
Bartlett ES 824 394 47.8 % 430 52.2 % 10 1.2 % 96 11.7 % 118 14.3 % 48 5.8 % 552 67.0 %
Basic HS 2,531 1,314 51.9 % 1,217 48.1 % 40 1.6 % 190 7.5 % 759 30.0 % 370 14.6 % 1,172 46.3 %
Batterman ES 968 492 50.8 % 476 49.2 % 7 0.7 % 287 29.6 % 160 16.5 % 85 8.8 % 429 44.3 %
Bass ES 875 468 53.5 % 407 46.5 % 6 0.7 % 171 19.5 % 211 24.1 % 120 13.7 % 367 41.9 %
Clark County Schools
District 311,039 160,299 51.5 % 150,740 48.5 % 2,413 0.8 % 29,401 9.5 % 125,817 40.5 % 43,682 14.0 % 109,726 35.3 %
State 436,814 225,142 51.5 % 211,672 48.5 % 6,656 1.5 % 35,248 8.1 % 161,131 36.9 % 49,280 11.3 % 184,499 42.2 %
‘N/A’ indicates a population of zero.
Total Students Male Female
American Indian/Alaskan
Native
Asian/Pacific Islander Hispanic
Black/African American White
# # % # % # % # % # % # % # %
Page 3 of 125
2008-2009 Accountability Report
Website: www.nevadareportcard.com Clark County School District
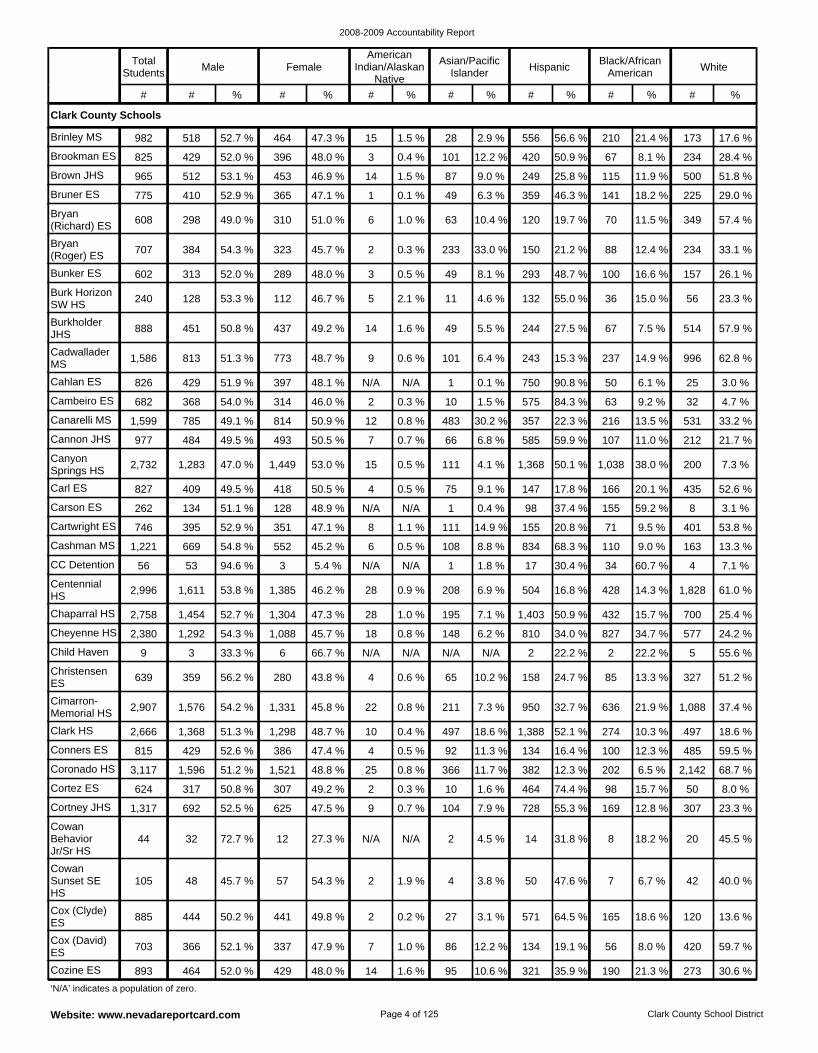
Cortney JHS 1,317 692 52.5 % 625 47.5 % 9 0.7 % 104 7.9 % 728 55.3 % 169 12.8 % 307 23.3 %
Cortez ES 624 317 50.8 % 307 49.2 % 2 0.3 % 10 1.6 % 464 74.4 % 98 15.7 % 50 8.0 %
Coronado HS 3,117 1,596 51.2 % 1,521 48.8 % 25 0.8 % 366 11.7 % 382 12.3 % 202 6.5 % 2,142 68.7 %
Cox (Clyde) ES 885 444 50.2 % 441 49.8 % 2 0.2 % 27 3.1 % 571 64.5 % 165 18.6 % 120 13.6 %
Cowan Sunset SE HS
105 48 45.7 % 57 54.3 % 2 1.9 % 4 3.8 % 50 47.6 % 7 6.7 % 42 40.0 %
Cowan Behavior Jr/Sr HS
44 32 72.7 % 12 27.3 % N/A N/A 2 4.5 % 14 31.8 % 8 18.2 % 20 45.5 %
Christensen ES 639 359 56.2 % 280 43.8 % 4 0.6 % 65 10.2 % 158 24.7 % 85 13.3 % 327 51.2 %
Child Haven 9 3 33.3 % 6 66.7 % N/A N/A N/A N/A 2 22.2 % 2 22.2 % 5 55.6 %
Conners ES 815 429 52.6 % 386 47.4 % 4 0.5 % 92 11.3 % 134 16.4 % 100 12.3 % 485 59.5 %
Clark HS 2,666 1,368 51.3 % 1,298 48.7 % 10 0.4 % 497 18.6 % 1,388 52.1 % 274 10.3 % 497 18.6 %
Cimarron-Memorial HS 2,907 1,576 54.2 % 1,331 45.8 % 22 0.8 % 211 7.3 % 950 32.7 % 636 21.9 % 1,088 37.4 %
Cozine ES 893 464 52.0 % 429 48.0 % 14 1.6 % 95 10.6 % 321 35.9 % 190 21.3 % 273 30.6 %
Cox (David) ES 703 366 52.1 % 337 47.9 % 7 1.0 % 86 12.2 % 134 19.1 % 56 8.0 % 420 59.7 %
Chaparral HS 2,758 1,454 52.7 % 1,304 47.3 % 28 1.0 % 195 7.1 % 1,403 50.9 % 432 15.7 % 700 25.4 %
Bryan (Roger) ES 707 384 54.3 % 323 45.7 % 2 0.3 % 233 33.0 % 150 21.2 % 88 12.4 % 234 33.1 %
Bryan (Richard) ES 608 298 49.0 % 310 51.0 % 6 1.0 % 63 10.4 % 120 19.7 % 70 11.5 % 349 57.4 %
Bunker ES 602 313 52.0 % 289 48.0 % 3 0.5 % 49 8.1 % 293 48.7 % 100 16.6 % 157 26.1 %
Burkholder JHS 888 451 50.8 % 437 49.2 % 14 1.6 % 49 5.5 % 244 27.5 % 67 7.5 % 514 57.9 %
Burk Horizon SW HS 240 128 53.3 % 112 46.7 % 5 2.1 % 11 4.6 % 132 55.0 % 36 15.0 % 56 23.3 %
Bruner ES 775 410 52.9 % 365 47.1 % 1 0.1 % 49 6.3 % 359 46.3 % 141 18.2 % 225 29.0 %
Cheyenne HS 2,380 1,292 54.3 % 1,088 45.7 % 18 0.8 % 148 6.2 % 810 34.0 % 827 34.7 % 577 24.2 %
Brinley MS 982 518 52.7 % 464 47.3 % 15 1.5 % 28 2.9 % 556 56.6 % 210 21.4 % 173 17.6 %
Brown JHS 965 512 53.1 % 453 46.9 % 14 1.5 % 87 9.0 % 249 25.8 % 115 11.9 % 500 51.8 %
Brookman ES 825 429 52.0 % 396 48.0 % 3 0.4 % 101 12.2 % 420 50.9 % 67 8.1 % 234 28.4 %
Cadwallader MS 1,586 813 51.3 % 773 48.7 % 9 0.6 % 101 6.4 % 243 15.3 % 237 14.9 % 996 62.8 %
Cartwright ES 746 395 52.9 % 351 47.1 % 8 1.1 % 111 14.9 % 155 20.8 % 71 9.5 % 401 53.8 %
Carson ES 262 134 51.1 % 128 48.9 % N/A N/A 1 0.4 % 98 37.4 % 155 59.2 % 8 3.1 %
Cashman MS 1,221 669 54.8 % 552 45.2 % 6 0.5 % 108 8.8 % 834 68.3 % 110 9.0 % 163 13.3 %
Centennial HS 2,996 1,611 53.8 % 1,385 46.2 % 28 0.9 % 208 6.9 % 504 16.8 % 428 14.3 % 1,828 61.0 %
CC Detention 56 53 94.6 % 3 5.4 % N/A N/A 1 1.8 % 17 30.4 % 34 60.7 % 4 7.1 %
Carl ES 827 409 49.5 % 418 50.5 % 4 0.5 % 75 9.1 % 147 17.8 % 166 20.1 % 435 52.6 %
Cambeiro ES 682 368 54.0 % 314 46.0 % 2 0.3 % 10 1.5 % 575 84.3 % 63 9.2 % 32 4.7 %
Cahlan ES 826 429 51.9 % 397 48.1 % N/A N/A 1 0.1 % 750 90.8 % 50 6.1 % 25 3.0 %
Canarelli MS 1,599 785 49.1 % 814 50.9 % 12 0.8 % 483 30.2 % 357 22.3 % 216 13.5 % 531 33.2 %
Canyon Springs HS 2,732 1,283 47.0 % 1,449 53.0 % 15 0.5 % 111 4.1 % 1,368 50.1 % 1,038 38.0 % 200 7.3 %
Cannon JHS 977 484 49.5 % 493 50.5 % 7 0.7 % 66 6.8 % 585 59.9 % 107 11.0 % 212 21.7 %
Clark County Schools
‘N/A’ indicates a population of zero.
Total Students Male Female
American Indian/Alaskan
Native
Asian/Pacific Islander Hispanic
Black/African American White
# # % # % # % # % # % # % # %
Page 4 of 125
2008-2009 Accountability Report
Website: www.nevadareportcard.com Clark County School District
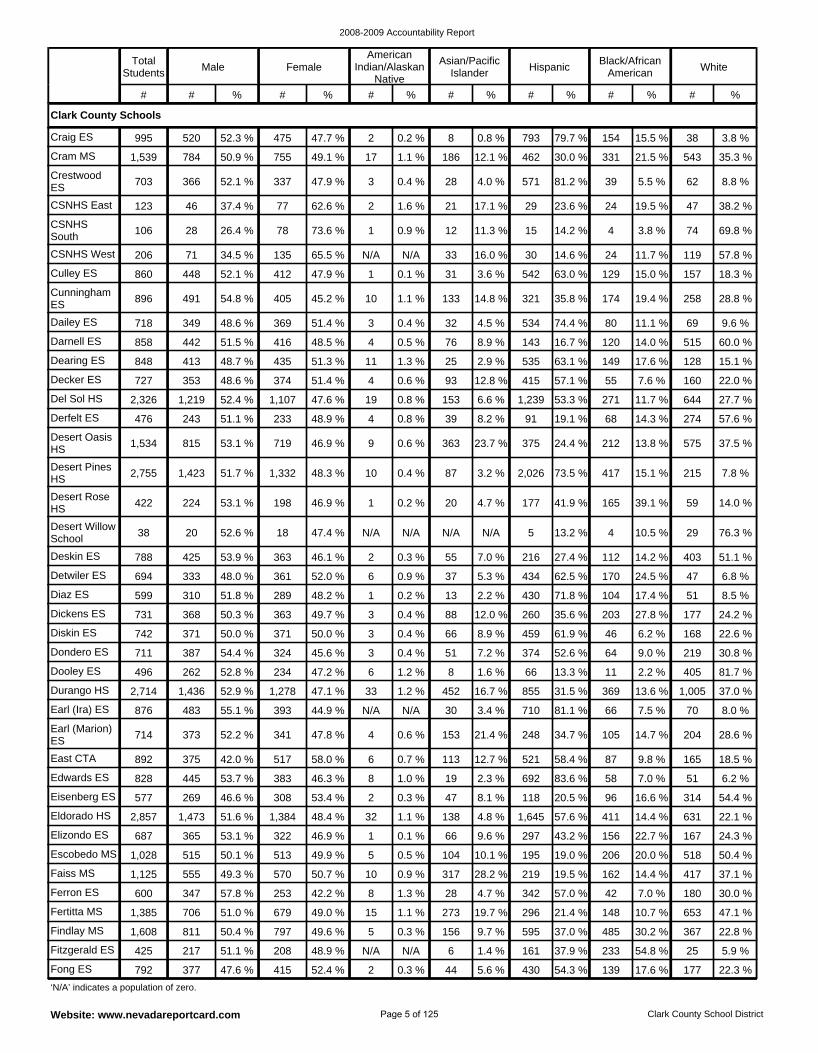
Eldorado HS 2,857 1,473 51.6 % 1,384 48.4 % 32 1.1 % 138 4.8 % 1,645 57.6 % 411 14.4 % 631 22.1 %
Eisenberg ES 577 269 46.6 % 308 53.4 % 2 0.3 % 47 8.1 % 118 20.5 % 96 16.6 % 314 54.4 %
Edwards ES 828 445 53.7 % 383 46.3 % 8 1.0 % 19 2.3 % 692 83.6 % 58 7.0 % 51 6.2 %
Faiss MS 1,125 555 49.3 % 570 50.7 % 10 0.9 % 317 28.2 % 219 19.5 % 162 14.4 % 417 37.1 %
Escobedo MS 1,028 515 50.1 % 513 49.9 % 5 0.5 % 104 10.1 % 195 19.0 % 206 20.0 % 518 50.4 %
Elizondo ES 687 365 53.1 % 322 46.9 % 1 0.1 % 66 9.6 % 297 43.2 % 156 22.7 % 167 24.3 %
Durango HS 2,714 1,436 52.9 % 1,278 47.1 % 33 1.2 % 452 16.7 % 855 31.5 % 369 13.6 % 1,005 37.0 %
Dooley ES 496 262 52.8 % 234 47.2 % 6 1.2 % 8 1.6 % 66 13.3 % 11 2.2 % 405 81.7 %
East CTA 892 375 42.0 % 517 58.0 % 6 0.7 % 113 12.7 % 521 58.4 % 87 9.8 % 165 18.5 %
Earl (Marion) ES 714 373 52.2 % 341 47.8 % 4 0.6 % 153 21.4 % 248 34.7 % 105 14.7 % 204 28.6 %
Earl (Ira) ES 876 483 55.1 % 393 44.9 % N/A N/A 30 3.4 % 710 81.1 % 66 7.5 % 70 8.0 %
Ferron ES 600 347 57.8 % 253 42.2 % 8 1.3 % 28 4.7 % 342 57.0 % 42 7.0 % 180 30.0 %
Fitzgerald ES 425 217 51.1 % 208 48.9 % N/A N/A 6 1.4 % 161 37.9 % 233 54.8 % 25 5.9 %
Findlay MS 1,608 811 50.4 % 797 49.6 % 5 0.3 % 156 9.7 % 595 37.0 % 485 30.2 % 367 22.8 %
Fertitta MS 1,385 706 51.0 % 679 49.0 % 15 1.1 % 273 19.7 % 296 21.4 % 148 10.7 % 653 47.1 %
Fong ES 792 377 47.6 % 415 52.4 % 2 0.3 % 44 5.6 % 430 54.3 % 139 17.6 % 177 22.3 %
Diskin ES 742 371 50.0 % 371 50.0 % 3 0.4 % 66 8.9 % 459 61.9 % 46 6.2 % 168 22.6 %
Culley ES 860 448 52.1 % 412 47.9 % 1 0.1 % 31 3.6 % 542 63.0 % 129 15.0 % 157 18.3 %
CSNHS West 206 71 34.5 % 135 65.5 % N/A N/A 33 16.0 % 30 14.6 % 24 11.7 % 119 57.8 %
CSNHS South 106 28 26.4 % 78 73.6 % 1 0.9 % 12 11.3 % 15 14.2 % 4 3.8 % 74 69.8 %
Darnell ES 858 442 51.5 % 416 48.5 % 4 0.5 % 76 8.9 % 143 16.7 % 120 14.0 % 515 60.0 %
Dailey ES 718 349 48.6 % 369 51.4 % 3 0.4 % 32 4.5 % 534 74.4 % 80 11.1 % 69 9.6 %
Cunningham ES 896 491 54.8 % 405 45.2 % 10 1.1 % 133 14.8 % 321 35.8 % 174 19.4 % 258 28.8 %
Craig ES 995 520 52.3 % 475 47.7 % 2 0.2 % 8 0.8 % 793 79.7 % 154 15.5 % 38 3.8 %
Dondero ES 711 387 54.4 % 324 45.6 % 3 0.4 % 51 7.2 % 374 52.6 % 64 9.0 % 219 30.8 %
CSNHS East 123 46 37.4 % 77 62.6 % 2 1.6 % 21 17.1 % 29 23.6 % 24 19.5 % 47 38.2 %
Crestwood ES 703 366 52.1 % 337 47.9 % 3 0.4 % 28 4.0 % 571 81.2 % 39 5.5 % 62 8.8 %
Cram MS 1,539 784 50.9 % 755 49.1 % 17 1.1 % 186 12.1 % 462 30.0 % 331 21.5 % 543 35.3 %
Deskin ES 788 425 53.9 % 363 46.1 % 2 0.3 % 55 7.0 % 216 27.4 % 112 14.2 % 403 51.1 %
Desert Willow School 38 20 52.6 % 18 47.4 % N/A N/A N/A N/A 5 13.2 % 4 10.5 % 29 76.3 %
Desert Rose HS 422 224 53.1 % 198 46.9 % 1 0.2 % 20 4.7 % 177 41.9 % 165 39.1 % 59 14.0 %
Dickens ES 731 368 50.3 % 363 49.7 % 3 0.4 % 88 12.0 % 260 35.6 % 203 27.8 % 177 24.2 %
Diaz ES 599 310 51.8 % 289 48.2 % 1 0.2 % 13 2.2 % 430 71.8 % 104 17.4 % 51 8.5 %
Detwiler ES 694 333 48.0 % 361 52.0 % 6 0.9 % 37 5.3 % 434 62.5 % 170 24.5 % 47 6.8 %
Del Sol HS 2,326 1,219 52.4 % 1,107 47.6 % 19 0.8 % 153 6.6 % 1,239 53.3 % 271 11.7 % 644 27.7 %
Decker ES 727 353 48.6 % 374 51.4 % 4 0.6 % 93 12.8 % 415 57.1 % 55 7.6 % 160 22.0 %
Dearing ES 848 413 48.7 % 435 51.3 % 11 1.3 % 25 2.9 % 535 63.1 % 149 17.6 % 128 15.1 %
Desert Oasis HS 1,534 815 53.1 % 719 46.9 % 9 0.6 % 363 23.7 % 375 24.4 % 212 13.8 % 575 37.5 %
Desert Pines HS 2,755 1,423 51.7 % 1,332 48.3 % 10 0.4 % 87 3.2 % 2,026 73.5 % 417 15.1 % 215 7.8 %
Derfelt ES 476 243 51.1 % 233 48.9 % 4 0.8 % 39 8.2 % 91 19.1 % 68 14.3 % 274 57.6 %
Clark County Schools
‘N/A’ indicates a population of zero.
Total Students Male Female
American Indian/Alaskan
Native
Asian/Pacific Islander Hispanic
Black/African American White
# # % # % # % # % # % # % # %
Page 5 of 125
2008-2009 Accountability Report
Website: www.nevadareportcard.com Clark County School District
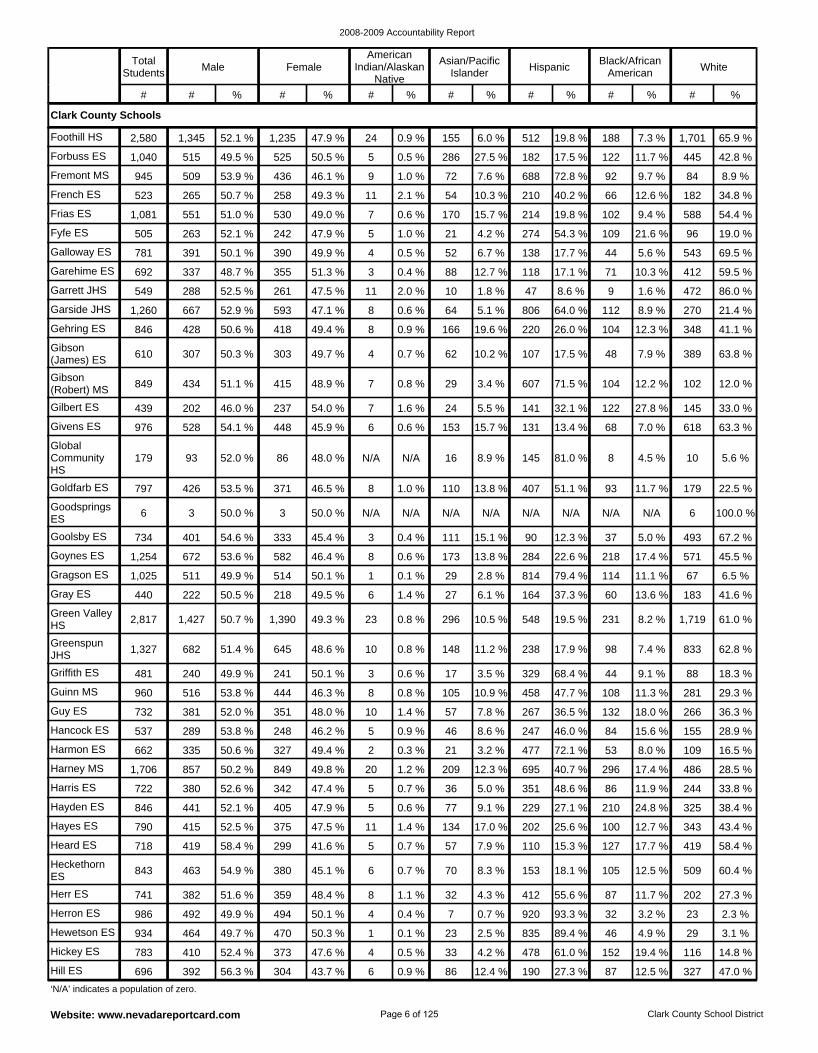
Heard ES 718 419 58.4 % 299 41.6 % 5 0.7 % 57 7.9 % 110 15.3 % 127 17.7 % 419 58.4 %
Hayes ES 790 415 52.5 % 375 47.5 % 11 1.4 % 134 17.0 % 202 25.6 % 100 12.7 % 343 43.4 %
Hayden ES 846 441 52.1 % 405 47.9 % 5 0.6 % 77 9.1 % 229 27.1 % 210 24.8 % 325 38.4 %
Herron ES 986 492 49.9 % 494 50.1 % 4 0.4 % 7 0.7 % 920 93.3 % 32 3.2 % 23 2.3 %
Herr ES 741 382 51.6 % 359 48.4 % 8 1.1 % 32 4.3 % 412 55.6 % 87 11.7 % 202 27.3 %
Heckethorn ES 843 463 54.9 % 380 45.1 % 6 0.7 % 70 8.3 % 153 18.1 % 105 12.5 % 509 60.4 %
Harris ES 722 380 52.6 % 342 47.4 % 5 0.7 % 36 5.0 % 351 48.6 % 86 11.9 % 244 33.8 %
Guy ES 732 381 52.0 % 351 48.0 % 10 1.4 % 57 7.8 % 267 36.5 % 132 18.0 % 266 36.3 %
Guinn MS 960 516 53.8 % 444 46.3 % 8 0.8 % 105 10.9 % 458 47.7 % 108 11.3 % 281 29.3 %
Harney MS 1,706 857 50.2 % 849 49.8 % 20 1.2 % 209 12.3 % 695 40.7 % 296 17.4 % 486 28.5 %
Harmon ES 662 335 50.6 % 327 49.4 % 2 0.3 % 21 3.2 % 477 72.1 % 53 8.0 % 109 16.5 %
Hancock ES 537 289 53.8 % 248 46.2 % 5 0.9 % 46 8.6 % 247 46.0 % 84 15.6 % 155 28.9 %
Hill ES 696 392 56.3 % 304 43.7 % 6 0.9 % 86 12.4 % 190 27.3 % 87 12.5 % 327 47.0 %
Hickey ES 783 410 52.4 % 373 47.6 % 4 0.5 % 33 4.2 % 478 61.0 % 152 19.4 % 116 14.8 %
Hewetson ES 934 464 49.7 % 470 50.3 % 1 0.1 % 23 2.5 % 835 89.4 % 46 4.9 % 29 3.1 %
Greenspun JHS 1,327 682 51.4 % 645 48.6 % 10 0.8 % 148 11.2 % 238 17.9 % 98 7.4 % 833 62.8 %
Galloway ES 781 391 50.1 % 390 49.9 % 4 0.5 % 52 6.7 % 138 17.7 % 44 5.6 % 543 69.5 %
Fyfe ES 505 263 52.1 % 242 47.9 % 5 1.0 % 21 4.2 % 274 54.3 % 109 21.6 % 96 19.0 %
Frias ES 1,081 551 51.0 % 530 49.0 % 7 0.6 % 170 15.7 % 214 19.8 % 102 9.4 % 588 54.4 %
Garside JHS 1,260 667 52.9 % 593 47.1 % 8 0.6 % 64 5.1 % 806 64.0 % 112 8.9 % 270 21.4 %
Garrett JHS 549 288 52.5 % 261 47.5 % 11 2.0 % 10 1.8 % 47 8.6 % 9 1.6 % 472 86.0 %
Garehime ES 692 337 48.7 % 355 51.3 % 3 0.4 % 88 12.7 % 118 17.1 % 71 10.3 % 412 59.5 %
Foothill HS 2,580 1,345 52.1 % 1,235 47.9 % 24 0.9 % 155 6.0 % 512 19.8 % 188 7.3 % 1,701 65.9 %
Griffith ES 481 240 49.9 % 241 50.1 % 3 0.6 % 17 3.5 % 329 68.4 % 44 9.1 % 88 18.3 %
French ES 523 265 50.7 % 258 49.3 % 11 2.1 % 54 10.3 % 210 40.2 % 66 12.6 % 182 34.8 %
Fremont MS 945 509 53.9 % 436 46.1 % 9 1.0 % 72 7.6 % 688 72.8 % 92 9.7 % 84 8.9 %
Forbuss ES 1,040 515 49.5 % 525 50.5 % 5 0.5 % 286 27.5 % 182 17.5 % 122 11.7 % 445 42.8 %
Gehring ES 846 428 50.6 % 418 49.4 % 8 0.9 % 166 19.6 % 220 26.0 % 104 12.3 % 348 41.1 %
Goynes ES 1,254 672 53.6 % 582 46.4 % 8 0.6 % 173 13.8 % 284 22.6 % 218 17.4 % 571 45.5 %
Goolsby ES 734 401 54.6 % 333 45.4 % 3 0.4 % 111 15.1 % 90 12.3 % 37 5.0 % 493 67.2 %
Goodsprings ES 6 3 50.0 % 3 50.0 % N/A N/A N/A N/A N/A N/A N/A N/A 6 100.0 %
Green Valley HS 2,817 1,427 50.7 % 1,390 49.3 % 23 0.8 % 296 10.5 % 548 19.5 % 231 8.2 % 1,719 61.0 %
Gray ES 440 222 50.5 % 218 49.5 % 6 1.4 % 27 6.1 % 164 37.3 % 60 13.6 % 183 41.6 %
Gragson ES 1,025 511 49.9 % 514 50.1 % 1 0.1 % 29 2.8 % 814 79.4 % 114 11.1 % 67 6.5 %
Gilbert ES 439 202 46.0 % 237 54.0 % 7 1.6 % 24 5.5 % 141 32.1 % 122 27.8 % 145 33.0 %
Gibson (Robert) MS 849 434 51.1 % 415 48.9 % 7 0.8 % 29 3.4 % 607 71.5 % 104 12.2 % 102 12.0 %
Gibson (James) ES 610 307 50.3 % 303 49.7 % 4 0.7 % 62 10.2 % 107 17.5 % 48 7.9 % 389 63.8 %
Global Community HS
179 93 52.0 % 86 48.0 % N/A N/A 16 8.9 % 145 81.0 % 8 4.5 % 10 5.6 %
Goldfarb ES 797 426 53.5 % 371 46.5 % 8 1.0 % 110 13.8 % 407 51.1 % 93 11.7 % 179 22.5 %
Givens ES 976 528 54.1 % 448 45.9 % 6 0.6 % 153 15.7 % 131 13.4 % 68 7.0 % 618 63.3 %
Clark County Schools
‘N/A’ indicates a population of zero.
Total Students Male Female
American Indian/Alaskan
Native
Asian/Pacific Islander Hispanic
Black/African American White
# # % # % # % # % # % # % # %
Page 6 of 125
2008-2009 Accountability Report
Website: www.nevadareportcard.com Clark County School District
Leavitt MS 1,589 805 50.7 % 784 49.3 % 16 1.0 % 126 7.9 % 300 18.9 % 209 13.2 % 938 59.0 %
Lawrence JHS 1,485 728 49.0 % 757 51.0 % 13 0.9 % 304 20.5 % 436 29.4 % 190 12.8 % 542 36.5 %
Laughlin Jr/Sr HS 451 236 52.3 % 215 47.7 % 4 0.9 % 17 3.8 % 102 22.6 % 18 4.0 % 310 68.7 %
Lied MS 1,485 738 49.7 % 747 50.3 % 11 0.7 % 120 8.1 % 347 23.4 % 263 17.7 % 744 50.1 %
Liberty HS 1,853 984 53.1 % 869 46.9 % 11 0.6 % 443 23.9 % 462 24.9 % 282 15.2 % 655 35.3 %
Legacy HS 2,624 1,360 51.8 % 1,264 48.2 % 12 0.5 % 254 9.7 % 733 27.9 % 815 31.1 % 810 30.9 %
Lake ES 945 501 53.0 % 444 47.0 % 2 0.2 % 52 5.5 % 663 70.2 % 118 12.5 % 110 11.6 %
Knudson MS 1,270 495 39.0 % 775 61.0 % 8 0.6 % 90 7.1 % 701 55.2 % 156 12.3 % 315 24.8 %
Las Vegas HS 3,288 1,750 53.2 % 1,538 46.8 % 23 0.7 % 309 9.4 % 1,707 51.9 % 450 13.7 % 799 24.3 %
Las Vegas Academy 1,618 506 31.3 % 1,112 68.7 % 10 0.6 % 189 11.7 % 276 17.1 % 205 12.7 % 938 58.0 %
Lamping ES 1,017 504 49.6 % 513 50.4 % 8 0.8 % 114 11.2 % 134 13.2 % 30 2.9 % 731 71.9 %
Lowman ES 749 389 51.9 % 360 48.1 % 14 1.9 % 22 2.9 % 405 54.1 % 196 26.2 % 112 15.0 %
Long ES 820 418 51.0 % 402 49.0 % 2 0.2 % 60 7.3 % 599 73.0 % 67 8.2 % 92 11.2 %
Lincoln ES 731 376 51.4 % 355 48.6 % N/A N/A 7 1.0 % 628 85.9 % 64 8.8 % 32 4.4 %
King (Martha) ES 470 247 52.6 % 223 47.4 % 10 2.1 % 9 1.9 % 37 7.9 % 6 1.3 % 408 86.8 %
Hyde Park MS 1,730 872 50.4 % 858 49.6 % 13 0.8 % 331 19.1 % 580 33.5 % 166 9.6 % 640 37.0 %
Hummel ES 832 434 52.2 % 398 47.8 % 12 1.4 % 150 18.0 % 239 28.7 % 86 10.3 % 345 41.5 %
Indian Springs Schools
242 135 55.8 % 107 44.2 % 15 6.2 % 18 7.4 % 16 6.6 % 11 4.5 % 182 75.2 %
Jacobson ES 601 301 50.1 % 300 49.9 % 5 0.8 % 55 9.2 % 236 39.3 % 85 14.1 % 220 36.6 %
Iverson ES 920 454 49.3 % 466 50.7 % 11 1.2 % 132 14.3 % 401 43.6 % 121 13.2 % 255 27.7 %
Hughes MS 615 300 48.8 % 315 51.2 % 7 1.1 % 16 2.6 % 279 45.4 % 8 1.3 % 305 49.6 %
King (Martin Luther Jr) ES 505 271 53.7 % 234 46.3 % 2 0.4 % 19 3.8 % 292 57.8 % 103 20.4 % 89 17.6 %
Hinman ES 675 340 50.4 % 335 49.6 % 10 1.5 % 43 6.4 % 265 39.3 % 120 17.8 % 237 35.1 %
Hollingsworth ES 844 447 53.0 % 397 47.0 % 7 0.8 % 46 5.5 % 590 69.9 % 104 12.3 % 97 11.5 %
Hoggard ES 424 223 52.6 % 201 47.4 % 5 1.2 % 46 10.8 % 175 41.3 % 110 25.9 % 88 20.8 %
Jeffers ES 843 447 53.0 % 396 47.0 % 3 0.4 % 3 0.4 % 766 90.9 % 42 5.0 % 29 3.4 %
Keller MS 1,472 804 54.6 % 668 45.4 % 4 0.3 % 101 6.9 % 930 63.2 % 177 12.0 % 260 17.7 %
Katz ES 704 385 54.7 % 319 45.3 % 9 1.3 % 81 11.5 % 267 37.9 % 113 16.1 % 234 33.2 %
Kelly ES 318 168 52.8 % 150 47.2 % 1 0.3 % 4 1.3 % 60 18.9 % 236 74.2 % 17 5.3 %
Kim ES 639 326 51.0 % 313 49.0 % 6 0.9 % 99 15.5 % 257 40.2 % 37 5.8 % 240 37.6 %
Kesterson ES 716 381 53.2 % 335 46.8 % 6 0.8 % 82 11.5 % 153 21.4 % 48 6.7 % 427 59.6 %
Kahre ES 595 291 48.9 % 304 51.1 % 5 0.8 % 48 8.1 % 142 23.9 % 87 14.6 % 313 52.6 %
Johnson JHS 1,179 588 49.9 % 591 50.1 % 8 0.7 % 90 7.6 % 377 32.0 % 169 14.3 % 535 45.4 %
Jeffrey Behavior Jr/ Sr HS
61 41 67.2 % 20 32.8 % 1 1.6 % 3 4.9 % 19 31.1 % 34 55.7 % 4 6.6 %
Johnston MS 1,371 712 51.9 % 659 48.1 % 14 1.0 % 114 8.3 % 509 37.1 % 459 33.5 % 275 20.1 %
Jydstrup ES 633 334 52.8 % 299 47.2 % 4 0.6 % 136 21.5 % 206 32.5 % 122 19.3 % 165 26.1 %
Juvenile Detention 128 106 82.8 % 22 17.2 % 1 0.8 % 1 0.8 % 37 28.9 % 58 45.3 % 31 24.2 %
Clark County Schools
‘N/A’ indicates a population of zero.
Total Students Male Female
American Indian/Alaskan
Native
Asian/Pacific Islander Hispanic
Black/African American White
# # % # % # % # % # % # % # %
Page 7 of 125
2008-2009 Accountability Report
Website: www.nevadareportcard.com Clark County School District
Morrow ES 867 445 51.3 % 422 48.7 % 5 0.6 % 74 8.5 % 174 20.1 % 20 2.3 % 594 68.5 %
Morris Sunset East HS 125 54 43.2 % 71 56.8 % 1 0.8 % 3 2.4 % 92 73.6 % 20 16.0 % 9 7.2 %
Morris Behavior Jr/Sr HS
43 34 79.1 % 9 20.9 % N/A N/A N/A N/A 20 46.5 % 16 37.2 % 7 16.3 %
Newton ES 772 387 50.1 % 385 49.9 % 5 0.6 % 51 6.6 % 142 18.4 % 50 6.5 % 524 67.9 %
Neal ES 745 380 51.0 % 365 49.0 % 6 0.8 % 48 6.4 % 163 21.9 % 109 14.6 % 419 56.2 %
Mountain View ES 628 318 50.6 % 310 49.4 % 2 0.3 % 33 5.3 % 382 60.8 % 69 11.0 % 142 22.6 %
Mojave HS 2,270 1,167 51.4 % 1,103 48.6 % 12 0.5 % 149 6.6 % 946 41.7 % 763 33.6 % 400 17.6 %
Moapa Valley HS 623 330 53.0 % 293 47.0 % 23 3.7 % 6 1.0 % 91 14.6 % 3 0.5 % 500 80.3 %
Moore ES 793 395 49.8 % 398 50.2 % 4 0.5 % 18 2.3 % 618 77.9 % 91 11.5 % 62 7.8 %
Monaco MS 1,413 736 52.1 % 677 47.9 % 2 0.1 % 34 2.4 % 1,138 80.5 % 152 10.8 % 87 6.2 %
Molasky JHS 1,505 754 50.1 % 751 49.9 % 14 0.9 % 121 8.0 % 438 29.1 % 272 18.1 % 660 43.9 %
NW CTA 1,314 553 42.1 % 761 57.9 % 12 0.9 % 155 11.8 % 306 23.3 % 192 14.6 % 649 49.4 %
Miller (Sandy) ES 601 304 50.6 % 297 49.4 % 5 0.8 % 41 6.8 % 315 52.4 % 81 13.5 % 159 26.5 %
Mack (Nate) ES 588 326 55.4 % 262 44.6 % 8 1.4 % 52 8.8 % 140 23.8 % 65 11.1 % 323 54.9 %
Mack (Jerome) MS 1,396 716 51.3 % 680 48.7 % 11 0.8 % 66 4.7 % 966 69.2 % 149 10.7 % 204 14.6 %
Lyon MS 449 224 49.9 % 225 50.1 % 20 4.5 % 3 0.7 % 64 14.3 % 5 1.1 % 357 79.5 %
Mannion MS 1,635 812 49.7 % 823 50.3 % 10 0.6 % 98 6.0 % 264 16.1 % 73 4.5 % 1,190 72.8 %
Manch ES 619 332 53.6 % 287 46.4 % 18 2.9 % 16 2.6 % 345 55.7 % 153 24.7 % 87 14.1 %
Mackey ES 508 262 51.6 % 246 48.4 % 1 0.2 % 41 8.1 % 180 35.4 % 212 41.7 % 74 14.6 %
Lummis ES 647 344 53.2 % 303 46.8 % 4 0.6 % 52 8.0 % 100 15.5 % 44 6.8 % 447 69.1 %
Mitchell ES 452 218 48.2 % 234 51.8 % 1 0.2 % 8 1.8 % 43 9.5 % 5 1.1 % 395 87.4 %
Lynch ES 877 444 50.6 % 433 49.4 % 2 0.2 % 19 2.2 % 687 78.3 % 107 12.2 % 62 7.1 %
Lunt ES 711 393 55.3 % 318 44.7 % 1 0.1 % 12 1.7 % 578 81.3 % 82 11.5 % 38 5.3 %
Lundy ES 9 5 55.6 % 4 44.4 % N/A N/A N/A N/A N/A N/A N/A N/A 9 100.0 %
Mendoza ES 747 395 52.9 % 352 47.1 % 6 0.8 % 52 7.0 % 526 70.4 % 48 6.4 % 115 15.4 %
McWilliams ES 713 362 50.8 % 351 49.2 % 5 0.7 % 16 2.2 % 547 76.7 % 67 9.4 % 78 10.9 %
McMillan ES 642 324 50.5 % 318 49.5 % 7 1.1 % 66 10.3 % 232 36.1 % 138 21.5 % 199 31.0 %
Miller (John) ES 121 58 47.9 % 63 52.1 % N/A N/A 13 10.7 % 53 43.8 % 19 15.7 % 36 29.8 %
Miller (Bob) MS 1,681 852 50.7 % 829 49.3 % 12 0.7 % 191 11.4 % 247 14.7 % 126 7.5 % 1,105 65.7 %
Miley Achievement Center
94 77 81.9 % 17 18.1 % 2 2.1 % 1 1.1 % 11 11.7 % 33 35.1 % 47 50.0 %
May ES 752 391 52.0 % 361 48.0 % 6 0.8 % 50 6.6 % 148 19.7 % 88 11.7 % 460 61.2 %
Martinez ES 614 311 50.7 % 303 49.3 % 6 1.0 % 7 1.1 % 456 74.3 % 121 19.7 % 24 3.9 %
Martin MS 1,350 648 48.0 % 702 52.0 % 9 0.7 % 74 5.5 % 928 68.7 % 160 11.9 % 179 13.3 %
McCaw ES 671 354 52.8 % 317 47.2 % 5 0.7 % 27 4.0 % 165 24.6 % 46 6.9 % 428 63.8 %
McDoniel ES 622 315 50.6 % 307 49.4 % 9 1.4 % 42 6.8 % 157 25.2 % 54 8.7 % 360 57.9 %
McCall ES 478 259 54.2 % 219 45.8 % 2 0.4 % 6 1.3 % 372 77.8 % 75 15.7 % 23 4.8 %
Clark County Schools
‘N/A’ indicates a population of zero.
Total Students Male Female
American Indian/Alaskan
Native
Asian/Pacific Islander Hispanic
Black/African American White
# # % # % # % # % # % # % # %
Page 8 of 125
2008-2009 Accountability Report
Website: www.nevadareportcard.com Clark County School District
Rowe ES 602 307 51.0 % 295 49.0 % 7 1.2 % 63 10.5 % 329 54.7 % 91 15.1 % 112 18.6 %
Roundy ES 773 385 49.8 % 388 50.2 % 3 0.4 % 30 3.9 % 638 82.5 % 49 6.3 % 53 6.9 %
Ronzone ES 806 428 53.1 % 378 46.9 % 6 0.7 % 12 1.5 % 544 67.5 % 135 16.7 % 109 13.5 %
Sandy Valley Jr/Sr HS 150 70 46.7 % 80 53.3 % 2 1.3 % 7 4.7 % 44 29.3 % 4 2.7 % 93 62.0 %
Sandy Valley ES 123 61 49.6 % 62 50.4 % 1 0.8 % 5 4.1 % 27 22.0 % 4 3.3 % 86 69.9 %
Rundle ES 950 489 51.5 % 461 48.5 % 4 0.4 % 51 5.4 % 645 67.9 % 114 12.0 % 136 14.3 %
Robison MS 1,067 573 53.7 % 494 46.3 % 6 0.6 % 40 3.7 % 856 80.2 % 104 9.7 % 61 5.7 %
Ries ES 1,179 598 50.7 % 581 49.3 % 5 0.4 % 240 20.4 % 286 24.3 % 166 14.1 % 482 40.9 %
Ronnow ES 874 427 48.9 % 447 51.1 % 7 0.8 % 12 1.4 % 773 88.4 % 39 4.5 % 43 4.9 %
Rogich MS 1,792 918 51.2 % 874 48.8 % 19 1.1 % 271 15.1 % 252 14.1 % 173 9.7 % 1,077 60.1 %
Rogers ES 828 393 47.5 % 435 52.5 % 7 0.8 % 184 22.2 % 226 27.3 % 98 11.8 % 313 37.8 %
Scherkenbach ES 694 373 53.7 % 321 46.3 % 4 0.6 % 57 8.2 % 99 14.3 % 76 11.0 % 458 66.0 %
Sawyer MS 1,360 707 52.0 % 653 48.0 % 20 1.5 % 237 17.4 % 501 36.8 % 170 12.5 % 432 31.8 %
Saville MS 1,533 807 52.6 % 726 47.4 % 11 0.7 % 125 8.2 % 276 18.0 % 243 15.9 % 878 57.3 %
Schorr ES 818 415 50.7 % 403 49.3 % 5 0.6 % 189 23.1 % 189 23.1 % 70 8.6 % 365 44.6 %
Schofield MS 1,441 759 52.7 % 682 47.3 % 19 1.3 % 164 11.4 % 364 25.3 % 140 9.7 % 754 52.3 %
Paradise ES 591 320 54.1 % 271 45.9 % 3 0.5 % 44 7.4 % 326 55.2 % 123 20.8 % 95 16.1 %
Palo Verde HS 3,323 1,721 51.8 % 1,602 48.2 % 20 0.6 % 382 11.5 % 568 17.1 % 379 11.4 % 1,974 59.4 %
Park ES 868 468 53.9 % 400 46.1 % 6 0.7 % 57 6.6 % 602 69.4 % 102 11.8 % 101 11.6 %
Perkins (Dr. Claude G.) ES
753 407 54.1 % 346 45.9 % 7 0.9 % 67 8.9 % 347 46.1 % 221 29.3 % 111 14.7 %
Parson ES 619 317 51.2 % 302 48.8 % 8 1.3 % 32 5.2 % 202 32.6 % 137 22.1 % 240 38.8 %
Orr MS 974 512 52.6 % 462 47.4 % 7 0.7 % 81 8.3 % 552 56.7 % 216 22.2 % 118 12.1 %
Roberts ES 835 432 51.7 % 403 48.3 % 2 0.2 % 99 11.9 % 207 24.8 % 78 9.3 % 449 53.8 %
O'Callaghan MS 1,517 754 49.7 % 763 50.3 % 13 0.9 % 100 6.6 % 895 59.0 % 140 9.2 % 369 24.3 %
Ober ES 768 395 51.4 % 373 48.6 % 8 1.0 % 105 13.7 % 121 15.8 % 62 8.1 % 472 61.5 %
O'Roarke ES 753 393 52.2 % 360 47.8 % 5 0.7 % 66 8.8 % 135 17.9 % 58 7.7 % 489 64.9 %
Perkins (Ute) ES 185 83 44.9 % 102 55.1 % 30 16.2 % 3 1.6 % 47 25.4 % 5 2.7 % 100 54.1 %
Reed ES 805 434 53.9 % 371 46.1 % 7 0.9 % 34 4.2 % 406 50.4 % 191 23.7 % 167 20.7 %
Red Rock ES 707 357 50.5 % 350 49.5 % 10 1.4 % 32 4.5 % 452 63.9 % 82 11.6 % 131 18.5 %
Reedom ES 660 341 51.7 % 319 48.3 % N/A N/A 191 28.9 % 117 17.7 % 61 9.2 % 291 44.1 %
Rhodes ES 815 410 50.3 % 405 49.7 % 8 1.0 % 58 7.1 % 130 16.0 % 88 10.8 % 531 65.2 %
Reid ES 29 16 55.2 % 13 44.8 % 1 3.4 % N/A N/A 2 6.9 % N/A N/A 26 89.7 %
Rancho HS 3,644 1,870 51.3 % 1,774 48.7 % 13 0.4 % 184 5.0 % 2,661 73.0 % 360 9.9 % 426 11.7 %
Peterson Behavior Jr/Sr HS
57 44 77.2 % 13 22.8 % N/A N/A 3 5.3 % 14 24.6 % 21 36.8 % 19 33.3 %
Petersen ES 799 393 49.2 % 406 50.8 % 4 0.5 % 22 2.8 % 576 72.1 % 143 17.9 % 54 6.8 %
Piggott ES 487 259 53.2 % 228 46.8 % 5 1.0 % 69 14.2 % 90 18.5 % 61 12.5 % 262 53.8 %
Priest ES 851 440 51.7 % 411 48.3 % 6 0.7 % 53 6.2 % 384 45.1 % 223 26.2 % 185 21.7 %
Pittman ES 657 326 49.6 % 331 50.4 % 11 1.7 % 23 3.5 % 437 66.5 % 77 11.7 % 109 16.6 %
Clark County Schools
‘N/A’ indicates a population of zero.
Total Students Male Female
American Indian/Alaskan
Native
Asian/Pacific Islander Hispanic
Black/African American White
# # % # % # % # % # % # % # %
Page 9 of 125
2008-2009 Accountability Report
Website: www.nevadareportcard.com Clark County School District
Tate ES 670 357 53.3 % 313 46.7 % 5 0.7 % 5 0.7 % 448 66.9 % 150 22.4 % 62 9.3 %
Tartan ES 946 496 52.4 % 450 47.6 % 7 0.7 % 94 9.9 % 301 31.8 % 297 31.4 % 247 26.1 %
Tarr ES 661 361 54.6 % 300 45.4 % 7 1.1 % 50 7.6 % 101 15.3 % 89 13.5 % 414 62.6 %
Taylor (Robert) ES 478 254 53.1 % 224 46.9 % 4 0.8 % 20 4.2 % 172 36.0 % 100 20.9 % 182 38.1 %
Taylor (Glen) ES 872 435 49.9 % 437 50.1 % 8 0.9 % 151 17.3 % 129 14.8 % 45 5.2 % 539 61.8 %
Sunrise Acres ES 834 424 50.8 % 410 49.2 % 8 1.0 % 8 1.0 % 678 81.3 % 108 12.9 % 32 3.8 %
Summit View Jr/Sr HS 63 63 100.0 % N/A N/A 2 3.2 % 4 6.3 % 19 30.2 % 18 28.6 % 20 31.7 %
Tarkanian MS 1,164 586 50.3 % 578 49.7 % 13 1.1 % 208 17.9 % 247 21.2 % 159 13.7 % 537 46.1 %
Tanaka ES 852 447 52.5 % 405 47.5 % 6 0.7 % 200 23.5 % 199 23.4 % 137 16.1 % 310 36.4 %
Swainston MS 1,403 719 51.2 % 684 48.8 % 11 0.8 % 82 5.8 % 578 41.2 % 423 30.1 % 309 22.0 %
Stewart School 112 78 69.6 % 34 30.4 % 1 0.9 % 8 7.1 % 34 30.4 % 23 20.5 % 46 41.1 %
Silverado HS 2,584 1,343 52.0 % 1,241 48.0 % 16 0.6 % 342 13.2 % 614 23.8 % 250 9.7 % 1,362 52.7 %
Sierra Vista HS 2,648 1,414 53.4 % 1,234 46.6 % 23 0.9 % 765 28.9 % 544 20.5 % 368 13.9 % 948 35.8 %
Shadow Ridge HS 2,235 1,150 51.5 % 1,085 48.5 % 17 0.8 % 202 9.0 % 420 18.8 % 386 17.3 % 1,210 54.1 %
Smalley ES 922 484 52.5 % 438 47.5 % 7 0.8 % 55 6.0 % 130 14.1 % 46 5.0 % 684 74.2 %
Simmons ES 876 466 53.2 % 410 46.8 % 6 0.7 % 131 15.0 % 276 31.5 % 124 14.2 % 339 38.7 %
Silvestri JHS 1,565 791 50.5 % 774 49.5 % 13 0.8 % 307 19.6 % 386 24.7 % 201 12.8 % 658 42.0 %
Scott ES 767 403 52.5 % 364 47.5 % 3 0.4 % 78 10.2 % 301 39.2 % 189 24.6 % 196 25.6 %
Summit School 14 14 100.0 % N/A N/A N/A N/A N/A N/A 5 35.7 % 2 14.3 % 7 50.0 %
Sewell ES 743 393 52.9 % 350 47.1 % 8 1.1 % 42 5.7 % 208 28.0 % 97 13.1 % 388 52.2 %
Sedway MS 1,476 762 51.6 % 714 48.4 % 3 0.2 % 85 5.8 % 807 54.7 % 433 29.3 % 148 10.0 %
SE CTA 1,857 861 46.4 % 996 53.6 % 13 0.7 % 168 9.0 % 905 48.7 % 189 10.2 % 582 31.3 %
Squires ES 812 421 51.8 % 391 48.2 % 5 0.6 % 10 1.2 % 721 88.8 % 30 3.7 % 46 5.7 %
Spring Valley HS 2,472 1,296 52.4 % 1,176 47.6 % 15 0.6 % 513 20.8 % 594 24.0 % 334 13.5 % 1,016 41.1 %
Spring Mtn Jr/Sr HS 94 94 100.0 % N/A N/A N/A N/A 2 2.1 % 35 37.2 % 38 40.4 % 19 20.2 %
Steele ES 944 476 50.4 % 468 49.6 % 7 0.7 % 301 31.9 % 181 19.2 % 124 13.1 % 331 35.1 %
Staton ES 799 401 50.2 % 398 49.8 % 3 0.4 % 93 11.6 % 105 13.1 % 63 7.9 % 535 67.0 %
Stanford ES 689 360 52.2 % 329 47.8 % 7 1.0 % 27 3.9 % 436 63.3 % 60 8.7 % 159 23.1 %
Smith (J.D.) MS 1,094 559 51.1 % 535 48.9 % 3 0.3 % 11 1.0 % 955 87.3 % 89 8.1 % 36 3.3 %
Smith (Helen) ES 572 309 54.0 % 263 46.0 % 10 1.7 % 37 6.5 % 200 35.0 % 33 5.8 % 292 51.0 %
Smith (Hal) ES 766 399 52.1 % 367 47.9 % 13 1.7 % 64 8.4 % 303 39.6 % 150 19.6 % 236 30.8 %
South Continuation Jr/Sr HS
116 96 82.8 % 20 17.2 % 1 0.9 % 8 6.9 % 46 39.7 % 33 28.4 % 28 24.1 %
Southwest Behavior Jr/Sr HS
38 28 73.7 % 10 26.3 % 1 2.6 % 2 5.3 % 7 18.4 % 12 31.6 % 16 42.1 %
Snyder ES 873 478 54.8 % 395 45.2 % 3 0.3 % 31 3.6 % 613 70.2 % 94 10.8 % 132 15.1 %
Clark County Schools
‘N/A’ indicates a population of zero.
Total Students Male Female
American Indian/Alaskan
Native
Asian/Pacific Islander Hispanic
Black/African American White
# # % # % # % # % # % # % # %
Page 10 of 125
2008-2009 Accountability Report
Website: www.nevadareportcard.com Clark County School District
West Prep ES 393 227 57.8 % 166 42.2 % 2 0.5 % 7 1.8 % 202 51.4 % 158 40.2 % 24 6.1 %
Western HS 2,406 1,273 52.9 % 1,133 47.1 % 14 0.6 % 95 3.9 % 1,396 58.0 % 542 22.5 % 359 14.9 %
Whitney ES 591 294 49.7 % 297 50.3 % 6 1.0 % 31 5.2 % 316 53.5 % 90 15.2 % 148 25.0 %
White MS 1,229 634 51.6 % 595 48.4 % 11 0.9 % 142 11.6 % 374 30.4 % 131 10.7 % 571 46.5 %
West Prep at West Hall 1,157 606 52.4 % 551 47.6 % 5 0.4 % 40 3.5 % 588 50.8 % 476 41.1 % 48 4.1 %
Washington Continuation JHS
44 36 81.8 % 8 18.2 % N/A N/A N/A N/A 21 47.7 % 18 40.9 % 5 11.4 %
Watson ES 845 440 52.1 % 405 47.9 % 1 0.1 % 83 9.8 % 329 38.9 % 202 23.9 % 230 27.2 %
Wengert ES 749 388 51.8 % 361 48.2 % 6 0.8 % 47 6.3 % 488 65.2 % 74 9.9 % 134 17.9 %
Webb MS 1,657 864 52.1 % 793 47.9 % 7 0.4 % 284 17.1 % 255 15.4 % 139 8.4 % 972 58.7 %
Wasden ES 666 385 57.8 % 281 42.2 % 8 1.2 % 62 9.3 % 331 49.7 % 80 12.0 % 185 27.8 %
Wilhelm ES 647 329 50.9 % 318 49.1 % 4 0.6 % 63 9.7 % 261 40.3 % 225 34.8 % 94 14.5 %
Wiener ES 692 348 50.3 % 344 49.7 % 6 0.9 % 71 10.3 % 176 25.4 % 81 11.7 % 358 51.7 %
Twin Lakes ES 627 327 52.2 % 300 47.8 % 1 0.2 % 15 2.4 % 479 76.4 % 71 11.3 % 61 9.7 %
Treem ES 695 351 50.5 % 344 49.5 % 5 0.7 % 74 10.6 % 241 34.7 % 78 11.2 % 297 42.7 %
Twitchell ES 894 468 52.3 % 426 47.7 % 12 1.3 % 105 11.7 % 144 16.1 % 53 5.9 % 580 64.9 %
Valley HS 2,968 1,442 48.6 % 1,526 51.4 % 24 0.8 % 229 7.7 % 1,818 61.3 % 420 14.2 % 477 16.1 %
Ullom ES 710 375 52.8 % 335 47.2 % 5 0.7 % 26 3.7 % 529 74.5 % 51 7.2 % 99 13.9 %
Tomiyasu ES 650 337 51.8 % 313 48.2 % 7 1.1 % 49 7.5 % 238 36.6 % 49 7.5 % 307 47.2 %
Thomas ES 765 399 52.2 % 366 47.8 % 8 1.0 % 64 8.4 % 497 65.0 % 113 14.8 % 83 10.8 %
Thiriot ES 606 314 51.8 % 292 48.2 % 9 1.5 % 70 11.6 % 290 47.9 % 100 16.5 % 137 22.6 %
Thompson ES 899 487 54.2 % 412 45.8 % 5 0.6 % 116 12.9 % 179 19.9 % 153 17.0 % 446 49.6 %
Tobler ES 531 277 52.2 % 254 47.8 % 2 0.4 % 24 4.5 % 167 31.5 % 84 15.8 % 254 47.8 %
Thorpe ES 755 392 51.9 % 363 48.1 % 3 0.4 % 93 12.3 % 240 31.8 % 72 9.5 % 347 46.0 %
Walker International ES
853 401 47.0 % 452 53.0 % 4 0.5 % 50 5.9 % 157 18.4 % 45 5.3 % 597 70.0 %
Von Tobel MS 1,158 615 53.1 % 543 46.9 % 4 0.3 % 7 0.6 % 939 81.1 % 133 11.5 % 75 6.5 %
Ward (Gene) ES 690 347 50.3 % 343 49.7 % 2 0.3 % 53 7.7 % 500 72.5 % 60 8.7 % 75 10.9 %
Warren ES 674 345 51.2 % 329 48.8 % 2 0.3 % 23 3.4 % 513 76.1 % 45 6.7 % 91 13.5 %
Ward (Kitty) ES 1,121 600 53.5 % 521 46.5 % 9 0.8 % 109 9.7 % 160 14.3 % 119 10.6 % 724 64.6 %
Virtual HS 146 55 37.7 % 91 62.3 % N/A N/A 7 4.8 % 21 14.4 % 10 6.8 % 108 74.0 %
Variety School 146 122 83.6 % 24 16.4 % 3 2.1 % 6 4.1 % 24 16.4 % 53 36.3 % 60 41.1 %
Vanderburg ES 823 427 51.9 % 396 48.1 % 5 0.6 % 91 11.1 % 106 12.9 % 43 5.2 % 578 70.2 %
Vegas Verdes ES 608 308 50.7 % 300 49.3 % 3 0.5 % 35 5.8 % 482 79.3 % 32 5.3 % 56 9.2 %
Virgin Valley HS 762 383 50.3 % 379 49.7 % 9 1.2 % 26 3.4 % 333 43.7 % 13 1.7 % 381 50.0 %
Virgin Valley ES 782 382 48.8 % 400 51.2 % 10 1.3 % 30 3.8 % 344 44.0 % 9 1.2 % 389 49.7 %
Clark County Schools
‘N/A’ indicates a population of zero.
Total Students Male Female
American Indian/Alaskan
Native
Asian/Pacific Islander Hispanic
Black/African American White
# # % # % # % # % # % # % # %
Page 11 of 125
2008-2009 Accountability Report
Website: www.nevadareportcard.com Clark County School District
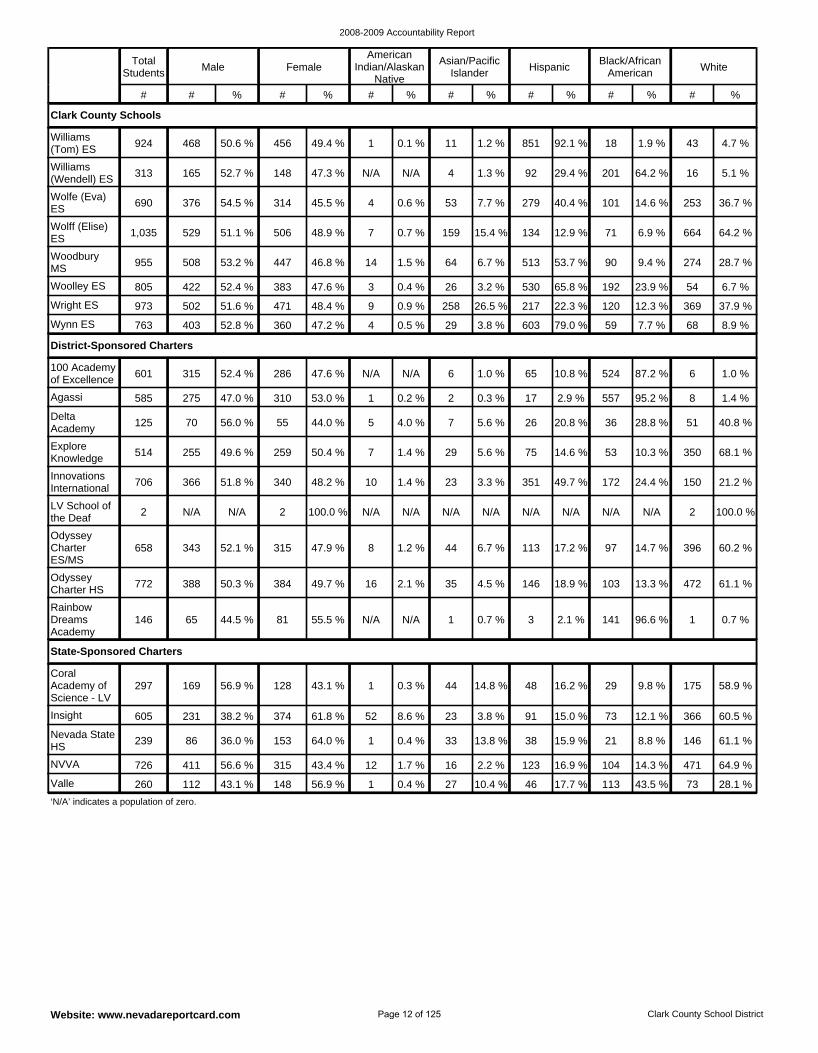
Insight 605 231 38.2 % 374 61.8 % 52 8.6 % 23 3.8 % 91 15.0 % 73 12.1 % 366 60.5 %
Coral Academy of Science - LV
297 169 56.9 % 128 43.1 % 1 0.3 % 44 14.8 % 48 16.2 % 29 9.8 % 175 58.9 %
NVVA 726 411 56.6 % 315 43.4 % 12 1.7 % 16 2.2 % 123 16.9 % 104 14.3 % 471 64.9 %
Valle 260 112 43.1 % 148 56.9 % 1 0.4 % 27 10.4 % 46 17.7 % 113 43.5 % 73 28.1 %
Nevada State HS 239 86 36.0 % 153 64.0 % 1 0.4 % 33 13.8 % 38 15.9 % 21 8.8 % 146 61.1 %
State-Sponsored Charters
Explore Knowledge 514 255 49.6 % 259 50.4 % 7 1.4 % 29 5.6 % 75 14.6 % 53 10.3 % 350 68.1 %
Innovations International 706 366 51.8 % 340 48.2 % 10 1.4 % 23 3.3 % 351 49.7 % 172 24.4 % 150 21.2 %
Rainbow Dreams Academy
146 65 44.5 % 81 55.5 % N/A N/A 1 0.7 % 3 2.1 % 141 96.6 % 1 0.7 %
Delta Academy 125 70 56.0 % 55 44.0 % 5 4.0 % 7 5.6 % 26 20.8 % 36 28.8 % 51 40.8 %
Odyssey Charter HS 772 388 50.3 % 384 49.7 % 16 2.1 % 35 4.5 % 146 18.9 % 103 13.3 % 472 61.1 %
Agassi 585 275 47.0 % 310 53.0 % 1 0.2 % 2 0.3 % 17 2.9 % 557 95.2 % 8 1.4 %
LV School of the Deaf 2 N/A N/A 2 100.0 % N/A N/A N/A N/A N/A N/A N/A N/A 2 100.0 %
Odyssey Charter ES/MS
658 343 52.1 % 315 47.9 % 8 1.2 % 44 6.7 % 113 17.2 % 97 14.7 % 396 60.2 %
100 Academy of Excellence 601 315 52.4 % 286 47.6 % N/A N/A 6 1.0 % 65 10.8 % 524 87.2 % 6 1.0 %
District-Sponsored Charters
Wolfe (Eva) ES 690 376 54.5 % 314 45.5 % 4 0.6 % 53 7.7 % 279 40.4 % 101 14.6 % 253 36.7 %
Wolff (Elise) ES 1,035 529 51.1 % 506 48.9 % 7 0.7 % 159 15.4 % 134 12.9 % 71 6.9 % 664 64.2 %
Williams (Tom) ES 924 468 50.6 % 456 49.4 % 1 0.1 % 11 1.2 % 851 92.1 % 18 1.9 % 43 4.7 %
Williams (Wendell) ES 313 165 52.7 % 148 47.3 % N/A N/A 4 1.3 % 92 29.4 % 201 64.2 % 16 5.1 %
Wright ES 973 502 51.6 % 471 48.4 % 9 0.9 % 258 26.5 % 217 22.3 % 120 12.3 % 369 37.9 %
Wynn ES 763 403 52.8 % 360 47.2 % 4 0.5 % 29 3.8 % 603 79.0 % 59 7.7 % 68 8.9 %
Woodbury MS 955 508 53.2 % 447 46.8 % 14 1.5 % 64 6.7 % 513 53.7 % 90 9.4 % 274 28.7 %
Woolley ES 805 422 52.4 % 383 47.6 % 3 0.4 % 26 3.2 % 530 65.8 % 192 23.9 % 54 6.7 %
Clark County Schools
‘N/A’ indicates a population of zero.
Total Students Male Female
American Indian/Alaskan
Native
Asian/Pacific Islander Hispanic
Black/African American White
# # % # % # % # % # % # % # %
Page 12 of 125
2008-2009 Accountability Report
Website: www.nevadareportcard.com Clark County School District
Bracken ES 453 52 11.5 % 190 41.9 % 243 53.6 % N/A N/A
Bowler (Joseph) Sr ES 551 60 10.9 % 180 32.7 % 348 63.2 % N/A N/A
Bowler (Grant) ES 683 78 11.4 % 33 4.8 % 151 22.1 % N/A N/A
Brookman ES 825 81 9.8 % 253 30.7 % 227 27.5 % N/A N/A
Brinley MS 982 120 12.2 % 207 21.1 % 636 64.8 % N/A N/A
Bridger MS 1,347 111 8.2 % 341 25.3 % 923 68.5 % N/A N/A
Bonanza HS 2,219 222 10.0 % 254 11.4 % 635 28.6 % N/A N/A
Blue Diamond ES 21 - - N/A N/A - - N/A N/A
Boulder City HS 669 54 8.1 % - - 101 15.1 % N/A N/A
Booker ES 445 37 8.3 % 131 29.4 % 451 101.3 % N/A N/A
Bonner ES 738 63 8.5 % 59 8.0 % 105 14.2 % N/A N/A
Brown JHS 965 115 11.9 % 46 4.8 % 424 43.9 % N/A N/A
Bryan (Roger) ES 707 72 10.2 % 235 33.2 % 213 30.1 % N/A N/A
Bryan (Richard) ES 608 99 16.3 % 47 7.7 % 126 20.7 % N/A N/A
Bruner ES 775 111 14.3 % 187 24.1 % 343 44.3 % N/A N/A
Burkholder JHS 888 99 11.1 % 44 5.0 % 383 43.1 % N/A N/A
Burk Horizon SW HS 240 37 15.4 % 52 21.7 % 109 45.4 % N/A N/A
Bunker ES 602 69 11.5 % 189 31.4 % 342 56.8 % N/A N/A
Bilbray ES 711 72 10.1 % 32 4.5 % 130 18.3 % N/A N/A
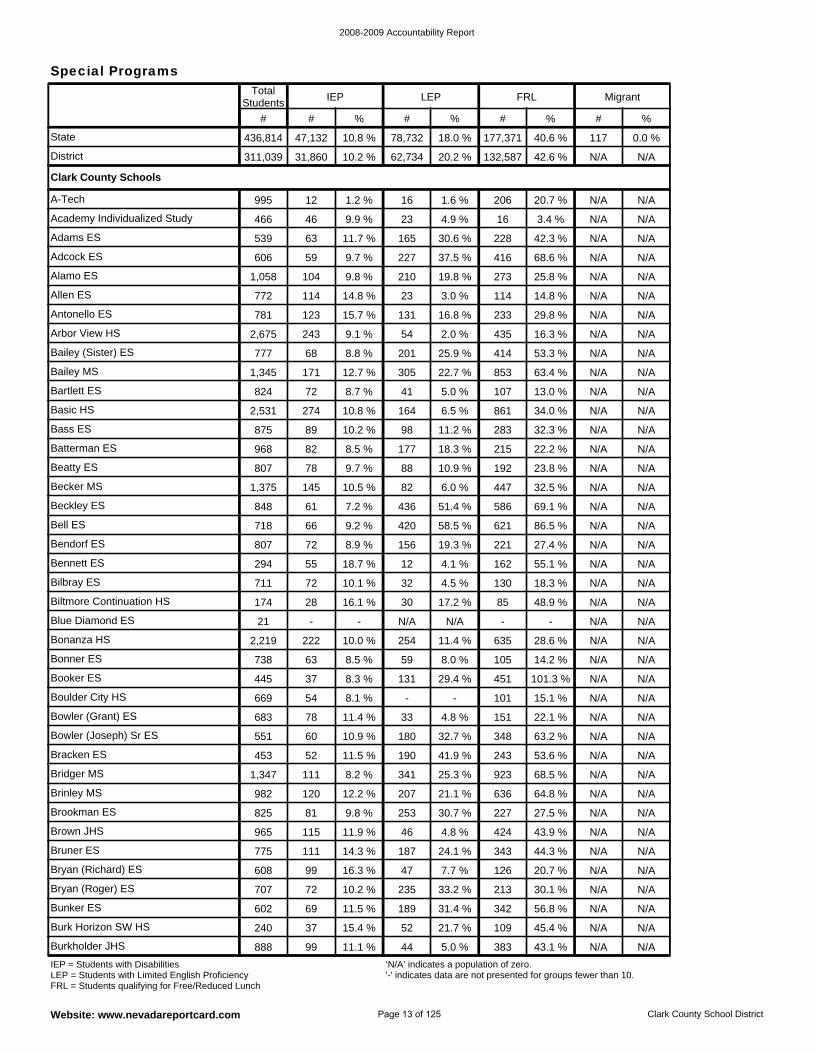
Allen ES 772 114 14.8 % 23 3.0 % 114 14.8 % N/A N/A
Alamo ES 1,058 104 9.8 % 210 19.8 % 273 25.8 % N/A N/A
Antonello ES 781 123 15.7 % 131 16.8 % 233 29.8 % N/A N/A
Bailey (Sister) ES 777 68 8.8 % 201 25.9 % 414 53.3 % N/A N/A
Arbor View HS 2,675 243 9.1 % 54 2.0 % 435 16.3 % N/A N/A
Adcock ES 606 59 9.7 % 227 37.5 % 416 68.6 % N/A N/A
Biltmore Continuation HS 174 28 16.1 % 30 17.2 % 85 48.9 % N/A N/A
A-Tech 995 12 1.2 % 16 1.6 % 206 20.7 % N/A N/A
Adams ES 539 63 11.7 % 165 30.6 % 228 42.3 % N/A N/A
Academy Individualized Study 466 46 9.9 % 23 4.9 % 16 3.4 % N/A N/A
Beckley ES 848 61 7.2 % 436 51.4 % 586 69.1 % N/A N/A
Becker MS 1,375 145 10.5 % 82 6.0 % 447 32.5 % N/A N/A
Bell ES 718 66 9.2 % 420 58.5 % 621 86.5 % N/A N/A
Bennett ES 294 55 18.7 % 12 4.1 % 162 55.1 % N/A N/A
Bendorf ES 807 72 8.9 % 156 19.3 % 221 27.4 % N/A N/A
Beatty ES 807 78 9.7 % 88 10.9 % 192 23.8 % N/A N/A
Bailey MS 1,345 171 12.7 % 305 22.7 % 853 63.4 % N/A N/A
Bartlett ES 824 72 8.7 % 41 5.0 % 107 13.0 % N/A N/A
Basic HS 2,531 274 10.8 % 164 6.5 % 861 34.0 % N/A N/A
Batterman ES 968 82 8.5 % 177 18.3 % 215 22.2 % N/A N/A
Bass ES 875 89 10.2 % 98 11.2 % 283 32.3 % N/A N/A
Clark County Schools
District 311,039 31,860 10.2 % 62,734 20.2 % 132,587 42.6 % N/A N/A
State 436,814 47,132 10.8 % 78,732 18.0 % 177,371 40.6 % 117 0.0 %
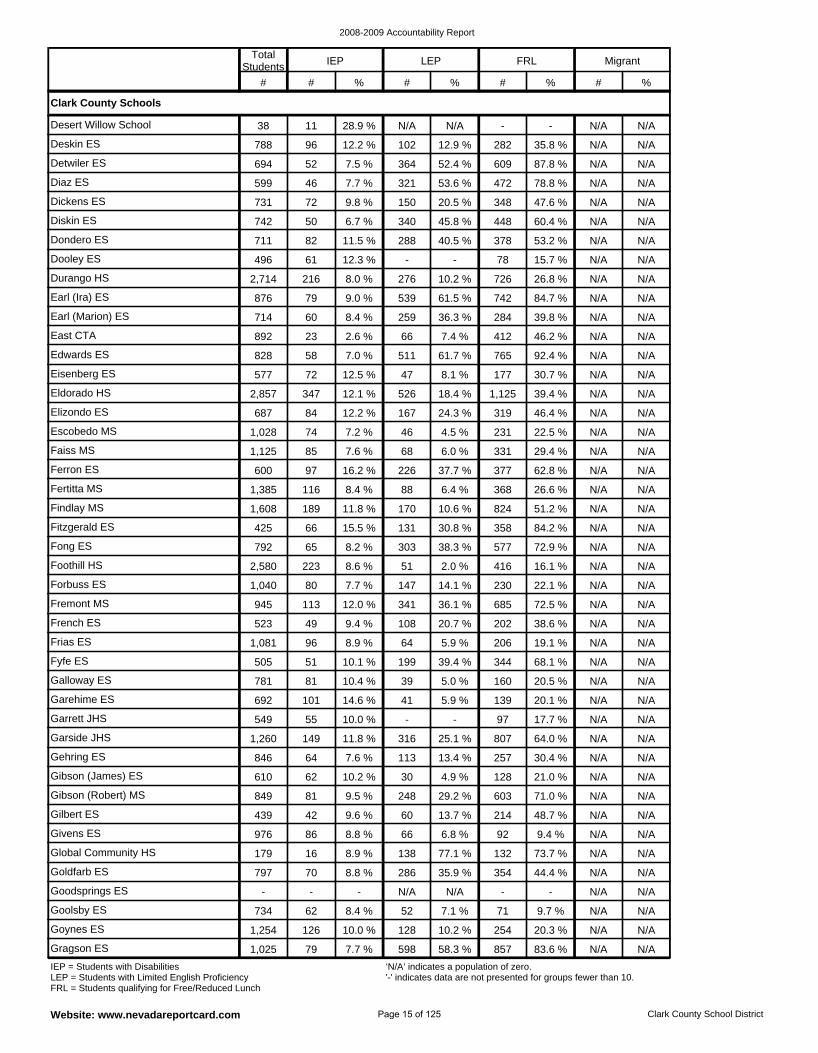
IEP = Students with Disabilities LEP = Students with Limited English Proficiency FRL = Students qualifying for Free/Reduced Lunch
‘N/A’ indicates a population of zero. '-' indicates data are not presented for groups fewer than 10.
Total Students IEP LEP FRL Migrant
# # % # % # % # %
Special Programs
Page 13 of 125
2008-2009 Accountability Report
Website: www.nevadareportcard.com Clark County School District
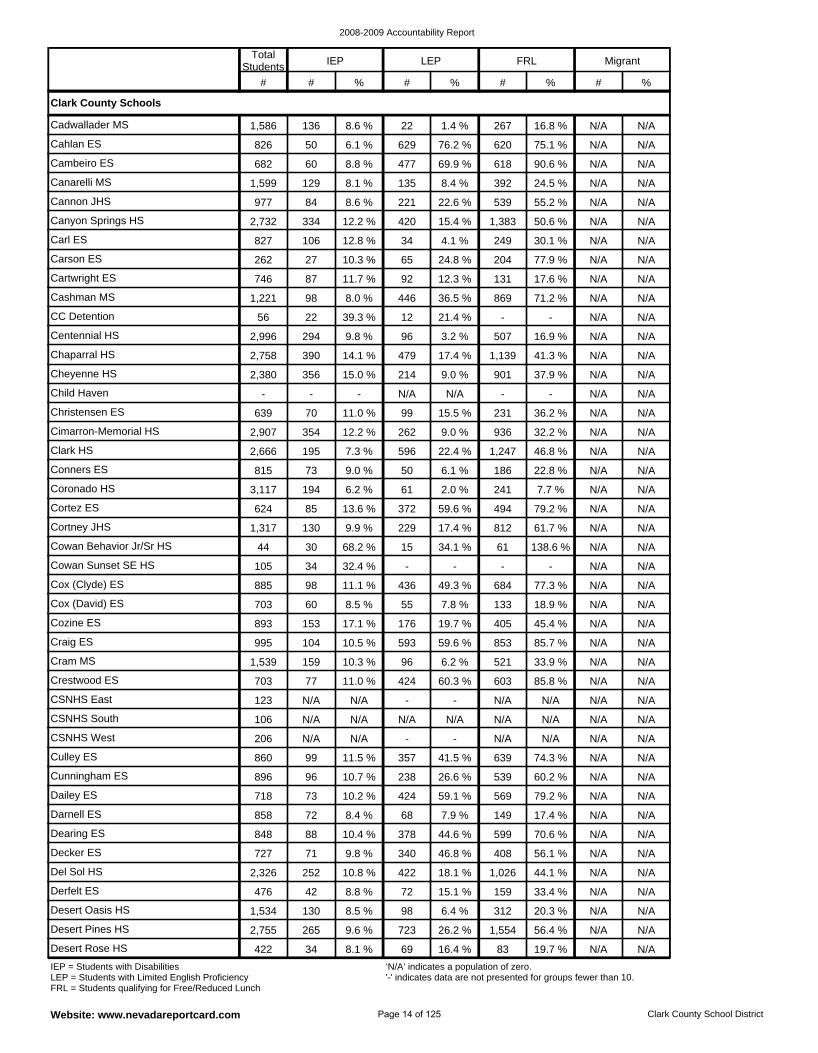
Culley ES 860 99 11.5 % 357 41.5 % 639 74.3 % N/A N/A
CSNHS West 206 N/A N/A - - N/A N/A N/A N/A
CSNHS South 106 N/A N/A N/A N/A N/A N/A N/A N/A
Darnell ES 858 72 8.4 % 68 7.9 % 149 17.4 % N/A N/A
Dailey ES 718 73 10.2 % 424 59.1 % 569 79.2 % N/A N/A
Cunningham ES 896 96 10.7 % 238 26.6 % 539 60.2 % N/A N/A
CSNHS East 123 N/A N/A - - N/A N/A N/A N/A
Cozine ES 893 153 17.1 % 176 19.7 % 405 45.4 % N/A N/A
Cox (David) ES 703 60 8.5 % 55 7.8 % 133 18.9 % N/A N/A
Crestwood ES 703 77 11.0 % 424 60.3 % 603 85.8 % N/A N/A
Cram MS 1,539 159 10.3 % 96 6.2 % 521 33.9 % N/A N/A
Craig ES 995 104 10.5 % 593 59.6 % 853 85.7 % N/A N/A
Desert Rose HS 422 34 8.1 % 69 16.4 % 83 19.7 % N/A N/A
Del Sol HS 2,326 252 10.8 % 422 18.1 % 1,026 44.1 % N/A N/A
Decker ES 727 71 9.8 % 340 46.8 % 408 56.1 % N/A N/A
Dearing ES 848 88 10.4 % 378 44.6 % 599 70.6 % N/A N/A
Desert Pines HS 2,755 265 9.6 % 723 26.2 % 1,554 56.4 % N/A N/A
Desert Oasis HS 1,534 130 8.5 % 98 6.4 % 312 20.3 % N/A N/A
Derfelt ES 476 42 8.8 % 72 15.1 % 159 33.4 % N/A N/A
Cowan Sunset SE HS 105 34 32.4 % - - - - N/A N/A
Carl ES 827 106 12.8 % 34 4.1 % 249 30.1 % N/A N/A
Canyon Springs HS 2,732 334 12.2 % 420 15.4 % 1,383 50.6 % N/A N/A
Cannon JHS 977 84 8.6 % 221 22.6 % 539 55.2 % N/A N/A
Cashman MS 1,221 98 8.0 % 446 36.5 % 869 71.2 % N/A N/A
Cartwright ES 746 87 11.7 % 92 12.3 % 131 17.6 % N/A N/A
Carson ES 262 27 10.3 % 65 24.8 % 204 77.9 % N/A N/A
Cadwallader MS 1,586 136 8.6 % 22 1.4 % 267 16.8 % N/A N/A
Cox (Clyde) ES 885 98 11.1 % 436 49.3 % 684 77.3 % N/A N/A
Canarelli MS 1,599 129 8.1 % 135 8.4 % 392 24.5 % N/A N/A
Cambeiro ES 682 60 8.8 % 477 69.9 % 618 90.6 % N/A N/A
Cahlan ES 826 50 6.1 % 629 76.2 % 620 75.1 % N/A N/A
CC Detention 56 22 39.3 % 12 21.4 % - - N/A N/A
Coronado HS 3,117 194 6.2 % 61 2.0 % 241 7.7 % N/A N/A
Conners ES 815 73 9.0 % 50 6.1 % 186 22.8 % N/A N/A
Clark HS 2,666 195 7.3 % 596 22.4 % 1,247 46.8 % N/A N/A
Cowan Behavior Jr/Sr HS 44 30 68.2 % 15 34.1 % 61 138.6 % N/A N/A
Cortney JHS 1,317 130 9.9 % 229 17.4 % 812 61.7 % N/A N/A
Cortez ES 624 85 13.6 % 372 59.6 % 494 79.2 % N/A N/A
Cheyenne HS 2,380 356 15.0 % 214 9.0 % 901 37.9 % N/A N/A
Chaparral HS 2,758 390 14.1 % 479 17.4 % 1,139 41.3 % N/A N/A
Centennial HS 2,996 294 9.8 % 96 3.2 % 507 16.9 % N/A N/A
Christensen ES 639 70 11.0 % 99 15.5 % 231 36.2 % N/A N/A
Cimarron-Memorial HS 2,907 354 12.2 % 262 9.0 % 936 32.2 % N/A N/A
Child Haven - - - N/A N/A - - N/A N/A
Clark County Schools
IEP = Students with Disabilities LEP = Students with Limited English Proficiency FRL = Students qualifying for Free/Reduced Lunch
‘N/A’ indicates a population of zero. '-' indicates data are not presented for groups fewer than 10.
Total Students IEP LEP FRL Migrant
# # % # % # % # %
Page 14 of 125
2008-2009 Accountability Report
Website: www.nevadareportcard.com Clark County School District
Gehring ES 846 64 7.6 % 113 13.4 % 257 30.4 % N/A N/A
Garside JHS 1,260 149 11.8 % 316 25.1 % 807 64.0 % N/A N/A
Garrett JHS 549 55 10.0 % - - 97 17.7 % N/A N/A
Gilbert ES 439 42 9.6 % 60 13.7 % 214 48.7 % N/A N/A
Gibson (Robert) MS 849 81 9.5 % 248 29.2 % 603 71.0 % N/A N/A
Gibson (James) ES 610 62 10.2 % 30 4.9 % 128 21.0 % N/A N/A
Garehime ES 692 101 14.6 % 41 5.9 % 139 20.1 % N/A N/A
French ES 523 49 9.4 % 108 20.7 % 202 38.6 % N/A N/A
Fremont MS 945 113 12.0 % 341 36.1 % 685 72.5 % N/A N/A
Galloway ES 781 81 10.4 % 39 5.0 % 160 20.5 % N/A N/A
Fyfe ES 505 51 10.1 % 199 39.4 % 344 68.1 % N/A N/A
Frias ES 1,081 96 8.9 % 64 5.9 % 206 19.1 % N/A N/A
Gragson ES 1,025 79 7.7 % 598 58.3 % 857 83.6 % N/A N/A
Goldfarb ES 797 70 8.8 % 286 35.9 % 354 44.4 % N/A N/A
Global Community HS 179 16 8.9 % 138 77.1 % 132 73.7 % N/A N/A
Givens ES 976 86 8.8 % 66 6.8 % 92 9.4 % N/A N/A
Goynes ES 1,254 126 10.0 % 128 10.2 % 254 20.3 % N/A N/A
Goolsby ES 734 62 8.4 % 52 7.1 % 71 9.7 % N/A N/A
Goodsprings ES - - - N/A N/A - - N/A N/A
Foothill HS 2,580 223 8.6 % 51 2.0 % 416 16.1 % N/A N/A
Dondero ES 711 82 11.5 % 288 40.5 % 378 53.2 % N/A N/A
Diskin ES 742 50 6.7 % 340 45.8 % 448 60.4 % N/A N/A
Dickens ES 731 72 9.8 % 150 20.5 % 348 47.6 % N/A N/A
Earl (Ira) ES 876 79 9.0 % 539 61.5 % 742 84.7 % N/A N/A
Durango HS 2,714 216 8.0 % 276 10.2 % 726 26.8 % N/A N/A
Dooley ES 496 61 12.3 % - - 78 15.7 % N/A N/A
Desert Willow School 38 11 28.9 % N/A N/A - - N/A N/A
Forbuss ES 1,040 80 7.7 % 147 14.1 % 230 22.1 % N/A N/A
Diaz ES 599 46 7.7 % 321 53.6 % 472 78.8 % N/A N/A
Detwiler ES 694 52 7.5 % 364 52.4 % 609 87.8 % N/A N/A
Deskin ES 788 96 12.2 % 102 12.9 % 282 35.8 % N/A N/A
Earl (Marion) ES 714 60 8.4 % 259 36.3 % 284 39.8 % N/A N/A
Fertitta MS 1,385 116 8.4 % 88 6.4 % 368 26.6 % N/A N/A
Ferron ES 600 97 16.2 % 226 37.7 % 377 62.8 % N/A N/A
Faiss MS 1,125 85 7.6 % 68 6.0 % 331 29.4 % N/A N/A
Fong ES 792 65 8.2 % 303 38.3 % 577 72.9 % N/A N/A
Fitzgerald ES 425 66 15.5 % 131 30.8 % 358 84.2 % N/A N/A
Findlay MS 1,608 189 11.8 % 170 10.6 % 824 51.2 % N/A N/A
Eisenberg ES 577 72 12.5 % 47 8.1 % 177 30.7 % N/A N/A
Edwards ES 828 58 7.0 % 511 61.7 % 765 92.4 % N/A N/A
East CTA 892 23 2.6 % 66 7.4 % 412 46.2 % N/A N/A
Elizondo ES 687 84 12.2 % 167 24.3 % 319 46.4 % N/A N/A
Escobedo MS 1,028 74 7.2 % 46 4.5 % 231 22.5 % N/A N/A
Eldorado HS 2,857 347 12.1 % 526 18.4 % 1,125 39.4 % N/A N/A
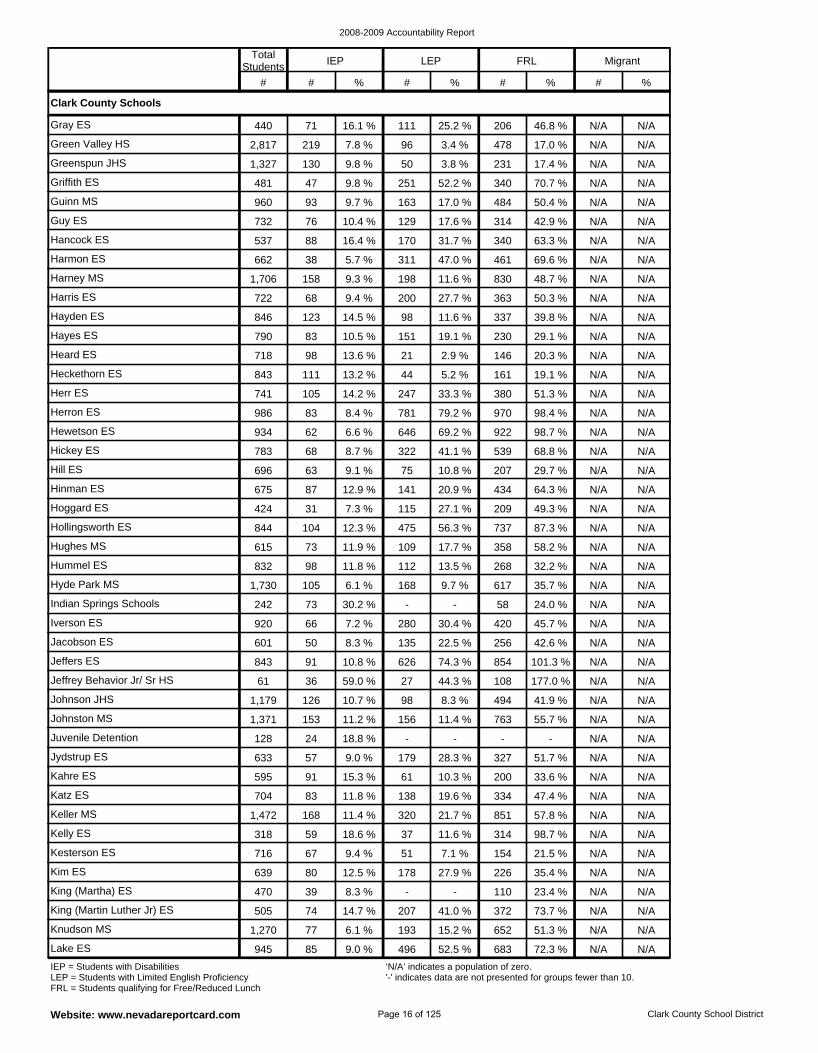
Clark County Schools
IEP = Students with Disabilities LEP = Students with Limited English Proficiency FRL = Students qualifying for Free/Reduced Lunch
‘N/A’ indicates a population of zero. '-' indicates data are not presented for groups fewer than 10.
Total Students IEP LEP FRL Migrant
# # % # % # % # %
Page 15 of 125
2008-2009 Accountability Report
Website: www.nevadareportcard.com Clark County School District
Jydstrup ES 633 57 9.0 % 179 28.3 % 327 51.7 % N/A N/A
Juvenile Detention 128 24 18.8 % - - - - N/A N/A
Johnston MS 1,371 153 11.2 % 156 11.4 % 763 55.7 % N/A N/A
Keller MS 1,472 168 11.4 % 320 21.7 % 851 57.8 % N/A N/A
Katz ES 704 83 11.8 % 138 19.6 % 334 47.4 % N/A N/A
Kahre ES 595 91 15.3 % 61 10.3 % 200 33.6 % N/A N/A
Johnson JHS 1,179 126 10.7 % 98 8.3 % 494 41.9 % N/A N/A
Iverson ES 920 66 7.2 % 280 30.4 % 420 45.7 % N/A N/A
Indian Springs Schools 242 73 30.2 % - - 58 24.0 % N/A N/A
Jeffrey Behavior Jr/ Sr HS 61 36 59.0 % 27 44.3 % 108 177.0 % N/A N/A
Jeffers ES 843 91 10.8 % 626 74.3 % 854 101.3 % N/A N/A
Jacobson ES 601 50 8.3 % 135 22.5 % 256 42.6 % N/A N/A
Lake ES 945 85 9.0 % 496 52.5 % 683 72.3 % N/A N/A
Kim ES 639 80 12.5 % 178 27.9 % 226 35.4 % N/A N/A
Kesterson ES 716 67 9.4 % 51 7.1 % 154 21.5 % N/A N/A
Kelly ES 318 59 18.6 % 37 11.6 % 314 98.7 % N/A N/A
Knudson MS 1,270 77 6.1 % 193 15.2 % 652 51.3 % N/A N/A
King (Martin Luther Jr) ES 505 74 14.7 % 207 41.0 % 372 73.7 % N/A N/A
King (Martha) ES 470 39 8.3 % - - 110 23.4 % N/A N/A
Hummel ES 832 98 11.8 % 112 13.5 % 268 32.2 % N/A N/A
Hancock ES 537 88 16.4 % 170 31.7 % 340 63.3 % N/A N/A
Guy ES 732 76 10.4 % 129 17.6 % 314 42.9 % N/A N/A
Guinn MS 960 93 9.7 % 163 17.0 % 484 50.4 % N/A N/A
Harris ES 722 68 9.4 % 200 27.7 % 363 50.3 % N/A N/A
Harney MS 1,706 158 9.3 % 198 11.6 % 830 48.7 % N/A N/A
Harmon ES 662 38 5.7 % 311 47.0 % 461 69.6 % N/A N/A
Gray ES 440 71 16.1 % 111 25.2 % 206 46.8 % N/A N/A
Hyde Park MS 1,730 105 6.1 % 168 9.7 % 617 35.7 % N/A N/A
Griffith ES 481 47 9.8 % 251 52.2 % 340 70.7 % N/A N/A
Greenspun JHS 1,327 130 9.8 % 50 3.8 % 231 17.4 % N/A N/A
Green Valley HS 2,817 219 7.8 % 96 3.4 % 478 17.0 % N/A N/A
Hayden ES 846 123 14.5 % 98 11.6 % 337 39.8 % N/A N/A
Hinman ES 675 87 12.9 % 141 20.9 % 434 64.3 % N/A N/A
Hill ES 696 63 9.1 % 75 10.8 % 207 29.7 % N/A N/A
Hickey ES 783 68 8.7 % 322 41.1 % 539 68.8 % N/A N/A
Hughes MS 615 73 11.9 % 109 17.7 % 358 58.2 % N/A N/A
Hollingsworth ES 844 104 12.3 % 475 56.3 % 737 87.3 % N/A N/A
Hoggard ES 424 31 7.3 % 115 27.1 % 209 49.3 % N/A N/A
Heckethorn ES 843 111 13.2 % 44 5.2 % 161 19.1 % N/A N/A
Heard ES 718 98 13.6 % 21 2.9 % 146 20.3 % N/A N/A
Hayes ES 790 83 10.5 % 151 19.1 % 230 29.1 % N/A N/A
Herron ES 986 83 8.4 % 781 79.2 % 970 98.4 % N/A N/A
Hewetson ES 934 62 6.6 % 646 69.2 % 922 98.7 % N/A N/A
Herr ES 741 105 14.2 % 247 33.3 % 380 51.3 % N/A N/A
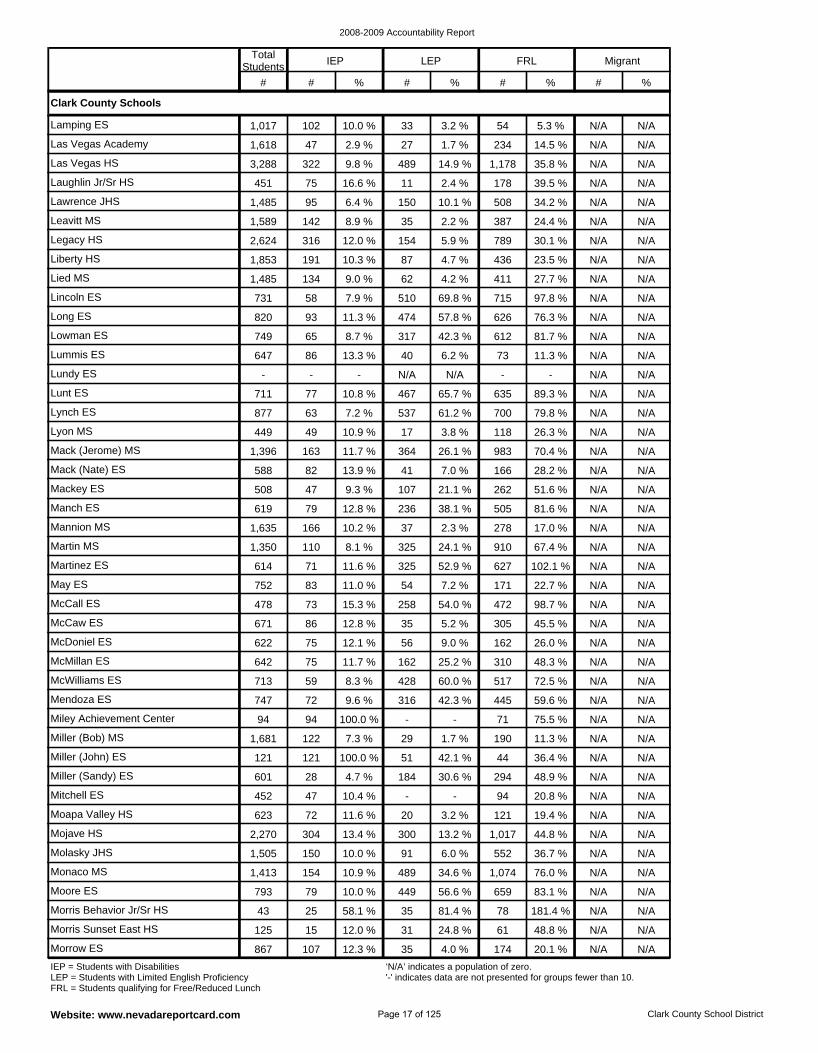
Clark County Schools
IEP = Students with Disabilities LEP = Students with Limited English Proficiency FRL = Students qualifying for Free/Reduced Lunch
‘N/A’ indicates a population of zero. '-' indicates data are not presented for groups fewer than 10.
Total Students IEP LEP FRL Migrant
# # % # % # % # %
Page 16 of 125
2008-2009 Accountability Report
Website: www.nevadareportcard.com Clark County School District
Miller (John) ES 121 121 100.0 % 51 42.1 % 44 36.4 % N/A N/A
Miller (Bob) MS 1,681 122 7.3 % 29 1.7 % 190 11.3 % N/A N/A
Miley Achievement Center 94 94 100.0 % - - 71 75.5 % N/A N/A
Moapa Valley HS 623 72 11.6 % 20 3.2 % 121 19.4 % N/A N/A
Mitchell ES 452 47 10.4 % - - 94 20.8 % N/A N/A
Miller (Sandy) ES 601 28 4.7 % 184 30.6 % 294 48.9 % N/A N/A
Mendoza ES 747 72 9.6 % 316 42.3 % 445 59.6 % N/A N/A
McCaw ES 671 86 12.8 % 35 5.2 % 305 45.5 % N/A N/A
McCall ES 478 73 15.3 % 258 54.0 % 472 98.7 % N/A N/A
McWilliams ES 713 59 8.3 % 428 60.0 % 517 72.5 % N/A N/A
McMillan ES 642 75 11.7 % 162 25.2 % 310 48.3 % N/A N/A
McDoniel ES 622 75 12.1 % 56 9.0 % 162 26.0 % N/A N/A
Morrow ES 867 107 12.3 % 35 4.0 % 174 20.1 % N/A N/A
Monaco MS 1,413 154 10.9 % 489 34.6 % 1,074 76.0 % N/A N/A
Molasky JHS 1,505 150 10.0 % 91 6.0 % 552 36.7 % N/A N/A
Mojave HS 2,270 304 13.4 % 300 13.2 % 1,017 44.8 % N/A N/A
Morris Sunset East HS 125 15 12.0 % 31 24.8 % 61 48.8 % N/A N/A
Morris Behavior Jr/Sr HS 43 25 58.1 % 35 81.4 % 78 181.4 % N/A N/A
Moore ES 793 79 10.0 % 449 56.6 % 659 83.1 % N/A N/A
Martinez ES 614 71 11.6 % 325 52.9 % 627 102.1 % N/A N/A
Legacy HS 2,624 316 12.0 % 154 5.9 % 789 30.1 % N/A N/A
Leavitt MS 1,589 142 8.9 % 35 2.2 % 387 24.4 % N/A N/A
Lawrence JHS 1,485 95 6.4 % 150 10.1 % 508 34.2 % N/A N/A
Lincoln ES 731 58 7.9 % 510 69.8 % 715 97.8 % N/A N/A
Lied MS 1,485 134 9.0 % 62 4.2 % 411 27.7 % N/A N/A
Liberty HS 1,853 191 10.3 % 87 4.7 % 436 23.5 % N/A N/A
Lamping ES 1,017 102 10.0 % 33 3.2 % 54 5.3 % N/A N/A
May ES 752 83 11.0 % 54 7.2 % 171 22.7 % N/A N/A
Laughlin Jr/Sr HS 451 75 16.6 % 11 2.4 % 178 39.5 % N/A N/A
Las Vegas HS 3,288 322 9.8 % 489 14.9 % 1,178 35.8 % N/A N/A
Las Vegas Academy 1,618 47 2.9 % 27 1.7 % 234 14.5 % N/A N/A
Long ES 820 93 11.3 % 474 57.8 % 626 76.3 % N/A N/A
Mackey ES 508 47 9.3 % 107 21.1 % 262 51.6 % N/A N/A
Mack (Nate) ES 588 82 13.9 % 41 7.0 % 166 28.2 % N/A N/A
Mack (Jerome) MS 1,396 163 11.7 % 364 26.1 % 983 70.4 % N/A N/A
Martin MS 1,350 110 8.1 % 325 24.1 % 910 67.4 % N/A N/A
Mannion MS 1,635 166 10.2 % 37 2.3 % 278 17.0 % N/A N/A
Manch ES 619 79 12.8 % 236 38.1 % 505 81.6 % N/A N/A
Lundy ES - - - N/A N/A - - N/A N/A
Lummis ES 647 86 13.3 % 40 6.2 % 73 11.3 % N/A N/A
Lowman ES 749 65 8.7 % 317 42.3 % 612 81.7 % N/A N/A
Lynch ES 877 63 7.2 % 537 61.2 % 700 79.8 % N/A N/A
Lyon MS 449 49 10.9 % 17 3.8 % 118 26.3 % N/A N/A
Lunt ES 711 77 10.8 % 467 65.7 % 635 89.3 % N/A N/A
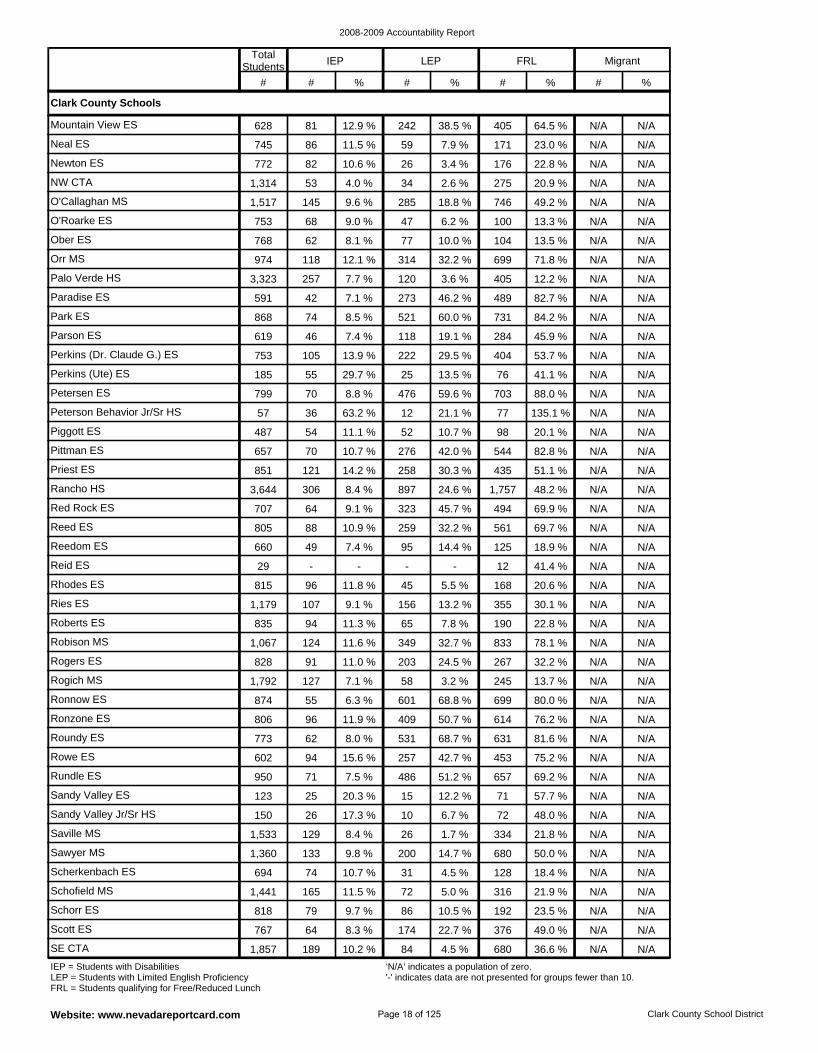
Clark County Schools
IEP = Students with Disabilities LEP = Students with Limited English Proficiency FRL = Students qualifying for Free/Reduced Lunch
‘N/A’ indicates a population of zero. '-' indicates data are not presented for groups fewer than 10.
Total Students IEP LEP FRL Migrant
# # % # % # % # %
Page 17 of 125
2008-2009 Accountability Report
Website: www.nevadareportcard.com Clark County School District
Rowe ES 602 94 15.6 % 257 42.7 % 453 75.2 % N/A N/A
Roundy ES 773 62 8.0 % 531 68.7 % 631 81.6 % N/A N/A
Ronzone ES 806 96 11.9 % 409 50.7 % 614 76.2 % N/A N/A
Sandy Valley Jr/Sr HS 150 26 17.3 % 10 6.7 % 72 48.0 % N/A N/A
Sandy Valley ES 123 25 20.3 % 15 12.2 % 71 57.7 % N/A N/A
Rundle ES 950 71 7.5 % 486 51.2 % 657 69.2 % N/A N/A
Ronnow ES 874 55 6.3 % 601 68.8 % 699 80.0 % N/A N/A
Roberts ES 835 94 11.3 % 65 7.8 % 190 22.8 % N/A N/A
Ries ES 1,179 107 9.1 % 156 13.2 % 355 30.1 % N/A N/A
Rogich MS 1,792 127 7.1 % 58 3.2 % 245 13.7 % N/A N/A
Rogers ES 828 91 11.0 % 203 24.5 % 267 32.2 % N/A N/A
Robison MS 1,067 124 11.6 % 349 32.7 % 833 78.1 % N/A N/A
SE CTA 1,857 189 10.2 % 84 4.5 % 680 36.6 % N/A N/A
Scherkenbach ES 694 74 10.7 % 31 4.5 % 128 18.4 % N/A N/A
Sawyer MS 1,360 133 9.8 % 200 14.7 % 680 50.0 % N/A N/A
Saville MS 1,533 129 8.4 % 26 1.7 % 334 21.8 % N/A N/A
Scott ES 767 64 8.3 % 174 22.7 % 376 49.0 % N/A N/A
Schorr ES 818 79 9.7 % 86 10.5 % 192 23.5 % N/A N/A
Schofield MS 1,441 165 11.5 % 72 5.0 % 316 21.9 % N/A N/A
Reid ES 29 - - - - 12 41.4 % N/A N/A
Ober ES 768 62 8.1 % 77 10.0 % 104 13.5 % N/A N/A
O'Roarke ES 753 68 9.0 % 47 6.2 % 100 13.3 % N/A N/A
O'Callaghan MS 1,517 145 9.6 % 285 18.8 % 746 49.2 % N/A N/A
Paradise ES 591 42 7.1 % 273 46.2 % 489 82.7 % N/A N/A
Palo Verde HS 3,323 257 7.7 % 120 3.6 % 405 12.2 % N/A N/A
Orr MS 974 118 12.1 % 314 32.2 % 699 71.8 % N/A N/A
Mountain View ES 628 81 12.9 % 242 38.5 % 405 64.5 % N/A N/A
Rhodes ES 815 96 11.8 % 45 5.5 % 168 20.6 % N/A N/A
NW CTA 1,314 53 4.0 % 34 2.6 % 275 20.9 % N/A N/A
Newton ES 772 82 10.6 % 26 3.4 % 176 22.8 % N/A N/A
Neal ES 745 86 11.5 % 59 7.9 % 171 23.0 % N/A N/A
Park ES 868 74 8.5 % 521 60.0 % 731 84.2 % N/A N/A
Rancho HS 3,644 306 8.4 % 897 24.6 % 1,757 48.2 % N/A N/A
Priest ES 851 121 14.2 % 258 30.3 % 435 51.1 % N/A N/A
Pittman ES 657 70 10.7 % 276 42.0 % 544 82.8 % N/A N/A
Reedom ES 660 49 7.4 % 95 14.4 % 125 18.9 % N/A N/A
Reed ES 805 88 10.9 % 259 32.2 % 561 69.7 % N/A N/A
Red Rock ES 707 64 9.1 % 323 45.7 % 494 69.9 % N/A N/A
Perkins (Ute) ES 185 55 29.7 % 25 13.5 % 76 41.1 % N/A N/A
Perkins (Dr. Claude G.) ES 753 105 13.9 % 222 29.5 % 404 53.7 % N/A N/A
Parson ES 619 46 7.4 % 118 19.1 % 284 45.9 % N/A N/A
Peterson Behavior Jr/Sr HS 57 36 63.2 % 12 21.1 % 77 135.1 % N/A N/A
Piggott ES 487 54 11.1 % 52 10.7 % 98 20.1 % N/A N/A
Petersen ES 799 70 8.8 % 476 59.6 % 703 88.0 % N/A N/A
Clark County Schools
IEP = Students with Disabilities LEP = Students with Limited English Proficiency FRL = Students qualifying for Free/Reduced Lunch
‘N/A’ indicates a population of zero. '-' indicates data are not presented for groups fewer than 10.
Total Students IEP LEP FRL Migrant
# # % # % # % # %
Page 18 of 125
2008-2009 Accountability Report
Website: www.nevadareportcard.com Clark County School District
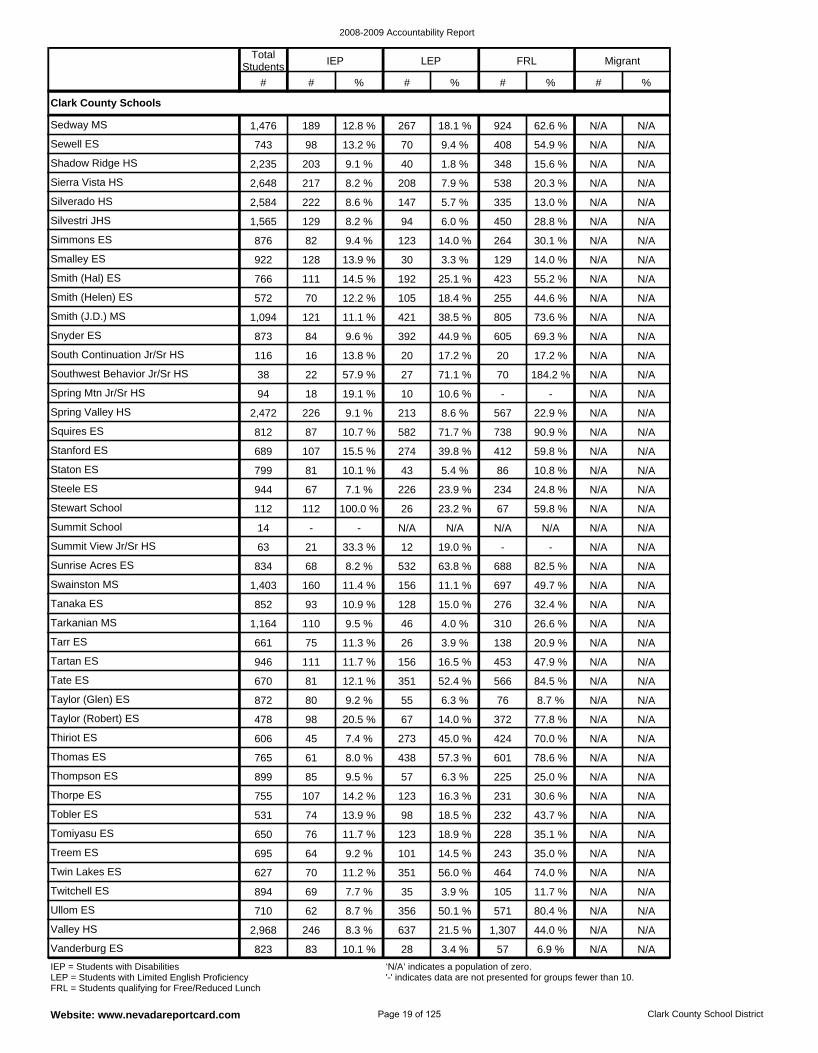
Thomas ES 765 61 8.0 % 438 57.3 % 601 78.6 % N/A N/A
Thiriot ES 606 45 7.4 % 273 45.0 % 424 70.0 % N/A N/A
Taylor (Robert) ES 478 98 20.5 % 67 14.0 % 372 77.8 % N/A N/A
Tobler ES 531 74 13.9 % 98 18.5 % 232 43.7 % N/A N/A
Thorpe ES 755 107 14.2 % 123 16.3 % 231 30.6 % N/A N/A
Thompson ES 899 85 9.5 % 57 6.3 % 225 25.0 % N/A N/A
Taylor (Glen) ES 872 80 9.2 % 55 6.3 % 76 8.7 % N/A N/A
Tarkanian MS 1,164 110 9.5 % 46 4.0 % 310 26.6 % N/A N/A
Tanaka ES 852 93 10.9 % 128 15.0 % 276 32.4 % N/A N/A
Tate ES 670 81 12.1 % 351 52.4 % 566 84.5 % N/A N/A
Tartan ES 946 111 11.7 % 156 16.5 % 453 47.9 % N/A N/A
Tarr ES 661 75 11.3 % 26 3.9 % 138 20.9 % N/A N/A
Vanderburg ES 823 83 10.1 % 28 3.4 % 57 6.9 % N/A N/A
Twin Lakes ES 627 70 11.2 % 351 56.0 % 464 74.0 % N/A N/A
Treem ES 695 64 9.2 % 101 14.5 % 243 35.0 % N/A N/A
Tomiyasu ES 650 76 11.7 % 123 18.9 % 228 35.1 % N/A N/A
Valley HS 2,968 246 8.3 % 637 21.5 % 1,307 44.0 % N/A N/A
Ullom ES 710 62 8.7 % 356 50.1 % 571 80.4 % N/A N/A
Twitchell ES 894 69 7.7 % 35 3.9 % 105 11.7 % N/A N/A
Sunrise Acres ES 834 68 8.2 % 532 63.8 % 688 82.5 % N/A N/A
Simmons ES 876 82 9.4 % 123 14.0 % 264 30.1 % N/A N/A
Silvestri JHS 1,565 129 8.2 % 94 6.0 % 450 28.8 % N/A N/A
Silverado HS 2,584 222 8.6 % 147 5.7 % 335 13.0 % N/A N/A
Smith (Helen) ES 572 70 12.2 % 105 18.4 % 255 44.6 % N/A N/A
Smith (Hal) ES 766 111 14.5 % 192 25.1 % 423 55.2 % N/A N/A
Smalley ES 922 128 13.9 % 30 3.3 % 129 14.0 % N/A N/A
Sedway MS 1,476 189 12.8 % 267 18.1 % 924 62.6 % N/A N/A
Swainston MS 1,403 160 11.4 % 156 11.1 % 697 49.7 % N/A N/A
Sierra Vista HS 2,648 217 8.2 % 208 7.9 % 538 20.3 % N/A N/A
Shadow Ridge HS 2,235 203 9.1 % 40 1.8 % 348 15.6 % N/A N/A
Sewell ES 743 98 13.2 % 70 9.4 % 408 54.9 % N/A N/A
Smith (J.D.) MS 1,094 121 11.1 % 421 38.5 % 805 73.6 % N/A N/A
Steele ES 944 67 7.1 % 226 23.9 % 234 24.8 % N/A N/A
Staton ES 799 81 10.1 % 43 5.4 % 86 10.8 % N/A N/A
Stanford ES 689 107 15.5 % 274 39.8 % 412 59.8 % N/A N/A
Summit View Jr/Sr HS 63 21 33.3 % 12 19.0 % - - N/A N/A
Summit School 14 - - N/A N/A N/A N/A N/A N/A
Stewart School 112 112 100.0 % 26 23.2 % 67 59.8 % N/A N/A
Southwest Behavior Jr/Sr HS 38 22 57.9 % 27 71.1 % 70 184.2 % N/A N/A
South Continuation Jr/Sr HS 116 16 13.8 % 20 17.2 % 20 17.2 % N/A N/A
Snyder ES 873 84 9.6 % 392 44.9 % 605 69.3 % N/A N/A
Spring Valley HS 2,472 226 9.1 % 213 8.6 % 567 22.9 % N/A N/A
Squires ES 812 87 10.7 % 582 71.7 % 738 90.9 % N/A N/A
Spring Mtn Jr/Sr HS 94 18 19.1 % 10 10.6 % - - N/A N/A
Clark County Schools
IEP = Students with Disabilities LEP = Students with Limited English Proficiency FRL = Students qualifying for Free/Reduced Lunch
‘N/A’ indicates a population of zero. '-' indicates data are not presented for groups fewer than 10.
Total Students IEP LEP FRL Migrant
# # % # % # % # %
Page 19 of 125
2008-2009 Accountability Report
Website: www.nevadareportcard.com Clark County School District
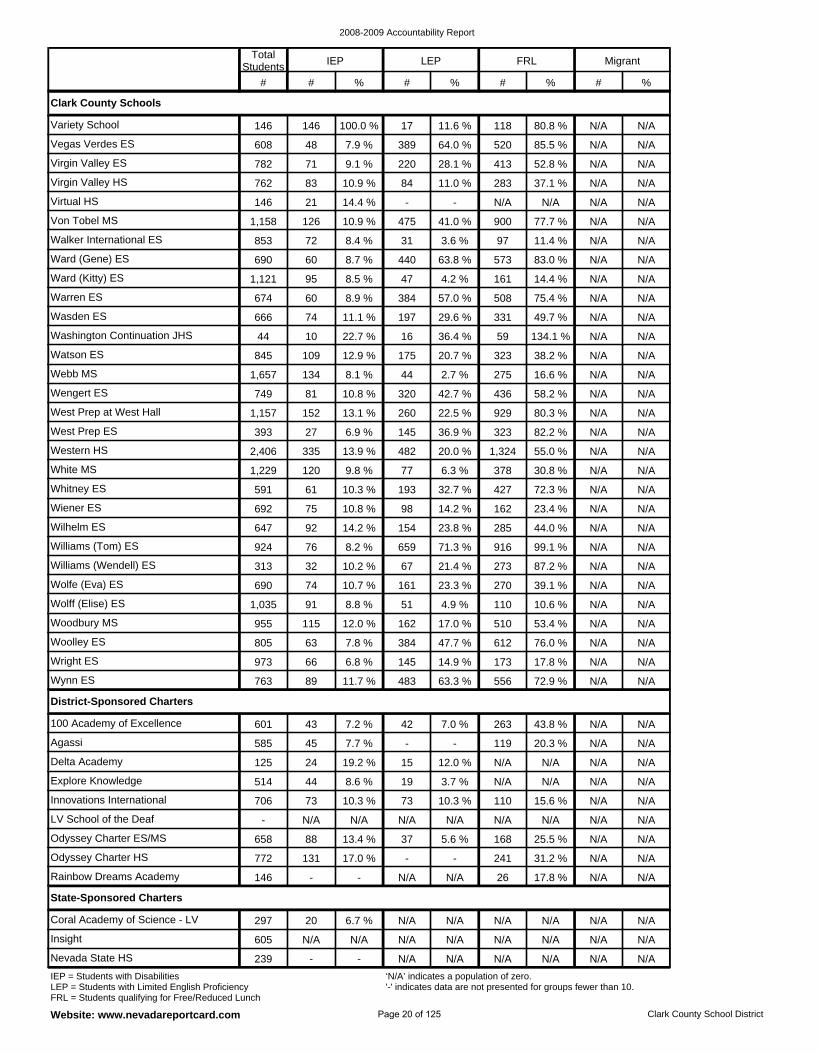
Insight 605 N/A N/A N/A N/A N/A N/A N/A N/A
Coral Academy of Science - LV 297 20 6.7 % N/A N/A N/A N/A N/A N/A
Nevada State HS 239 - - N/A N/A N/A N/A N/A N/A
State-Sponsored Charters
Innovations International 706 73 10.3 % 73 10.3 % 110 15.6 % N/A N/A
Explore Knowledge 514 44 8.6 % 19 3.7 % N/A N/A N/A N/A
100 Academy of Excellence 601 43 7.2 % 42 7.0 % 263 43.8 % N/A N/A
Delta Academy 125 24 19.2 % 15 12.0 % N/A N/A N/A N/A
Rainbow Dreams Academy 146 - - N/A N/A 26 17.8 % N/A N/A
Agassi 585 45 7.7 % - - 119 20.3 % N/A N/A
Odyssey Charter HS 772 131 17.0 % - - 241 31.2 % N/A N/A
LV School of the Deaf - N/A N/A N/A N/A N/A N/A N/A N/A
Odyssey Charter ES/MS 658 88 13.4 % 37 5.6 % 168 25.5 % N/A N/A
District-Sponsored Charters
Williams (Wendell) ES 313 32 10.2 % 67 21.4 % 273 87.2 % N/A N/A
Wolfe (Eva) ES 690 74 10.7 % 161 23.3 % 270 39.1 % N/A N/A
Wilhelm ES 647 92 14.2 % 154 23.8 % 285 44.0 % N/A N/A
Williams (Tom) ES 924 76 8.2 % 659 71.3 % 916 99.1 % N/A N/A
Wolff (Elise) ES 1,035 91 8.8 % 51 4.9 % 110 10.6 % N/A N/A
Wright ES 973 66 6.8 % 145 14.9 % 173 17.8 % N/A N/A
Wynn ES 763 89 11.7 % 483 63.3 % 556 72.9 % N/A N/A
Woodbury MS 955 115 12.0 % 162 17.0 % 510 53.4 % N/A N/A
Woolley ES 805 63 7.8 % 384 47.7 % 612 76.0 % N/A N/A
Walker International ES 853 72 8.4 % 31 3.6 % 97 11.4 % N/A N/A
Von Tobel MS 1,158 126 10.9 % 475 41.0 % 900 77.7 % N/A N/A
Ward (Gene) ES 690 60 8.7 % 440 63.8 % 573 83.0 % N/A N/A
Warren ES 674 60 8.9 % 384 57.0 % 508 75.4 % N/A N/A
Ward (Kitty) ES 1,121 95 8.5 % 47 4.2 % 161 14.4 % N/A N/A
Vegas Verdes ES 608 48 7.9 % 389 64.0 % 520 85.5 % N/A N/A
Variety School 146 146 100.0 % 17 11.6 % 118 80.8 % N/A N/A
Virgin Valley ES 782 71 9.1 % 220 28.1 % 413 52.8 % N/A N/A
Virtual HS 146 21 14.4 % - - N/A N/A N/A N/A
Virgin Valley HS 762 83 10.9 % 84 11.0 % 283 37.1 % N/A N/A
Wasden ES 666 74 11.1 % 197 29.6 % 331 49.7 % N/A N/A
Western HS 2,406 335 13.9 % 482 20.0 % 1,324 55.0 % N/A N/A
West Prep ES 393 27 6.9 % 145 36.9 % 323 82.2 % N/A N/A
White MS 1,229 120 9.8 % 77 6.3 % 378 30.8 % N/A N/A
Wiener ES 692 75 10.8 % 98 14.2 % 162 23.4 % N/A N/A
Whitney ES 591 61 10.3 % 193 32.7 % 427 72.3 % N/A N/A
Watson ES 845 109 12.9 % 175 20.7 % 323 38.2 % N/A N/A
Washington Continuation JHS 44 10 22.7 % 16 36.4 % 59 134.1 % N/A N/A
Webb MS 1,657 134 8.1 % 44 2.7 % 275 16.6 % N/A N/A
West Prep at West Hall 1,157 152 13.1 % 260 22.5 % 929 80.3 % N/A N/A
Wengert ES 749 81 10.8 % 320 42.7 % 436 58.2 % N/A N/A
Clark County Schools
IEP = Students with Disabilities LEP = Students with Limited English Proficiency FRL = Students qualifying for Free/Reduced Lunch
‘N/A’ indicates a population of zero. '-' indicates data are not presented for groups fewer than 10.
Total Students IEP LEP FRL Migrant
# # % # % # % # %
Page 20 of 125
2008-2009 Accountability Report
Website: www.nevadareportcard.com Clark County School District
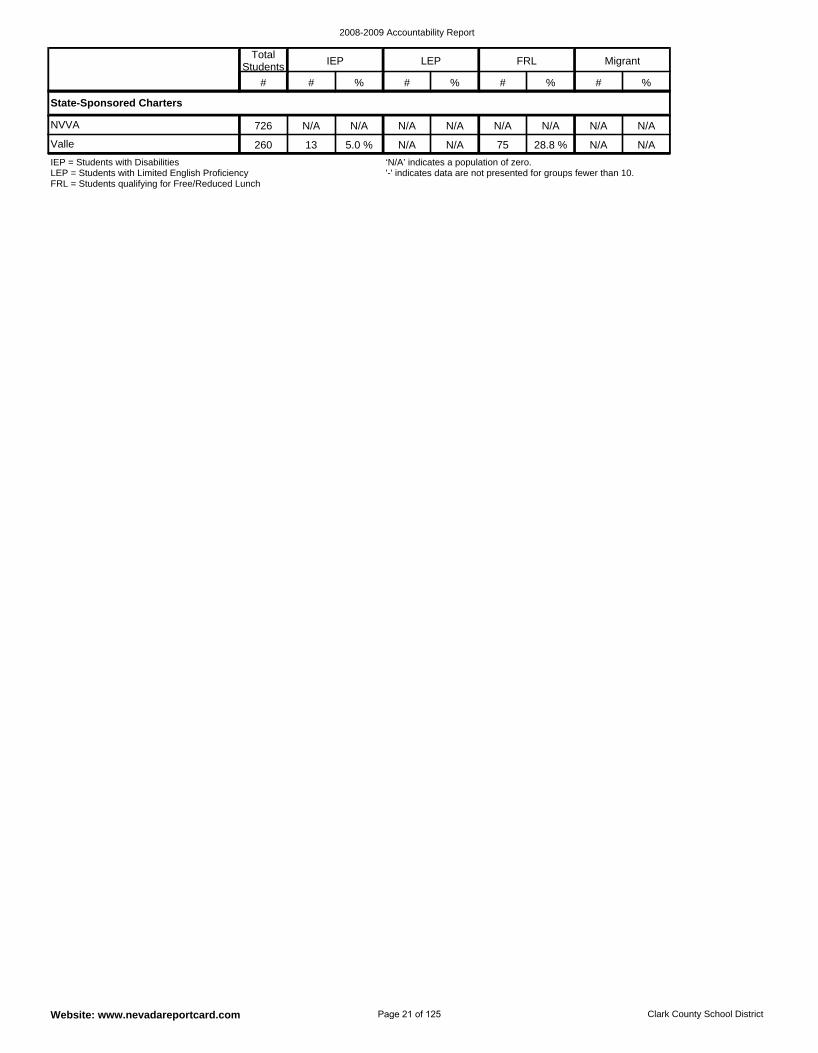
NVVA 726 N/A N/A N/A N/A N/A N/A N/A N/A
Valle 260 13 5.0 % N/A N/A 75 28.8 % N/A N/A
State-Sponsored Charters
IEP = Students with Disabilities LEP = Students with Limited English Proficiency FRL = Students qualifying for Free/Reduced Lunch
‘N/A’ indicates a population of zero. '-' indicates data are not presented for groups fewer than 10.
Total Students IEP LEP FRL Migrant
# # % # % # % # %
Page 21 of 125
2008-2009 Accountability Report
Website: www.nevadareportcard.com Clark County School District
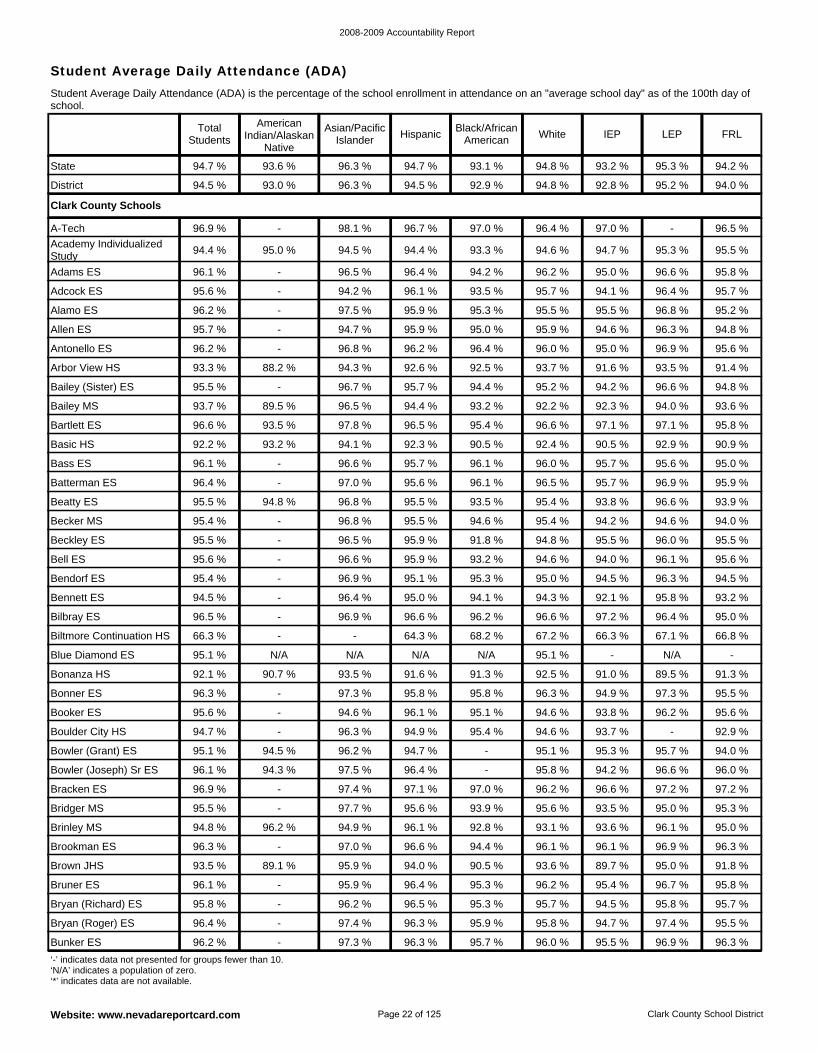
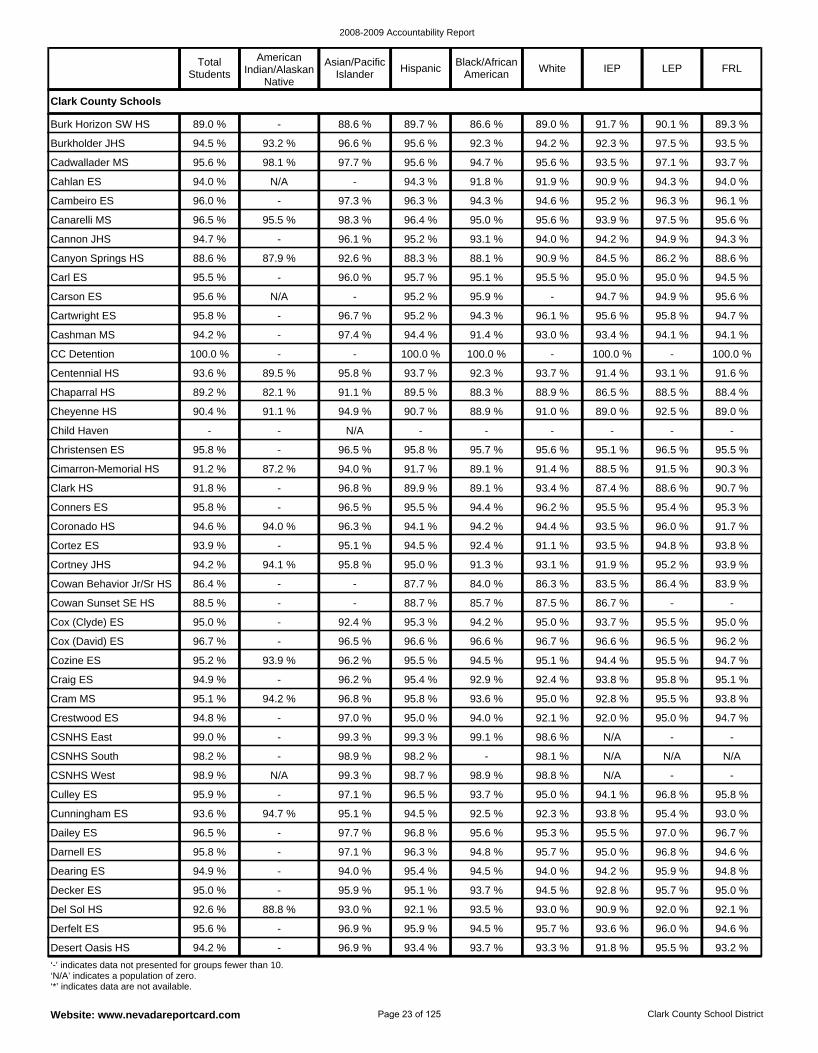
Student Average Daily Attendance (ADA)Student Average Daily Attendance (ADA) is the percentage of the school enrollment in attendance on an "average school day" as of the 100th day of school.
Brinley MS 94.8 % 96.2 % 94.9 % 96.1 % 92.8 % 93.1 % 93.6 % 96.1 % 95.0 %
Bridger MS 95.5 % - 97.7 % 95.6 % 93.9 % 95.6 % 93.5 % 95.0 % 95.3 %
Bracken ES 96.9 % - 97.4 % 97.1 % 97.0 % 96.2 % 96.6 % 97.2 % 97.2 %
Bruner ES 96.1 % - 95.9 % 96.4 % 95.3 % 96.2 % 95.4 % 96.7 % 95.8 %
Brown JHS 93.5 % 89.1 % 95.9 % 94.0 % 90.5 % 93.6 % 89.7 % 95.0 % 91.8 %
Brookman ES 96.3 % - 97.0 % 96.6 % 94.4 % 96.1 % 96.1 % 96.9 % 96.3 %
Bowler (Joseph) Sr ES 96.1 % 94.3 % 97.5 % 96.4 % - 95.8 % 94.2 % 96.6 % 96.0 %
Bonner ES 96.3 % - 97.3 % 95.8 % 95.8 % 96.3 % 94.9 % 97.3 % 95.5 %
Bonanza HS 92.1 % 90.7 % 93.5 % 91.6 % 91.3 % 92.5 % 91.0 % 89.5 % 91.3 %
Bowler (Grant) ES 95.1 % 94.5 % 96.2 % 94.7 % - 95.1 % 95.3 % 95.7 % 94.0 %
Boulder City HS 94.7 % - 96.3 % 94.9 % 95.4 % 94.6 % 93.7 % - 92.9 %
Booker ES 95.6 % - 94.6 % 96.1 % 95.1 % 94.6 % 93.8 % 96.2 % 95.6 %
Bunker ES 96.2 % - 97.3 % 96.3 % 95.7 % 96.0 % 95.5 % 96.9 % 96.3 %
Bryan (Roger) ES 96.4 % - 97.4 % 96.3 % 95.9 % 95.8 % 94.7 % 97.4 % 95.5 %
Bryan (Richard) ES 95.8 % - 96.2 % 96.5 % 95.3 % 95.7 % 94.5 % 95.8 % 95.7 %
Antonello ES 96.2 % - 96.8 % 96.2 % 96.4 % 96.0 % 95.0 % 96.9 % 95.6 %
Allen ES 95.7 % - 94.7 % 95.9 % 95.0 % 95.9 % 94.6 % 96.3 % 94.8 %
Arbor View HS 93.3 % 88.2 % 94.3 % 92.6 % 92.5 % 93.7 % 91.6 % 93.5 % 91.4 %
Bailey MS 93.7 % 89.5 % 96.5 % 94.4 % 93.2 % 92.2 % 92.3 % 94.0 % 93.6 %
Bailey (Sister) ES 95.5 % - 96.7 % 95.7 % 94.4 % 95.2 % 94.2 % 96.6 % 94.8 %
Alamo ES 96.2 % - 97.5 % 95.9 % 95.3 % 95.5 % 95.5 % 96.8 % 95.2 %
A-Tech 96.9 % - 98.1 % 96.7 % 97.0 % 96.4 % 97.0 % - 96.5 %
Blue Diamond ES 95.1 % N/A N/A N/A N/A 95.1 % - N/A -
Academy Individualized Study 94.4 % 95.0 % 94.5 % 94.4 % 93.3 % 94.6 % 94.7 % 95.3 % 95.5 %
Adcock ES 95.6 % - 94.2 % 96.1 % 93.5 % 95.7 % 94.1 % 96.4 % 95.7 %
Adams ES 96.1 % - 96.5 % 96.4 % 94.2 % 96.2 % 95.0 % 96.6 % 95.8 %
Bartlett ES 96.6 % 93.5 % 97.8 % 96.5 % 95.4 % 96.6 % 97.1 % 97.1 % 95.8 %
Bendorf ES 95.4 % - 96.9 % 95.1 % 95.3 % 95.0 % 94.5 % 96.3 % 94.5 %
Bell ES 95.6 % - 96.6 % 95.9 % 93.2 % 94.6 % 94.0 % 96.1 % 95.6 %
Bennett ES 94.5 % - 96.4 % 95.0 % 94.1 % 94.3 % 92.1 % 95.8 % 93.2 %
Biltmore Continuation HS 66.3 % - - 64.3 % 68.2 % 67.2 % 66.3 % 67.1 % 66.8 %
Bilbray ES 96.5 % - 96.9 % 96.6 % 96.2 % 96.6 % 97.2 % 96.4 % 95.0 %
Beckley ES 95.5 % - 96.5 % 95.9 % 91.8 % 94.8 % 95.5 % 96.0 % 95.5 %
Bass ES 96.1 % - 96.6 % 95.7 % 96.1 % 96.0 % 95.7 % 95.6 % 95.0 %
Basic HS 92.2 % 93.2 % 94.1 % 92.3 % 90.5 % 92.4 % 90.5 % 92.9 % 90.9 %
Batterman ES 96.4 % - 97.0 % 95.6 % 96.1 % 96.5 % 95.7 % 96.9 % 95.9 %
Becker MS 95.4 % - 96.8 % 95.5 % 94.6 % 95.4 % 94.2 % 94.6 % 94.0 %
Beatty ES 95.5 % 94.8 % 96.8 % 95.5 % 93.5 % 95.4 % 93.8 % 96.6 % 93.9 %
Clark County Schools
District 94.5 % 93.0 % 96.3 % 94.5 % 92.9 % 94.8 % 92.8 % 95.2 % 94.0 %
State 94.7 % 93.6 % 96.3 % 94.7 % 93.1 % 94.8 % 93.2 % 95.3 % 94.2 %
‘-’ indicates data not presented for groups fewer than 10. ‘N/A’ indicates a population of zero. ‘*’ indicates data are not available.
Total Students
American Indian/Alaskan
Native
Asian/Pacific Islander Hispanic
Black/African American White IEP LEP FRL
Page 22 of 125
2008-2009 Accountability Report
Website: www.nevadareportcard.com Clark County School District
CSNHS West 98.9 % N/A 99.3 % 98.7 % 98.9 % 98.8 % N/A - -
CSNHS South 98.2 % - 98.9 % 98.2 % - 98.1 % N/A N/A N/A
CSNHS East 99.0 % - 99.3 % 99.3 % 99.1 % 98.6 % N/A - -
Dailey ES 96.5 % - 97.7 % 96.8 % 95.6 % 95.3 % 95.5 % 97.0 % 96.7 %
Cunningham ES 93.6 % 94.7 % 95.1 % 94.5 % 92.5 % 92.3 % 93.8 % 95.4 % 93.0 %
Culley ES 95.9 % - 97.1 % 96.5 % 93.7 % 95.0 % 94.1 % 96.8 % 95.8 %
Crestwood ES 94.8 % - 97.0 % 95.0 % 94.0 % 92.1 % 92.0 % 95.0 % 94.7 %
Cox (David) ES 96.7 % - 96.5 % 96.6 % 96.6 % 96.7 % 96.6 % 96.5 % 96.2 %
Cox (Clyde) ES 95.0 % - 92.4 % 95.3 % 94.2 % 95.0 % 93.7 % 95.5 % 95.0 %
Cram MS 95.1 % 94.2 % 96.8 % 95.8 % 93.6 % 95.0 % 92.8 % 95.5 % 93.8 %
Craig ES 94.9 % - 96.2 % 95.4 % 92.9 % 92.4 % 93.8 % 95.8 % 95.1 %
Cozine ES 95.2 % 93.9 % 96.2 % 95.5 % 94.5 % 95.1 % 94.4 % 95.5 % 94.7 %
Decker ES 95.0 % - 95.9 % 95.1 % 93.7 % 94.5 % 92.8 % 95.7 % 95.0 %
Dearing ES 94.9 % - 94.0 % 95.4 % 94.5 % 94.0 % 94.2 % 95.9 % 94.8 %
Darnell ES 95.8 % - 97.1 % 96.3 % 94.8 % 95.7 % 95.0 % 96.8 % 94.6 %
Desert Oasis HS 94.2 % - 96.9 % 93.4 % 93.7 % 93.3 % 91.8 % 95.5 % 93.2 %
Derfelt ES 95.6 % - 96.9 % 95.9 % 94.5 % 95.7 % 93.6 % 96.0 % 94.6 %
Del Sol HS 92.6 % 88.8 % 93.0 % 92.1 % 93.5 % 93.0 % 90.9 % 92.0 % 92.1 %
Cowan Behavior Jr/Sr HS 86.4 % - - 87.7 % 84.0 % 86.3 % 83.5 % 86.4 % 83.9 %
Canyon Springs HS 88.6 % 87.9 % 92.6 % 88.3 % 88.1 % 90.9 % 84.5 % 86.2 % 88.6 %
Cannon JHS 94.7 % - 96.1 % 95.2 % 93.1 % 94.0 % 94.2 % 94.9 % 94.3 %
Canarelli MS 96.5 % 95.5 % 98.3 % 96.4 % 95.0 % 95.6 % 93.9 % 97.5 % 95.6 %
Cartwright ES 95.8 % - 96.7 % 95.2 % 94.3 % 96.1 % 95.6 % 95.8 % 94.7 %
Carson ES 95.6 % N/A - 95.2 % 95.9 % - 94.7 % 94.9 % 95.6 %
Carl ES 95.5 % - 96.0 % 95.7 % 95.1 % 95.5 % 95.0 % 95.0 % 94.5 %
Burkholder JHS 94.5 % 93.2 % 96.6 % 95.6 % 92.3 % 94.2 % 92.3 % 97.5 % 93.5 %
Burk Horizon SW HS 89.0 % - 88.6 % 89.7 % 86.6 % 89.0 % 91.7 % 90.1 % 89.3 %
Cowan Sunset SE HS 88.5 % - - 88.7 % 85.7 % 87.5 % 86.7 % - -
Cambeiro ES 96.0 % - 97.3 % 96.3 % 94.3 % 94.6 % 95.2 % 96.3 % 96.1 %
Cahlan ES 94.0 % N/A - 94.3 % 91.8 % 91.9 % 90.9 % 94.3 % 94.0 %
Cadwallader MS 95.6 % 98.1 % 97.7 % 95.6 % 94.7 % 95.6 % 93.5 % 97.1 % 93.7 %
Cashman MS 94.2 % - 97.4 % 94.4 % 91.4 % 93.0 % 93.4 % 94.1 % 94.1 %
Conners ES 95.8 % - 96.5 % 95.5 % 94.4 % 96.2 % 95.5 % 95.4 % 95.3 %
Clark HS 91.8 % - 96.8 % 89.9 % 89.1 % 93.4 % 87.4 % 88.6 % 90.7 %
Cimarron-Memorial HS 91.2 % 87.2 % 94.0 % 91.7 % 89.1 % 91.4 % 88.5 % 91.5 % 90.3 %
Cortney JHS 94.2 % 94.1 % 95.8 % 95.0 % 91.3 % 93.1 % 91.9 % 95.2 % 93.9 %
Cortez ES 93.9 % - 95.1 % 94.5 % 92.4 % 91.1 % 93.5 % 94.8 % 93.8 %
Coronado HS 94.6 % 94.0 % 96.3 % 94.1 % 94.2 % 94.4 % 93.5 % 96.0 % 91.7 %
Chaparral HS 89.2 % 82.1 % 91.1 % 89.5 % 88.3 % 88.9 % 86.5 % 88.5 % 88.4 %
Centennial HS 93.6 % 89.5 % 95.8 % 93.7 % 92.3 % 93.7 % 91.4 % 93.1 % 91.6 %
CC Detention 100.0 % - - 100.0 % 100.0 % - 100.0 % - 100.0 %
Christensen ES 95.8 % - 96.5 % 95.8 % 95.7 % 95.6 % 95.1 % 96.5 % 95.5 %
Child Haven - - N/A - - - - - -
Cheyenne HS 90.4 % 91.1 % 94.9 % 90.7 % 88.9 % 91.0 % 89.0 % 92.5 % 89.0 %
Clark County Schools
‘-’ indicates data not presented for groups fewer than 10. ‘N/A’ indicates a population of zero. ‘*’ indicates data are not available.
Total Students
American Indian/Alaskan
Native
Asian/Pacific Islander Hispanic
Black/African American White IEP LEP FRL
Page 23 of 125

2008-2009 Accountability Report
Website: www.nevadareportcard.com Clark County School District
Garside JHS 94.4 % - 96.2 % 95.2 % 92.4 % 92.4 % 92.3 % 95.3 % 94.4 %
Garrett JHS 95.2 % 93.2 % - 96.2 % - 95.1 % 92.5 % - 94.3 %
Garehime ES 96.1 % - 96.8 % 95.9 % 95.6 % 96.1 % 95.8 % 95.6 % 95.2 %
Gibson (Robert) MS 93.7 % - 94.3 % 94.5 % 91.5 % 91.1 % 91.5 % 94.1 % 93.9 %
Gibson (James) ES 95.8 % - 96.4 % 95.4 % 95.5 % 95.8 % 94.5 % 96.0 % 96.1 %
Gehring ES 96.0 % - 96.1 % 95.9 % 95.7 % 96.1 % 93.5 % 96.6 % 95.1 %
Galloway ES 95.6 % - 95.4 % 95.7 % 96.2 % 95.6 % 95.2 % 96.6 % 94.6 %
Fremont MS 94.1 % - 94.9 % 94.8 % 89.0 % 92.1 % 92.0 % 94.8 % 94.0 %
Forbuss ES 95.8 % - 96.8 % 95.6 % 95.3 % 95.2 % 94.0 % 96.9 % 95.2 %
Fyfe ES 95.6 % - 97.7 % 96.4 % 93.1 % 95.6 % 93.9 % 96.9 % 95.3 %
Frias ES 96.2 % - 96.6 % 95.9 % 94.9 % 96.5 % 96.3 % 96.2 % 95.7 %
French ES 95.7 % - 96.1 % 95.8 % 96.0 % 95.5 % 94.8 % 96.2 % 95.3 %
Global Community HS 96.6 % N/A 97.3 % 96.6 % - 97.1 % 99.9 % 96.6 % 96.8 %
Givens ES 96.2 % - 97.3 % 95.2 % 95.5 % 96.2 % 95.6 % 96.1 % 95.2 %
Gilbert ES 96.8 % - 97.9 % 97.1 % 96.5 % 96.8 % 95.2 % 97.5 % 96.6 %
Goolsby ES 96.3 % - 96.7 % 96.1 % 96.4 % 96.3 % 95.3 % 96.4 % 95.5 %
Goodsprings ES - N/A N/A N/A N/A - - N/A -
Goldfarb ES 95.8 % - 97.2 % 95.6 % 94.5 % 96.0 % 95.0 % 96.2 % 95.3 %
Fong ES 95.2 % - 95.2 % 95.5 % 95.5 % 94.3 % 93.9 % 96.0 % 95.2 %
Diskin ES 95.6 % - 96.5 % 95.9 % 93.9 % 95.3 % 93.7 % 96.0 % 95.3 %
Dickens ES 95.0 % - 96.5 % 95.7 % 94.0 % 94.4 % 94.3 % 95.5 % 95.0 %
Diaz ES 95.7 % - 97.5 % 96.3 % 93.7 % 95.2 % 94.9 % 96.5 % 95.8 %
Durango HS 93.1 % 87.7 % 95.5 % 92.3 % 91.8 % 93.3 % 90.4 % 93.0 % 92.5 %
Dooley ES 96.0 % - - 95.4 % 97.6 % 96.1 % 96.0 % - 95.1 %
Dondero ES 95.7 % - 96.2 % 96.2 % 95.5 % 94.8 % 94.1 % 96.6 % 96.0 %
Desert Rose HS 79.9 % - 81.9 % 79.7 % 79.7 % 80.9 % 76.2 % 82.6 % 81.3 %
Desert Pines HS 88.6 % - 92.0 % 88.8 % 87.3 % 88.3 % 84.5 % 87.4 % 88.4 %
Foothill HS 93.7 % 95.0 % 95.9 % 93.2 % 94.2 % 93.6 % 90.0 % 94.1 % 91.5 %
Detwiler ES 95.5 % - 95.5 % 96.6 % 93.4 % 94.6 % 95.6 % 96.7 % 95.6 %
Deskin ES 95.8 % - 96.2 % 96.4 % 94.7 % 95.8 % 95.2 % 96.5 % 95.5 %
Desert Willow School 99.8 % - - - - 99.9 % 99.9 % - 100.0 %
Earl (Ira) ES 95.5 % - 97.5 % 95.8 % 93.0 % 94.0 % 94.3 % 95.8 % 95.6 %
Ferron ES 96.5 % 97.4 % 95.7 % 96.7 % 95.1 % 96.5 % 95.5 % 96.9 % 96.3 %
Faiss MS 97.7 % - 98.8 % 97.9 % 96.6 % 97.1 % 96.1 % 98.5 % 97.2 %
Escobedo MS 95.1 % - 96.4 % 95.4 % 93.5 % 95.3 % 92.3 % 94.8 % 93.6 %
Fitzgerald ES 95.4 % N/A - 96.9 % 94.5 % 94.7 % 95.6 % 96.9 % 95.4 %
Findlay MS 94.0 % - 96.4 % 94.4 % 92.7 % 94.1 % 92.6 % 95.5 % 93.2 %
Fertitta MS 96.1 % 94.5 % 98.0 % 96.0 % 94.9 % 95.7 % 93.9 % 97.2 % 95.2 %
Edwards ES 95.2 % - 97.2 % 95.3 % 93.6 % 95.0 % 94.6 % 95.4 % 95.2 %
East CTA 96.7 % - 97.3 % 97.0 % 95.8 % 95.6 % 96.0 % 96.8 % 96.7 %
Earl (Marion) ES 95.7 % - 96.7 % 95.7 % 94.8 % 95.5 % 92.3 % 96.4 % 95.0 %
Elizondo ES 95.7 % - 95.9 % 96.2 % 94.8 % 95.5 % 95.5 % 96.4 % 95.1 %
Eldorado HS 89.7 % 90.0 % 93.3 % 89.6 % 88.8 % 90.0 % 87.5 % 88.5 % 89.3 %
Eisenberg ES 95.8 % - 96.2 % 95.7 % 95.3 % 95.9 % 94.0 % 96.1 % 95.4 %
Clark County Schools
‘-’ indicates data not presented for groups fewer than 10. ‘N/A’ indicates a population of zero. ‘*’ indicates data are not available.
Total Students
American Indian/Alaskan
Native
Asian/Pacific Islander Hispanic
Black/African American White IEP LEP FRL
Page 24 of 125
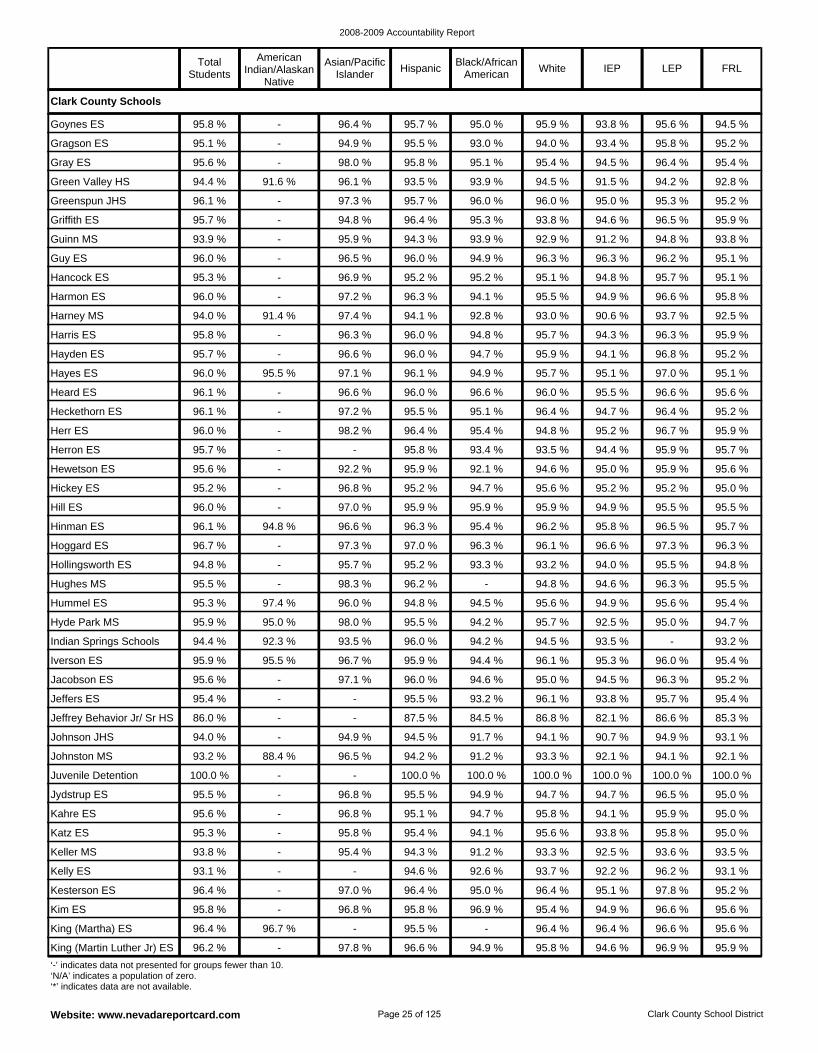
2008-2009 Accountability Report
Website: www.nevadareportcard.com Clark County School District
Juvenile Detention 100.0 % - - 100.0 % 100.0 % 100.0 % 100.0 % 100.0 % 100.0 %
Johnston MS 93.2 % 88.4 % 96.5 % 94.2 % 91.2 % 93.3 % 92.1 % 94.1 % 92.1 %
Johnson JHS 94.0 % - 94.9 % 94.5 % 91.7 % 94.1 % 90.7 % 94.9 % 93.1 %
Katz ES 95.3 % - 95.8 % 95.4 % 94.1 % 95.6 % 93.8 % 95.8 % 95.0 %
Kahre ES 95.6 % - 96.8 % 95.1 % 94.7 % 95.8 % 94.1 % 95.9 % 95.0 %
Jydstrup ES 95.5 % - 96.8 % 95.5 % 94.9 % 94.7 % 94.7 % 96.5 % 95.0 %
Jeffrey Behavior Jr/ Sr HS 86.0 % - - 87.5 % 84.5 % 86.8 % 82.1 % 86.6 % 85.3 %
Indian Springs Schools 94.4 % 92.3 % 93.5 % 96.0 % 94.2 % 94.5 % 93.5 % - 93.2 %
Hyde Park MS 95.9 % 95.0 % 98.0 % 95.5 % 94.2 % 95.7 % 92.5 % 95.0 % 94.7 %
Jeffers ES 95.4 % - - 95.5 % 93.2 % 96.1 % 93.8 % 95.7 % 95.4 %
Jacobson ES 95.6 % - 97.1 % 96.0 % 94.6 % 95.0 % 94.5 % 96.3 % 95.2 %
Iverson ES 95.9 % 95.5 % 96.7 % 95.9 % 94.4 % 96.1 % 95.3 % 96.0 % 95.4 %
Kesterson ES 96.4 % - 97.0 % 96.4 % 95.0 % 96.4 % 95.1 % 97.8 % 95.2 %
Kelly ES 93.1 % - - 94.6 % 92.6 % 93.7 % 92.2 % 96.2 % 93.1 %
Keller MS 93.8 % - 95.4 % 94.3 % 91.2 % 93.3 % 92.5 % 93.6 % 93.5 %
King (Martin Luther Jr) ES 96.2 % - 97.8 % 96.6 % 94.9 % 95.8 % 94.6 % 96.9 % 95.9 %
King (Martha) ES 96.4 % 96.7 % - 95.5 % - 96.4 % 96.4 % 96.6 % 95.6 %
Kim ES 95.8 % - 96.8 % 95.8 % 96.9 % 95.4 % 94.9 % 96.6 % 95.6 %
Hughes MS 95.5 % - 98.3 % 96.2 % - 94.8 % 94.6 % 96.3 % 95.5 %
Guy ES 96.0 % - 96.5 % 96.0 % 94.9 % 96.3 % 96.3 % 96.2 % 95.1 %
Guinn MS 93.9 % - 95.9 % 94.3 % 93.9 % 92.9 % 91.2 % 94.8 % 93.8 %
Griffith ES 95.7 % - 94.8 % 96.4 % 95.3 % 93.8 % 94.6 % 96.5 % 95.9 %
Harney MS 94.0 % 91.4 % 97.4 % 94.1 % 92.8 % 93.0 % 90.6 % 93.7 % 92.5 %
Harmon ES 96.0 % - 97.2 % 96.3 % 94.1 % 95.5 % 94.9 % 96.6 % 95.8 %
Hancock ES 95.3 % - 96.9 % 95.2 % 95.2 % 95.1 % 94.8 % 95.7 % 95.1 %
Gragson ES 95.1 % - 94.9 % 95.5 % 93.0 % 94.0 % 93.4 % 95.8 % 95.2 %
Goynes ES 95.8 % - 96.4 % 95.7 % 95.0 % 95.9 % 93.8 % 95.6 % 94.5 %
Hummel ES 95.3 % 97.4 % 96.0 % 94.8 % 94.5 % 95.6 % 94.9 % 95.6 % 95.4 %
Greenspun JHS 96.1 % - 97.3 % 95.7 % 96.0 % 96.0 % 95.0 % 95.3 % 95.2 %
Green Valley HS 94.4 % 91.6 % 96.1 % 93.5 % 93.9 % 94.5 % 91.5 % 94.2 % 92.8 %
Gray ES 95.6 % - 98.0 % 95.8 % 95.1 % 95.4 % 94.5 % 96.4 % 95.4 %
Harris ES 95.8 % - 96.3 % 96.0 % 94.8 % 95.7 % 94.3 % 96.3 % 95.9 %
Hill ES 96.0 % - 97.0 % 95.9 % 95.9 % 95.9 % 94.9 % 95.5 % 95.5 %
Hickey ES 95.2 % - 96.8 % 95.2 % 94.7 % 95.6 % 95.2 % 95.2 % 95.0 %
Hewetson ES 95.6 % - 92.2 % 95.9 % 92.1 % 94.6 % 95.0 % 95.9 % 95.6 %
Hollingsworth ES 94.8 % - 95.7 % 95.2 % 93.3 % 93.2 % 94.0 % 95.5 % 94.8 %
Hoggard ES 96.7 % - 97.3 % 97.0 % 96.3 % 96.1 % 96.6 % 97.3 % 96.3 %
Hinman ES 96.1 % 94.8 % 96.6 % 96.3 % 95.4 % 96.2 % 95.8 % 96.5 % 95.7 %
Heard ES 96.1 % - 96.6 % 96.0 % 96.6 % 96.0 % 95.5 % 96.6 % 95.6 %
Hayes ES 96.0 % 95.5 % 97.1 % 96.1 % 94.9 % 95.7 % 95.1 % 97.0 % 95.1 %
Hayden ES 95.7 % - 96.6 % 96.0 % 94.7 % 95.9 % 94.1 % 96.8 % 95.2 %
Herron ES 95.7 % - - 95.8 % 93.4 % 93.5 % 94.4 % 95.9 % 95.7 %
Herr ES 96.0 % - 98.2 % 96.4 % 95.4 % 94.8 % 95.2 % 96.7 % 95.9 %
Heckethorn ES 96.1 % - 97.2 % 95.5 % 95.1 % 96.4 % 94.7 % 96.4 % 95.2 %
Clark County Schools
‘-’ indicates data not presented for groups fewer than 10. ‘N/A’ indicates a population of zero. ‘*’ indicates data are not available.
Total Students
American Indian/Alaskan
Native
Asian/Pacific Islander Hispanic
Black/African American White IEP LEP FRL
Page 25 of 125
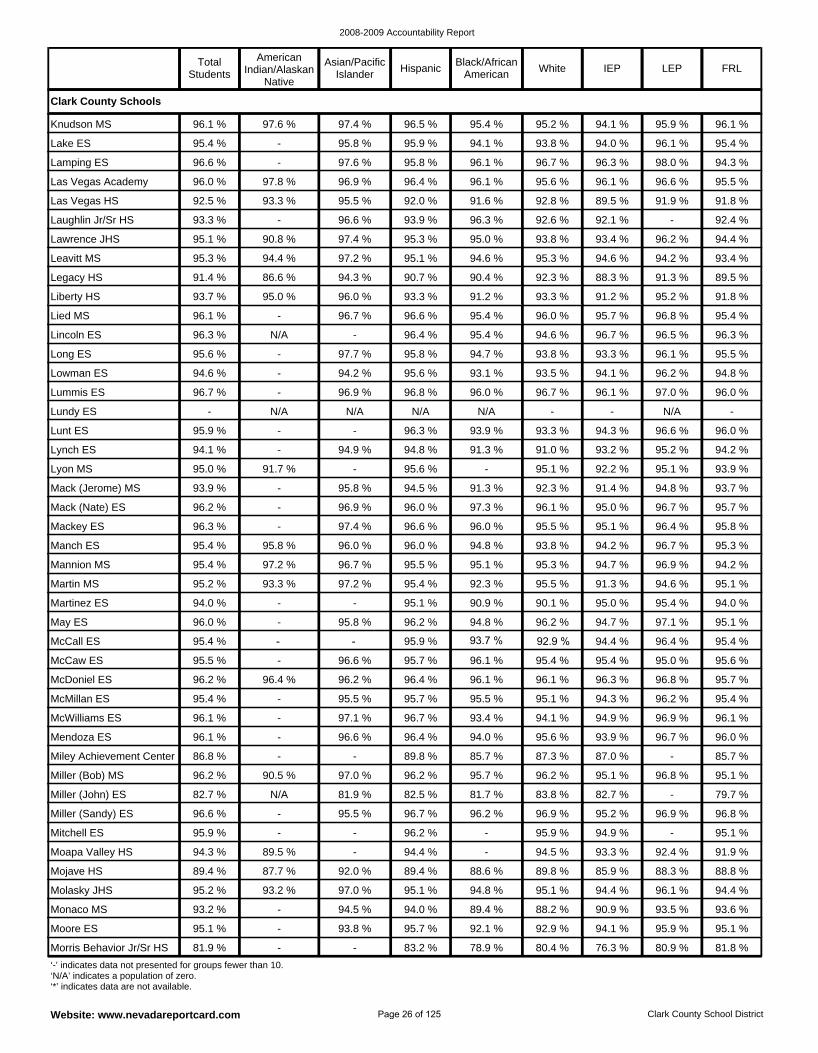
2008-2009 Accountability Report
Website: www.nevadareportcard.com Clark County School District
Miller (Bob) MS 96.2 % 90.5 % 97.0 % 96.2 % 95.7 % 96.2 % 95.1 % 96.8 % 95.1 %
Miley Achievement Center 86.8 % - - 89.8 % 85.7 % 87.3 % 87.0 % - 85.7 %
Mendoza ES 96.1 % - 96.6 % 96.4 % 94.0 % 95.6 % 93.9 % 96.7 % 96.0 %
Mitchell ES 95.9 % - - 96.2 % - 95.9 % 94.9 % - 95.1 %
Miller (Sandy) ES 96.6 % - 95.5 % 96.7 % 96.2 % 96.9 % 95.2 % 96.9 % 96.8 %
Miller (John) ES 82.7 % N/A 81.9 % 82.5 % 81.7 % 83.8 % 82.7 % - 79.7 %
McWilliams ES 96.1 % - 97.1 % 96.7 % 93.4 % 94.1 % 94.9 % 96.9 % 96.1 %
McCall ES 95.4 % - - 95.9 % 93.7 % 92.9 % 94.4 % 96.4 % 95.4 %
May ES 96.0 % - 95.8 % 96.2 % 94.8 % 96.2 % 94.7 % 97.1 % 95.1 %
McMillan ES 95.4 % - 95.5 % 95.7 % 95.5 % 95.1 % 94.3 % 96.2 % 95.4 %
McDoniel ES 96.2 % 96.4 % 96.2 % 96.4 % 96.1 % 96.1 % 96.3 % 96.8 % 95.7 %
McCaw ES 95.5 % - 96.6 % 95.7 % 96.1 % 95.4 % 95.4 % 95.0 % 95.6 %
Molasky JHS 95.2 % 93.2 % 97.0 % 95.1 % 94.8 % 95.1 % 94.4 % 96.1 % 94.4 %
Mojave HS 89.4 % 87.7 % 92.0 % 89.4 % 88.6 % 89.8 % 85.9 % 88.3 % 88.8 %
Moapa Valley HS 94.3 % 89.5 % - 94.4 % - 94.5 % 93.3 % 92.4 % 91.9 %
Morris Behavior Jr/Sr HS 81.9 % - - 83.2 % 78.9 % 80.4 % 76.3 % 80.9 % 81.8 %
Moore ES 95.1 % - 93.8 % 95.7 % 92.1 % 92.9 % 94.1 % 95.9 % 95.1 %
Monaco MS 93.2 % - 94.5 % 94.0 % 89.4 % 88.2 % 90.9 % 93.5 % 93.6 %
Martin MS 95.2 % 93.3 % 97.2 % 95.4 % 92.3 % 95.5 % 91.3 % 94.6 % 95.1 %
Leavitt MS 95.3 % 94.4 % 97.2 % 95.1 % 94.6 % 95.3 % 94.6 % 94.2 % 93.4 %
Lawrence JHS 95.1 % 90.8 % 97.4 % 95.3 % 95.0 % 93.8 % 93.4 % 96.2 % 94.4 %
Laughlin Jr/Sr HS 93.3 % - 96.6 % 93.9 % 96.3 % 92.6 % 92.1 % - 92.4 %
Lied MS 96.1 % - 96.7 % 96.6 % 95.4 % 96.0 % 95.7 % 96.8 % 95.4 %
Liberty HS 93.7 % 95.0 % 96.0 % 93.3 % 91.2 % 93.3 % 91.2 % 95.2 % 91.8 %
Legacy HS 91.4 % 86.6 % 94.3 % 90.7 % 90.4 % 92.3 % 88.3 % 91.3 % 89.5 %
Lake ES 95.4 % - 95.8 % 95.9 % 94.1 % 93.8 % 94.0 % 96.1 % 95.4 %
Knudson MS 96.1 % 97.6 % 97.4 % 96.5 % 95.4 % 95.2 % 94.1 % 95.9 % 96.1 %
Martinez ES 94.0 % - - 95.1 % 90.9 % 90.1 % 95.0 % 95.4 % 94.0 %
Las Vegas HS 92.5 % 93.3 % 95.5 % 92.0 % 91.6 % 92.8 % 89.5 % 91.9 % 91.8 %
Las Vegas Academy 96.0 % 97.8 % 96.9 % 96.4 % 96.1 % 95.6 % 96.1 % 96.6 % 95.5 %
Lamping ES 96.6 % - 97.6 % 95.8 % 96.1 % 96.7 % 96.3 % 98.0 % 94.3 %
Lincoln ES 96.3 % N/A - 96.4 % 95.4 % 94.6 % 96.7 % 96.5 % 96.3 %
Mack (Nate) ES 96.2 % - 96.9 % 96.0 % 97.3 % 96.1 % 95.0 % 96.7 % 95.7 %
Mack (Jerome) MS 93.9 % - 95.8 % 94.5 % 91.3 % 92.3 % 91.4 % 94.8 % 93.7 %
Lyon MS 95.0 % 91.7 % - 95.6 % - 95.1 % 92.2 % 95.1 % 93.9 %
Mannion MS 95.4 % 97.2 % 96.7 % 95.5 % 95.1 % 95.3 % 94.7 % 96.9 % 94.2 %
Manch ES 95.4 % 95.8 % 96.0 % 96.0 % 94.8 % 93.8 % 94.2 % 96.7 % 95.3 %
Mackey ES 96.3 % - 97.4 % 96.6 % 96.0 % 95.5 % 95.1 % 96.4 % 95.8 %
Lummis ES 96.7 % - 96.9 % 96.8 % 96.0 % 96.7 % 96.1 % 97.0 % 96.0 %
Lowman ES 94.6 % - 94.2 % 95.6 % 93.1 % 93.5 % 94.1 % 96.2 % 94.8 %
Long ES 95.6 % - 97.7 % 95.8 % 94.7 % 93.8 % 93.3 % 96.1 % 95.5 %
Lynch ES 94.1 % - 94.9 % 94.8 % 91.3 % 91.0 % 93.2 % 95.2 % 94.2 %
Lunt ES 95.9 % - - 96.3 % 93.9 % 93.3 % 94.3 % 96.6 % 96.0 %
Lundy ES - N/A N/A N/A N/A - - N/A -
Clark County Schools
‘-’ indicates data not presented for groups fewer than 10. ‘N/A’ indicates a population of zero. ‘*’ indicates data are not available.
Total Students
American Indian/Alaskan
Native
Asian/Pacific Islander Hispanic
Black/African American White IEP LEP FRL
Page 26 of 125
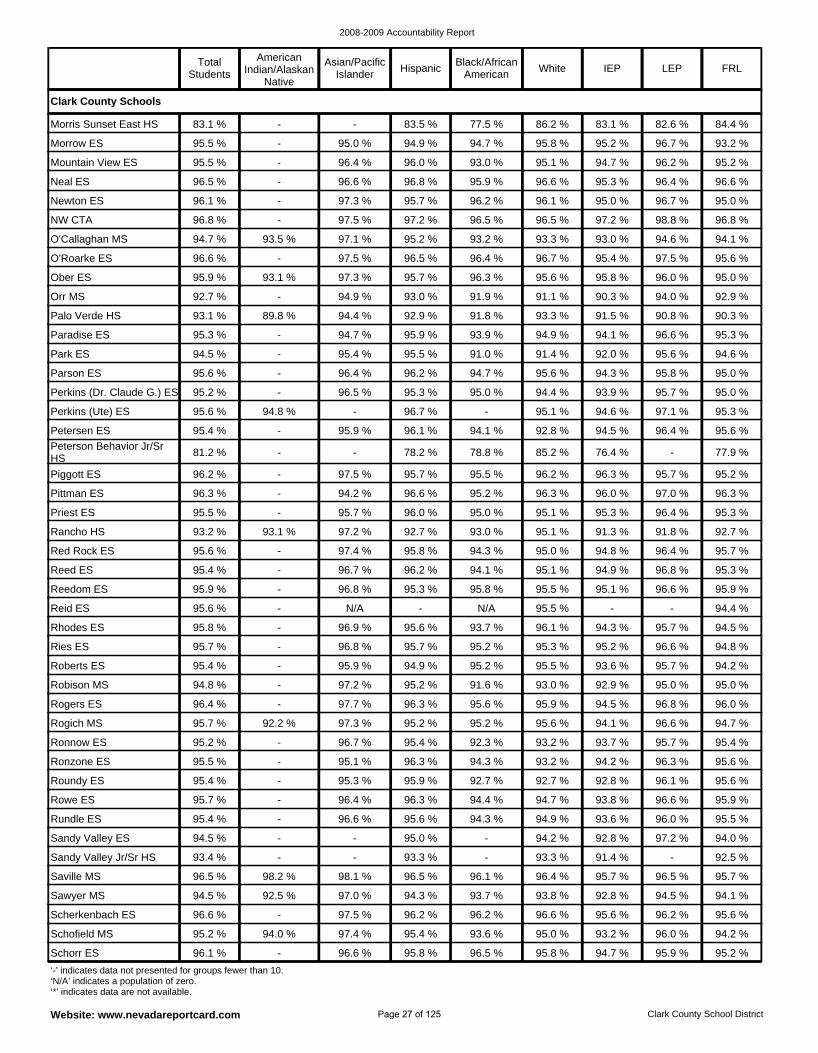
2008-2009 Accountability Report
Website: www.nevadareportcard.com Clark County School District
Roundy ES 95.4 % - 95.3 % 95.9 % 92.7 % 92.7 % 92.8 % 96.1 % 95.6 %
Ronzone ES 95.5 % - 95.1 % 96.3 % 94.3 % 93.2 % 94.2 % 96.3 % 95.6 %
Ronnow ES 95.2 % - 96.7 % 95.4 % 92.3 % 93.2 % 93.7 % 95.7 % 95.4 %
Sandy Valley ES 94.5 % - - 95.0 % - 94.2 % 92.8 % 97.2 % 94.0 %
Rundle ES 95.4 % - 96.6 % 95.6 % 94.3 % 94.9 % 93.6 % 96.0 % 95.5 %
Rowe ES 95.7 % - 96.4 % 96.3 % 94.4 % 94.7 % 93.8 % 96.6 % 95.9 %
Rogich MS 95.7 % 92.2 % 97.3 % 95.2 % 95.2 % 95.6 % 94.1 % 96.6 % 94.7 %
Ries ES 95.7 % - 96.8 % 95.7 % 95.2 % 95.3 % 95.2 % 96.6 % 94.8 %
Rhodes ES 95.8 % - 96.9 % 95.6 % 93.7 % 96.1 % 94.3 % 95.7 % 94.5 %
Rogers ES 96.4 % - 97.7 % 96.3 % 95.6 % 95.9 % 94.5 % 96.8 % 96.0 %
Robison MS 94.8 % - 97.2 % 95.2 % 91.6 % 93.0 % 92.9 % 95.0 % 95.0 %
Roberts ES 95.4 % - 95.9 % 94.9 % 95.2 % 95.5 % 93.6 % 95.7 % 94.2 %
Sawyer MS 94.5 % 92.5 % 97.0 % 94.3 % 93.7 % 93.8 % 92.8 % 94.5 % 94.1 %
Saville MS 96.5 % 98.2 % 98.1 % 96.5 % 96.1 % 96.4 % 95.7 % 96.5 % 95.7 %
Sandy Valley Jr/Sr HS 93.4 % - - 93.3 % - 93.3 % 91.4 % - 92.5 %
Schorr ES 96.1 % - 96.6 % 95.8 % 96.5 % 95.8 % 94.7 % 95.9 % 95.2 %
Schofield MS 95.2 % 94.0 % 97.4 % 95.4 % 93.6 % 95.0 % 93.2 % 96.0 % 94.2 %
Scherkenbach ES 96.6 % - 97.5 % 96.2 % 96.2 % 96.6 % 95.6 % 96.2 % 95.6 %
Reedom ES 95.9 % - 96.8 % 95.3 % 95.8 % 95.5 % 95.1 % 96.6 % 95.9 %
O'Roarke ES 96.6 % - 97.5 % 96.5 % 96.4 % 96.7 % 95.4 % 97.5 % 95.6 %
O'Callaghan MS 94.7 % 93.5 % 97.1 % 95.2 % 93.2 % 93.3 % 93.0 % 94.6 % 94.1 %
NW CTA 96.8 % - 97.5 % 97.2 % 96.5 % 96.5 % 97.2 % 98.8 % 96.8 %
Palo Verde HS 93.1 % 89.8 % 94.4 % 92.9 % 91.8 % 93.3 % 91.5 % 90.8 % 90.3 %
Orr MS 92.7 % - 94.9 % 93.0 % 91.9 % 91.1 % 90.3 % 94.0 % 92.9 %
Ober ES 95.9 % 93.1 % 97.3 % 95.7 % 96.3 % 95.6 % 95.8 % 96.0 % 95.0 %
Morrow ES 95.5 % - 95.0 % 94.9 % 94.7 % 95.8 % 95.2 % 96.7 % 93.2 %
Morris Sunset East HS 83.1 % - - 83.5 % 77.5 % 86.2 % 83.1 % 82.6 % 84.4 %
Reid ES 95.6 % - N/A - N/A 95.5 % - - 94.4 %
Newton ES 96.1 % - 97.3 % 95.7 % 96.2 % 96.1 % 95.0 % 96.7 % 95.0 %
Neal ES 96.5 % - 96.6 % 96.8 % 95.9 % 96.6 % 95.3 % 96.4 % 96.6 %
Mountain View ES 95.5 % - 96.4 % 96.0 % 93.0 % 95.1 % 94.7 % 96.2 % 95.2 %
Paradise ES 95.3 % - 94.7 % 95.9 % 93.9 % 94.9 % 94.1 % 96.6 % 95.3 %
Priest ES 95.5 % - 95.7 % 96.0 % 95.0 % 95.1 % 95.3 % 96.4 % 95.3 %
Pittman ES 96.3 % - 94.2 % 96.6 % 95.2 % 96.3 % 96.0 % 97.0 % 96.3 %
Piggott ES 96.2 % - 97.5 % 95.7 % 95.5 % 96.2 % 96.3 % 95.7 % 95.2 %
Reed ES 95.4 % - 96.7 % 96.2 % 94.1 % 95.1 % 94.9 % 96.8 % 95.3 %
Red Rock ES 95.6 % - 97.4 % 95.8 % 94.3 % 95.0 % 94.8 % 96.4 % 95.7 %
Rancho HS 93.2 % 93.1 % 97.2 % 92.7 % 93.0 % 95.1 % 91.3 % 91.8 % 92.7 %
Perkins (Dr. Claude G.) ES 95.2 % - 96.5 % 95.3 % 95.0 % 94.4 % 93.9 % 95.7 % 95.0 %
Parson ES 95.6 % - 96.4 % 96.2 % 94.7 % 95.6 % 94.3 % 95.8 % 95.0 %
Park ES 94.5 % - 95.4 % 95.5 % 91.0 % 91.4 % 92.0 % 95.6 % 94.6 %
Peterson Behavior Jr/Sr HS 81.2 % - - 78.2 % 78.8 % 85.2 % 76.4 % - 77.9 %
Petersen ES 95.4 % - 95.9 % 96.1 % 94.1 % 92.8 % 94.5 % 96.4 % 95.6 %
Perkins (Ute) ES 95.6 % 94.8 % - 96.7 % - 95.1 % 94.6 % 97.1 % 95.3 %
Clark County Schools
‘-’ indicates data not presented for groups fewer than 10. ‘N/A’ indicates a population of zero. ‘*’ indicates data are not available.
Total Students
American Indian/Alaskan
Native
Asian/Pacific Islander Hispanic
Black/African American White IEP LEP FRL
Page 27 of 125
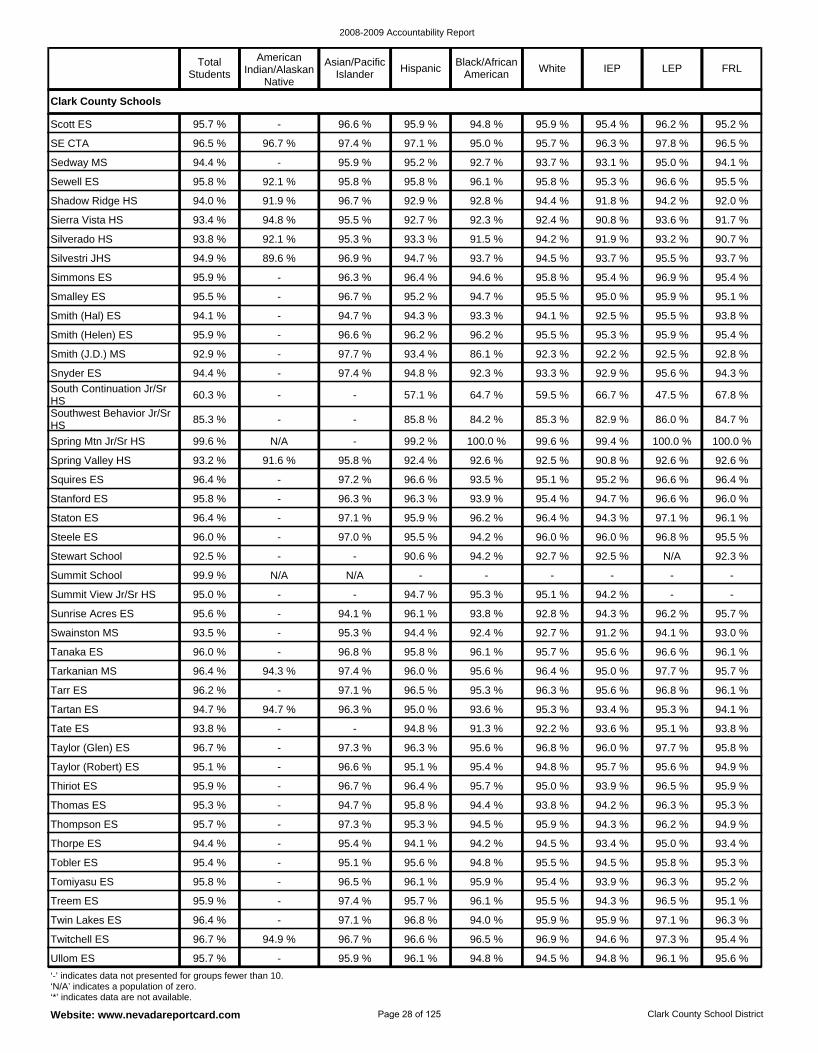
2008-2009 Accountability Report
Website: www.nevadareportcard.com Clark County School District
Thiriot ES 95.9 % - 96.7 % 96.4 % 95.7 % 95.0 % 93.9 % 96.5 % 95.9 %
Taylor (Robert) ES 95.1 % - 96.6 % 95.1 % 95.4 % 94.8 % 95.7 % 95.6 % 94.9 %
Taylor (Glen) ES 96.7 % - 97.3 % 96.3 % 95.6 % 96.8 % 96.0 % 97.7 % 95.8 %
Thorpe ES 94.4 % - 95.4 % 94.1 % 94.2 % 94.5 % 93.4 % 95.0 % 93.4 %
Thompson ES 95.7 % - 97.3 % 95.3 % 94.5 % 95.9 % 94.3 % 96.2 % 94.9 %
Thomas ES 95.3 % - 94.7 % 95.8 % 94.4 % 93.8 % 94.2 % 96.3 % 95.3 %
Tate ES 93.8 % - - 94.8 % 91.3 % 92.2 % 93.6 % 95.1 % 93.8 %
Tanaka ES 96.0 % - 96.8 % 95.8 % 96.1 % 95.7 % 95.6 % 96.6 % 96.1 %
Swainston MS 93.5 % - 95.3 % 94.4 % 92.4 % 92.7 % 91.2 % 94.1 % 93.0 %
Tartan ES 94.7 % 94.7 % 96.3 % 95.0 % 93.6 % 95.3 % 93.4 % 95.3 % 94.1 %
Tarr ES 96.2 % - 97.1 % 96.5 % 95.3 % 96.3 % 95.6 % 96.8 % 96.1 %
Tarkanian MS 96.4 % 94.3 % 97.4 % 96.0 % 95.6 % 96.4 % 95.0 % 97.7 % 95.7 %
Treem ES 95.9 % - 97.4 % 95.7 % 96.1 % 95.5 % 94.3 % 96.5 % 95.1 %
Tomiyasu ES 95.8 % - 96.5 % 96.1 % 95.9 % 95.4 % 93.9 % 96.3 % 95.2 %
Tobler ES 95.4 % - 95.1 % 95.6 % 94.8 % 95.5 % 94.5 % 95.8 % 95.3 %
Ullom ES 95.7 % - 95.9 % 96.1 % 94.8 % 94.5 % 94.8 % 96.1 % 95.6 %
Twitchell ES 96.7 % 94.9 % 96.7 % 96.6 % 96.5 % 96.9 % 94.6 % 97.3 % 95.4 %
Twin Lakes ES 96.4 % - 97.1 % 96.8 % 94.0 % 95.9 % 95.9 % 97.1 % 96.3 %
Summit View Jr/Sr HS 95.0 % - - 94.7 % 95.3 % 95.1 % 94.2 % - -
Silvestri JHS 94.9 % 89.6 % 96.9 % 94.7 % 93.7 % 94.5 % 93.7 % 95.5 % 93.7 %
Silverado HS 93.8 % 92.1 % 95.3 % 93.3 % 91.5 % 94.2 % 91.9 % 93.2 % 90.7 %
Sierra Vista HS 93.4 % 94.8 % 95.5 % 92.7 % 92.3 % 92.4 % 90.8 % 93.6 % 91.7 %
Smith (Hal) ES 94.1 % - 94.7 % 94.3 % 93.3 % 94.1 % 92.5 % 95.5 % 93.8 %
Smalley ES 95.5 % - 96.7 % 95.2 % 94.7 % 95.5 % 95.0 % 95.9 % 95.1 %
Simmons ES 95.9 % - 96.3 % 96.4 % 94.6 % 95.8 % 95.4 % 96.9 % 95.4 %
SE CTA 96.5 % 96.7 % 97.4 % 97.1 % 95.0 % 95.7 % 96.3 % 97.8 % 96.5 %
Scott ES 95.7 % - 96.6 % 95.9 % 94.8 % 95.9 % 95.4 % 96.2 % 95.2 %
Sunrise Acres ES 95.6 % - 94.1 % 96.1 % 93.8 % 92.8 % 94.3 % 96.2 % 95.7 %
Shadow Ridge HS 94.0 % 91.9 % 96.7 % 92.9 % 92.8 % 94.4 % 91.8 % 94.2 % 92.0 %
Sewell ES 95.8 % 92.1 % 95.8 % 95.8 % 96.1 % 95.8 % 95.3 % 96.6 % 95.5 %
Sedway MS 94.4 % - 95.9 % 95.2 % 92.7 % 93.7 % 93.1 % 95.0 % 94.1 %
Smith (Helen) ES 95.9 % - 96.6 % 96.2 % 96.2 % 95.5 % 95.3 % 95.9 % 95.4 %
Staton ES 96.4 % - 97.1 % 95.9 % 96.2 % 96.4 % 94.3 % 97.1 % 96.1 %
Stanford ES 95.8 % - 96.3 % 96.3 % 93.9 % 95.4 % 94.7 % 96.6 % 96.0 %
Squires ES 96.4 % - 97.2 % 96.6 % 93.5 % 95.1 % 95.2 % 96.6 % 96.4 %
Summit School 99.9 % N/A N/A - - - - - -
Stewart School 92.5 % - - 90.6 % 94.2 % 92.7 % 92.5 % N/A 92.3 %
Steele ES 96.0 % - 97.0 % 95.5 % 94.2 % 96.0 % 96.0 % 96.8 % 95.5 %
South Continuation Jr/Sr HS 60.3 % - - 57.1 % 64.7 % 59.5 % 66.7 % 47.5 % 67.8 %
Snyder ES 94.4 % - 97.4 % 94.8 % 92.3 % 93.3 % 92.9 % 95.6 % 94.3 %
Smith (J.D.) MS 92.9 % - 97.7 % 93.4 % 86.1 % 92.3 % 92.2 % 92.5 % 92.8 %
Spring Valley HS 93.2 % 91.6 % 95.8 % 92.4 % 92.6 % 92.5 % 90.8 % 92.6 % 92.6 %
Spring Mtn Jr/Sr HS 99.6 % N/A - 99.2 % 100.0 % 99.6 % 99.4 % 100.0 % 100.0 %
Southwest Behavior Jr/Sr HS 85.3 % - - 85.8 % 84.2 % 85.3 % 82.9 % 86.0 % 84.7 %
Clark County Schools
‘-’ indicates data not presented for groups fewer than 10. ‘N/A’ indicates a population of zero. ‘*’ indicates data are not available.
Total Students
American Indian/Alaskan
Native
Asian/Pacific Islander Hispanic
Black/African American White IEP LEP FRL
Page 28 of 125
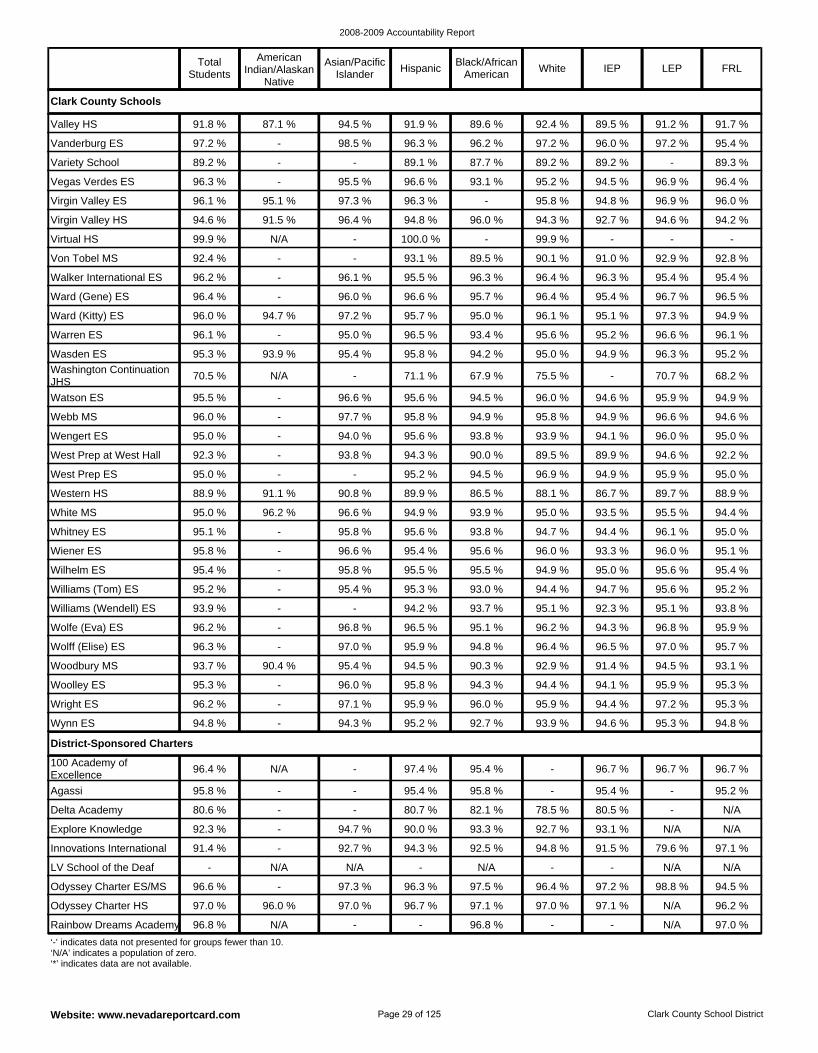
2008-2009 Accountability Report
Website: www.nevadareportcard.com Clark County School District
Explore Knowledge 92.3 % - 94.7 % 90.0 % 93.3 % 92.7 % 93.1 % N/A N/A
Agassi 95.8 % - - 95.4 % 95.8 % - 95.4 % - 95.2 %
Delta Academy 80.6 % - - 80.7 % 82.1 % 78.5 % 80.5 % - N/A
100 Academy of Excellence 96.4 % N/A - 97.4 % 95.4 % - 96.7 % 96.7 % 96.7 %
Innovations International 91.4 % - 92.7 % 94.3 % 92.5 % 94.8 % 91.5 % 79.6 % 97.1 %
Odyssey Charter HS 97.0 % 96.0 % 97.0 % 96.7 % 97.1 % 97.0 % 97.1 % N/A 96.2 %
Rainbow Dreams Academy 96.8 % N/A - - 96.8 % - - N/A 97.0 %
LV School of the Deaf - N/A N/A - N/A - - N/A N/A
Odyssey Charter ES/MS 96.6 % - 97.3 % 96.3 % 97.5 % 96.4 % 97.2 % 98.8 % 94.5 %
District-Sponsored Charters
Williams (Wendell) ES 93.9 % - - 94.2 % 93.7 % 95.1 % 92.3 % 95.1 % 93.8 %
Wolfe (Eva) ES 96.2 % - 96.8 % 96.5 % 95.1 % 96.2 % 94.3 % 96.8 % 95.9 %
Wilhelm ES 95.4 % - 95.8 % 95.5 % 95.5 % 94.9 % 95.0 % 95.6 % 95.4 %
Williams (Tom) ES 95.2 % - 95.4 % 95.3 % 93.0 % 94.4 % 94.7 % 95.6 % 95.2 %
Wolff (Elise) ES 96.3 % - 97.0 % 95.9 % 94.8 % 96.4 % 96.5 % 97.0 % 95.7 %
Wright ES 96.2 % - 97.1 % 95.9 % 96.0 % 95.9 % 94.4 % 97.2 % 95.3 %
Wynn ES 94.8 % - 94.3 % 95.2 % 92.7 % 93.9 % 94.6 % 95.3 % 94.8 %
Woodbury MS 93.7 % 90.4 % 95.4 % 94.5 % 90.3 % 92.9 % 91.4 % 94.5 % 93.1 %
Woolley ES 95.3 % - 96.0 % 95.8 % 94.3 % 94.4 % 94.1 % 95.9 % 95.3 %
Von Tobel MS 92.4 % - - 93.1 % 89.5 % 90.1 % 91.0 % 92.9 % 92.8 %
Virtual HS 99.9 % N/A - 100.0 % - 99.9 % - - -
Walker International ES 96.2 % - 96.1 % 95.5 % 96.3 % 96.4 % 96.3 % 95.4 % 95.4 %
Ward (Kitty) ES 96.0 % 94.7 % 97.2 % 95.7 % 95.0 % 96.1 % 95.1 % 97.3 % 94.9 %
Ward (Gene) ES 96.4 % - 96.0 % 96.6 % 95.7 % 96.4 % 95.4 % 96.7 % 96.5 %
Virgin Valley HS 94.6 % 91.5 % 96.4 % 94.8 % 96.0 % 94.3 % 92.7 % 94.6 % 94.2 %
Vanderburg ES 97.2 % - 98.5 % 96.3 % 96.2 % 97.2 % 96.0 % 97.2 % 95.4 %
Valley HS 91.8 % 87.1 % 94.5 % 91.9 % 89.6 % 92.4 % 89.5 % 91.2 % 91.7 %
Variety School 89.2 % - - 89.1 % 87.7 % 89.2 % 89.2 % - 89.3 %
Virgin Valley ES 96.1 % 95.1 % 97.3 % 96.3 % - 95.8 % 94.8 % 96.9 % 96.0 %
Vegas Verdes ES 96.3 % - 95.5 % 96.6 % 93.1 % 95.2 % 94.5 % 96.9 % 96.4 %
Warren ES 96.1 % - 95.0 % 96.5 % 93.4 % 95.6 % 95.2 % 96.6 % 96.1 %
Western HS 88.9 % 91.1 % 90.8 % 89.9 % 86.5 % 88.1 % 86.7 % 89.7 % 88.9 %
West Prep ES 95.0 % - - 95.2 % 94.5 % 96.9 % 94.9 % 95.9 % 95.0 %
White MS 95.0 % 96.2 % 96.6 % 94.9 % 93.9 % 95.0 % 93.5 % 95.5 % 94.4 %
Wiener ES 95.8 % - 96.6 % 95.4 % 95.6 % 96.0 % 93.3 % 96.0 % 95.1 %
Whitney ES 95.1 % - 95.8 % 95.6 % 93.8 % 94.7 % 94.4 % 96.1 % 95.0 %
West Prep at West Hall 92.3 % - 93.8 % 94.3 % 90.0 % 89.5 % 89.9 % 94.6 % 92.2 %
Washington Continuation JHS 70.5 % N/A - 71.1 % 67.9 % 75.5 % - 70.7 % 68.2 %
Wasden ES 95.3 % 93.9 % 95.4 % 95.8 % 94.2 % 95.0 % 94.9 % 96.3 % 95.2 %
Watson ES 95.5 % - 96.6 % 95.6 % 94.5 % 96.0 % 94.6 % 95.9 % 94.9 %
Wengert ES 95.0 % - 94.0 % 95.6 % 93.8 % 93.9 % 94.1 % 96.0 % 95.0 %
Webb MS 96.0 % - 97.7 % 95.8 % 94.9 % 95.8 % 94.9 % 96.6 % 94.6 %
Clark County Schools
‘-’ indicates data not presented for groups fewer than 10. ‘N/A’ indicates a population of zero. ‘*’ indicates data are not available.
Total Students
American Indian/Alaskan
Native
Asian/Pacific Islander Hispanic
Black/African American White IEP LEP FRL
Page 29 of 125
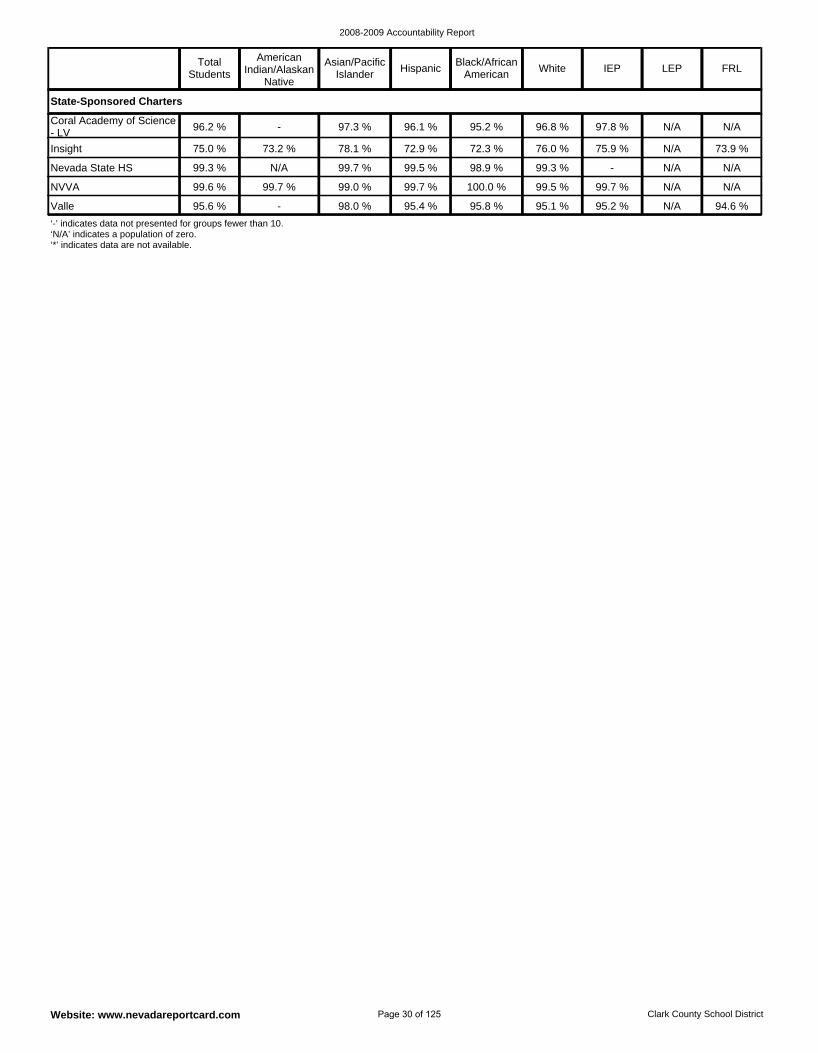
2008-2009 Accountability Report
Website: www.nevadareportcard.com Clark County School District
Valle 95.6 % - 98.0 % 95.4 % 95.8 % 95.1 % 95.2 % N/A 94.6 %
Nevada State HS 99.3 % N/A 99.7 % 99.5 % 98.9 % 99.3 % - N/A N/A
NVVA 99.6 % 99.7 % 99.0 % 99.7 % 100.0 % 99.5 % 99.7 % N/A N/A
Insight 75.0 % 73.2 % 78.1 % 72.9 % 72.3 % 76.0 % 75.9 % N/A 73.9 %
Coral Academy of Science - LV 96.2 % - 97.3 % 96.1 % 95.2 % 96.8 % 97.8 % N/A N/A
State-Sponsored Charters
‘-’ indicates data not presented for groups fewer than 10. ‘N/A’ indicates a population of zero. ‘*’ indicates data are not available.
Total Students
American Indian/Alaskan
Native
Asian/Pacific Islander Hispanic
Black/African American White IEP LEP FRL
Page 30 of 125
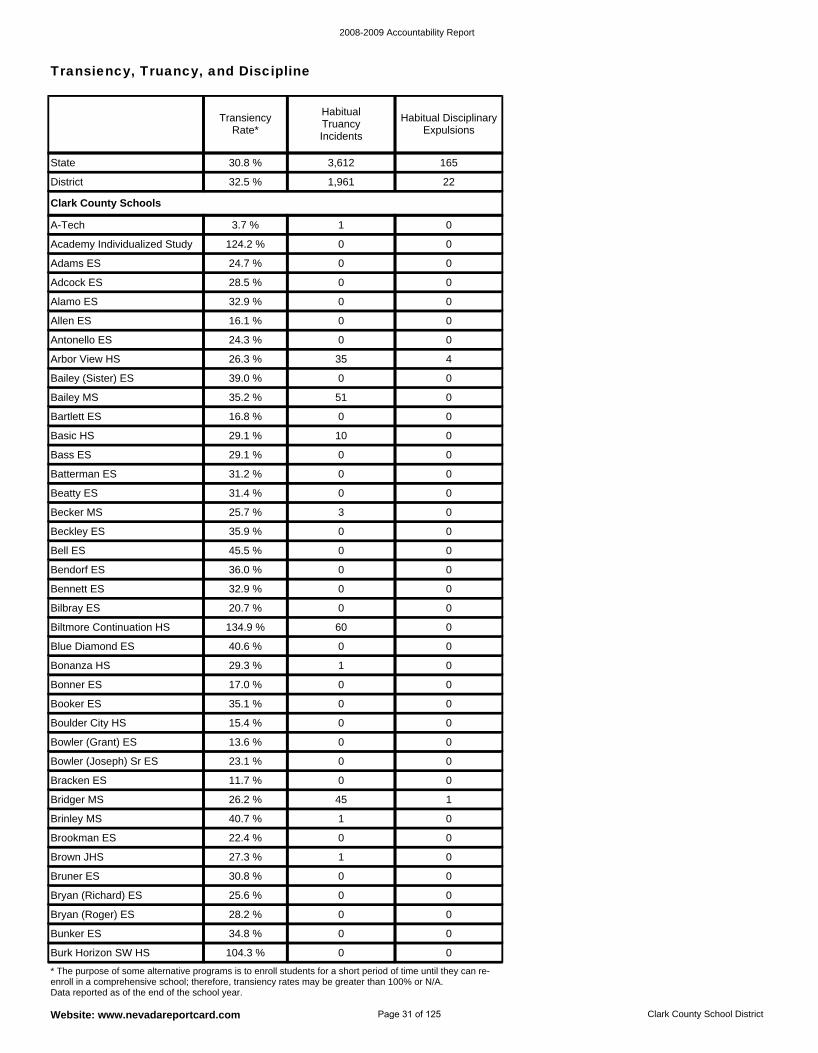
2008-2009 Accountability Report
Website: www.nevadareportcard.com Clark County School District
Transiency, Truancy, and Discipline
Bracken ES 11.7 % 0 0
Bowler (Joseph) Sr ES 23.1 % 0 0
Bowler (Grant) ES 13.6 % 0 0
Brookman ES 22.4 % 0 0
Brinley MS 40.7 % 1 0
Bridger MS 26.2 % 45 1
Bonanza HS 29.3 % 1 0
Blue Diamond ES 40.6 % 0 0
Boulder City HS 15.4 % 0 0
Booker ES 35.1 % 0 0
Bonner ES 17.0 % 0 0
Brown JHS 27.3 % 1 0
Bryan (Roger) ES 28.2 % 0 0
Bryan (Richard) ES 25.6 % 0 0
Bruner ES 30.8 % 0 0
Burk Horizon SW HS 104.3 % 0 0
Bunker ES 34.8 % 0 0
Antonello ES 24.3 % 0 0
Allen ES 16.1 % 0 0
Arbor View HS 26.3 % 35 4
Bailey MS 35.2 % 51 0
Bailey (Sister) ES 39.0 % 0 0
Alamo ES 32.9 % 0 0
A-Tech 3.7 % 1 0
Biltmore Continuation HS 134.9 % 60 0
Academy Individualized Study 124.2 % 0 0
Adcock ES 28.5 % 0 0
Adams ES 24.7 % 0 0
Bell ES 45.5 % 0 0
Beckley ES 35.9 % 0 0
Bendorf ES 36.0 % 0 0
Bilbray ES 20.7 % 0 0
Bennett ES 32.9 % 0 0
Becker MS 25.7 % 3 0
Basic HS 29.1 % 10 0
Bartlett ES 16.8 % 0 0
Bass ES 29.1 % 0 0
Beatty ES 31.4 % 0 0
Batterman ES 31.2 % 0 0
Clark County Schools
District 32.5 % 1,961 22
State 30.8 % 3,612 165
* The purpose of some alternative programs is to enroll students for a short period of time until they can re-enroll in a comprehensive school; therefore, transiency rates may be greater than 100% or N/A. Data reported as of the end of the school year.
Transiency Rate*
Habitual Truancy Incidents
Habitual Disciplinary Expulsions
Page 31 of 125
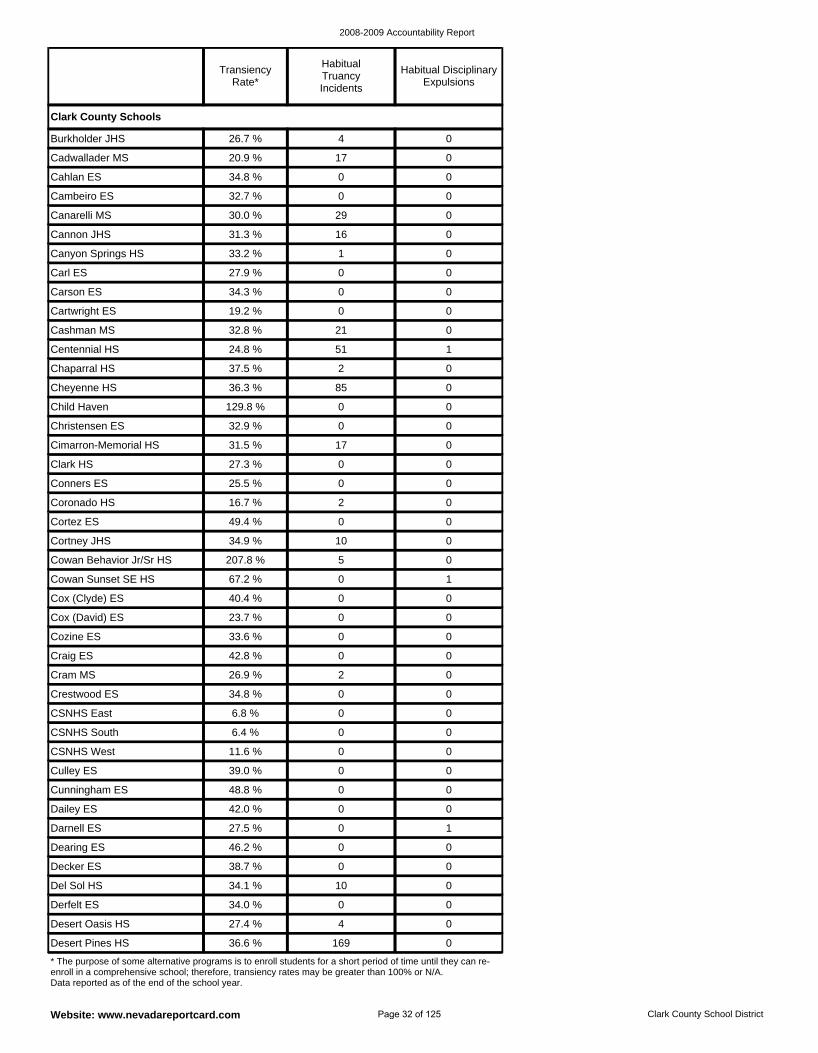
2008-2009 Accountability Report
Website: www.nevadareportcard.com Clark County School District
Cunningham ES 48.8 % 0 0
Culley ES 39.0 % 0 0
CSNHS West 11.6 % 0 0
Dearing ES 46.2 % 0 0
Darnell ES 27.5 % 0 1
Dailey ES 42.0 % 0 0
CSNHS South 6.4 % 0 0
Craig ES 42.8 % 0 0
Cozine ES 33.6 % 0 0
CSNHS East 6.8 % 0 0
Crestwood ES 34.8 % 0 0
Cram MS 26.9 % 2 0
Derfelt ES 34.0 % 0 0
Del Sol HS 34.1 % 10 0
Decker ES 38.7 % 0 0
Desert Pines HS 36.6 % 169 0
Desert Oasis HS 27.4 % 4 0
Cox (Clyde) ES 40.4 % 0 0
Carl ES 27.9 % 0 0
Canyon Springs HS 33.2 % 1 0
Cannon JHS 31.3 % 16 0
Cashman MS 32.8 % 21 0
Cartwright ES 19.2 % 0 0
Carson ES 34.3 % 0 0
Cadwallader MS 20.9 % 17 0
Burkholder JHS 26.7 % 4 0
Cox (David) ES 23.7 % 0 0
Canarelli MS 30.0 % 29 0
Cambeiro ES 32.7 % 0 0
Cahlan ES 34.8 % 0 0
Centennial HS 24.8 % 51 1
Cortez ES 49.4 % 0 0
Coronado HS 16.7 % 2 0
Conners ES 25.5 % 0 0
Cowan Sunset SE HS 67.2 % 0 1
Cowan Behavior Jr/Sr HS 207.8 % 5 0
Cortney JHS 34.9 % 10 0
Child Haven 129.8 % 0 0
Cheyenne HS 36.3 % 85 0
Chaparral HS 37.5 % 2 0
Clark HS 27.3 % 0 0
Cimarron-Memorial HS 31.5 % 17 0
Christensen ES 32.9 % 0 0
Clark County Schools
* The purpose of some alternative programs is to enroll students for a short period of time until they can re-enroll in a comprehensive school; therefore, transiency rates may be greater than 100% or N/A. Data reported as of the end of the school year.
Transiency Rate*
Habitual Truancy Incidents
Habitual Disciplinary Expulsions
Page 32 of 125
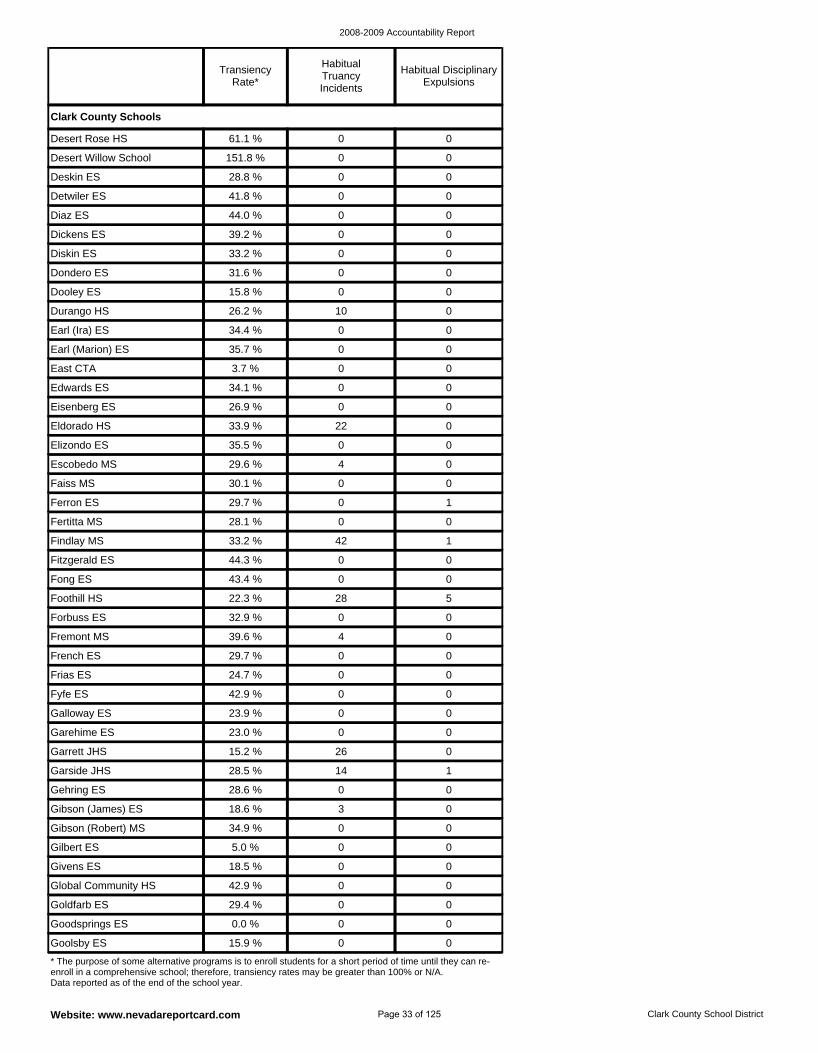
2008-2009 Accountability Report
Website: www.nevadareportcard.com Clark County School District
Gehring ES 28.6 % 0 0
Garside JHS 28.5 % 14 1
Garrett JHS 15.2 % 26 0
Gilbert ES 5.0 % 0 0
Gibson (Robert) MS 34.9 % 0 0
Gibson (James) ES 18.6 % 3 0
Garehime ES 23.0 % 0 0
French ES 29.7 % 0 0
Fremont MS 39.6 % 4 0
Galloway ES 23.9 % 0 0
Fyfe ES 42.9 % 0 0
Frias ES 24.7 % 0 0
Goldfarb ES 29.4 % 0 0
Global Community HS 42.9 % 0 0
Givens ES 18.5 % 0 0
Goolsby ES 15.9 % 0 0
Goodsprings ES 0.0 % 0 0
Foothill HS 22.3 % 28 5
Dondero ES 31.6 % 0 0
Diskin ES 33.2 % 0 0
Dickens ES 39.2 % 0 0
Earl (Ira) ES 34.4 % 0 0
Durango HS 26.2 % 10 0
Dooley ES 15.8 % 0 0
Desert Willow School 151.8 % 0 0
Desert Rose HS 61.1 % 0 0
Forbuss ES 32.9 % 0 0
Diaz ES 44.0 % 0 0
Detwiler ES 41.8 % 0 0
Deskin ES 28.8 % 0 0
Earl (Marion) ES 35.7 % 0 0
Fertitta MS 28.1 % 0 0
Ferron ES 29.7 % 0 1
Faiss MS 30.1 % 0 0
Fong ES 43.4 % 0 0
Fitzgerald ES 44.3 % 0 0
Findlay MS 33.2 % 42 1
Eisenberg ES 26.9 % 0 0
Edwards ES 34.1 % 0 0
East CTA 3.7 % 0 0
Escobedo MS 29.6 % 4 0
Elizondo ES 35.5 % 0 0
Eldorado HS 33.9 % 22 0
Clark County Schools
* The purpose of some alternative programs is to enroll students for a short period of time until they can re-enroll in a comprehensive school; therefore, transiency rates may be greater than 100% or N/A. Data reported as of the end of the school year.
Transiency Rate*
Habitual Truancy Incidents
Habitual Disciplinary Expulsions
Page 33 of 125
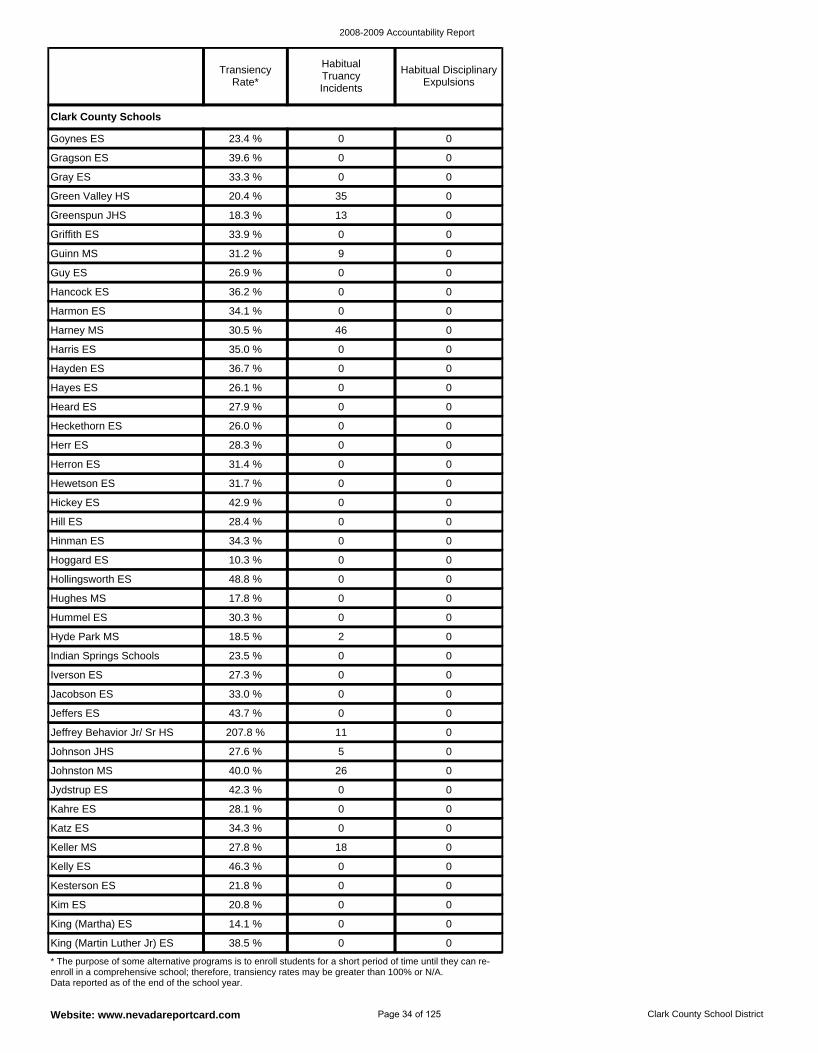
2008-2009 Accountability Report
Website: www.nevadareportcard.com Clark County School District
Jydstrup ES 42.3 % 0 0
Johnston MS 40.0 % 26 0
Johnson JHS 27.6 % 5 0
Keller MS 27.8 % 18 0
Katz ES 34.3 % 0 0
Kahre ES 28.1 % 0 0
Jeffrey Behavior Jr/ Sr HS 207.8 % 11 0
Indian Springs Schools 23.5 % 0 0
Hyde Park MS 18.5 % 2 0
Jeffers ES 43.7 % 0 0
Jacobson ES 33.0 % 0 0
Iverson ES 27.3 % 0 0
Kim ES 20.8 % 0 0
Kesterson ES 21.8 % 0 0
Kelly ES 46.3 % 0 0
King (Martin Luther Jr) ES 38.5 % 0 0
King (Martha) ES 14.1 % 0 0
Hughes MS 17.8 % 0 0
Guy ES 26.9 % 0 0
Guinn MS 31.2 % 9 0
Griffith ES 33.9 % 0 0
Harney MS 30.5 % 46 0
Harmon ES 34.1 % 0 0
Hancock ES 36.2 % 0 0
Gragson ES 39.6 % 0 0
Goynes ES 23.4 % 0 0
Hummel ES 30.3 % 0 0
Greenspun JHS 18.3 % 13 0
Green Valley HS 20.4 % 35 0
Gray ES 33.3 % 0 0
Harris ES 35.0 % 0 0
Hill ES 28.4 % 0 0
Hickey ES 42.9 % 0 0
Hewetson ES 31.7 % 0 0
Hollingsworth ES 48.8 % 0 0
Hoggard ES 10.3 % 0 0
Hinman ES 34.3 % 0 0
Heard ES 27.9 % 0 0
Hayes ES 26.1 % 0 0
Hayden ES 36.7 % 0 0
Herron ES 31.4 % 0 0
Herr ES 28.3 % 0 0
Heckethorn ES 26.0 % 0 0
Clark County Schools
* The purpose of some alternative programs is to enroll students for a short period of time until they can re-enroll in a comprehensive school; therefore, transiency rates may be greater than 100% or N/A. Data reported as of the end of the school year.
Transiency Rate*
Habitual Truancy Incidents
Habitual Disciplinary Expulsions
Page 34 of 125
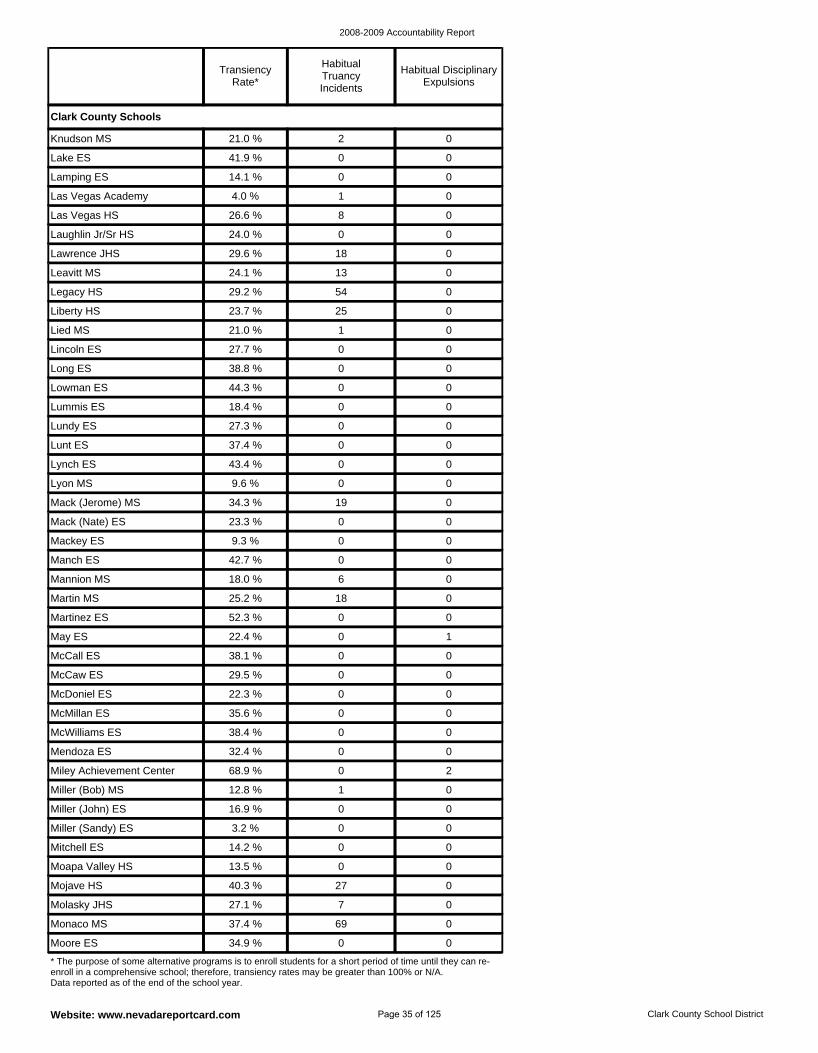
2008-2009 Accountability Report
Website: www.nevadareportcard.com Clark County School District
Miller (Bob) MS 12.8 % 1 0
Miley Achievement Center 68.9 % 0 2
Mendoza ES 32.4 % 0 0
Mitchell ES 14.2 % 0 0
Miller (Sandy) ES 3.2 % 0 0
Miller (John) ES 16.9 % 0 0
McWilliams ES 38.4 % 0 0
McCall ES 38.1 % 0 0
May ES 22.4 % 0 1
McMillan ES 35.6 % 0 0
McDoniel ES 22.3 % 0 0
McCaw ES 29.5 % 0 0
Molasky JHS 27.1 % 7 0
Mojave HS 40.3 % 27 0
Moapa Valley HS 13.5 % 0 0
Moore ES 34.9 % 0 0
Monaco MS 37.4 % 69 0
Martin MS 25.2 % 18 0
Leavitt MS 24.1 % 13 0
Lawrence JHS 29.6 % 18 0
Laughlin Jr/Sr HS 24.0 % 0 0
Lied MS 21.0 % 1 0
Liberty HS 23.7 % 25 0
Legacy HS 29.2 % 54 0
Lake ES 41.9 % 0 0
Knudson MS 21.0 % 2 0
Martinez ES 52.3 % 0 0
Las Vegas HS 26.6 % 8 0
Las Vegas Academy 4.0 % 1 0
Lamping ES 14.1 % 0 0
Lincoln ES 27.7 % 0 0
Mack (Nate) ES 23.3 % 0 0
Mack (Jerome) MS 34.3 % 19 0
Lyon MS 9.6 % 0 0
Mannion MS 18.0 % 6 0
Manch ES 42.7 % 0 0
Mackey ES 9.3 % 0 0
Lummis ES 18.4 % 0 0
Lowman ES 44.3 % 0 0
Long ES 38.8 % 0 0
Lynch ES 43.4 % 0 0
Lunt ES 37.4 % 0 0
Lundy ES 27.3 % 0 0
Clark County Schools
* The purpose of some alternative programs is to enroll students for a short period of time until they can re-enroll in a comprehensive school; therefore, transiency rates may be greater than 100% or N/A. Data reported as of the end of the school year.
Transiency Rate*
Habitual Truancy Incidents
Habitual Disciplinary Expulsions
Page 35 of 125
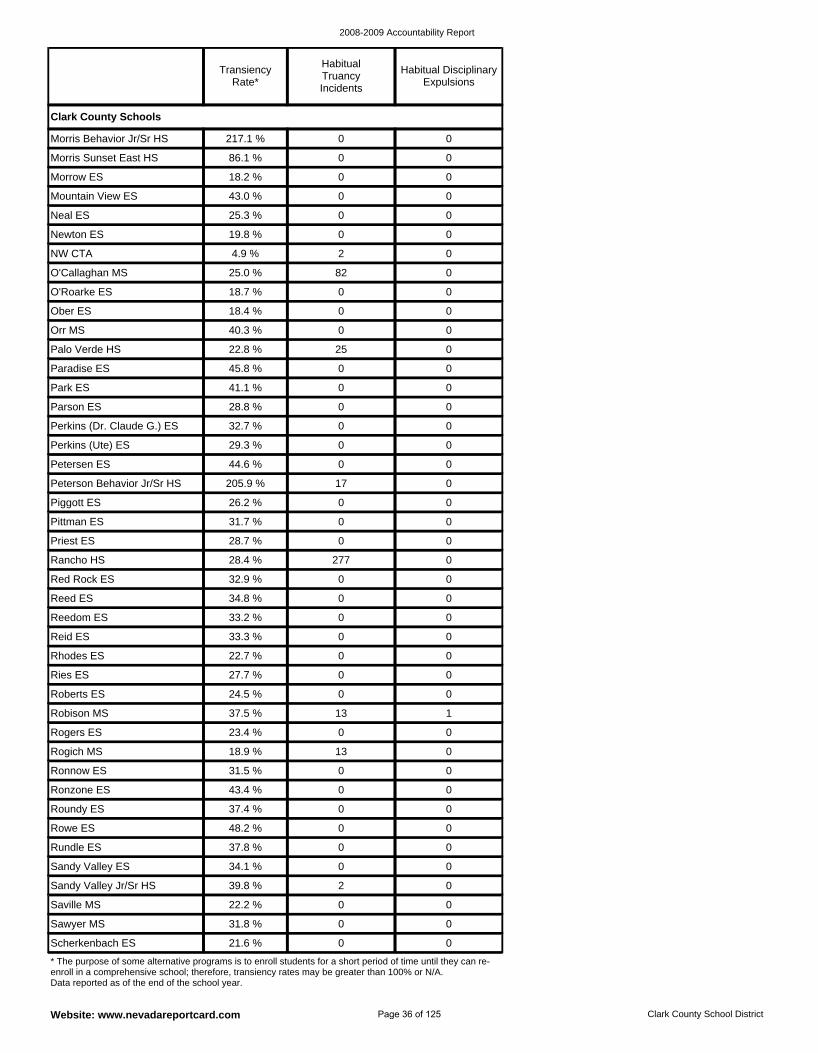
2008-2009 Accountability Report
Website: www.nevadareportcard.com Clark County School District
Ronzone ES 43.4 % 0 0
Ronnow ES 31.5 % 0 0
Rogich MS 18.9 % 13 0
Rundle ES 37.8 % 0 0
Rowe ES 48.2 % 0 0
Roundy ES 37.4 % 0 0
Rogers ES 23.4 % 0 0
Rhodes ES 22.7 % 0 0
Reid ES 33.3 % 0 0
Robison MS 37.5 % 13 1
Roberts ES 24.5 % 0 0
Ries ES 27.7 % 0 0
Saville MS 22.2 % 0 0
Sandy Valley Jr/Sr HS 39.8 % 2 0
Sandy Valley ES 34.1 % 0 0
Scherkenbach ES 21.6 % 0 0
Sawyer MS 31.8 % 0 0
Reed ES 34.8 % 0 0
O'Callaghan MS 25.0 % 82 0
NW CTA 4.9 % 2 0
Newton ES 19.8 % 0 0
Orr MS 40.3 % 0 0
Ober ES 18.4 % 0 0
O'Roarke ES 18.7 % 0 0
Morris Sunset East HS 86.1 % 0 0
Morris Behavior Jr/Sr HS 217.1 % 0 0
Reedom ES 33.2 % 0 0
Neal ES 25.3 % 0 0
Mountain View ES 43.0 % 0 0
Morrow ES 18.2 % 0 0
Palo Verde HS 22.8 % 25 0
Pittman ES 31.7 % 0 0
Piggott ES 26.2 % 0 0
Peterson Behavior Jr/Sr HS 205.9 % 17 0
Red Rock ES 32.9 % 0 0
Rancho HS 28.4 % 277 0
Priest ES 28.7 % 0 0
Parson ES 28.8 % 0 0
Park ES 41.1 % 0 0
Paradise ES 45.8 % 0 0
Petersen ES 44.6 % 0 0
Perkins (Ute) ES 29.3 % 0 0
Perkins (Dr. Claude G.) ES 32.7 % 0 0
Clark County Schools
* The purpose of some alternative programs is to enroll students for a short period of time until they can re-enroll in a comprehensive school; therefore, transiency rates may be greater than 100% or N/A. Data reported as of the end of the school year.
Transiency Rate*
Habitual Truancy Incidents
Habitual Disciplinary Expulsions
Page 36 of 125
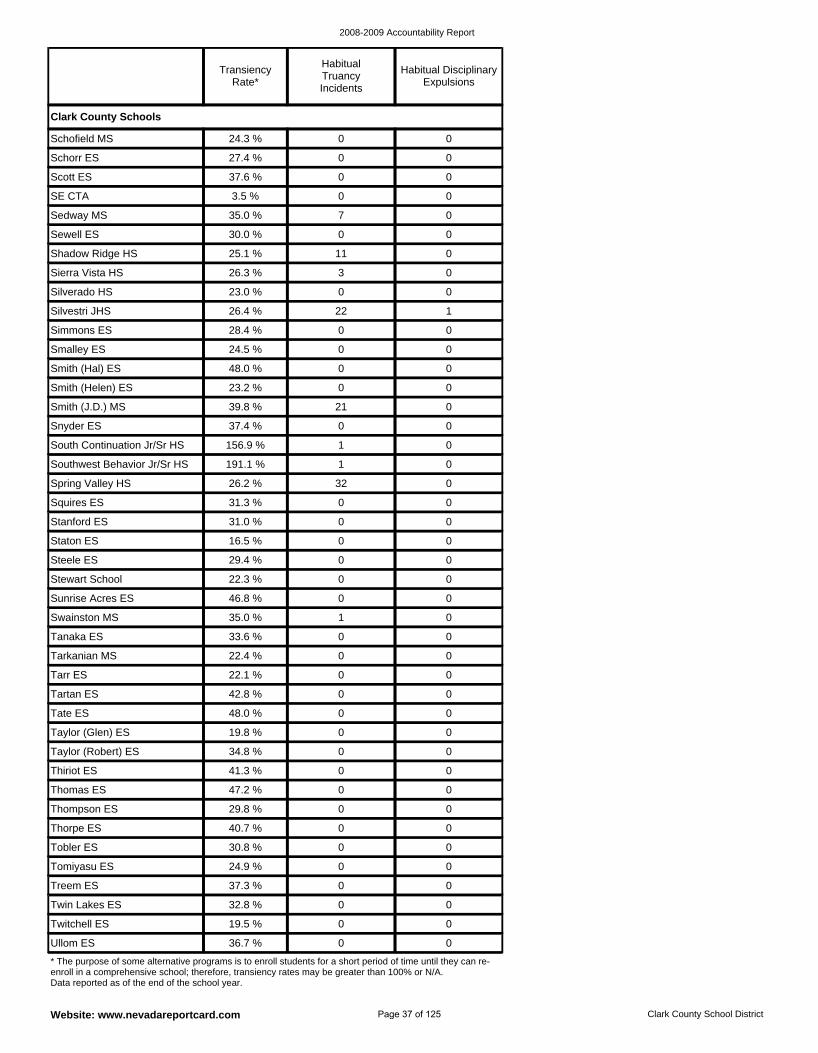
2008-2009 Accountability Report
Website: www.nevadareportcard.com Clark County School District
Thomas ES 47.2 % 0 0
Thiriot ES 41.3 % 0 0
Taylor (Robert) ES 34.8 % 0 0
Tobler ES 30.8 % 0 0
Thorpe ES 40.7 % 0 0
Thompson ES 29.8 % 0 0
Taylor (Glen) ES 19.8 % 0 0
Tarkanian MS 22.4 % 0 0
Tanaka ES 33.6 % 0 0
Tate ES 48.0 % 0 0
Tartan ES 42.8 % 0 0
Tarr ES 22.1 % 0 0
Twin Lakes ES 32.8 % 0 0
Treem ES 37.3 % 0 0
Tomiyasu ES 24.9 % 0 0
Ullom ES 36.7 % 0 0
Twitchell ES 19.5 % 0 0
Sunrise Acres ES 46.8 % 0 0
Sierra Vista HS 26.3 % 3 0
Shadow Ridge HS 25.1 % 11 0
Sewell ES 30.0 % 0 0
Simmons ES 28.4 % 0 0
Silvestri JHS 26.4 % 22 1
Silverado HS 23.0 % 0 0
Schorr ES 27.4 % 0 0
Schofield MS 24.3 % 0 0
Swainston MS 35.0 % 1 0
Sedway MS 35.0 % 7 0
SE CTA 3.5 % 0 0
Scott ES 37.6 % 0 0
Smalley ES 24.5 % 0 0
Stanford ES 31.0 % 0 0
Squires ES 31.3 % 0 0
Spring Valley HS 26.2 % 32 0
Stewart School 22.3 % 0 0
Steele ES 29.4 % 0 0
Staton ES 16.5 % 0 0
Smith (J.D.) MS 39.8 % 21 0
Smith (Helen) ES 23.2 % 0 0
Smith (Hal) ES 48.0 % 0 0
Southwest Behavior Jr/Sr HS 191.1 % 1 0
South Continuation Jr/Sr HS 156.9 % 1 0
Snyder ES 37.4 % 0 0
Clark County Schools
* The purpose of some alternative programs is to enroll students for a short period of time until they can re-enroll in a comprehensive school; therefore, transiency rates may be greater than 100% or N/A. Data reported as of the end of the school year.
Transiency Rate*
Habitual Truancy Incidents
Habitual Disciplinary Expulsions
Page 37 of 125
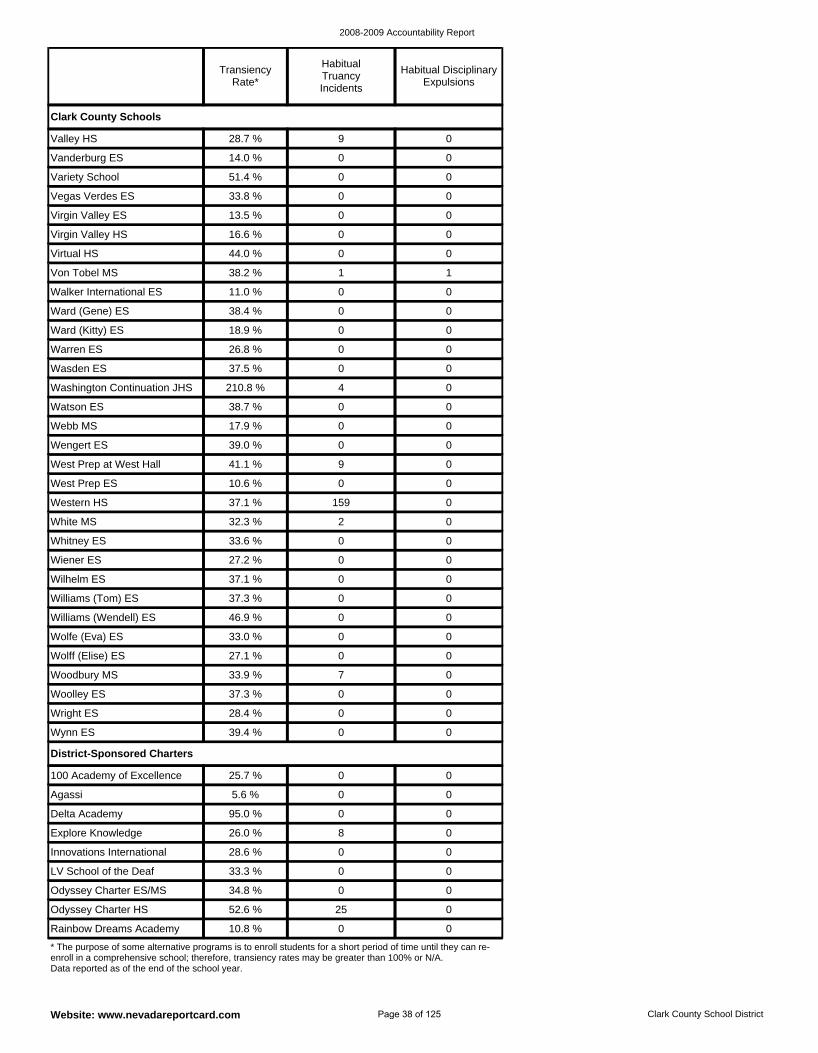
2008-2009 Accountability Report
Website: www.nevadareportcard.com Clark County School District
Delta Academy 95.0 % 0 0
Explore Knowledge 26.0 % 8 0
100 Academy of Excellence 25.7 % 0 0
Agassi 5.6 % 0 0
Innovations International 28.6 % 0 0
Odyssey Charter HS 52.6 % 25 0
Rainbow Dreams Academy 10.8 % 0 0
LV School of the Deaf 33.3 % 0 0
Odyssey Charter ES/MS 34.8 % 0 0
District-Sponsored Charters
Williams (Tom) ES 37.3 % 0 0
Williams (Wendell) ES 46.9 % 0 0
Wilhelm ES 37.1 % 0 0
Whitney ES 33.6 % 0 0
Wiener ES 27.2 % 0 0
Wolfe (Eva) ES 33.0 % 0 0
Wright ES 28.4 % 0 0
Wynn ES 39.4 % 0 0
Woolley ES 37.3 % 0 0
Wolff (Elise) ES 27.1 % 0 0
Woodbury MS 33.9 % 7 0
Virtual HS 44.0 % 0 0
Virgin Valley HS 16.6 % 0 0
Von Tobel MS 38.2 % 1 1
Ward (Gene) ES 38.4 % 0 0
Walker International ES 11.0 % 0 0
Vanderburg ES 14.0 % 0 0
Valley HS 28.7 % 9 0
Variety School 51.4 % 0 0
Virgin Valley ES 13.5 % 0 0
Vegas Verdes ES 33.8 % 0 0
Ward (Kitty) ES 18.9 % 0 0
West Prep at West Hall 41.1 % 9 0
Wengert ES 39.0 % 0 0
West Prep ES 10.6 % 0 0
White MS 32.3 % 2 0
Western HS 37.1 % 159 0
Wasden ES 37.5 % 0 0
Warren ES 26.8 % 0 0
Washington Continuation JHS 210.8 % 4 0
Webb MS 17.9 % 0 0
Watson ES 38.7 % 0 0
Clark County Schools
* The purpose of some alternative programs is to enroll students for a short period of time until they can re-enroll in a comprehensive school; therefore, transiency rates may be greater than 100% or N/A. Data reported as of the end of the school year.
Transiency Rate*
Habitual Truancy Incidents
Habitual Disciplinary Expulsions
Page 38 of 125
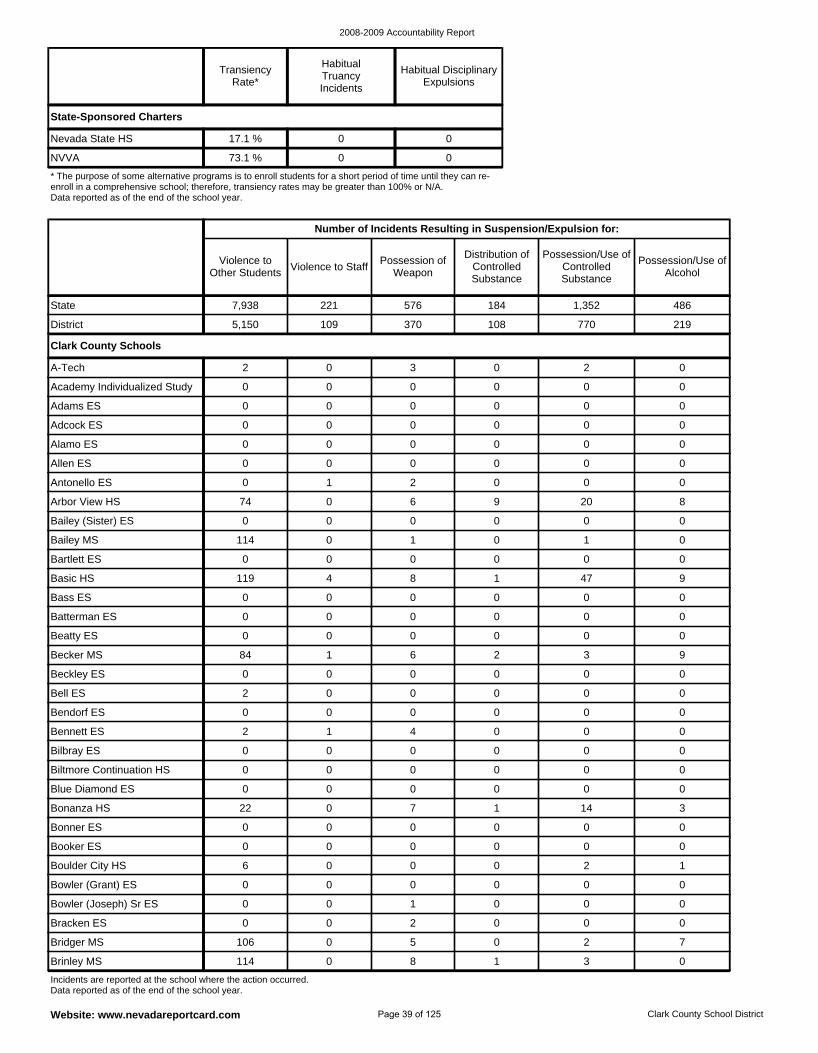
2008-2009 Accountability Report
Website: www.nevadareportcard.com Clark County School District
NVVA 73.1 % 0 0
Nevada State HS 17.1 % 0 0
State-Sponsored Charters
* The purpose of some alternative programs is to enroll students for a short period of time until they can re-enroll in a comprehensive school; therefore, transiency rates may be greater than 100% or N/A. Data reported as of the end of the school year.
Transiency Rate*
Habitual Truancy Incidents
Habitual Disciplinary Expulsions
Bowler (Joseph) Sr ES 0 0 1 0 0 0
Bowler (Grant) ES 0 0 0 0 0 0
Boulder City HS 6 0 0 0 2 1
Brinley MS 114 0 8 1 3 0
Bridger MS 106 0 5 0 2 7
Bracken ES 0 0 2 0 0 0
Blue Diamond ES 0 0 0 0 0 0
Biltmore Continuation HS 0 0 0 0 0 0
Booker ES 0 0 0 0 0 0
Bonner ES 0 0 0 0 0 0
Bonanza HS 22 0 7 1 14 3
Bennett ES 2 1 4 0 0 0
Alamo ES 0 0 0 0 0 0
Adcock ES 0 0 0 0 0 0
Allen ES 0 0 0 0 0 0
Arbor View HS 74 0 6 9 20 8
Antonello ES 0 1 2 0 0 0
Bilbray ES 0 0 0 0 0 0
A-Tech 2 0 3 0 2 0
Adams ES 0 0 0 0 0 0
Academy Individualized Study 0 0 0 0 0 0
Bailey (Sister) ES 0 0 0 0 0 0
Becker MS 84 1 6 2 3 9
Beatty ES 0 0 0 0 0 0
Beckley ES 0 0 0 0 0 0
Bendorf ES 0 0 0 0 0 0
Bell ES 2 0 0 0 0 0
Bailey MS 114 0 1 0 1 0
Bartlett ES 0 0 0 0 0 0
Basic HS 119 4 8 1 47 9
Batterman ES 0 0 0 0 0 0
Bass ES 0 0 0 0 0 0
Clark County Schools
District 5,150 109 370 108 770 219
State 7,938 221 576 184 1,352 486
Incidents are reported at the school where the action occurred. Data reported as of the end of the school year.
Number of Incidents Resulting in Suspension/Expulsion for:
Violence to Other Students Violence to Staff
Possession of Weapon
Distribution of Controlled Substance
Possession/Use of Controlled Substance
Possession/Use of Alcohol
Page 39 of 125
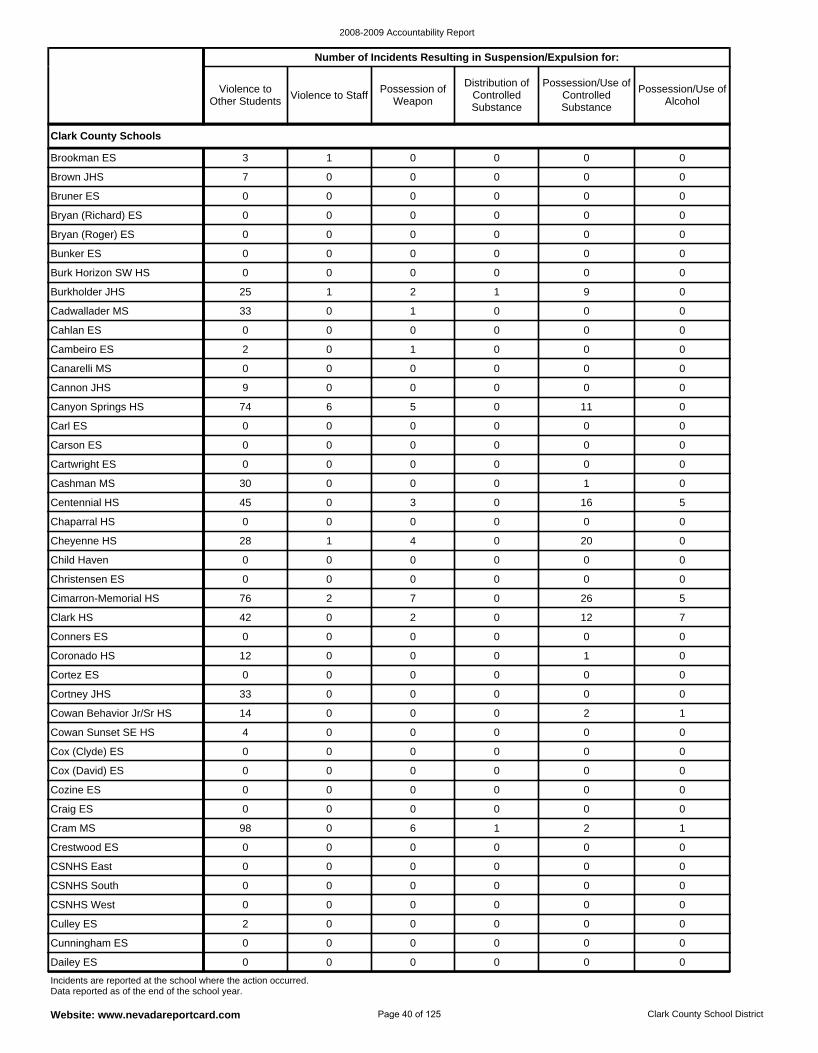
2008-2009 Accountability Report
Website: www.nevadareportcard.com Clark County School District
Cozine ES 0 0 0 0 0 0
Cox (David) ES 0 0 0 0 0 0
Cox (Clyde) ES 0 0 0 0 0 0
Crestwood ES 0 0 0 0 0 0
Cram MS 98 0 6 1 2 1
Craig ES 0 0 0 0 0 0
Cowan Sunset SE HS 4 0 0 0 0 0
Coronado HS 12 0 0 0 1 0
Conners ES 0 0 0 0 0 0
Cowan Behavior Jr/Sr HS 14 0 0 0 2 1
Cortney JHS 33 0 0 0 0 0
Cortez ES 0 0 0 0 0 0
CSNHS West 0 0 0 0 0 0
CSNHS South 0 0 0 0 0 0
CSNHS East 0 0 0 0 0 0
Dailey ES 0 0 0 0 0 0
Cunningham ES 0 0 0 0 0 0
Culley ES 2 0 0 0 0 0
Cimarron-Memorial HS 76 2 7 0 26 5
Burk Horizon SW HS 0 0 0 0 0 0
Bunker ES 0 0 0 0 0 0
Bryan (Roger) ES 0 0 0 0 0 0
Cahlan ES 0 0 0 0 0 0
Cadwallader MS 33 0 1 0 0 0
Burkholder JHS 25 1 2 1 9 0
Brookman ES 3 1 0 0 0 0
Clark HS 42 0 2 0 12 7
Bryan (Richard) ES 0 0 0 0 0 0
Bruner ES 0 0 0 0 0 0
Brown JHS 7 0 0 0 0 0
Cambeiro ES 2 0 1 0 0 0
Chaparral HS 0 0 0 0 0 0
Centennial HS 45 0 3 0 16 5
Cashman MS 30 0 0 0 1 0
Christensen ES 0 0 0 0 0 0
Child Haven 0 0 0 0 0 0
Cheyenne HS 28 1 4 0 20 0
Canyon Springs HS 74 6 5 0 11 0
Cannon JHS 9 0 0 0 0 0
Canarelli MS 0 0 0 0 0 0
Carson ES 0 0 0 0 0 0
Cartwright ES 0 0 0 0 0 0
Carl ES 0 0 0 0 0 0
Clark County Schools
Incidents are reported at the school where the action occurred. Data reported as of the end of the school year.
Number of Incidents Resulting in Suspension/Expulsion for:
Violence to Other Students Violence to Staff
Possession of Weapon
Distribution of Controlled Substance
Possession/Use of Controlled Substance
Possession/Use of Alcohol
Page 40 of 125
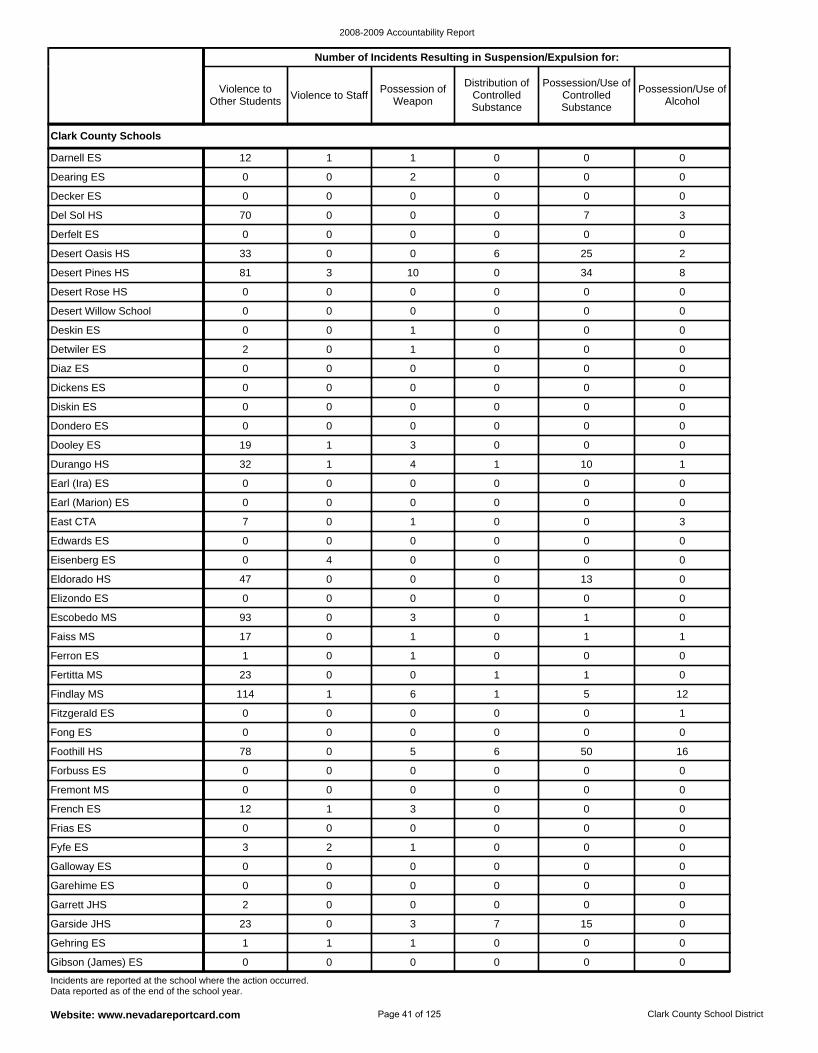
2008-2009 Accountability Report
Website: www.nevadareportcard.com Clark County School District
Fremont MS 0 0 0 0 0 0
Forbuss ES 0 0 0 0 0 0
Foothill HS 78 0 5 6 50 16
Fyfe ES 3 2 1 0 0 0
Frias ES 0 0 0 0 0 0
French ES 12 1 3 0 0 0
Fong ES 0 0 0 0 0 0
Ferron ES 1 0 1 0 0 0
Faiss MS 17 0 1 0 1 1
Fitzgerald ES 0 0 0 0 0 1
Findlay MS 114 1 6 1 5 12
Fertitta MS 23 0 0 1 1 0
Garrett JHS 2 0 0 0 0 0
Garehime ES 0 0 0 0 0 0
Galloway ES 0 0 0 0 0 0
Gibson (James) ES 0 0 0 0 0 0
Gehring ES 1 1 1 0 0 0
Garside JHS 23 0 3 7 15 0
Elizondo ES 0 0 0 0 0 0
Desert Pines HS 81 3 10 0 34 8
Desert Oasis HS 33 0 0 6 25 2
Derfelt ES 0 0 0 0 0 0
Deskin ES 0 0 1 0 0 0
Desert Willow School 0 0 0 0 0 0
Desert Rose HS 0 0 0 0 0 0
Darnell ES 12 1 1 0 0 0
Escobedo MS 93 0 3 0 1 0
Del Sol HS 70 0 0 0 7 3
Decker ES 0 0 0 0 0 0
Dearing ES 0 0 2 0 0 0
Detwiler ES 2 0 1 0 0 0
East CTA 7 0 1 0 0 3
Earl (Marion) ES 0 0 0 0 0 0
Earl (Ira) ES 0 0 0 0 0 0
Eldorado HS 47 0 0 0 13 0
Eisenberg ES 0 4 0 0 0 0
Edwards ES 0 0 0 0 0 0
Diskin ES 0 0 0 0 0 0
Dickens ES 0 0 0 0 0 0
Diaz ES 0 0 0 0 0 0
Dooley ES 19 1 3 0 0 0
Durango HS 32 1 4 1 10 1
Dondero ES 0 0 0 0 0 0
Clark County Schools
Incidents are reported at the school where the action occurred. Data reported as of the end of the school year.
Number of Incidents Resulting in Suspension/Expulsion for:
Violence to Other Students Violence to Staff
Possession of Weapon
Distribution of Controlled Substance
Possession/Use of Controlled Substance
Possession/Use of Alcohol
Page 41 of 125
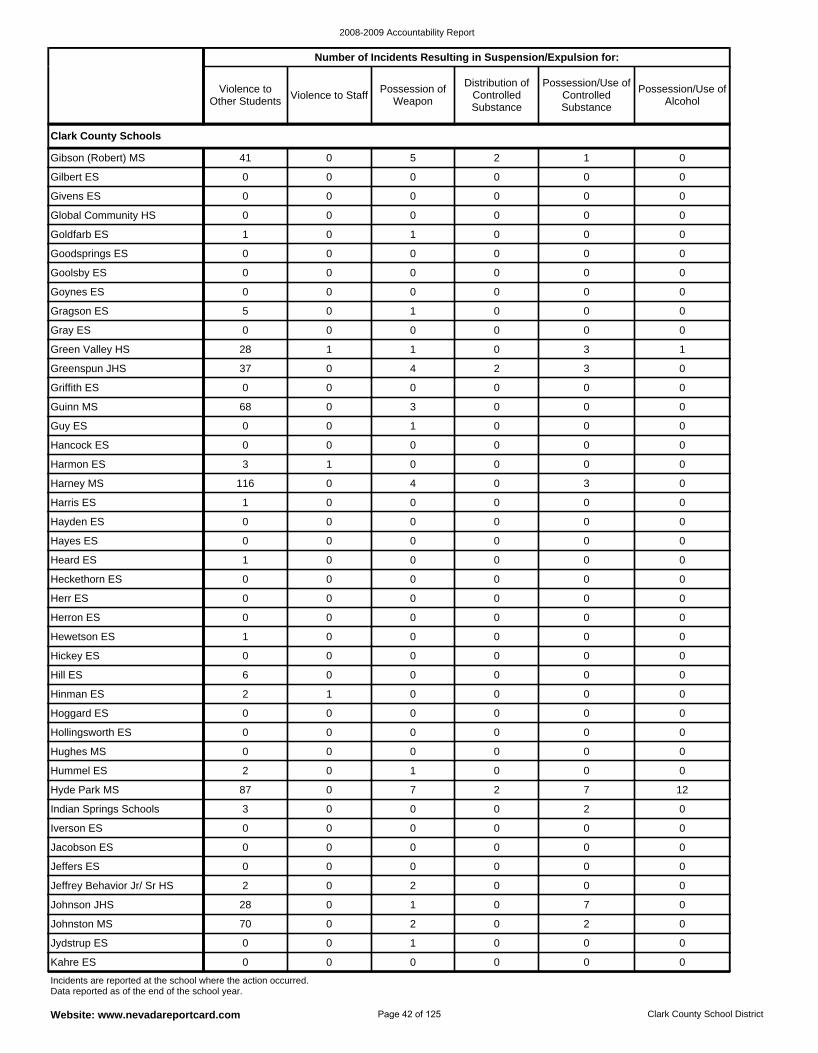
2008-2009 Accountability Report
Website: www.nevadareportcard.com Clark County School District
Hyde Park MS 87 0 7 2 7 12
Hummel ES 2 0 1 0 0 0
Hughes MS 0 0 0 0 0 0
Jacobson ES 0 0 0 0 0 0
Iverson ES 0 0 0 0 0 0
Indian Springs Schools 3 0 0 0 2 0
Hollingsworth ES 0 0 0 0 0 0
Hickey ES 0 0 0 0 0 0
Hewetson ES 1 0 0 0 0 0
Hoggard ES 0 0 0 0 0 0
Hinman ES 2 1 0 0 0 0
Hill ES 6 0 0 0 0 0
Johnson JHS 28 0 1 0 7 0
Jeffrey Behavior Jr/ Sr HS 2 0 2 0 0 0
Jeffers ES 0 0 0 0 0 0
Kahre ES 0 0 0 0 0 0
Jydstrup ES 0 0 1 0 0 0
Johnston MS 70 0 2 0 2 0
Herr ES 0 0 0 0 0 0
Goolsby ES 0 0 0 0 0 0
Goodsprings ES 0 0 0 0 0 0
Goldfarb ES 1 0 1 0 0 0
Gray ES 0 0 0 0 0 0
Gragson ES 5 0 1 0 0 0
Goynes ES 0 0 0 0 0 0
Gibson (Robert) MS 41 0 5 2 1 0
Herron ES 0 0 0 0 0 0
Global Community HS 0 0 0 0 0 0
Givens ES 0 0 0 0 0 0
Gilbert ES 0 0 0 0 0 0
Green Valley HS 28 1 1 0 3 1
Hayden ES 0 0 0 0 0 0
Harris ES 1 0 0 0 0 0
Harney MS 116 0 4 0 3 0
Heckethorn ES 0 0 0 0 0 0
Heard ES 1 0 0 0 0 0
Hayes ES 0 0 0 0 0 0
Guinn MS 68 0 3 0 0 0
Griffith ES 0 0 0 0 0 0
Greenspun JHS 37 0 4 2 3 0
Hancock ES 0 0 0 0 0 0
Harmon ES 3 1 0 0 0 0
Guy ES 0 0 1 0 0 0
Clark County Schools
Incidents are reported at the school where the action occurred. Data reported as of the end of the school year.
Number of Incidents Resulting in Suspension/Expulsion for:
Violence to Other Students Violence to Staff
Possession of Weapon
Distribution of Controlled Substance
Possession/Use of Controlled Substance
Possession/Use of Alcohol
Page 42 of 125
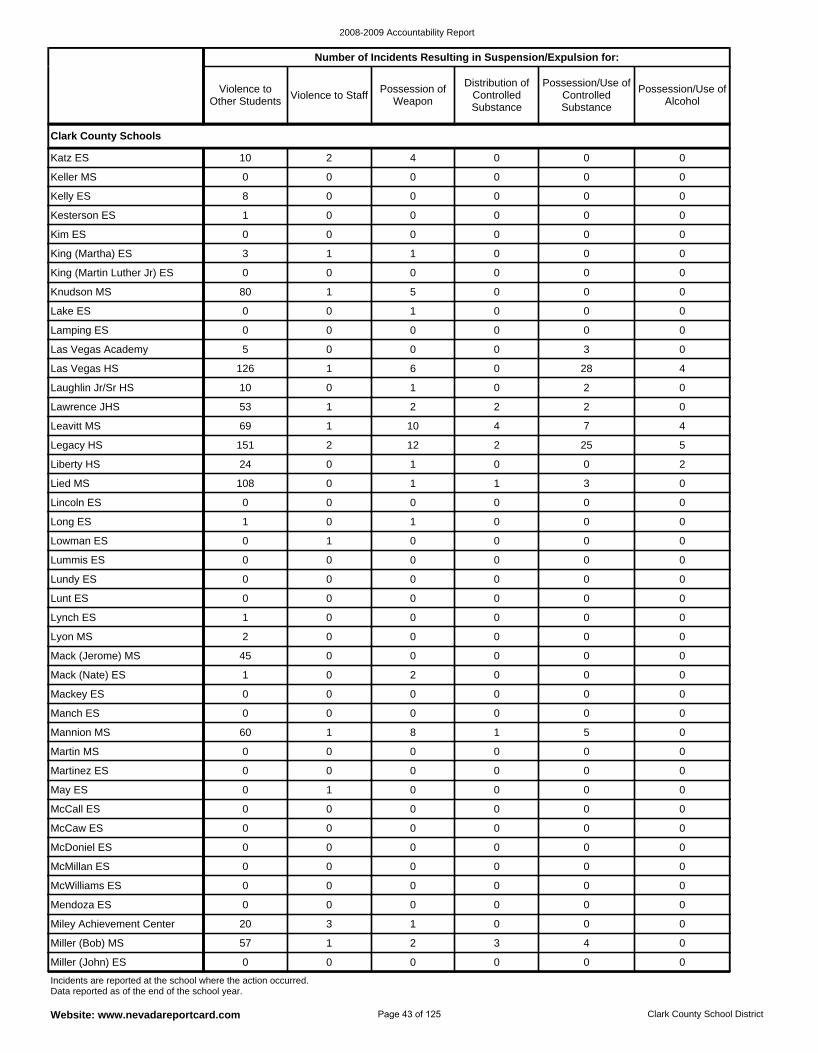
2008-2009 Accountability Report
Website: www.nevadareportcard.com Clark County School District
May ES 0 1 0 0 0 0
Martinez ES 0 0 0 0 0 0
Martin MS 0 0 0 0 0 0
McDoniel ES 0 0 0 0 0 0
McCaw ES 0 0 0 0 0 0
McCall ES 0 0 0 0 0 0
Mannion MS 60 1 8 1 5 0
Mack (Jerome) MS 45 0 0 0 0 0
Lyon MS 2 0 0 0 0 0
Manch ES 0 0 0 0 0 0
Mackey ES 0 0 0 0 0 0
Mack (Nate) ES 1 0 2 0 0 0
Mendoza ES 0 0 0 0 0 0
McWilliams ES 0 0 0 0 0 0
McMillan ES 0 0 0 0 0 0
Miller (John) ES 0 0 0 0 0 0
Miller (Bob) MS 57 1 2 3 4 0
Miley Achievement Center 20 3 1 0 0 0
Lunt ES 0 0 0 0 0 0
King (Martin Luther Jr) ES 0 0 0 0 0 0
King (Martha) ES 3 1 1 0 0 0
Kim ES 0 0 0 0 0 0
Lamping ES 0 0 0 0 0 0
Lake ES 0 0 1 0 0 0
Knudson MS 80 1 5 0 0 0
Katz ES 10 2 4 0 0 0
Lynch ES 1 0 0 0 0 0
Kesterson ES 1 0 0 0 0 0
Kelly ES 8 0 0 0 0 0
Keller MS 0 0 0 0 0 0
Las Vegas Academy 5 0 0 0 3 0
Long ES 1 0 1 0 0 0
Lincoln ES 0 0 0 0 0 0
Lied MS 108 0 1 1 3 0
Lundy ES 0 0 0 0 0 0
Lummis ES 0 0 0 0 0 0
Lowman ES 0 1 0 0 0 0
Lawrence JHS 53 1 2 2 2 0
Laughlin Jr/Sr HS 10 0 1 0 2 0
Las Vegas HS 126 1 6 0 28 4
Legacy HS 151 2 12 2 25 5
Liberty HS 24 0 1 0 0 2
Leavitt MS 69 1 10 4 7 4
Clark County Schools
Incidents are reported at the school where the action occurred. Data reported as of the end of the school year.
Number of Incidents Resulting in Suspension/Expulsion for:
Violence to Other Students Violence to Staff
Possession of Weapon
Distribution of Controlled Substance
Possession/Use of Controlled Substance
Possession/Use of Alcohol
Page 43 of 125
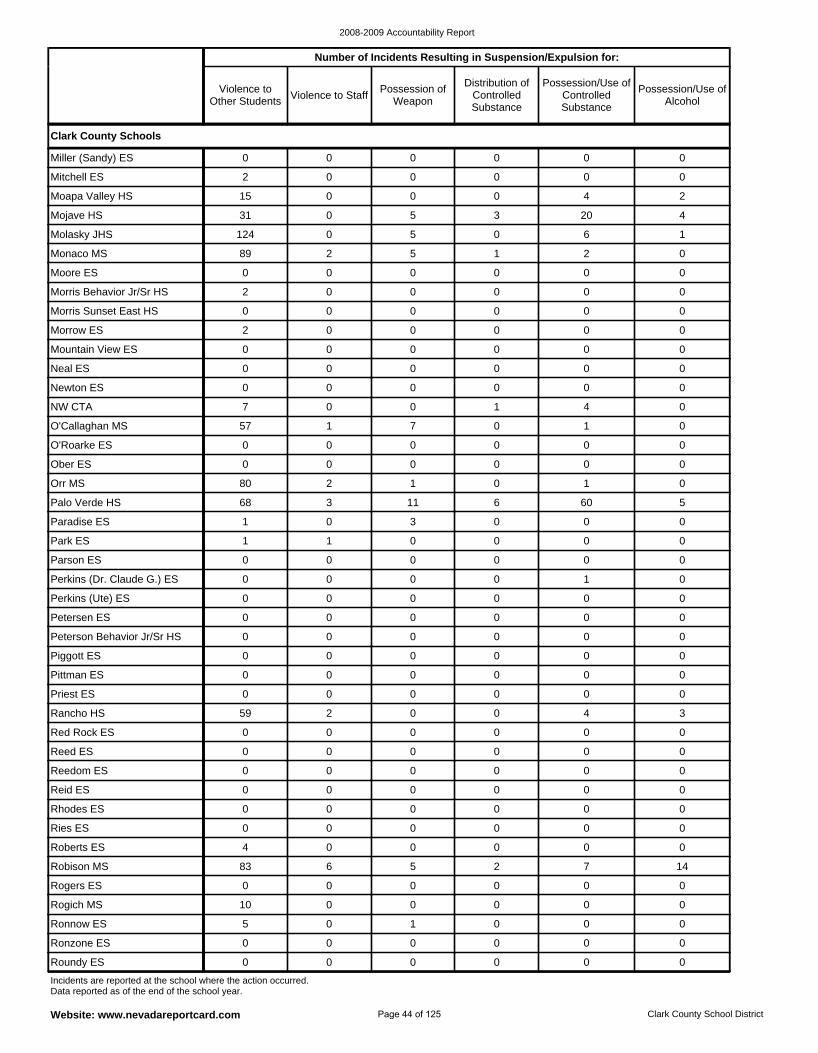
2008-2009 Accountability Report
Website: www.nevadareportcard.com Clark County School District
Reid ES 0 0 0 0 0 0
Reedom ES 0 0 0 0 0 0
Reed ES 0 0 0 0 0 0
Roberts ES 4 0 0 0 0 0
Ries ES 0 0 0 0 0 0
Rhodes ES 0 0 0 0 0 0
Red Rock ES 0 0 0 0 0 0
Piggott ES 0 0 0 0 0 0
Peterson Behavior Jr/Sr HS 0 0 0 0 0 0
Rancho HS 59 2 0 0 4 3
Priest ES 0 0 0 0 0 0
Pittman ES 0 0 0 0 0 0
Rogich MS 10 0 0 0 0 0
Rogers ES 0 0 0 0 0 0
Robison MS 83 6 5 2 7 14
Roundy ES 0 0 0 0 0 0
Ronzone ES 0 0 0 0 0 0
Ronnow ES 5 0 1 0 0 0
Perkins (Ute) ES 0 0 0 0 0 0
Moore ES 0 0 0 0 0 0
Monaco MS 89 2 5 1 2 0
Molasky JHS 124 0 5 0 6 1
Morrow ES 2 0 0 0 0 0
Morris Sunset East HS 0 0 0 0 0 0
Morris Behavior Jr/Sr HS 2 0 0 0 0 0
Miller (Sandy) ES 0 0 0 0 0 0
Petersen ES 0 0 0 0 0 0
Mojave HS 31 0 5 3 20 4
Moapa Valley HS 15 0 0 0 4 2
Mitchell ES 2 0 0 0 0 0
Mountain View ES 0 0 0 0 0 0
Paradise ES 1 0 3 0 0 0
Palo Verde HS 68 3 11 6 60 5
Orr MS 80 2 1 0 1 0
Perkins (Dr. Claude G.) ES 0 0 0 0 1 0
Parson ES 0 0 0 0 0 0
Park ES 1 1 0 0 0 0
NW CTA 7 0 0 1 4 0
Newton ES 0 0 0 0 0 0
Neal ES 0 0 0 0 0 0
O'Roarke ES 0 0 0 0 0 0
Ober ES 0 0 0 0 0 0
O'Callaghan MS 57 1 7 0 1 0
Clark County Schools
Incidents are reported at the school where the action occurred. Data reported as of the end of the school year.
Number of Incidents Resulting in Suspension/Expulsion for:
Violence to Other Students Violence to Staff
Possession of Weapon
Distribution of Controlled Substance
Possession/Use of Controlled Substance
Possession/Use of Alcohol
Page 44 of 125
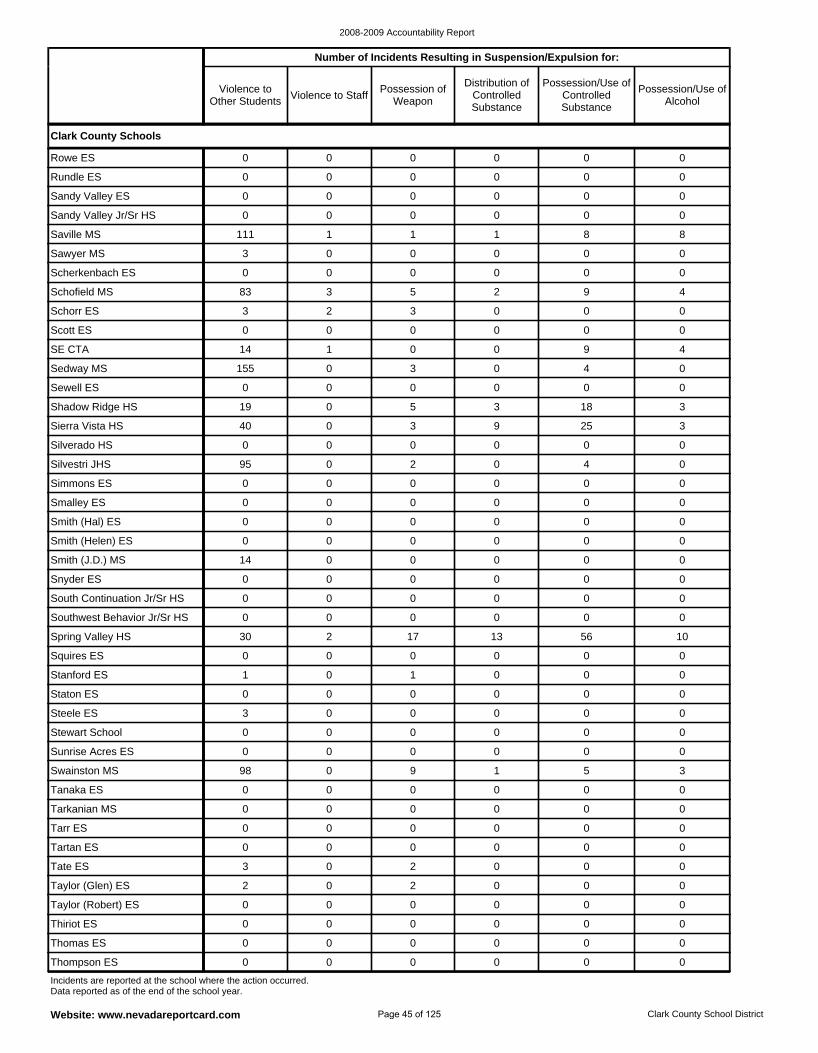
2008-2009 Accountability Report
Website: www.nevadareportcard.com Clark County School District
Tanaka ES 0 0 0 0 0 0
Swainston MS 98 0 9 1 5 3
Sunrise Acres ES 0 0 0 0 0 0
Tartan ES 0 0 0 0 0 0
Tarr ES 0 0 0 0 0 0
Tarkanian MS 0 0 0 0 0 0
Stewart School 0 0 0 0 0 0
Squires ES 0 0 0 0 0 0
Spring Valley HS 30 2 17 13 56 10
Steele ES 3 0 0 0 0 0
Staton ES 0 0 0 0 0 0
Stanford ES 1 0 1 0 0 0
Taylor (Robert) ES 0 0 0 0 0 0
Taylor (Glen) ES 2 0 2 0 0 0
Tate ES 3 0 2 0 0 0
Thompson ES 0 0 0 0 0 0
Thomas ES 0 0 0 0 0 0
Thiriot ES 0 0 0 0 0 0
South Continuation Jr/Sr HS 0 0 0 0 0 0
Scherkenbach ES 0 0 0 0 0 0
Sawyer MS 3 0 0 0 0 0
Saville MS 111 1 1 1 8 8
Scott ES 0 0 0 0 0 0
Schorr ES 3 2 3 0 0 0
Schofield MS 83 3 5 2 9 4
Rowe ES 0 0 0 0 0 0
Southwest Behavior Jr/Sr HS 0 0 0 0 0 0
Sandy Valley Jr/Sr HS 0 0 0 0 0 0
Sandy Valley ES 0 0 0 0 0 0
Rundle ES 0 0 0 0 0 0
SE CTA 14 1 0 0 9 4
Smith (Hal) ES 0 0 0 0 0 0
Smalley ES 0 0 0 0 0 0
Simmons ES 0 0 0 0 0 0
Snyder ES 0 0 0 0 0 0
Smith (J.D.) MS 14 0 0 0 0 0
Smith (Helen) ES 0 0 0 0 0 0
Shadow Ridge HS 19 0 5 3 18 3
Sewell ES 0 0 0 0 0 0
Sedway MS 155 0 3 0 4 0
Silverado HS 0 0 0 0 0 0
Silvestri JHS 95 0 2 0 4 0
Sierra Vista HS 40 0 3 9 25 3
Clark County Schools
Incidents are reported at the school where the action occurred. Data reported as of the end of the school year.
Number of Incidents Resulting in Suspension/Expulsion for:
Violence to Other Students Violence to Staff
Possession of Weapon
Distribution of Controlled Substance
Possession/Use of Controlled Substance
Possession/Use of Alcohol
Page 45 of 125
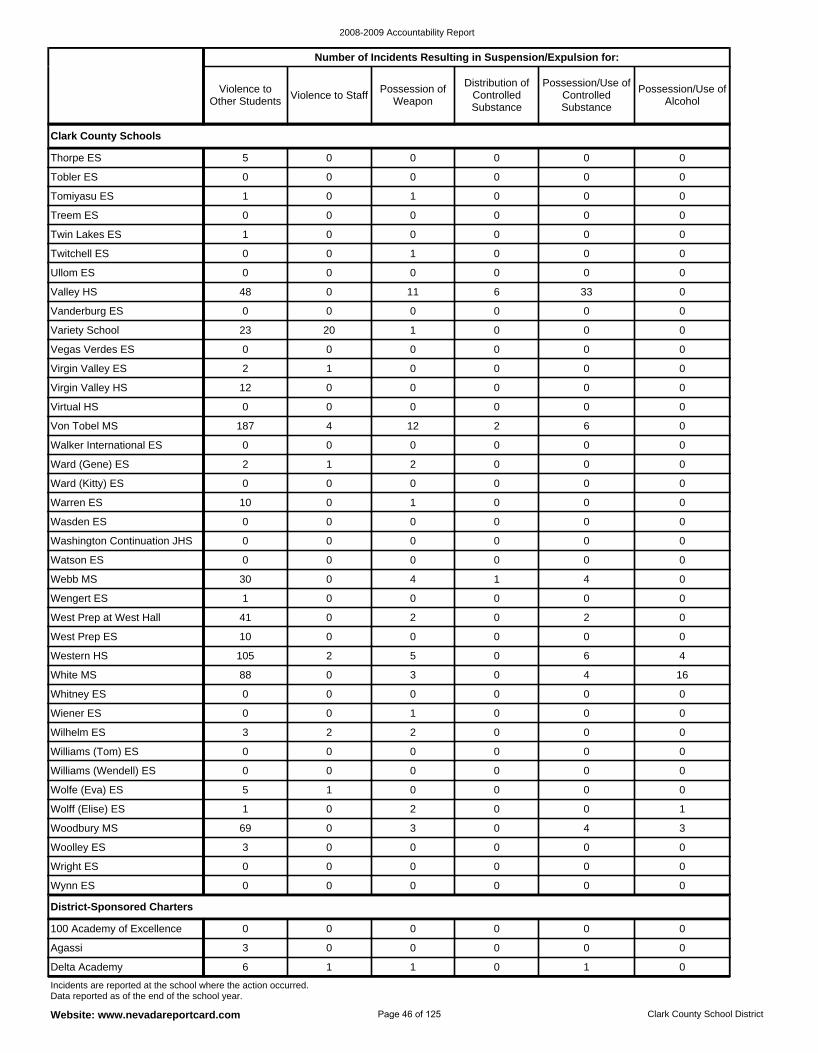
2008-2009 Accountability Report
Website: www.nevadareportcard.com Clark County School District
Delta Academy 6 1 1 0 1 0
Agassi 3 0 0 0 0 0
100 Academy of Excellence 0 0 0 0 0 0
District-Sponsored Charters
Whitney ES 0 0 0 0 0 0
Wiener ES 0 0 1 0 0 0
Wilhelm ES 3 2 2 0 0 0
White MS 88 0 3 0 4 16
Wright ES 0 0 0 0 0 0
West Prep ES 10 0 0 0 0 0
Western HS 105 2 5 0 6 4
Williams (Tom) ES 0 0 0 0 0 0
Woolley ES 3 0 0 0 0 0
West Prep at West Hall 41 0 2 0 2 0
Wynn ES 0 0 0 0 0 0
Woodbury MS 69 0 3 0 4 3
Williams (Wendell) ES 0 0 0 0 0 0
Wolfe (Eva) ES 5 1 0 0 0 0
Wolff (Elise) ES 1 0 2 0 0 1
Vanderburg ES 0 0 0 0 0 0
Valley HS 48 0 11 6 33 0
Ullom ES 0 0 0 0 0 0
Virgin Valley ES 2 1 0 0 0 0
Vegas Verdes ES 0 0 0 0 0 0
Variety School 23 20 1 0 0 0
Tomiyasu ES 1 0 1 0 0 0
Tobler ES 0 0 0 0 0 0
Thorpe ES 5 0 0 0 0 0
Twitchell ES 0 0 1 0 0 0
Twin Lakes ES 1 0 0 0 0 0
Treem ES 0 0 0 0 0 0
Washington Continuation JHS 0 0 0 0 0 0
Wasden ES 0 0 0 0 0 0
Warren ES 10 0 1 0 0 0
Wengert ES 1 0 0 0 0 0
Webb MS 30 0 4 1 4 0
Watson ES 0 0 0 0 0 0
Von Tobel MS 187 4 12 2 6 0
Virtual HS 0 0 0 0 0 0
Virgin Valley HS 12 0 0 0 0 0
Ward (Kitty) ES 0 0 0 0 0 0
Ward (Gene) ES 2 1 2 0 0 0
Walker International ES 0 0 0 0 0 0
Clark County Schools
Incidents are reported at the school where the action occurred. Data reported as of the end of the school year.
Number of Incidents Resulting in Suspension/Expulsion for:
Violence to Other Students Violence to Staff
Possession of Weapon
Distribution of Controlled Substance
Possession/Use of Controlled Substance
Possession/Use of Alcohol
Page 46 of 125
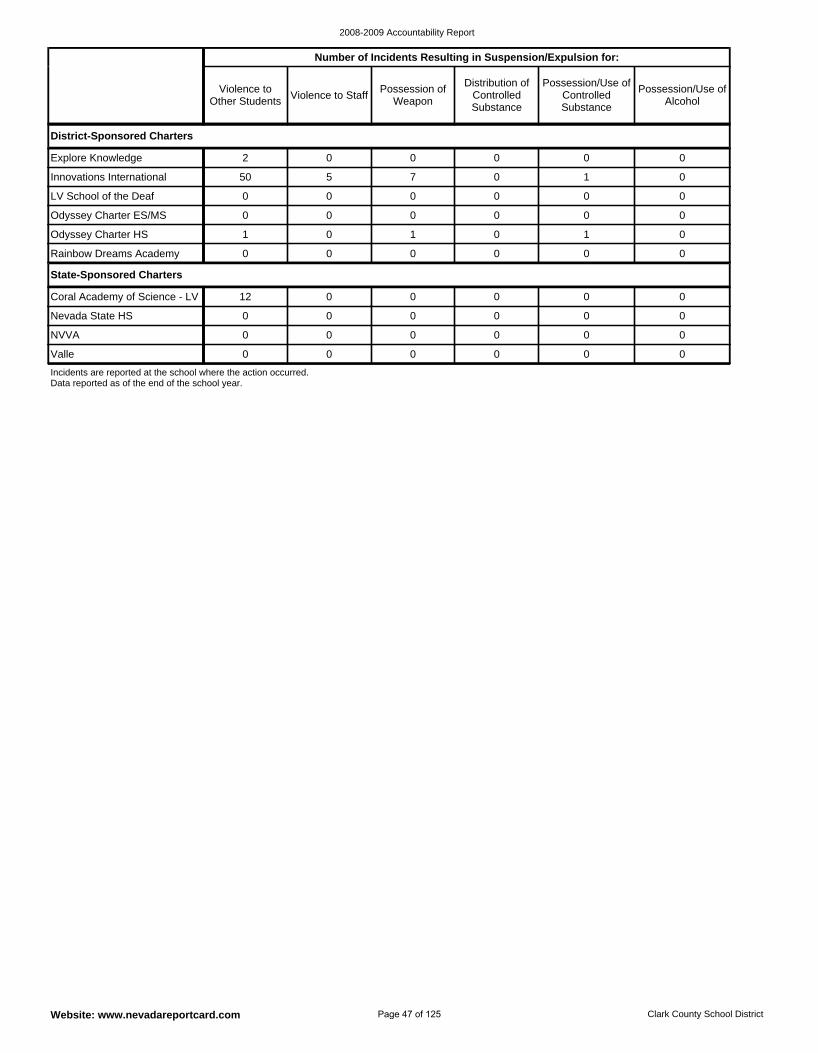
2008-2009 Accountability Report
Website: www.nevadareportcard.com Clark County School District
Coral Academy of Science - LV 12 0 0 0 0 0
NVVA 0 0 0 0 0 0
Valle 0 0 0 0 0 0
Nevada State HS 0 0 0 0 0 0
State-Sponsored Charters
Odyssey Charter HS 1 0 1 0 1 0
Rainbow Dreams Academy 0 0 0 0 0 0
Innovations International 50 5 7 0 1 0
Explore Knowledge 2 0 0 0 0 0
Odyssey Charter ES/MS 0 0 0 0 0 0
LV School of the Deaf 0 0 0 0 0 0
District-Sponsored Charters
Incidents are reported at the school where the action occurred. Data reported as of the end of the school year.
Number of Incidents Resulting in Suspension/Expulsion for:
Violence to Other Students Violence to Staff
Possession of Weapon
Distribution of Controlled Substance
Possession/Use of Controlled Substance
Possession/Use of Alcohol
Page 47 of 125
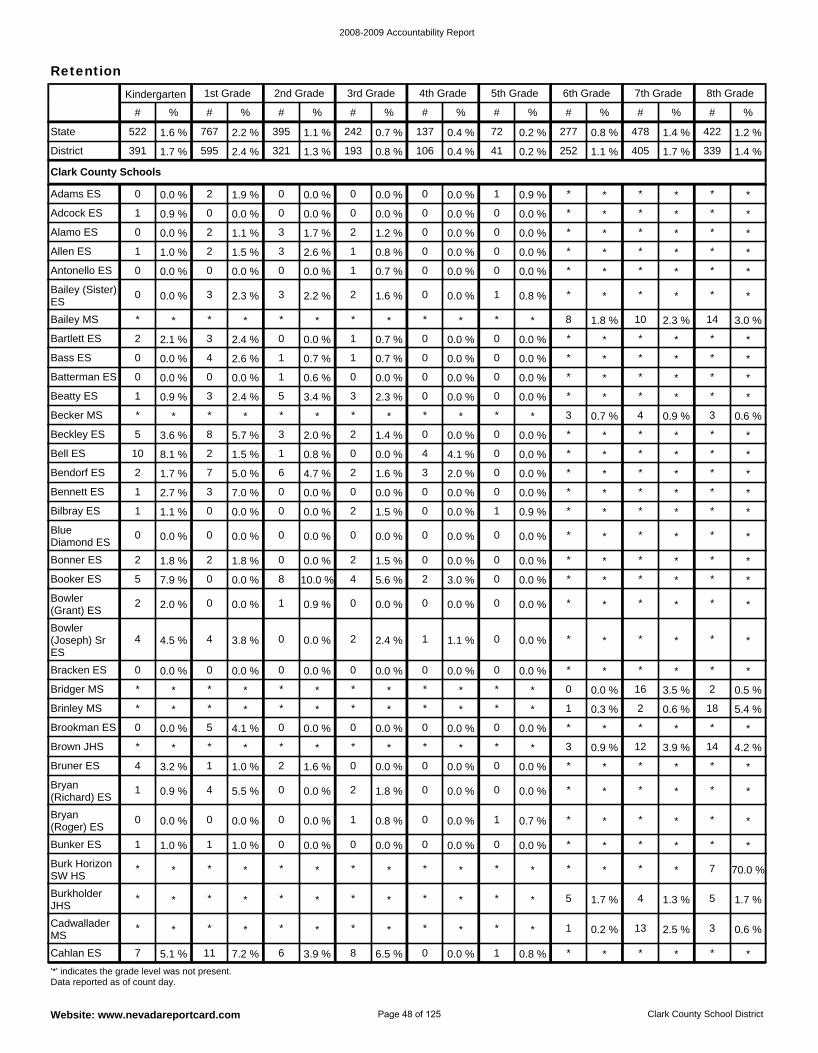
2008-2009 Accountability Report
Website: www.nevadareportcard.com Clark County School District
Retention
Bryan (Roger) ES
0 0.0 % 0 0.0 % 0 0.0 % 1 0.8 % 0 0.0 % 1 0.7 % * * * * * *
Bryan (Richard) ES
1 0.9 % 4 5.5 % 0 0.0 % 2 1.8 % 0 0.0 % 0 0.0 % * * * * * *
Bruner ES 4 3.2 % 1 1.0 % 2 1.6 % 0 0.0 % 0 0.0 % 0 0.0 % * * * * * *
Burkholder JHS
* * * * * * * * * * * * 5 1.7 % 4 1.3 % 5 1.7 %
Burk Horizon SW HS
* * * * * * * * * * * * * * * * 7 70.0 %
Bunker ES 1 1.0 % 1 1.0 % 0 0.0 % 0 0.0 % 0 0.0 % 0 0.0 % * * * * * *
Bridger MS * * * * * * * * * * * * 0 0.0 % 16 3.5 % 2 0.5 %
Bracken ES 0 0.0 % 0 0.0 % 0 0.0 % 0 0.0 % 0 0.0 % 0 0.0 % * * * * * *
Brown JHS * * * * * * * * * * * * 3 0.9 % 12 3.9 % 14 4.2 %
Brookman ES 0 0.0 % 5 4.1 % 0 0.0 % 0 0.0 % 0 0.0 % 0 0.0 % * * * * * *
Brinley MS * * * * * * * * * * * * 1 0.3 % 2 0.6 % 18 5.4 %
Cadwallader MS
* * * * * * * * * * * * 1 0.2 % 13 2.5 % 3 0.6 %
Cahlan ES 7 5.1 % 11 7.2 % 6 3.9 % 8 6.5 % 0 0.0 % 1 0.8 % * * * * * *
Bowler (Grant) ES
2 2.0 % 0 0.0 % 1 0.9 % 0 0.0 % 0 0.0 % 0 0.0 % * * * * * *
Bailey (Sister) ES
0 0.0 % 3 2.3 % 3 2.2 % 2 1.6 % 0 0.0 % 1 0.8 % * * * * * *
Antonello ES 0 0.0 % 0 0.0 % 0 0.0 % 1 0.7 % 0 0.0 % 0 0.0 % * * * * * *
Bailey MS * * * * * * * * * * * * 8 1.8 % 10 2.3 % 14 3.0 %
Bass ES 0 0.0 % 4 2.6 % 1 0.7 % 1 0.7 % 0 0.0 % 0 0.0 % * * * * * *
Bartlett ES 2 2.1 % 3 2.4 % 0 0.0 % 1 0.7 % 0 0.0 % 0 0.0 % * * * * * *
Allen ES 1 1.0 % 2 1.5 % 3 2.6 % 1 0.8 % 0 0.0 % 0 0.0 % * * * * * *
Bowler (Joseph) Sr ES
4 4.5 % 4 3.8 % 0 0.0 % 2 2.4 % 1 1.1 % 0 0.0 % * * * * * *
Adams ES 0 0.0 % 2 1.9 % 0 0.0 % 0 0.0 % 0 0.0 % 1 0.9 % * * * * * *
Alamo ES 0 0.0 % 2 1.1 % 3 1.7 % 2 1.2 % 0 0.0 % 0 0.0 % * * * * * *
Adcock ES 1 0.9 % 0 0.0 % 0 0.0 % 0 0.0 % 0 0.0 % 0 0.0 % * * * * * *
Bilbray ES 1 1.1 % 0 0.0 % 0 0.0 % 2 1.5 % 0 0.0 % 1 0.9 % * * * * * *
Bennett ES 1 2.7 % 3 7.0 % 0 0.0 % 0 0.0 % 0 0.0 % 0 0.0 % * * * * * *
Blue Diamond ES
0 0.0 % 0 0.0 % 0 0.0 % 0 0.0 % 0 0.0 % 0 0.0 % * * * * * *
Booker ES 5 7.9 % 0 0.0 % 8 10.0 % 4 5.6 % 2 3.0 % 0 0.0 % * * * * * *
Bonner ES 2 1.8 % 2 1.8 % 0 0.0 % 2 1.5 % 0 0.0 % 0 0.0 % * * * * * *
Bendorf ES 2 1.7 % 7 5.0 % 6 4.7 % 2 1.6 % 3 2.0 % 0 0.0 % * * * * * *
Batterman ES 0 0.0 % 0 0.0 % 1 0.6 % 0 0.0 % 0 0.0 % 0 0.0 % * * * * * *
Beatty ES 1 0.9 % 3 2.4 % 5 3.4 % 3 2.3 % 0 0.0 % 0 0.0 % * * * * * *
Becker MS * * * * * * * * * * * * 3 0.7 % 4 0.9 % 3 0.6 %
Bell ES 10 8.1 % 2 1.5 % 1 0.8 % 0 0.0 % 4 4.1 % 0 0.0 % * * * * * *
Beckley ES 5 3.6 % 8 5.7 % 3 2.0 % 2 1.4 % 0 0.0 % 0 0.0 % * * * * * *
Clark County Schools
District 391 1.7 % 595 2.4 % 321 1.3 % 193 0.8 % 106 0.4 % 41 0.2 % 252 1.1 % 405 1.7 % 339 1.4 %
State 522 1.6 % 767 2.2 % 395 1.1 % 242 0.7 % 137 0.4 % 72 0.2 % 277 0.8 % 478 1.4 % 422 1.2 %
'*' indicates the grade level was not present. Data reported as of count day.
Kindergarten 1st Grade 2nd Grade 3rd Grade 4th Grade 5th Grade 6th Grade 7th Grade 8th Grade
# % # % # % # % # % # % # % # % # %
Page 48 of 125
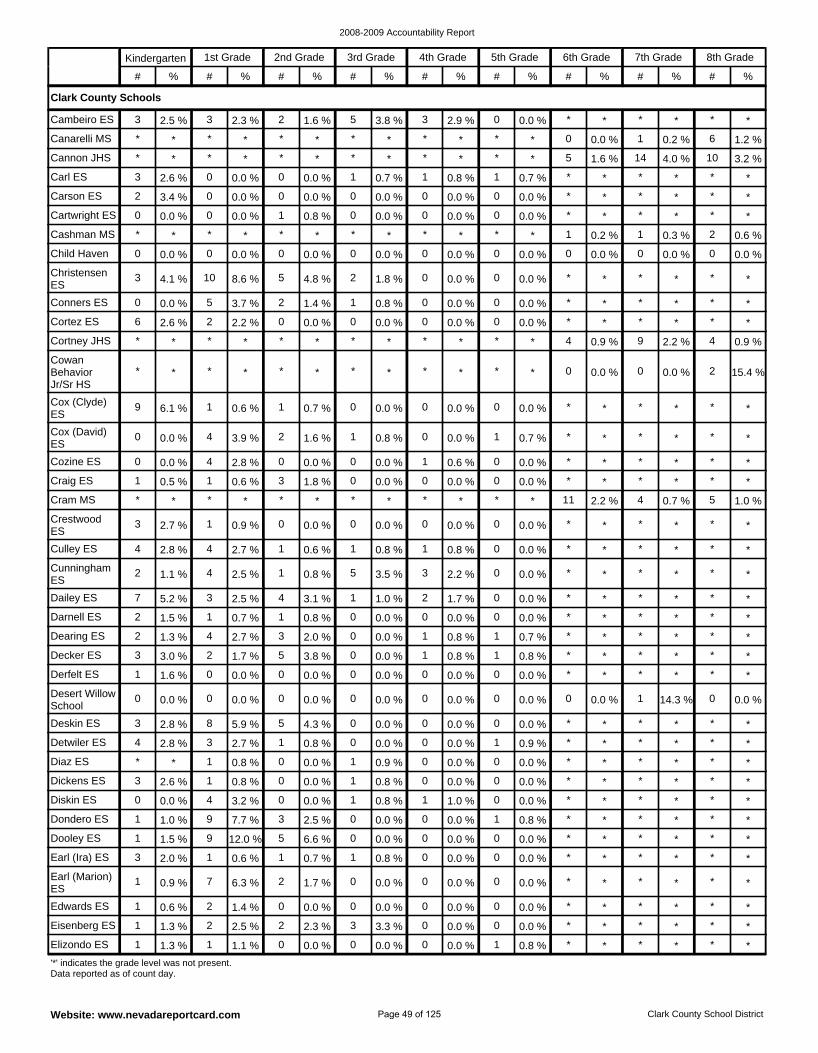
2008-2009 Accountability Report
Website: www.nevadareportcard.com Clark County School District
Diskin ES 0 0.0 % 4 3.2 % 0 0.0 % 1 0.8 % 1 1.0 % 0 0.0 % * * * * * *
Dickens ES 3 2.6 % 1 0.8 % 0 0.0 % 1 0.8 % 0 0.0 % 0 0.0 % * * * * * *
Diaz ES * * 1 0.8 % 0 0.0 % 1 0.9 % 0 0.0 % 0 0.0 % * * * * * *
Earl (Ira) ES 3 2.0 % 1 0.6 % 1 0.7 % 1 0.8 % 0 0.0 % 0 0.0 % * * * * * *
Dooley ES 1 1.5 % 9 12.0 % 5 6.6 % 0 0.0 % 0 0.0 % 0 0.0 % * * * * * *
Dondero ES 1 1.0 % 9 7.7 % 3 2.5 % 0 0.0 % 0 0.0 % 1 0.8 % * * * * * *
Derfelt ES 1 1.6 % 0 0.0 % 0 0.0 % 0 0.0 % 0 0.0 % 0 0.0 % * * * * * *
Decker ES 3 3.0 % 2 1.7 % 5 3.8 % 0 0.0 % 1 0.8 % 1 0.8 % * * * * * *
Detwiler ES 4 2.8 % 3 2.7 % 1 0.8 % 0 0.0 % 0 0.0 % 1 0.9 % * * * * * *
Deskin ES 3 2.8 % 8 5.9 % 5 4.3 % 0 0.0 % 0 0.0 % 0 0.0 % * * * * * *
Desert Willow School
0 0.0 % 0 0.0 % 0 0.0 % 0 0.0 % 0 0.0 % 0 0.0 % 0 0.0 % 1 14.3 % 0 0.0 %
Earl (Marion) ES
1 0.9 % 7 6.3 % 2 1.7 % 0 0.0 % 0 0.0 % 0 0.0 % * * * * * *
Elizondo ES 1 1.3 % 1 1.1 % 0 0.0 % 0 0.0 % 0 0.0 % 1 0.8 % * * * * * *
Eisenberg ES 1 1.3 % 2 2.5 % 2 2.3 % 3 3.3 % 0 0.0 % 0 0.0 % * * * * * *
Edwards ES 1 0.6 % 2 1.4 % 0 0.0 % 0 0.0 % 0 0.0 % 0 0.0 % * * * * * *
Darnell ES 2 1.5 % 1 0.7 % 1 0.8 % 0 0.0 % 0 0.0 % 0 0.0 % * * * * * *
Cashman MS * * * * * * * * * * * * 1 0.2 % 1 0.3 % 2 0.6 %
Cartwright ES 0 0.0 % 0 0.0 % 1 0.8 % 0 0.0 % 0 0.0 % 0 0.0 % * * * * * *
Carson ES 2 3.4 % 0 0.0 % 0 0.0 % 0 0.0 % 0 0.0 % 0 0.0 % * * * * * *
Conners ES 0 0.0 % 5 3.7 % 2 1.4 % 1 0.8 % 0 0.0 % 0 0.0 % * * * * * *
Christensen ES
3 4.1 % 10 8.6 % 5 4.8 % 2 1.8 % 0 0.0 % 0 0.0 % * * * * * *
Child Haven 0 0.0 % 0 0.0 % 0 0.0 % 0 0.0 % 0 0.0 % 0 0.0 % 0 0.0 % 0 0.0 % 0 0.0 %
Cambeiro ES 3 2.5 % 3 2.3 % 2 1.6 % 5 3.8 % 3 2.9 % 0 0.0 % * * * * * *
Dearing ES 2 1.3 % 4 2.7 % 3 2.0 % 0 0.0 % 1 0.8 % 1 0.7 % * * * * * *
Carl ES 3 2.6 % 0 0.0 % 0 0.0 % 1 0.7 % 1 0.8 % 1 0.7 % * * * * * *
Cannon JHS * * * * * * * * * * * * 5 1.6 % 14 4.0 % 10 3.2 %
Canarelli MS * * * * * * * * * * * * 0 0.0 % 1 0.2 % 6 1.2 %
Crestwood ES
3 2.7 % 1 0.9 % 0 0.0 % 0 0.0 % 0 0.0 % 0 0.0 % * * * * * *
Cram MS * * * * * * * * * * * * 11 2.2 % 4 0.7 % 5 1.0 %
Craig ES 1 0.5 % 1 0.6 % 3 1.8 % 0 0.0 % 0 0.0 % 0 0.0 % * * * * * *
Dailey ES 7 5.2 % 3 2.5 % 4 3.1 % 1 1.0 % 2 1.7 % 0 0.0 % * * * * * *
Cunningham ES
2 1.1 % 4 2.5 % 1 0.8 % 5 3.5 % 3 2.2 % 0 0.0 % * * * * * *
Culley ES 4 2.8 % 4 2.7 % 1 0.6 % 1 0.8 % 1 0.8 % 0 0.0 % * * * * * *
Cowan Behavior Jr/Sr HS
* * * * * * * * * * * * 0 0.0 % 0 0.0 % 2 15.4 %
Cortney JHS * * * * * * * * * * * * 4 0.9 % 9 2.2 % 4 0.9 %
Cortez ES 6 2.6 % 2 2.2 % 0 0.0 % 0 0.0 % 0 0.0 % 0 0.0 % * * * * * *
Cox (David) ES
0 0.0 % 4 3.9 % 2 1.6 % 1 0.8 % 0 0.0 % 1 0.7 % * * * * * *
Cozine ES 0 0.0 % 4 2.8 % 0 0.0 % 0 0.0 % 1 0.6 % 0 0.0 % * * * * * *
Cox (Clyde) ES
9 6.1 % 1 0.6 % 1 0.7 % 0 0.0 % 0 0.0 % 0 0.0 % * * * * * *
Clark County Schools
'*' indicates the grade level was not present. Data reported as of count day.
Kindergarten 1st Grade 2nd Grade 3rd Grade 4th Grade 5th Grade 6th Grade 7th Grade 8th Grade
# % # % # % # % # % # % # % # % # %
Page 49 of 125
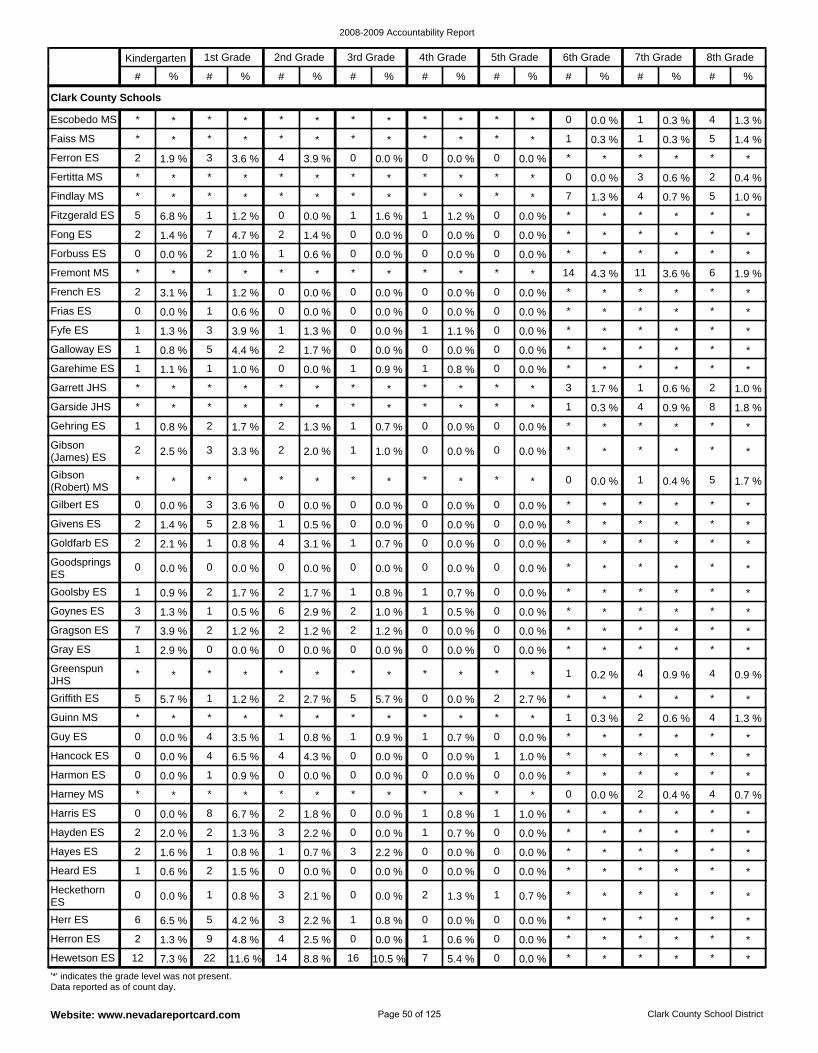
2008-2009 Accountability Report
Website: www.nevadareportcard.com Clark County School District
Harney MS * * * * * * * * * * * * 0 0.0 % 2 0.4 % 4 0.7 %
Harmon ES 0 0.0 % 1 0.9 % 0 0.0 % 0 0.0 % 0 0.0 % 0 0.0 % * * * * * *
Hancock ES 0 0.0 % 4 6.5 % 4 4.3 % 0 0.0 % 0 0.0 % 1 1.0 % * * * * * *
Hayes ES 2 1.6 % 1 0.8 % 1 0.7 % 3 2.2 % 0 0.0 % 0 0.0 % * * * * * *
Hayden ES 2 2.0 % 2 1.3 % 3 2.2 % 0 0.0 % 1 0.7 % 0 0.0 % * * * * * *
Harris ES 0 0.0 % 8 6.7 % 2 1.8 % 0 0.0 % 1 0.8 % 1 1.0 % * * * * * *
Guy ES 0 0.0 % 4 3.5 % 1 0.8 % 1 0.9 % 1 0.7 % 0 0.0 % * * * * * *
Gray ES 1 2.9 % 0 0.0 % 0 0.0 % 0 0.0 % 0 0.0 % 0 0.0 % * * * * * *
Gragson ES 7 3.9 % 2 1.2 % 2 1.2 % 2 1.2 % 0 0.0 % 0 0.0 % * * * * * *
Guinn MS * * * * * * * * * * * * 1 0.3 % 2 0.6 % 4 1.3 %
Griffith ES 5 5.7 % 1 1.2 % 2 2.7 % 5 5.7 % 0 0.0 % 2 2.7 % * * * * * *
Greenspun JHS
* * * * * * * * * * * * 1 0.2 % 4 0.9 % 4 0.9 %
Herr ES 6 6.5 % 5 4.2 % 3 2.2 % 1 0.8 % 0 0.0 % 0 0.0 % * * * * * *
Heckethorn ES
0 0.0 % 1 0.8 % 3 2.1 % 0 0.0 % 2 1.3 % 1 0.7 % * * * * * *
Heard ES 1 0.6 % 2 1.5 % 0 0.0 % 0 0.0 % 0 0.0 % 0 0.0 % * * * * * *
Hewetson ES 12 7.3 % 22 11.6 % 14 8.8 % 16 10.5 % 7 5.4 % 0 0.0 % * * * * * *
Herron ES 2 1.3 % 9 4.8 % 4 2.5 % 0 0.0 % 1 0.6 % 0 0.0 % * * * * * *
Goolsby ES 1 0.9 % 2 1.7 % 2 1.7 % 1 0.8 % 1 0.7 % 0 0.0 % * * * * * *
Fong ES 2 1.4 % 7 4.7 % 2 1.4 % 0 0.0 % 0 0.0 % 0 0.0 % * * * * * *
Fitzgerald ES 5 6.8 % 1 1.2 % 0 0.0 % 1 1.6 % 1 1.2 % 0 0.0 % * * * * * *
Findlay MS * * * * * * * * * * * * 7 1.3 % 4 0.7 % 5 1.0 %
French ES 2 3.1 % 1 1.2 % 0 0.0 % 0 0.0 % 0 0.0 % 0 0.0 % * * * * * *
Fremont MS * * * * * * * * * * * * 14 4.3 % 11 3.6 % 6 1.9 %
Forbuss ES 0 0.0 % 2 1.0 % 1 0.6 % 0 0.0 % 0 0.0 % 0 0.0 % * * * * * *
Escobedo MS * * * * * * * * * * * * 0 0.0 % 1 0.3 % 4 1.3 %
Goynes ES 3 1.3 % 1 0.5 % 6 2.9 % 2 1.0 % 1 0.5 % 0 0.0 % * * * * * *
Fertitta MS * * * * * * * * * * * * 0 0.0 % 3 0.6 % 2 0.4 %
Ferron ES 2 1.9 % 3 3.6 % 4 3.9 % 0 0.0 % 0 0.0 % 0 0.0 % * * * * * *
Faiss MS * * * * * * * * * * * * 1 0.3 % 1 0.3 % 5 1.4 %
Frias ES 0 0.0 % 1 0.6 % 0 0.0 % 0 0.0 % 0 0.0 % 0 0.0 % * * * * * *
Gilbert ES 0 0.0 % 3 3.6 % 0 0.0 % 0 0.0 % 0 0.0 % 0 0.0 % * * * * * *
Gibson (Robert) MS
* * * * * * * * * * * * 0 0.0 % 1 0.4 % 5 1.7 %
Gibson (James) ES
2 2.5 % 3 3.3 % 2 2.0 % 1 1.0 % 0 0.0 % 0 0.0 % * * * * * *
Goodsprings ES
0 0.0 % 0 0.0 % 0 0.0 % 0 0.0 % 0 0.0 % 0 0.0 % * * * * * *
Goldfarb ES 2 2.1 % 1 0.8 % 4 3.1 % 1 0.7 % 0 0.0 % 0 0.0 % * * * * * *
Givens ES 2 1.4 % 5 2.8 % 1 0.5 % 0 0.0 % 0 0.0 % 0 0.0 % * * * * * *
Garehime ES 1 1.1 % 1 1.0 % 0 0.0 % 1 0.9 % 1 0.8 % 0 0.0 % * * * * * *
Galloway ES 1 0.8 % 5 4.4 % 2 1.7 % 0 0.0 % 0 0.0 % 0 0.0 % * * * * * *
Fyfe ES 1 1.3 % 3 3.9 % 1 1.3 % 0 0.0 % 1 1.1 % 0 0.0 % * * * * * *
Garside JHS * * * * * * * * * * * * 1 0.3 % 4 0.9 % 8 1.8 %
Gehring ES 1 0.8 % 2 1.7 % 2 1.3 % 1 0.7 % 0 0.0 % 0 0.0 % * * * * * *
Garrett JHS * * * * * * * * * * * * 3 1.7 % 1 0.6 % 2 1.0 %
Clark County Schools
'*' indicates the grade level was not present. Data reported as of count day.
Kindergarten 1st Grade 2nd Grade 3rd Grade 4th Grade 5th Grade 6th Grade 7th Grade 8th Grade
# % # % # % # % # % # % # % # % # %
Page 50 of 125
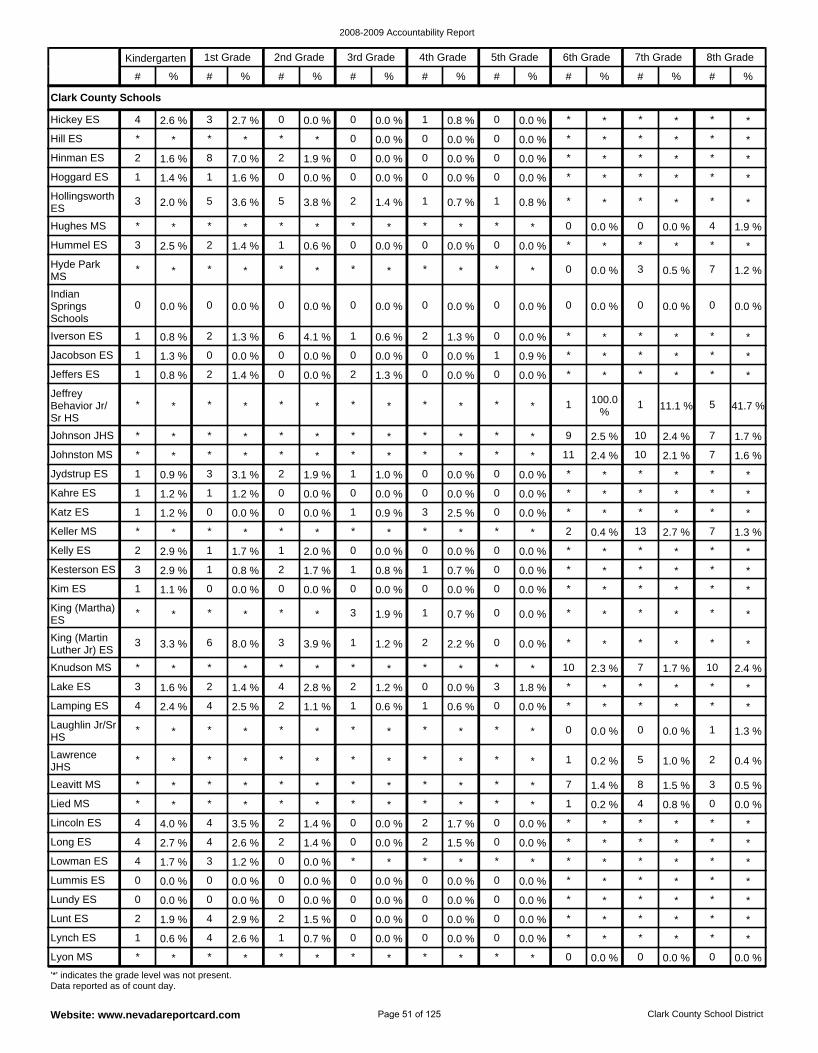
2008-2009 Accountability Report
Website: www.nevadareportcard.com Clark County School District
Lied MS * * * * * * * * * * * * 1 0.2 % 4 0.8 % 0 0.0 %
Leavitt MS * * * * * * * * * * * * 7 1.4 % 8 1.5 % 3 0.5 %
Lawrence JHS
* * * * * * * * * * * * 1 0.2 % 5 1.0 % 2 0.4 %
Lowman ES 4 1.7 % 3 1.2 % 0 0.0 % * * * * * * * * * * * *
Long ES 4 2.7 % 4 2.6 % 2 1.4 % 0 0.0 % 2 1.5 % 0 0.0 % * * * * * *
Lincoln ES 4 4.0 % 4 3.5 % 2 1.4 % 0 0.0 % 2 1.7 % 0 0.0 % * * * * * *
Knudson MS * * * * * * * * * * * * 10 2.3 % 7 1.7 % 10 2.4 %
King (Martha) ES
* * * * * * 3 1.9 % 1 0.7 % 0 0.0 % * * * * * *
Laughlin Jr/Sr HS
* * * * * * * * * * * * 0 0.0 % 0 0.0 % 1 1.3 %
Lamping ES 4 2.4 % 4 2.5 % 2 1.1 % 1 0.6 % 1 0.6 % 0 0.0 % * * * * * *
Lake ES 3 1.6 % 2 1.4 % 4 2.8 % 2 1.2 % 0 0.0 % 3 1.8 % * * * * * *
Lummis ES 0 0.0 % 0 0.0 % 0 0.0 % 0 0.0 % 0 0.0 % 0 0.0 % * * * * * *
Lynch ES 1 0.6 % 4 2.6 % 1 0.7 % 0 0.0 % 0 0.0 % 0 0.0 % * * * * * *
Lunt ES 2 1.9 % 4 2.9 % 2 1.5 % 0 0.0 % 0 0.0 % 0 0.0 % * * * * * *
Lundy ES 0 0.0 % 0 0.0 % 0 0.0 % 0 0.0 % 0 0.0 % 0 0.0 % * * * * * *
Lyon MS * * * * * * * * * * * * 0 0.0 % 0 0.0 % 0 0.0 %
Hummel ES 3 2.5 % 2 1.4 % 1 0.6 % 0 0.0 % 0 0.0 % 0 0.0 % * * * * * *
Hughes MS * * * * * * * * * * * * 0 0.0 % 0 0.0 % 4 1.9 %
Hollingsworth ES
3 2.0 % 5 3.6 % 5 3.8 % 2 1.4 % 1 0.7 % 1 0.8 % * * * * * *
Iverson ES 1 0.8 % 2 1.3 % 6 4.1 % 1 0.6 % 2 1.3 % 0 0.0 % * * * * * *
Indian Springs Schools
0 0.0 % 0 0.0 % 0 0.0 % 0 0.0 % 0 0.0 % 0 0.0 % 0 0.0 % 0 0.0 % 0 0.0 %
Hyde Park MS
* * * * * * * * * * * * 0 0.0 % 3 0.5 % 7 1.2 %
Hickey ES 4 2.6 % 3 2.7 % 0 0.0 % 0 0.0 % 1 0.8 % 0 0.0 % * * * * * *
King (Martin Luther Jr) ES
3 3.3 % 6 8.0 % 3 3.9 % 1 1.2 % 2 2.2 % 0 0.0 % * * * * * *
Hoggard ES 1 1.4 % 1 1.6 % 0 0.0 % 0 0.0 % 0 0.0 % 0 0.0 % * * * * * *
Hinman ES 2 1.6 % 8 7.0 % 2 1.9 % 0 0.0 % 0 0.0 % 0 0.0 % * * * * * *
Hill ES * * * * * * 0 0.0 % 0 0.0 % 0 0.0 % * * * * * *
Keller MS * * * * * * * * * * * * 2 0.4 % 13 2.7 % 7 1.3 %
Katz ES 1 1.2 % 0 0.0 % 0 0.0 % 1 0.9 % 3 2.5 % 0 0.0 % * * * * * *
Kahre ES 1 1.2 % 1 1.2 % 0 0.0 % 0 0.0 % 0 0.0 % 0 0.0 % * * * * * *
Kim ES 1 1.1 % 0 0.0 % 0 0.0 % 0 0.0 % 0 0.0 % 0 0.0 % * * * * * *
Kesterson ES 3 2.9 % 1 0.8 % 2 1.7 % 1 0.8 % 1 0.7 % 0 0.0 % * * * * * *
Kelly ES 2 2.9 % 1 1.7 % 1 2.0 % 0 0.0 % 0 0.0 % 0 0.0 % * * * * * *
Jeffrey Behavior Jr/ Sr HS
* * * * * * * * * * * * 1 100.0 %
1 11.1 % 5 41.7 %
Jeffers ES 1 0.8 % 2 1.4 % 0 0.0 % 2 1.3 % 0 0.0 % 0 0.0 % * * * * * *
Jacobson ES 1 1.3 % 0 0.0 % 0 0.0 % 0 0.0 % 0 0.0 % 1 0.9 % * * * * * *
Johnston MS * * * * * * * * * * * * 11 2.4 % 10 2.1 % 7 1.6 %
Jydstrup ES 1 0.9 % 3 3.1 % 2 1.9 % 1 1.0 % 0 0.0 % 0 0.0 % * * * * * *
Johnson JHS * * * * * * * * * * * * 9 2.5 % 10 2.4 % 7 1.7 %
Clark County Schools
'*' indicates the grade level was not present. Data reported as of count day.
Kindergarten 1st Grade 2nd Grade 3rd Grade 4th Grade 5th Grade 6th Grade 7th Grade 8th Grade
# % # % # % # % # % # % # % # % # %
Page 51 of 125

2008-2009 Accountability Report
Website: www.nevadareportcard.com Clark County School District
Park ES 1 0.7 % 8 5.2 % 5 3.3 % 2 1.3 % 0 0.0 % 1 0.7 % * * * * * *
Paradise ES 2 2.5 % 0 0.0 % 2 1.9 % 2 1.9 % 3 2.9 % 1 1.1 % * * * * * *
Orr MS * * * * * * * * * * * * 0 0.0 % 0 0.0 % 0 0.0 %
Perkins (Ute) ES
1 2.6 % 1 4.8 % 0 0.0 % 0 0.0 % 0 0.0 % 0 0.0 % * * * * * *
Perkins (Dr. Claude G.) ES
5 4.6 % 5 4.1 % 6 5.0 % 4 3.3 % 0 0.0 % 0 0.0 % * * * * * *
Parson ES 2 1.7 % 3 2.8 % 0 0.0 % 0 0.0 % 0 0.0 % 1 1.0 % * * * * * *
Newton ES 4 4.0 % 11 8.1 % 3 2.2 % 0 0.0 % 0 0.0 % 1 0.7 % * * * * * *
Neal ES 1 0.8 % 0 0.0 % 0 0.0 % 1 0.9 % 0 0.0 % 0 0.0 % * * * * * *
Ober ES 0 0.0 % 1 0.8 % 1 0.7 % 0 0.0 % 0 0.0 % 0 0.0 % * * * * * *
O'Roarke ES 2 1.7 % 3 2.5 % 0 0.0 % 0 0.0 % 0 0.0 % 0 0.0 % * * * * * *
O'Callaghan MS
* * * * * * * * * * * * 2 0.4 % 23 4.4 % 7 1.4 %
Petersen ES 3 1.9 % 2 1.4 % 3 2.2 % 1 0.8 % 1 0.9 % 0 0.0 % * * * * * *
Morrow ES 2 1.5 % 6 4.0 % 1 0.7 % 1 0.6 % 1 0.8 % 0 0.0 % * * * * * *
Martinez ES 6 4.5 % 7 6.7 % 3 3.0 % 2 2.0 % 0 0.0 % 0 0.0 % * * * * * *
Martin MS * * * * * * * * * * * * 7 1.4 % 14 3.2 % 3 0.7 %
Mannion MS * * * * * * * * * * * * 0 0.0 % 1 0.2 % 1 0.2 %
McCaw ES 4 3.5 % 1 1.0 % 1 0.9 % 1 0.9 % 0 0.0 % 0 0.0 % * * * * * *
McCall ES 3 3.7 % 4 4.3 % 1 1.4 % 1 1.4 % 1 1.2 % 0 0.0 % * * * * * *
May ES 0 0.0 % 0 0.0 % 0 0.0 % 1 0.8 % 0 0.0 % 0 0.0 % * * * * * *
Mack (Jerome) MS
* * * * * * * * * * * * 21 4.9 % 15 3.1 % 7 1.5 %
Mountain View ES
1 1.2 % 5 5.2 % 1 1.0 % 0 0.0 % 0 0.0 % 0 0.0 % * * * * * *
Manch ES * * * * * * 1 0.5 % 0 0.0 % 0 0.0 % * * * * * *
Mackey ES 3 4.4 % 0 0.0 % 1 1.0 % 2 2.3 % 0 0.0 % 0 0.0 % * * * * * *
Mack (Nate) ES
1 1.3 % 3 2.8 % 0 0.0 % 1 1.0 % 0 0.0 % 0 0.0 % * * * * * *
Molasky JHS * * * * * * * * * * * * 10 2.1 % 9 1.8 % 9 1.7 %
Mitchell ES 7 4.9 % 6 4.0 % 1 0.7 % * * * * * * * * * * * *
Miller (Sandy) ES
* * 1 0.8 % 1 0.8 % 1 0.8 % 0 0.0 % 0 0.0 % * * * * * *
Morris Behavior Jr/Sr HS
* * * * * * * * * * * * 0 0.0 % 4 36.4 % 2 40.0 %
Moore ES 1 0.7 % 1 0.9 % 0 0.0 % 0 0.0 % 0 0.0 % 0 0.0 % * * * * * *
Monaco MS * * * * * * * * * * * * 2 0.4 % 4 0.8 % 2 0.4 %
McWilliams ES
0 0.0 % 1 0.8 % 0 0.0 % 1 0.9 % 0 0.0 % 0 0.0 % * * * * * *
McMillan ES 1 1.1 % 0 0.0 % 2 1.8 % 0 0.0 % 0 0.0 % 0 0.0 % * * * * * *
McDoniel ES 4 4.3 % 5 4.7 % 2 2.1 % 1 0.9 % 0 0.0 % 0 0.0 % * * * * * *
Miley Achievement Center
0 0.0 % 0 0.0 % 0 0.0 % 0 0.0 % 0 0.0 % 0 0.0 % 0 0.0 % 0 0.0 % 0 0.0 %
Miller (Bob) MS
* * * * * * * * * * * * 6 1.0 % 1 0.2 % 2 0.4 %
Mendoza ES 0 0.0 % 1 0.8 % 0 0.0 % 1 0.8 % 0 0.0 % 0 0.0 % * * * * * *
Clark County Schools
'*' indicates the grade level was not present. Data reported as of count day.
Kindergarten 1st Grade 2nd Grade 3rd Grade 4th Grade 5th Grade 6th Grade 7th Grade 8th Grade
# % # % # % # % # % # % # % # % # %
Page 52 of 125
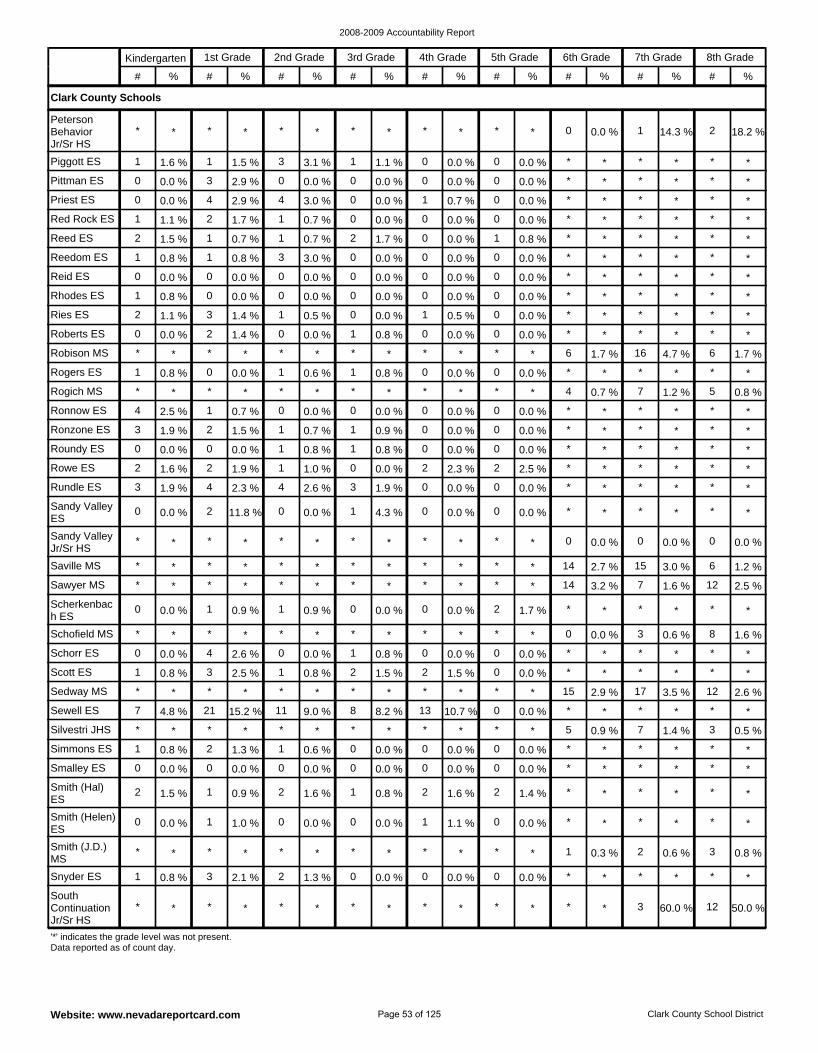
2008-2009 Accountability Report
Website: www.nevadareportcard.com Clark County School District
Smalley ES 0 0.0 % 0 0.0 % 0 0.0 % 0 0.0 % 0 0.0 % 0 0.0 % * * * * * *
Simmons ES 1 0.8 % 2 1.3 % 1 0.6 % 0 0.0 % 0 0.0 % 0 0.0 % * * * * * *
Silvestri JHS * * * * * * * * * * * * 5 0.9 % 7 1.4 % 3 0.5 %
Smith (J.D.) MS
* * * * * * * * * * * * 1 0.3 % 2 0.6 % 3 0.8 %
Smith (Helen) ES
0 0.0 % 1 1.0 % 0 0.0 % 0 0.0 % 1 1.1 % 0 0.0 % * * * * * *
Smith (Hal) ES
2 1.5 % 1 0.9 % 2 1.6 % 1 0.8 % 2 1.6 % 2 1.4 % * * * * * *
Schorr ES 0 0.0 % 4 2.6 % 0 0.0 % 1 0.8 % 0 0.0 % 0 0.0 % * * * * * *
Schofield MS * * * * * * * * * * * * 0 0.0 % 3 0.6 % 8 1.6 %
Sewell ES 7 4.8 % 21 15.2 % 11 9.0 % 8 8.2 % 13 10.7 % 0 0.0 % * * * * * *
Sedway MS * * * * * * * * * * * * 15 2.9 % 17 3.5 % 12 2.6 %
Scott ES 1 0.8 % 3 2.5 % 1 0.8 % 2 1.5 % 2 1.5 % 0 0.0 % * * * * * *
Snyder ES 1 0.8 % 3 2.1 % 2 1.3 % 0 0.0 % 0 0.0 % 0 0.0 % * * * * * *
South Continuation Jr/Sr HS
* * * * * * * * * * * * * * 3 60.0 % 12 50.0 %
Sawyer MS * * * * * * * * * * * * 14 3.2 % 7 1.6 % 12 2.5 %
Reedom ES 1 0.8 % 1 0.8 % 3 3.0 % 0 0.0 % 0 0.0 % 0 0.0 % * * * * * *
Reed ES 2 1.5 % 1 0.7 % 1 0.7 % 2 1.7 % 0 0.0 % 1 0.8 % * * * * * *
Red Rock ES 1 1.1 % 2 1.7 % 1 0.7 % 0 0.0 % 0 0.0 % 0 0.0 % * * * * * *
Ries ES 2 1.1 % 3 1.4 % 1 0.5 % 0 0.0 % 1 0.5 % 0 0.0 % * * * * * *
Rhodes ES 1 0.8 % 0 0.0 % 0 0.0 % 0 0.0 % 0 0.0 % 0 0.0 % * * * * * *
Reid ES 0 0.0 % 0 0.0 % 0 0.0 % 0 0.0 % 0 0.0 % 0 0.0 % * * * * * *
Peterson Behavior Jr/Sr HS
* * * * * * * * * * * * 0 0.0 % 1 14.3 % 2 18.2 %
Scherkenbach ES
0 0.0 % 1 0.9 % 1 0.9 % 0 0.0 % 0 0.0 % 2 1.7 % * * * * * *
Priest ES 0 0.0 % 4 2.9 % 4 3.0 % 0 0.0 % 1 0.7 % 0 0.0 % * * * * * *
Pittman ES 0 0.0 % 3 2.9 % 0 0.0 % 0 0.0 % 0 0.0 % 0 0.0 % * * * * * *
Piggott ES 1 1.6 % 1 1.5 % 3 3.1 % 1 1.1 % 0 0.0 % 0 0.0 % * * * * * *
Rundle ES 3 1.9 % 4 2.3 % 4 2.6 % 3 1.9 % 0 0.0 % 0 0.0 % * * * * * *
Rowe ES 2 1.6 % 2 1.9 % 1 1.0 % 0 0.0 % 2 2.3 % 2 2.5 % * * * * * *
Roundy ES 0 0.0 % 0 0.0 % 1 0.8 % 1 0.8 % 0 0.0 % 0 0.0 % * * * * * *
Saville MS * * * * * * * * * * * * 14 2.7 % 15 3.0 % 6 1.2 %
Sandy Valley Jr/Sr HS
* * * * * * * * * * * * 0 0.0 % 0 0.0 % 0 0.0 %
Sandy Valley ES
0 0.0 % 2 11.8 % 0 0.0 % 1 4.3 % 0 0.0 % 0 0.0 % * * * * * *
Rogers ES 1 0.8 % 0 0.0 % 1 0.6 % 1 0.8 % 0 0.0 % 0 0.0 % * * * * * *
Robison MS * * * * * * * * * * * * 6 1.7 % 16 4.7 % 6 1.7 %
Roberts ES 0 0.0 % 2 1.4 % 0 0.0 % 1 0.8 % 0 0.0 % 0 0.0 % * * * * * *
Ronnow ES 4 2.5 % 1 0.7 % 0 0.0 % 0 0.0 % 0 0.0 % 0 0.0 % * * * * * *
Ronzone ES 3 1.9 % 2 1.5 % 1 0.7 % 1 0.9 % 0 0.0 % 0 0.0 % * * * * * *
Rogich MS * * * * * * * * * * * * 4 0.7 % 7 1.2 % 5 0.8 %
Clark County Schools
'*' indicates the grade level was not present. Data reported as of count day.
Kindergarten 1st Grade 2nd Grade 3rd Grade 4th Grade 5th Grade 6th Grade 7th Grade 8th Grade
# % # % # % # % # % # % # % # % # %
Page 53 of 125
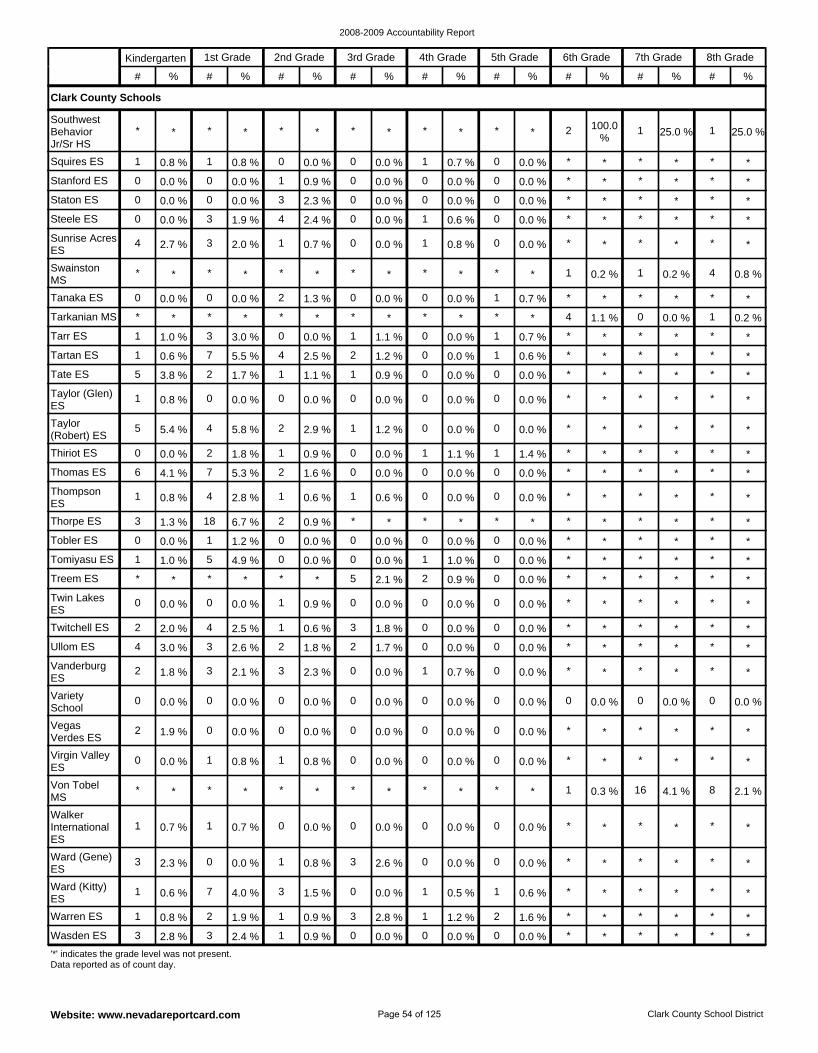
2008-2009 Accountability Report
Website: www.nevadareportcard.com Clark County School District
Ward (Gene) ES
3 2.3 % 0 0.0 % 1 0.8 % 3 2.6 % 0 0.0 % 0 0.0 % * * * * * *
Walker International ES
1 0.7 % 1 0.7 % 0 0.0 % 0 0.0 % 0 0.0 % 0 0.0 % * * * * * *
Von Tobel MS
* * * * * * * * * * * * 1 0.3 % 16 4.1 % 8 2.1 %
Wasden ES 3 2.8 % 3 2.4 % 1 0.9 % 0 0.0 % 0 0.0 % 0 0.0 % * * * * * *
Warren ES 1 0.8 % 2 1.9 % 1 0.9 % 3 2.8 % 1 1.2 % 2 1.6 % * * * * * *
Ward (Kitty) ES
1 0.6 % 7 4.0 % 3 1.5 % 0 0.0 % 1 0.5 % 1 0.6 % * * * * * *
Vanderburg ES
2 1.8 % 3 2.1 % 3 2.3 % 0 0.0 % 1 0.7 % 0 0.0 % * * * * * *
Twitchell ES 2 2.0 % 4 2.5 % 1 0.6 % 3 1.8 % 0 0.0 % 0 0.0 % * * * * * *
Virgin Valley ES
0 0.0 % 1 0.8 % 1 0.8 % 0 0.0 % 0 0.0 % 0 0.0 % * * * * * *
Vegas Verdes ES
2 1.9 % 0 0.0 % 0 0.0 % 0 0.0 % 0 0.0 % 0 0.0 % * * * * * *
Variety School
0 0.0 % 0 0.0 % 0 0.0 % 0 0.0 % 0 0.0 % 0 0.0 % 0 0.0 % 0 0.0 % 0 0.0 %
Swainston MS
* * * * * * * * * * * * 1 0.2 % 1 0.2 % 4 0.8 %
Sunrise Acres ES
4 2.7 % 3 2.0 % 1 0.7 % 0 0.0 % 1 0.8 % 0 0.0 % * * * * * *
Steele ES 0 0.0 % 3 1.9 % 4 2.4 % 0 0.0 % 1 0.6 % 0 0.0 % * * * * * *
Tarr ES 1 1.0 % 3 3.0 % 0 0.0 % 1 1.1 % 0 0.0 % 1 0.7 % * * * * * *
Tarkanian MS * * * * * * * * * * * * 4 1.1 % 0 0.0 % 1 0.2 %
Tanaka ES 0 0.0 % 0 0.0 % 2 1.3 % 0 0.0 % 0 0.0 % 1 0.7 % * * * * * *
Southwest Behavior Jr/Sr HS
* * * * * * * * * * * * 2 100.0 %
1 25.0 % 1 25.0 %
Ullom ES 4 3.0 % 3 2.6 % 2 1.8 % 2 1.7 % 0 0.0 % 0 0.0 % * * * * * *
Staton ES 0 0.0 % 0 0.0 % 3 2.3 % 0 0.0 % 0 0.0 % 0 0.0 % * * * * * *
Stanford ES 0 0.0 % 0 0.0 % 1 0.9 % 0 0.0 % 0 0.0 % 0 0.0 % * * * * * *
Squires ES 1 0.8 % 1 0.8 % 0 0.0 % 0 0.0 % 1 0.7 % 0 0.0 % * * * * * *
Tobler ES 0 0.0 % 1 1.2 % 0 0.0 % 0 0.0 % 0 0.0 % 0 0.0 % * * * * * *
Thorpe ES 3 1.3 % 18 6.7 % 2 0.9 % * * * * * * * * * * * *
Thompson ES
1 0.8 % 4 2.8 % 1 0.6 % 1 0.6 % 0 0.0 % 0 0.0 % * * * * * *
Twin Lakes ES
0 0.0 % 0 0.0 % 1 0.9 % 0 0.0 % 0 0.0 % 0 0.0 % * * * * * *
Treem ES * * * * * * 5 2.1 % 2 0.9 % 0 0.0 % * * * * * *
Tomiyasu ES 1 1.0 % 5 4.9 % 0 0.0 % 0 0.0 % 1 1.0 % 0 0.0 % * * * * * *
Taylor (Glen) ES
1 0.8 % 0 0.0 % 0 0.0 % 0 0.0 % 0 0.0 % 0 0.0 % * * * * * *
Tate ES 5 3.8 % 2 1.7 % 1 1.1 % 1 0.9 % 0 0.0 % 0 0.0 % * * * * * *
Tartan ES 1 0.6 % 7 5.5 % 4 2.5 % 2 1.2 % 0 0.0 % 1 0.6 % * * * * * *
Thiriot ES 0 0.0 % 2 1.8 % 1 0.9 % 0 0.0 % 1 1.1 % 1 1.4 % * * * * * *
Thomas ES 6 4.1 % 7 5.3 % 2 1.6 % 0 0.0 % 0 0.0 % 0 0.0 % * * * * * *
Taylor (Robert) ES
5 5.4 % 4 5.8 % 2 2.9 % 1 1.2 % 0 0.0 % 0 0.0 % * * * * * *
Clark County Schools
'*' indicates the grade level was not present. Data reported as of count day.
Kindergarten 1st Grade 2nd Grade 3rd Grade 4th Grade 5th Grade 6th Grade 7th Grade 8th Grade
# % # % # % # % # % # % # % # % # %
Page 54 of 125
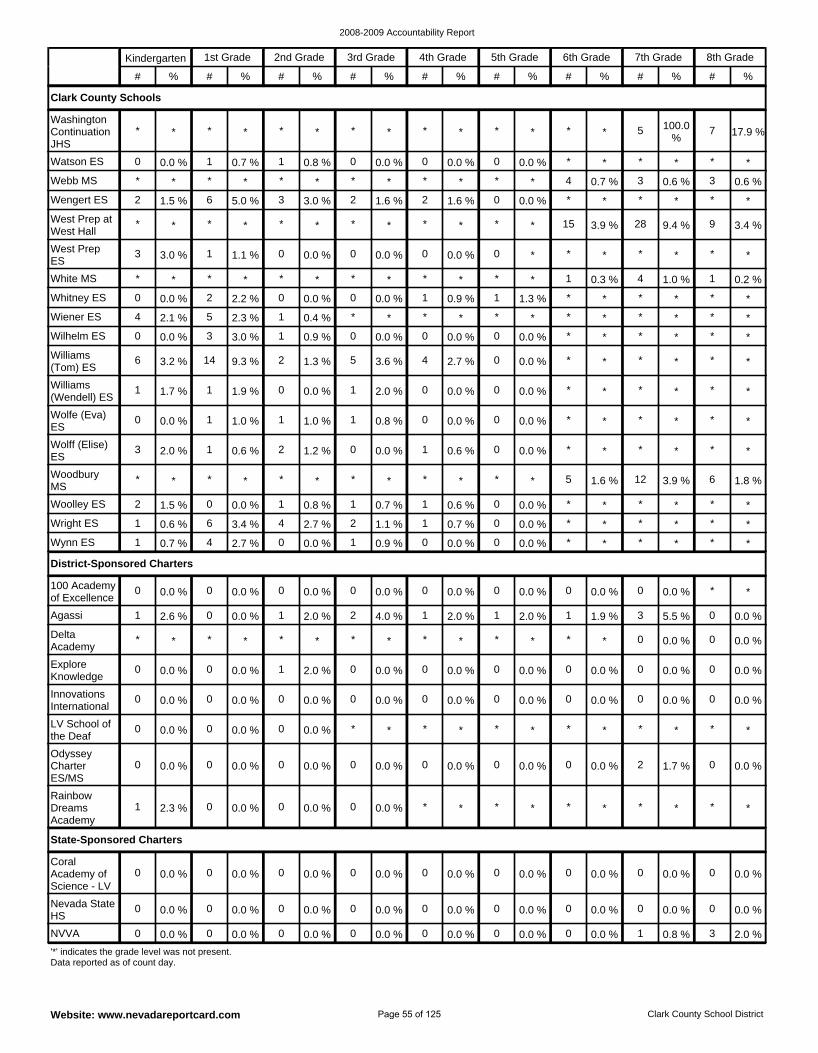
2008-2009 Accountability Report
Website: www.nevadareportcard.com Clark County School District
Nevada State HS
0 0.0 % 0 0.0 % 0 0.0 % 0 0.0 % 0 0.0 % 0 0.0 % 0 0.0 % 0 0.0 % 0 0.0 %
NVVA 0 0.0 % 0 0.0 % 0 0.0 % 0 0.0 % 0 0.0 % 0 0.0 % 0 0.0 % 1 0.8 % 3 2.0 %
Coral Academy of Science - LV
0 0.0 % 0 0.0 % 0 0.0 % 0 0.0 % 0 0.0 % 0 0.0 % 0 0.0 % 0 0.0 % 0 0.0 %
State-Sponsored Charters
100 Academy of Excellence
0 0.0 % 0 0.0 % 0 0.0 % 0 0.0 % 0 0.0 % 0 0.0 % 0 0.0 % 0 0.0 % * *
Explore Knowledge
0 0.0 % 0 0.0 % 1 2.0 % 0 0.0 % 0 0.0 % 0 0.0 % 0 0.0 % 0 0.0 % 0 0.0 %
Agassi 1 2.6 % 0 0.0 % 1 2.0 % 2 4.0 % 1 2.0 % 1 2.0 % 1 1.9 % 3 5.5 % 0 0.0 %
Innovations International
0 0.0 % 0 0.0 % 0 0.0 % 0 0.0 % 0 0.0 % 0 0.0 % 0 0.0 % 0 0.0 % 0 0.0 %
Rainbow Dreams Academy
1 2.3 % 0 0.0 % 0 0.0 % 0 0.0 % * * * * * * * * * *
Delta Academy
* * * * * * * * * * * * * * 0 0.0 % 0 0.0 %
LV School of the Deaf
0 0.0 % 0 0.0 % 0 0.0 % * * * * * * * * * * * *
Odyssey Charter ES/MS
0 0.0 % 0 0.0 % 0 0.0 % 0 0.0 % 0 0.0 % 0 0.0 % 0 0.0 % 2 1.7 % 0 0.0 %
District-Sponsored Charters
Woolley ES 2 1.5 % 0 0.0 % 1 0.8 % 1 0.7 % 1 0.6 % 0 0.0 % * * * * * *
Woodbury MS
* * * * * * * * * * * * 5 1.6 % 12 3.9 % 6 1.8 %
Wynn ES 1 0.7 % 4 2.7 % 0 0.0 % 1 0.9 % 0 0.0 % 0 0.0 % * * * * * *
Wright ES 1 0.6 % 6 3.4 % 4 2.7 % 2 1.1 % 1 0.7 % 0 0.0 % * * * * * *
West Prep at West Hall
* * * * * * * * * * * * 15 3.9 % 28 9.4 % 9 3.4 %
West Prep ES
3 3.0 % 1 1.1 % 0 0.0 % 0 0.0 % 0 0.0 % 0 * * * * * * *
White MS * * * * * * * * * * * * 1 0.3 % 4 1.0 % 1 0.2 %
Wengert ES 2 1.5 % 6 5.0 % 3 3.0 % 2 1.6 % 2 1.6 % 0 0.0 % * * * * * *
Washington Continuation JHS
* * * * * * * * * * * * * * 5 100.0 %
7 17.9 %
Watson ES 0 0.0 % 1 0.7 % 1 0.8 % 0 0.0 % 0 0.0 % 0 0.0 % * * * * * *
Webb MS * * * * * * * * * * * * 4 0.7 % 3 0.6 % 3 0.6 %
Williams (Wendell) ES
1 1.7 % 1 1.9 % 0 0.0 % 1 2.0 % 0 0.0 % 0 0.0 % * * * * * *
Wolfe (Eva) ES
0 0.0 % 1 1.0 % 1 1.0 % 1 0.8 % 0 0.0 % 0 0.0 % * * * * * *
Wolff (Elise) ES
3 2.0 % 1 0.6 % 2 1.2 % 0 0.0 % 1 0.6 % 0 0.0 % * * * * * *
Williams (Tom) ES
6 3.2 % 14 9.3 % 2 1.3 % 5 3.6 % 4 2.7 % 0 0.0 % * * * * * *
Whitney ES 0 0.0 % 2 2.2 % 0 0.0 % 0 0.0 % 1 0.9 % 1 1.3 % * * * * * *
Wiener ES 4 2.1 % 5 2.3 % 1 0.4 % * * * * * * * * * * * *
Wilhelm ES 0 0.0 % 3 3.0 % 1 0.9 % 0 0.0 % 0 0.0 % 0 0.0 % * * * * * *
Clark County Schools
'*' indicates the grade level was not present. Data reported as of count day.
Kindergarten 1st Grade 2nd Grade 3rd Grade 4th Grade 5th Grade 6th Grade 7th Grade 8th Grade
# % # % # % # % # % # % # % # % # %
Page 55 of 125
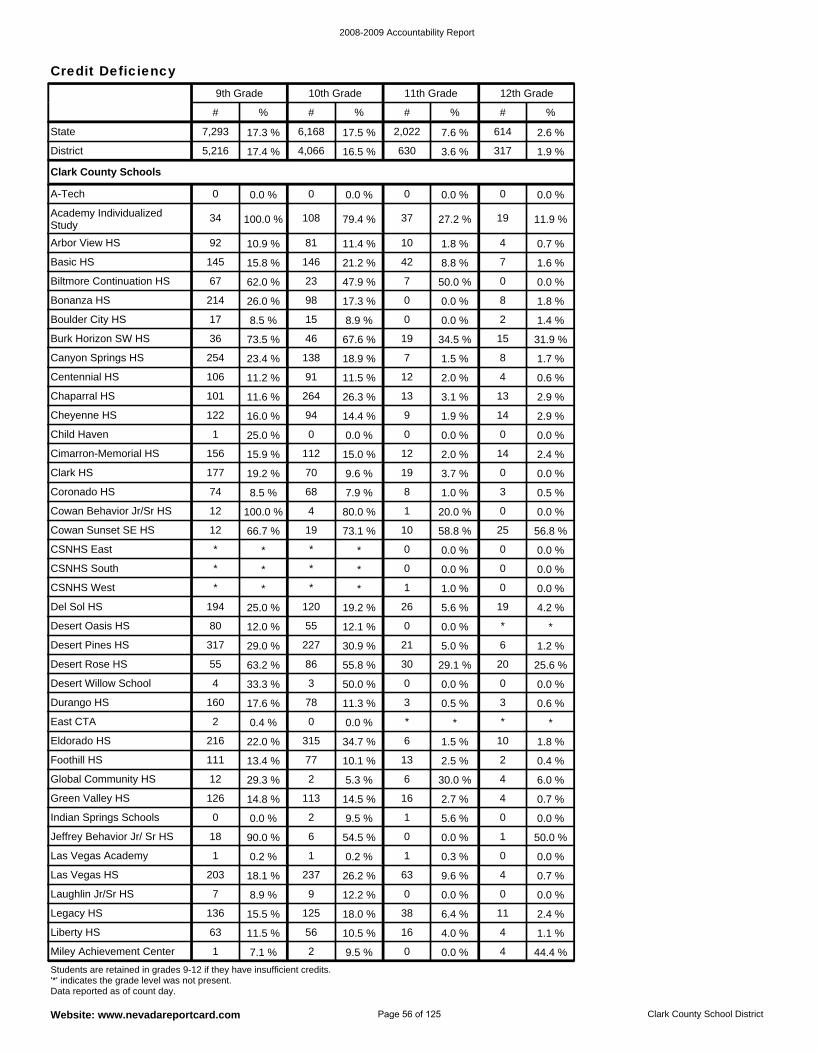
2008-2009 Accountability Report
Website: www.nevadareportcard.com Clark County School District
Foothill HS 111 13.4 % 77 10.1 % 13 2.5 % 2 0.4 %
Eldorado HS 216 22.0 % 315 34.7 % 6 1.5 % 10 1.8 %
East CTA 2 0.4 % 0 0.0 % * * * *
Indian Springs Schools 0 0.0 % 2 9.5 % 1 5.6 % 0 0.0 %
Green Valley HS 126 14.8 % 113 14.5 % 16 2.7 % 4 0.7 %
Global Community HS 12 29.3 % 2 5.3 % 6 30.0 % 4 6.0 %
Desert Pines HS 317 29.0 % 227 30.9 % 21 5.0 % 6 1.2 %
Desert Oasis HS 80 12.0 % 55 12.1 % 0 0.0 % * *
Durango HS 160 17.6 % 78 11.3 % 3 0.5 % 3 0.6 %
Desert Willow School 4 33.3 % 3 50.0 % 0 0.0 % 0 0.0 %
Desert Rose HS 55 63.2 % 86 55.8 % 30 29.1 % 20 25.6 %
Jeffrey Behavior Jr/ Sr HS 18 90.0 % 6 54.5 % 0 0.0 % 1 50.0 %
Laughlin Jr/Sr HS 7 8.9 % 9 12.2 % 0 0.0 % 0 0.0 %
Las Vegas HS 203 18.1 % 237 26.2 % 63 9.6 % 4 0.7 %
Las Vegas Academy 1 0.2 % 1 0.2 % 1 0.3 % 0 0.0 %
Miley Achievement Center 1 7.1 % 2 9.5 % 0 0.0 % 4 44.4 %
Liberty HS 63 11.5 % 56 10.5 % 16 4.0 % 4 1.1 %
Legacy HS 136 15.5 % 125 18.0 % 38 6.4 % 11 2.4 %
CSNHS West * * * * 1 1.0 % 0 0.0 %
Bonanza HS 214 26.0 % 98 17.3 % 0 0.0 % 8 1.8 %
Biltmore Continuation HS 67 62.0 % 23 47.9 % 7 50.0 % 0 0.0 %
Boulder City HS 17 8.5 % 15 8.9 % 0 0.0 % 2 1.4 %
Canyon Springs HS 254 23.4 % 138 18.9 % 7 1.5 % 8 1.7 %
Burk Horizon SW HS 36 73.5 % 46 67.6 % 19 34.5 % 15 31.9 %
Basic HS 145 15.8 % 146 21.2 % 42 8.8 % 7 1.6 %
Del Sol HS 194 25.0 % 120 19.2 % 26 5.6 % 19 4.2 %
A-Tech 0 0.0 % 0 0.0 % 0 0.0 % 0 0.0 %
Arbor View HS 92 10.9 % 81 11.4 % 10 1.8 % 4 0.7 %
Academy Individualized Study
34 100.0 % 108 79.4 % 37 27.2 % 19 11.9 %
Cowan Behavior Jr/Sr HS 12 100.0 % 4 80.0 % 1 20.0 % 0 0.0 %
Coronado HS 74 8.5 % 68 7.9 % 8 1.0 % 3 0.5 %
Cowan Sunset SE HS 12 66.7 % 19 73.1 % 10 58.8 % 25 56.8 %
CSNHS South * * * * 0 0.0 % 0 0.0 %
CSNHS East * * * * 0 0.0 % 0 0.0 %
Clark HS 177 19.2 % 70 9.6 % 19 3.7 % 0 0.0 %
Centennial HS 106 11.2 % 91 11.5 % 12 2.0 % 4 0.6 %
Chaparral HS 101 11.6 % 264 26.3 % 13 3.1 % 13 2.9 %
Cheyenne HS 122 16.0 % 94 14.4 % 9 1.9 % 14 2.9 %
Cimarron-Memorial HS 156 15.9 % 112 15.0 % 12 2.0 % 14 2.4 %
Child Haven 1 25.0 % 0 0.0 % 0 0.0 % 0 0.0 %
Clark County Schools
District 5,216 17.4 % 4,066 16.5 % 630 3.6 % 317 1.9 %
State 7,293 17.3 % 6,168 17.5 % 2,022 7.6 % 614 2.6 %
Students are retained in grades 9-12 if they have insufficient credits. '*' indicates the grade level was not present. Data reported as of count day.
9th Grade 10th Grade 11th Grade 12th Grade
# % # % # % # %
Credit Deficiency
Page 56 of 125
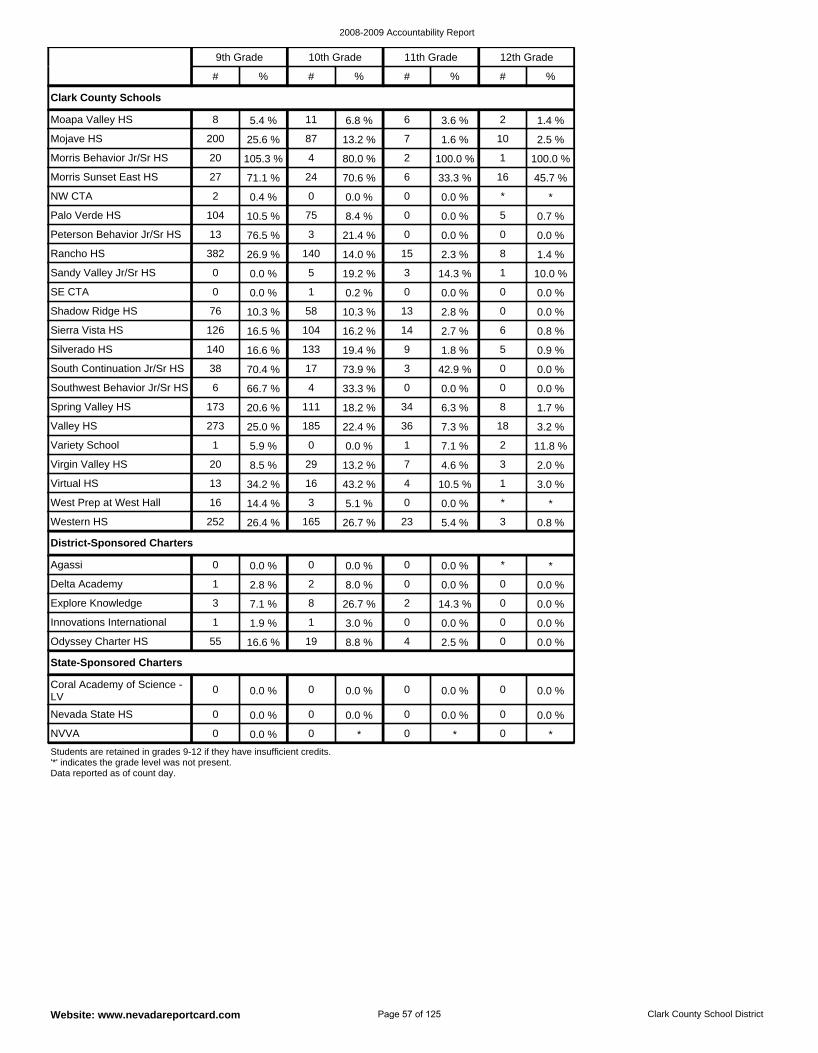
2008-2009 Accountability Report
Website: www.nevadareportcard.com Clark County School District
Nevada State HS 0 0.0 % 0 0.0 % 0 0.0 % 0 0.0 %
NVVA 0 0.0 % 0 * 0 * 0 *
Coral Academy of Science - LV
0 0.0 % 0 0.0 % 0 0.0 % 0 0.0 %
State-Sponsored Charters
Delta Academy 1 2.8 % 2 8.0 % 0 0.0 % 0 0.0 %
Agassi 0 0.0 % 0 0.0 % 0 0.0 % * *
Explore Knowledge 3 7.1 % 8 26.7 % 2 14.3 % 0 0.0 %
Odyssey Charter HS 55 16.6 % 19 8.8 % 4 2.5 % 0 0.0 %
Innovations International 1 1.9 % 1 3.0 % 0 0.0 % 0 0.0 %
District-Sponsored Charters
Valley HS 273 25.0 % 185 22.4 % 36 7.3 % 18 3.2 %
Variety School 1 5.9 % 0 0.0 % 1 7.1 % 2 11.8 %
Southwest Behavior Jr/Sr HS 6 66.7 % 4 33.3 % 0 0.0 % 0 0.0 %
Spring Valley HS 173 20.6 % 111 18.2 % 34 6.3 % 8 1.7 %
West Prep at West Hall 16 14.4 % 3 5.1 % 0 0.0 % * *
Western HS 252 26.4 % 165 26.7 % 23 5.4 % 3 0.8 %
Virgin Valley HS 20 8.5 % 29 13.2 % 7 4.6 % 3 2.0 %
Virtual HS 13 34.2 % 16 43.2 % 4 10.5 % 1 3.0 %
NW CTA 2 0.4 % 0 0.0 % 0 0.0 % * *
Palo Verde HS 104 10.5 % 75 8.4 % 0 0.0 % 5 0.7 %
Peterson Behavior Jr/Sr HS 13 76.5 % 3 21.4 % 0 0.0 % 0 0.0 %
Morris Sunset East HS 27 71.1 % 24 70.6 % 6 33.3 % 16 45.7 %
Moapa Valley HS 8 5.4 % 11 6.8 % 6 3.6 % 2 1.4 %
Mojave HS 200 25.6 % 87 13.2 % 7 1.6 % 10 2.5 %
Morris Behavior Jr/Sr HS 20 105.3 % 4 80.0 % 2 100.0 % 1 100.0 %
Sierra Vista HS 126 16.5 % 104 16.2 % 14 2.7 % 6 0.8 %
Silverado HS 140 16.6 % 133 19.4 % 9 1.8 % 5 0.9 %
South Continuation Jr/Sr HS 38 70.4 % 17 73.9 % 3 42.9 % 0 0.0 %
Shadow Ridge HS 76 10.3 % 58 10.3 % 13 2.8 % 0 0.0 %
Rancho HS 382 26.9 % 140 14.0 % 15 2.3 % 8 1.4 %
Sandy Valley Jr/Sr HS 0 0.0 % 5 19.2 % 3 14.3 % 1 10.0 %
SE CTA 0 0.0 % 1 0.2 % 0 0.0 % 0 0.0 %
Clark County Schools
Students are retained in grades 9-12 if they have insufficient credits. '*' indicates the grade level was not present. Data reported as of count day.
9th Grade 10th Grade 11th Grade 12th Grade
# % # % # % # %
Page 57 of 125
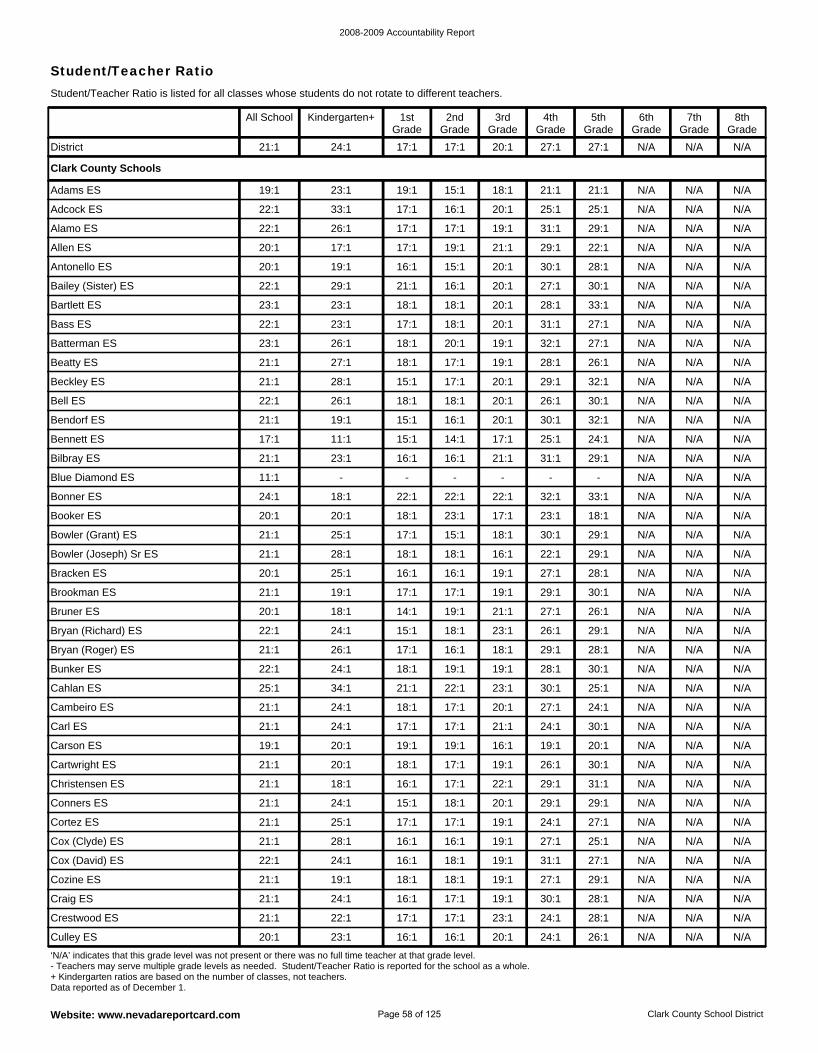
2008-2009 Accountability Report
Website: www.nevadareportcard.com Clark County School District
Student/Teacher RatioStudent/Teacher Ratio is listed for all classes whose students do not rotate to different teachers.
Conners ES 21:1 24:1 15:1 18:1 20:1 29:1 29:1 N/A N/A N/A
Christensen ES 21:1 18:1 16:1 17:1 22:1 29:1 31:1 N/A N/A N/A
Cartwright ES 21:1 20:1 18:1 17:1 19:1 26:1 30:1 N/A N/A N/A
Cox (David) ES 22:1 24:1 16:1 18:1 19:1 31:1 27:1 N/A N/A N/A
Cox (Clyde) ES 21:1 28:1 16:1 16:1 19:1 27:1 25:1 N/A N/A N/A
Cortez ES 21:1 25:1 17:1 17:1 19:1 24:1 27:1 N/A N/A N/A
Carson ES 19:1 20:1 19:1 19:1 16:1 19:1 20:1 N/A N/A N/A
Bunker ES 22:1 24:1 18:1 19:1 19:1 28:1 30:1 N/A N/A N/A
Bryan (Roger) ES 21:1 26:1 17:1 16:1 18:1 29:1 28:1 N/A N/A N/A
Carl ES 21:1 24:1 17:1 17:1 21:1 24:1 30:1 N/A N/A N/A
Cambeiro ES 21:1 24:1 18:1 17:1 20:1 27:1 24:1 N/A N/A N/A
Cahlan ES 25:1 34:1 21:1 22:1 23:1 30:1 25:1 N/A N/A N/A
Crestwood ES 21:1 22:1 17:1 17:1 23:1 24:1 28:1 N/A N/A N/A
Craig ES 21:1 24:1 16:1 17:1 19:1 30:1 28:1 N/A N/A N/A
Cozine ES 21:1 19:1 18:1 18:1 19:1 27:1 29:1 N/A N/A N/A
Culley ES 20:1 23:1 16:1 16:1 20:1 24:1 26:1 N/A N/A N/A
Bass ES 22:1 23:1 17:1 18:1 20:1 31:1 27:1 N/A N/A N/A
Bartlett ES 23:1 23:1 18:1 18:1 20:1 28:1 33:1 N/A N/A N/A
Bailey (Sister) ES 22:1 29:1 21:1 16:1 20:1 27:1 30:1 N/A N/A N/A
Beckley ES 21:1 28:1 15:1 17:1 20:1 29:1 32:1 N/A N/A N/A
Beatty ES 21:1 27:1 18:1 17:1 19:1 28:1 26:1 N/A N/A N/A
Batterman ES 23:1 26:1 18:1 20:1 19:1 32:1 27:1 N/A N/A N/A
Adcock ES 22:1 33:1 17:1 16:1 20:1 25:1 25:1 N/A N/A N/A
Adams ES 19:1 23:1 19:1 15:1 18:1 21:1 21:1 N/A N/A N/A
Bryan (Richard) ES 22:1 24:1 15:1 18:1 23:1 26:1 29:1 N/A N/A N/A
Antonello ES 20:1 19:1 16:1 15:1 20:1 30:1 28:1 N/A N/A N/A
Allen ES 20:1 17:1 17:1 19:1 21:1 29:1 22:1 N/A N/A N/A
Alamo ES 22:1 26:1 17:1 17:1 19:1 31:1 29:1 N/A N/A N/A
Bowler (Joseph) Sr ES 21:1 28:1 18:1 18:1 16:1 22:1 29:1 N/A N/A N/A
Bowler (Grant) ES 21:1 25:1 17:1 15:1 18:1 30:1 29:1 N/A N/A N/A
Booker ES 20:1 20:1 18:1 23:1 17:1 23:1 18:1 N/A N/A N/A
Bruner ES 20:1 18:1 14:1 19:1 21:1 27:1 26:1 N/A N/A N/A
Brookman ES 21:1 19:1 17:1 17:1 19:1 29:1 30:1 N/A N/A N/A
Bracken ES 20:1 25:1 16:1 16:1 19:1 27:1 28:1 N/A N/A N/A
Bennett ES 17:1 11:1 15:1 14:1 17:1 25:1 24:1 N/A N/A N/A
Bendorf ES 21:1 19:1 15:1 16:1 20:1 30:1 32:1 N/A N/A N/A
Bell ES 22:1 26:1 18:1 18:1 20:1 26:1 30:1 N/A N/A N/A
Bonner ES 24:1 18:1 22:1 22:1 22:1 32:1 33:1 N/A N/A N/A
Blue Diamond ES 11:1 - - - - - - N/A N/A N/A
Bilbray ES 21:1 23:1 16:1 16:1 21:1 31:1 29:1 N/A N/A N/A
Clark County Schools
District 21:1 24:1 17:1 17:1 20:1 27:1 27:1 N/A N/A N/A
‘N/A’ indicates that this grade level was not present or there was no full time teacher at that grade level. - Teachers may serve multiple grade levels as needed. Student/Teacher Ratio is reported for the school as a whole. + Kindergarten ratios are based on the number of classes, not teachers. Data reported as of December 1.
All School Kindergarten+ 1st Grade
2nd Grade
3rd Grade
4th Grade
5th Grade
6th Grade
7th Grade
8th Grade
Page 58 of 125
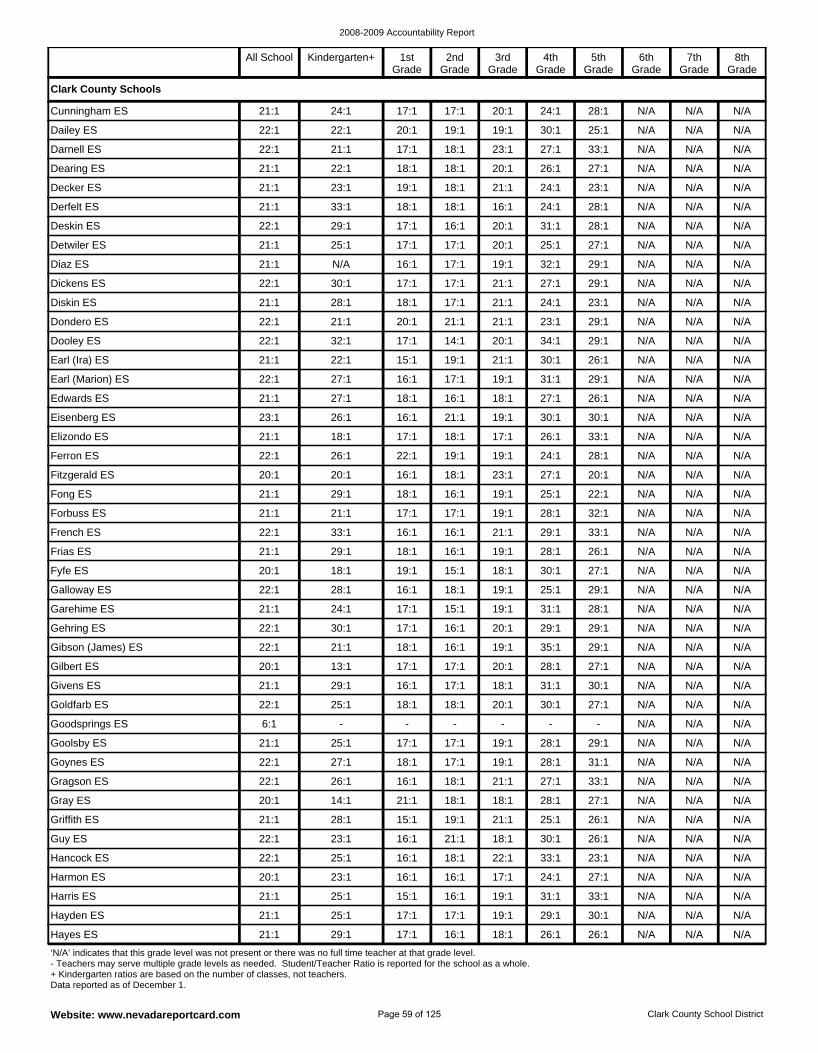
2008-2009 Accountability Report
Website: www.nevadareportcard.com Clark County School District
Goynes ES 22:1 27:1 18:1 17:1 19:1 28:1 31:1 N/A N/A N/A
Goolsby ES 21:1 25:1 17:1 17:1 19:1 28:1 29:1 N/A N/A N/A
Goodsprings ES 6:1 - - - - - - N/A N/A N/A
Griffith ES 21:1 28:1 15:1 19:1 21:1 25:1 26:1 N/A N/A N/A
Gray ES 20:1 14:1 21:1 18:1 18:1 28:1 27:1 N/A N/A N/A
Gragson ES 22:1 26:1 16:1 18:1 21:1 27:1 33:1 N/A N/A N/A
Goldfarb ES 22:1 25:1 18:1 18:1 20:1 30:1 27:1 N/A N/A N/A
Gehring ES 22:1 30:1 17:1 16:1 20:1 29:1 29:1 N/A N/A N/A
Garehime ES 21:1 24:1 17:1 15:1 19:1 31:1 28:1 N/A N/A N/A
Givens ES 21:1 29:1 16:1 17:1 18:1 31:1 30:1 N/A N/A N/A
Gilbert ES 20:1 13:1 17:1 17:1 20:1 28:1 27:1 N/A N/A N/A
Gibson (James) ES 22:1 21:1 18:1 16:1 19:1 35:1 29:1 N/A N/A N/A
Harmon ES 20:1 23:1 16:1 16:1 17:1 24:1 27:1 N/A N/A N/A
Hancock ES 22:1 25:1 16:1 18:1 22:1 33:1 23:1 N/A N/A N/A
Guy ES 22:1 23:1 16:1 21:1 18:1 30:1 26:1 N/A N/A N/A
Hayes ES 21:1 29:1 17:1 16:1 18:1 26:1 26:1 N/A N/A N/A
Hayden ES 21:1 25:1 17:1 17:1 19:1 29:1 30:1 N/A N/A N/A
Harris ES 21:1 25:1 15:1 16:1 19:1 31:1 33:1 N/A N/A N/A
Fyfe ES 20:1 18:1 19:1 15:1 18:1 30:1 27:1 N/A N/A N/A
Detwiler ES 21:1 25:1 17:1 17:1 20:1 25:1 27:1 N/A N/A N/A
Deskin ES 22:1 29:1 17:1 16:1 20:1 31:1 28:1 N/A N/A N/A
Derfelt ES 21:1 33:1 18:1 18:1 16:1 24:1 28:1 N/A N/A N/A
Diskin ES 21:1 28:1 18:1 17:1 21:1 24:1 23:1 N/A N/A N/A
Dickens ES 22:1 30:1 17:1 17:1 21:1 27:1 29:1 N/A N/A N/A
Diaz ES 21:1 N/A 16:1 17:1 19:1 32:1 29:1 N/A N/A N/A
Dailey ES 22:1 22:1 20:1 19:1 19:1 30:1 25:1 N/A N/A N/A
Cunningham ES 21:1 24:1 17:1 17:1 20:1 24:1 28:1 N/A N/A N/A
Galloway ES 22:1 28:1 16:1 18:1 19:1 25:1 29:1 N/A N/A N/A
Decker ES 21:1 23:1 19:1 18:1 21:1 24:1 23:1 N/A N/A N/A
Dearing ES 21:1 22:1 18:1 18:1 20:1 26:1 27:1 N/A N/A N/A
Darnell ES 22:1 21:1 17:1 18:1 23:1 27:1 33:1 N/A N/A N/A
Dondero ES 22:1 21:1 20:1 21:1 21:1 23:1 29:1 N/A N/A N/A
Fong ES 21:1 29:1 18:1 16:1 19:1 25:1 22:1 N/A N/A N/A
Fitzgerald ES 20:1 20:1 16:1 18:1 23:1 27:1 20:1 N/A N/A N/A
Ferron ES 22:1 26:1 22:1 19:1 19:1 24:1 28:1 N/A N/A N/A
Frias ES 21:1 29:1 18:1 16:1 19:1 28:1 26:1 N/A N/A N/A
French ES 22:1 33:1 16:1 16:1 21:1 29:1 33:1 N/A N/A N/A
Forbuss ES 21:1 21:1 17:1 17:1 19:1 28:1 32:1 N/A N/A N/A
Earl (Marion) ES 22:1 27:1 16:1 17:1 19:1 31:1 29:1 N/A N/A N/A
Earl (Ira) ES 21:1 22:1 15:1 19:1 21:1 30:1 26:1 N/A N/A N/A
Dooley ES 22:1 32:1 17:1 14:1 20:1 34:1 29:1 N/A N/A N/A
Elizondo ES 21:1 18:1 17:1 18:1 17:1 26:1 33:1 N/A N/A N/A
Eisenberg ES 23:1 26:1 16:1 21:1 19:1 30:1 30:1 N/A N/A N/A
Edwards ES 21:1 27:1 18:1 16:1 18:1 27:1 26:1 N/A N/A N/A
Clark County Schools
‘N/A’ indicates that this grade level was not present or there was no full time teacher at that grade level. - Teachers may serve multiple grade levels as needed. Student/Teacher Ratio is reported for the school as a whole. + Kindergarten ratios are based on the number of classes, not teachers. Data reported as of December 1.
All School Kindergarten+ 1st Grade
2nd Grade
3rd Grade
4th Grade
5th Grade
6th Grade
7th Grade
8th Grade
Page 59 of 125
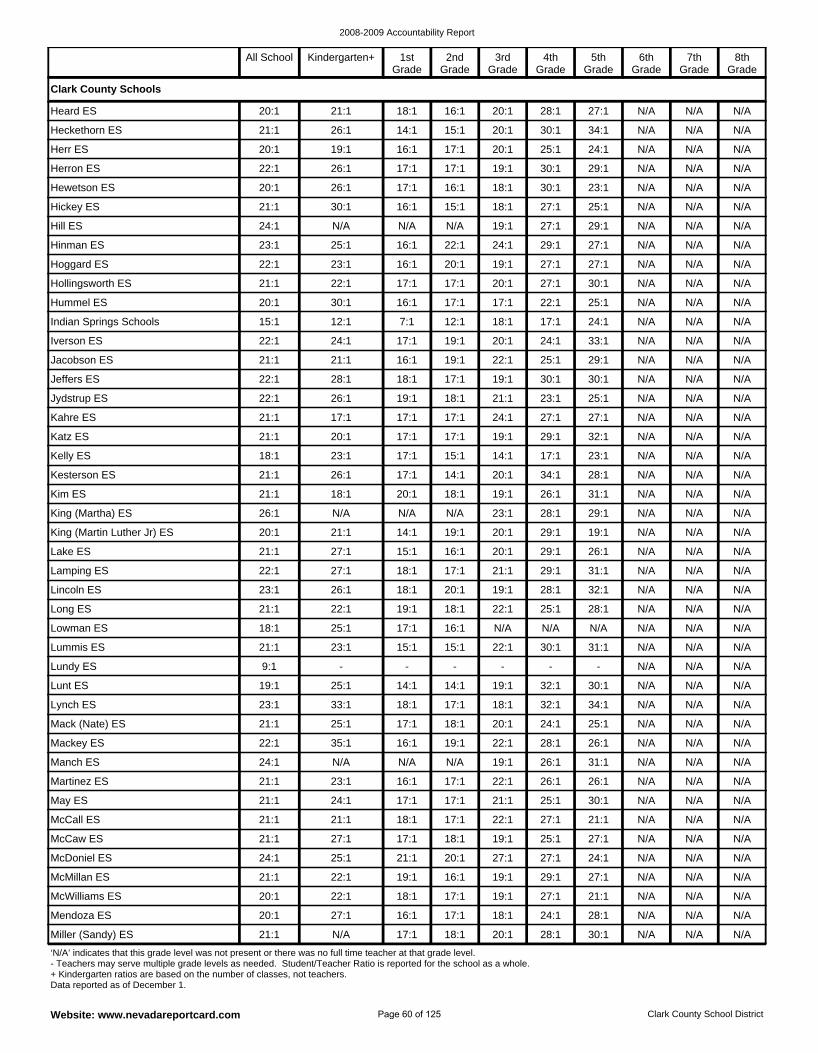
2008-2009 Accountability Report
Website: www.nevadareportcard.com Clark County School District
Manch ES 24:1 N/A N/A N/A 19:1 26:1 31:1 N/A N/A N/A
Mackey ES 22:1 35:1 16:1 19:1 22:1 28:1 26:1 N/A N/A N/A
Mack (Nate) ES 21:1 25:1 17:1 18:1 20:1 24:1 25:1 N/A N/A N/A
McCall ES 21:1 21:1 18:1 17:1 22:1 27:1 21:1 N/A N/A N/A
May ES 21:1 24:1 17:1 17:1 21:1 25:1 30:1 N/A N/A N/A
Martinez ES 21:1 23:1 16:1 17:1 22:1 26:1 26:1 N/A N/A N/A
Lynch ES 23:1 33:1 18:1 17:1 18:1 32:1 34:1 N/A N/A N/A
Lowman ES 18:1 25:1 17:1 16:1 N/A N/A N/A N/A N/A N/A
Long ES 21:1 22:1 19:1 18:1 22:1 25:1 28:1 N/A N/A N/A
Lunt ES 19:1 25:1 14:1 14:1 19:1 32:1 30:1 N/A N/A N/A
Lundy ES 9:1 - - - - - - N/A N/A N/A
Lummis ES 21:1 23:1 15:1 15:1 22:1 30:1 31:1 N/A N/A N/A
McMillan ES 21:1 22:1 19:1 16:1 19:1 29:1 27:1 N/A N/A N/A
McDoniel ES 24:1 25:1 21:1 20:1 27:1 27:1 24:1 N/A N/A N/A
McCaw ES 21:1 27:1 17:1 18:1 19:1 25:1 27:1 N/A N/A N/A
Miller (Sandy) ES 21:1 N/A 17:1 18:1 20:1 28:1 30:1 N/A N/A N/A
Mendoza ES 20:1 27:1 16:1 17:1 18:1 24:1 28:1 N/A N/A N/A
McWilliams ES 20:1 22:1 18:1 17:1 19:1 27:1 21:1 N/A N/A N/A
Lamping ES 22:1 27:1 18:1 17:1 21:1 29:1 31:1 N/A N/A N/A
Hinman ES 23:1 25:1 16:1 22:1 24:1 29:1 27:1 N/A N/A N/A
Hill ES 24:1 N/A N/A N/A 19:1 27:1 29:1 N/A N/A N/A
Hickey ES 21:1 30:1 16:1 15:1 18:1 27:1 25:1 N/A N/A N/A
Hummel ES 20:1 30:1 16:1 17:1 17:1 22:1 25:1 N/A N/A N/A
Hollingsworth ES 21:1 22:1 17:1 17:1 20:1 27:1 30:1 N/A N/A N/A
Hoggard ES 22:1 23:1 16:1 20:1 19:1 27:1 27:1 N/A N/A N/A
Heckethorn ES 21:1 26:1 14:1 15:1 20:1 30:1 34:1 N/A N/A N/A
Heard ES 20:1 21:1 18:1 16:1 20:1 28:1 27:1 N/A N/A N/A
Lincoln ES 23:1 26:1 18:1 20:1 19:1 28:1 32:1 N/A N/A N/A
Hewetson ES 20:1 26:1 17:1 16:1 18:1 30:1 23:1 N/A N/A N/A
Herron ES 22:1 26:1 17:1 17:1 19:1 30:1 29:1 N/A N/A N/A
Herr ES 20:1 19:1 16:1 17:1 20:1 25:1 24:1 N/A N/A N/A
Indian Springs Schools 15:1 12:1 7:1 12:1 18:1 17:1 24:1 N/A N/A N/A
Kim ES 21:1 18:1 20:1 18:1 19:1 26:1 31:1 N/A N/A N/A
Kesterson ES 21:1 26:1 17:1 14:1 20:1 34:1 28:1 N/A N/A N/A
Kelly ES 18:1 23:1 17:1 15:1 14:1 17:1 23:1 N/A N/A N/A
Lake ES 21:1 27:1 15:1 16:1 20:1 29:1 26:1 N/A N/A N/A
King (Martin Luther Jr) ES 20:1 21:1 14:1 19:1 20:1 29:1 19:1 N/A N/A N/A
King (Martha) ES 26:1 N/A N/A N/A 23:1 28:1 29:1 N/A N/A N/A
Jeffers ES 22:1 28:1 18:1 17:1 19:1 30:1 30:1 N/A N/A N/A
Jacobson ES 21:1 21:1 16:1 19:1 22:1 25:1 29:1 N/A N/A N/A
Iverson ES 22:1 24:1 17:1 19:1 20:1 24:1 33:1 N/A N/A N/A
Katz ES 21:1 20:1 17:1 17:1 19:1 29:1 32:1 N/A N/A N/A
Kahre ES 21:1 17:1 17:1 17:1 24:1 27:1 27:1 N/A N/A N/A
Jydstrup ES 22:1 26:1 19:1 18:1 21:1 23:1 25:1 N/A N/A N/A
Clark County Schools
‘N/A’ indicates that this grade level was not present or there was no full time teacher at that grade level. - Teachers may serve multiple grade levels as needed. Student/Teacher Ratio is reported for the school as a whole. + Kindergarten ratios are based on the number of classes, not teachers. Data reported as of December 1.
All School Kindergarten+ 1st Grade
2nd Grade
3rd Grade
4th Grade
5th Grade
6th Grade
7th Grade
8th Grade
Page 60 of 125
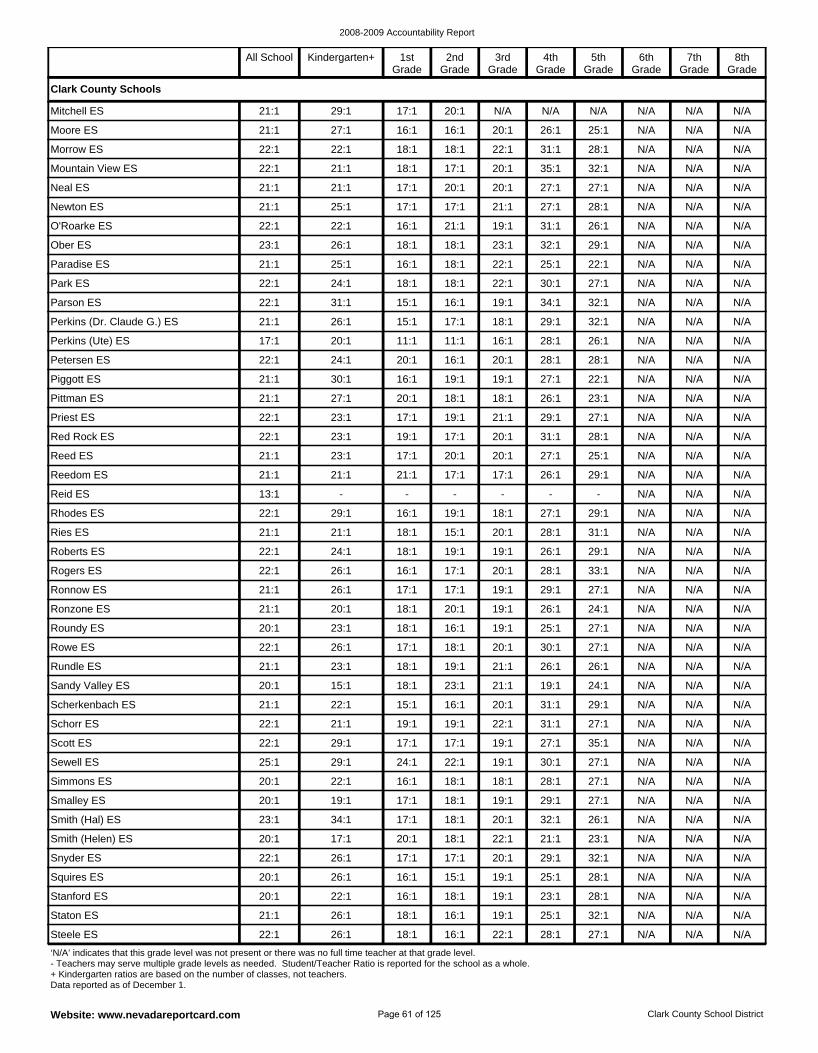
2008-2009 Accountability Report
Website: www.nevadareportcard.com Clark County School District
Sewell ES 25:1 29:1 24:1 22:1 19:1 30:1 27:1 N/A N/A N/A
Scott ES 22:1 29:1 17:1 17:1 19:1 27:1 35:1 N/A N/A N/A
Schorr ES 22:1 21:1 19:1 19:1 22:1 31:1 27:1 N/A N/A N/A
Smith (Hal) ES 23:1 34:1 17:1 18:1 20:1 32:1 26:1 N/A N/A N/A
Smalley ES 20:1 19:1 17:1 18:1 19:1 29:1 27:1 N/A N/A N/A
Simmons ES 20:1 22:1 16:1 18:1 18:1 28:1 27:1 N/A N/A N/A
Scherkenbach ES 21:1 22:1 15:1 16:1 20:1 31:1 29:1 N/A N/A N/A
Roundy ES 20:1 23:1 18:1 16:1 19:1 25:1 27:1 N/A N/A N/A
Ronzone ES 21:1 20:1 18:1 20:1 19:1 26:1 24:1 N/A N/A N/A
Sandy Valley ES 20:1 15:1 18:1 23:1 21:1 19:1 24:1 N/A N/A N/A
Rundle ES 21:1 23:1 18:1 19:1 21:1 26:1 26:1 N/A N/A N/A
Rowe ES 22:1 26:1 17:1 18:1 20:1 30:1 27:1 N/A N/A N/A
Squires ES 20:1 26:1 16:1 15:1 19:1 25:1 28:1 N/A N/A N/A
Snyder ES 22:1 26:1 17:1 17:1 20:1 29:1 32:1 N/A N/A N/A
Smith (Helen) ES 20:1 17:1 20:1 18:1 22:1 21:1 23:1 N/A N/A N/A
Steele ES 22:1 26:1 18:1 16:1 22:1 28:1 27:1 N/A N/A N/A
Staton ES 21:1 26:1 18:1 16:1 19:1 25:1 32:1 N/A N/A N/A
Stanford ES 20:1 22:1 16:1 18:1 19:1 23:1 28:1 N/A N/A N/A
Rogers ES 22:1 26:1 16:1 17:1 20:1 28:1 33:1 N/A N/A N/A
Ober ES 23:1 26:1 18:1 18:1 23:1 32:1 29:1 N/A N/A N/A
O'Roarke ES 22:1 22:1 16:1 21:1 19:1 31:1 26:1 N/A N/A N/A
Newton ES 21:1 25:1 17:1 17:1 21:1 27:1 28:1 N/A N/A N/A
Parson ES 22:1 31:1 15:1 16:1 19:1 34:1 32:1 N/A N/A N/A
Park ES 22:1 24:1 18:1 18:1 22:1 30:1 27:1 N/A N/A N/A
Paradise ES 21:1 25:1 16:1 18:1 22:1 25:1 22:1 N/A N/A N/A
Moore ES 21:1 27:1 16:1 16:1 20:1 26:1 25:1 N/A N/A N/A
Mitchell ES 21:1 29:1 17:1 20:1 N/A N/A N/A N/A N/A N/A
Ronnow ES 21:1 26:1 17:1 17:1 19:1 29:1 27:1 N/A N/A N/A
Neal ES 21:1 21:1 17:1 20:1 20:1 27:1 27:1 N/A N/A N/A
Mountain View ES 22:1 21:1 18:1 17:1 20:1 35:1 32:1 N/A N/A N/A
Morrow ES 22:1 22:1 18:1 18:1 22:1 31:1 28:1 N/A N/A N/A
Perkins (Dr. Claude G.) ES 21:1 26:1 15:1 17:1 18:1 29:1 32:1 N/A N/A N/A
Reid ES 13:1 - - - - - - N/A N/A N/A
Reedom ES 21:1 21:1 21:1 17:1 17:1 26:1 29:1 N/A N/A N/A
Reed ES 21:1 23:1 17:1 20:1 20:1 27:1 25:1 N/A N/A N/A
Roberts ES 22:1 24:1 18:1 19:1 19:1 26:1 29:1 N/A N/A N/A
Ries ES 21:1 21:1 18:1 15:1 20:1 28:1 31:1 N/A N/A N/A
Rhodes ES 22:1 29:1 16:1 19:1 18:1 27:1 29:1 N/A N/A N/A
Piggott ES 21:1 30:1 16:1 19:1 19:1 27:1 22:1 N/A N/A N/A
Petersen ES 22:1 24:1 20:1 16:1 20:1 28:1 28:1 N/A N/A N/A
Perkins (Ute) ES 17:1 20:1 11:1 11:1 16:1 28:1 26:1 N/A N/A N/A
Red Rock ES 22:1 23:1 19:1 17:1 20:1 31:1 28:1 N/A N/A N/A
Priest ES 22:1 23:1 17:1 19:1 21:1 29:1 27:1 N/A N/A N/A
Pittman ES 21:1 27:1 20:1 18:1 18:1 26:1 23:1 N/A N/A N/A
Clark County Schools
‘N/A’ indicates that this grade level was not present or there was no full time teacher at that grade level. - Teachers may serve multiple grade levels as needed. Student/Teacher Ratio is reported for the school as a whole. + Kindergarten ratios are based on the number of classes, not teachers. Data reported as of December 1.
All School Kindergarten+ 1st Grade
2nd Grade
3rd Grade
4th Grade
5th Grade
6th Grade
7th Grade
8th Grade
Page 61 of 125

2008-2009 Accountability Report
Website: www.nevadareportcard.com Clark County School District
Innovations International 26:1 27:1 26:1 21:1 28:1 29:1 28:1 N/A N/A N/A
Explore Knowledge 10:1 14:1 11:1 7:1 9:1 9:1 9:1 N/A N/A N/A
Agassi 24:1 20:1 25:1 25:1 25:1 25:1 25:1 N/A N/A N/A
100 Academy of Excellence 25:1 24:1 27:1 24:1 22:1 34:1 27:1 21:1 N/A N/A
LV School of the Deaf 2:1 - - - - - - N/A N/A N/A
District-Sponsored Charters
West Prep ES 20:1 24:1 18:1 19:1 21:1 20:1 N/A N/A N/A N/A
Wiener ES 18:1 23:1 16:1 18:1 N/A N/A N/A N/A N/A N/A
Whitney ES 21:1 26:1 16:1 18:1 21:1 28:1 26:1 N/A N/A N/A
Wengert ES 20:1 17:1 18:1 16:1 17:1 23:1 33:1 N/A N/A N/A
Wright ES 20:1 20:1 16:1 16:1 20:1 28:1 29:1 N/A N/A N/A
Wasden ES 21:1 23:1 17:1 18:1 18:1 25:1 29:1 N/A N/A N/A
Watson ES 19:1 19:1 15:1 16:1 20:1 28:1 25:1 N/A N/A N/A
Wilhelm ES 20:1 17:1 16:1 16:1 19:1 30:1 27:1 N/A N/A N/A
Woolley ES 22:1 30:1 17:1 16:1 19:1 26:1 30:1 N/A N/A N/A
Wynn ES 21:1 24:1 18:1 18:1 18:1 24:1 28:1 N/A N/A N/A
Warren ES 24:1 33:1 17:1 27:1 26:1 18:1 24:1 N/A N/A N/A
Wolff (Elise) ES 23:1 38:1 16:1 17:1 20:1 30:1 30:1 N/A N/A N/A
Williams (Tom) ES 21:1 27:1 16:1 16:1 20:1 29:1 25:1 N/A N/A N/A
Williams (Wendell) ES 20:1 30:1 14:1 20:1 17:1 20:1 24:1 N/A N/A N/A
Wolfe (Eva) ES 21:1 20:1 18:1 17:1 17:1 29:1 27:1 N/A N/A N/A
Thiriot ES 21:1 24:1 19:1 17:1 19:1 30:1 21:1 N/A N/A N/A
Taylor (Robert) ES 21:1 25:1 18:1 17:1 21:1 20:1 25:1 N/A N/A N/A
Thomas ES 21:1 30:1 16:1 16:1 21:1 27:1 27:1 N/A N/A N/A
Thorpe ES 19:1 24:1 18:1 16:1 N/A N/A N/A N/A N/A N/A
Thompson ES 21:1 22:1 17:1 16:1 19:1 31:1 33:1 N/A N/A N/A
Taylor (Glen) ES 21:1 23:1 18:1 17:1 18:1 27:1 28:1 N/A N/A N/A
Tanaka ES 21:1 25:1 16:1 20:1 21:1 27:1 23:1 N/A N/A N/A
Sunrise Acres ES 21:1 24:1 17:1 17:1 22:1 23:1 29:1 N/A N/A N/A
Tarr ES 21:1 19:1 17:1 18:1 19:1 32:1 27:1 N/A N/A N/A
Tate ES 21:1 22:1 17:1 18:1 22:1 26:1 24:1 N/A N/A N/A
Tartan ES 20:1 20:1 15:1 15:1 19:1 27:1 26:1 N/A N/A N/A
Tobler ES 21:1 18:1 18:1 19:1 17:1 29:1 31:1 N/A N/A N/A
Virgin Valley ES 23:1 30:1 17:1 18:1 19:1 31:1 34:1 N/A N/A N/A
Vegas Verdes ES 22:1 27:1 17:1 19:1 21:1 28:1 24:1 N/A N/A N/A
Walker International ES 21:1 24:1 18:1 16:1 22:1 28:1 24:1 N/A N/A N/A
Ward (Kitty) ES 13:1 25:1 10:1 10:1 11:1 16:1 18:1 N/A N/A N/A
Ward (Gene) ES 20:1 26:1 17:1 17:1 19:1 23:1 22:1 N/A N/A N/A
Vanderburg ES 23:1 22:1 18:1 19:1 21:1 32:1 35:1 N/A N/A N/A
Treem ES 25:1 N/A N/A N/A 18:1 30:1 31:1 N/A N/A N/A
Tomiyasu ES 20:1 21:1 14:1 16:1 21:1 26:1 26:1 N/A N/A N/A
Twin Lakes ES 19:1 28:1 14:1 15:1 17:1 22:1 25:1 N/A N/A N/A
Ullom ES 20:1 22:1 17:1 18:1 21:1 21:1 24:1 N/A N/A N/A
Twitchell ES 22:1 22:1 17:1 18:1 23:1 31:1 32:1 N/A N/A N/A
Clark County Schools
‘N/A’ indicates that this grade level was not present or there was no full time teacher at that grade level. - Teachers may serve multiple grade levels as needed. Student/Teacher Ratio is reported for the school as a whole. + Kindergarten ratios are based on the number of classes, not teachers. Data reported as of December 1.
All School Kindergarten+ 1st Grade
2nd Grade
3rd Grade
4th Grade
5th Grade
6th Grade
7th Grade
8th Grade
Page 62 of 125
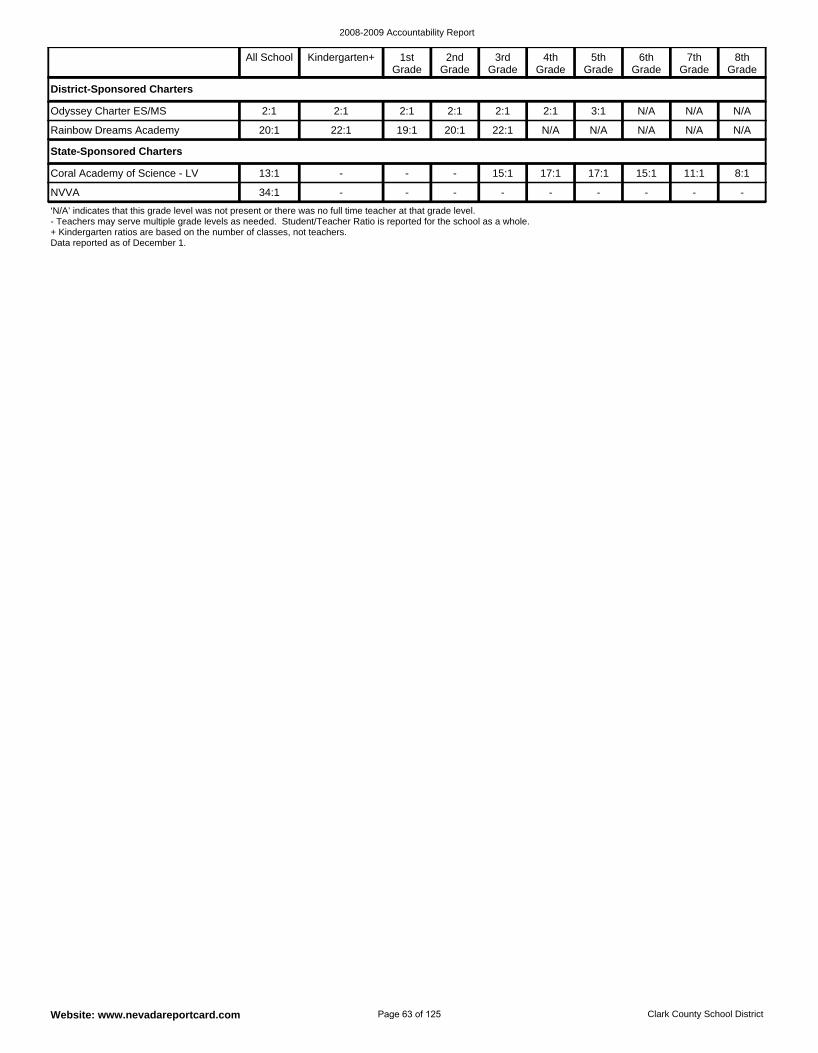
2008-2009 Accountability Report
Website: www.nevadareportcard.com Clark County School District
NVVA 34:1 - - - - - - - - -
Coral Academy of Science - LV 13:1 - - - 15:1 17:1 17:1 15:1 11:1 8:1
State-Sponsored Charters
Rainbow Dreams Academy 20:1 22:1 19:1 20:1 22:1 N/A N/A N/A N/A N/A
Odyssey Charter ES/MS 2:1 2:1 2:1 2:1 2:1 2:1 3:1 N/A N/A N/A
District-Sponsored Charters
‘N/A’ indicates that this grade level was not present or there was no full time teacher at that grade level. - Teachers may serve multiple grade levels as needed. Student/Teacher Ratio is reported for the school as a whole. + Kindergarten ratios are based on the number of classes, not teachers. Data reported as of December 1.
All School Kindergarten+ 1st Grade
2nd Grade
3rd Grade
4th Grade
5th Grade
6th Grade
7th Grade
8th Grade
Page 63 of 125
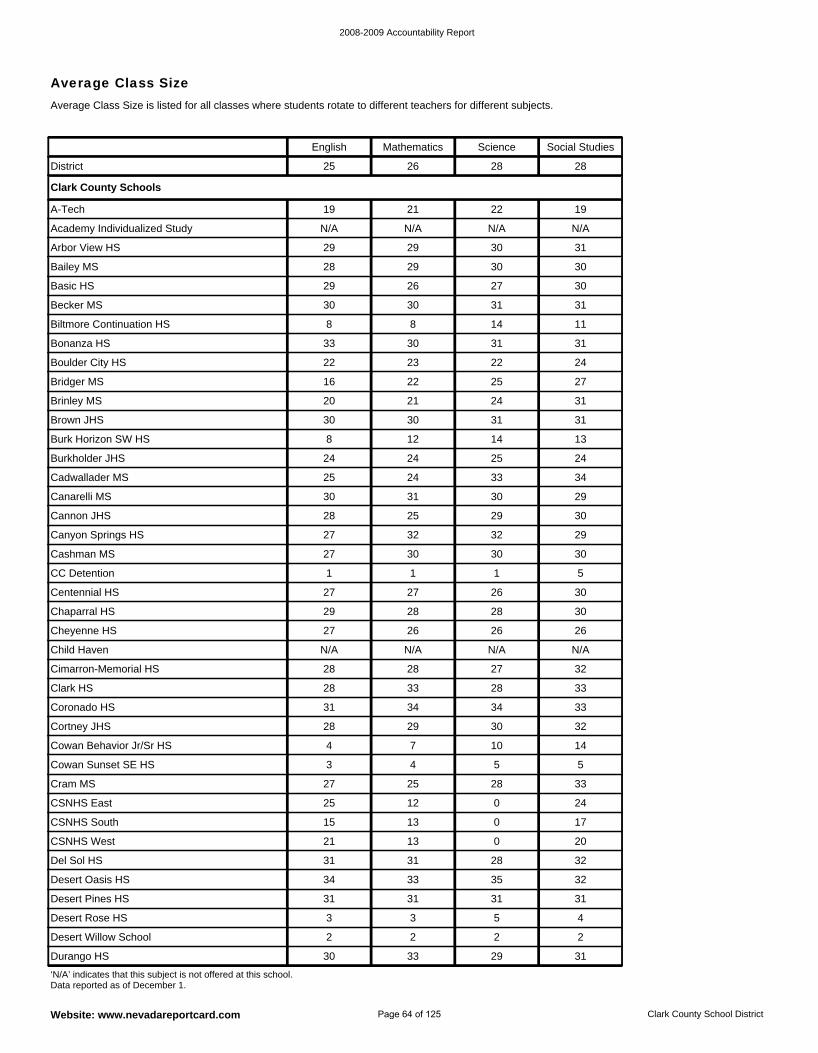
2008-2009 Accountability Report
Website: www.nevadareportcard.com Clark County School District
Average Class Size
CSNHS South 15 13 0 17
CSNHS East 25 12 0 24
Cram MS 27 25 28 33
Desert Oasis HS 34 33 35 32
Del Sol HS 31 31 28 32
CSNHS West 21 13 0 20
Cowan Sunset SE HS 3 4 5 5
Clark HS 28 33 28 33
Cimarron-Memorial HS 28 28 27 32
Cowan Behavior Jr/Sr HS 4 7 10 14
Cortney JHS 28 29 30 32
Coronado HS 31 34 34 33
Desert Willow School 2 2 2 2
Desert Rose HS 3 3 5 4
Desert Pines HS 31 31 31 31
Durango HS 30 33 29 31
Bonanza HS 33 30 31 31
Biltmore Continuation HS 8 8 14 11
Becker MS 30 30 31 31
Brinley MS 20 21 24 31
Bridger MS 16 22 25 27
Boulder City HS 22 23 22 24
Academy Individualized Study N/A N/A N/A N/A
A-Tech 19 21 22 19
Child Haven N/A N/A N/A N/A
Basic HS 29 26 27 30
Bailey MS 28 29 30 30
Arbor View HS 29 29 30 31
CC Detention 1 1 1 5
Cashman MS 27 30 30 30
Canyon Springs HS 27 32 32 29
Cheyenne HS 27 26 26 26
Chaparral HS 29 28 28 30
Centennial HS 27 27 26 30
Burkholder JHS 24 24 25 24
Burk Horizon SW HS 8 12 14 13
Brown JHS 30 30 31 31
Cannon JHS 28 25 29 30
Canarelli MS 30 31 30 29
Cadwallader MS 25 24 33 34
Clark County Schools
District 25 26 28 28
‘N/A’ indicates that this subject is not offered at this school. Data reported as of December 1.
English Mathematics Science Social Studies
Average Class Size is listed for all classes where students rotate to different teachers for different subjects.
Page 64 of 125
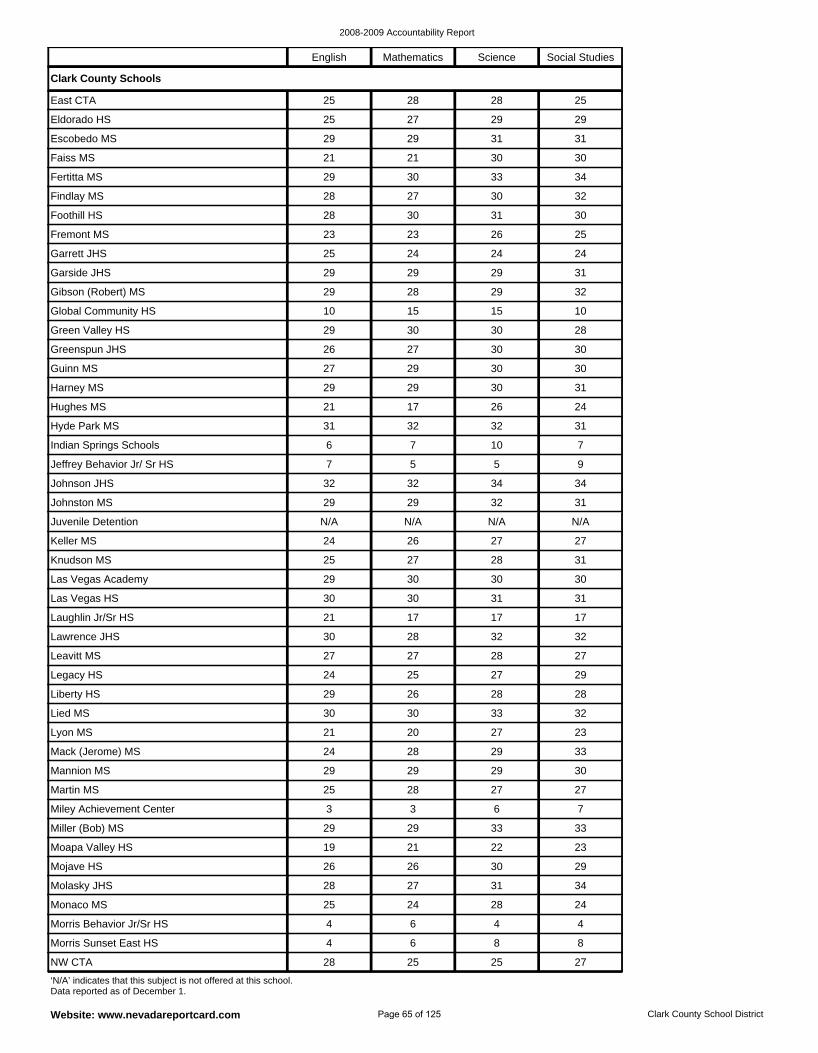
2008-2009 Accountability Report
Website: www.nevadareportcard.com Clark County School District
Mack (Jerome) MS 24 28 29 33
Lyon MS 21 20 27 23
Lied MS 30 30 33 32
Miley Achievement Center 3 3 6 7
Martin MS 25 28 27 27
Mannion MS 29 29 29 30
Liberty HS 29 26 28 28
Laughlin Jr/Sr HS 21 17 17 17
Las Vegas HS 30 30 31 31
Legacy HS 24 25 27 29
Leavitt MS 27 27 28 27
Lawrence JHS 30 28 32 32
NW CTA 28 25 25 27
Morris Sunset East HS 4 6 8 8
Mojave HS 26 26 30 29
Moapa Valley HS 19 21 22 23
Miller (Bob) MS 29 29 33 33
Morris Behavior Jr/Sr HS 4 6 4 4
Monaco MS 25 24 28 24
Molasky JHS 28 27 31 34
Knudson MS 25 27 28 31
Fremont MS 23 23 26 25
Foothill HS 28 30 31 30
Findlay MS 28 27 30 32
Gibson (Robert) MS 29 28 29 32
Garside JHS 29 29 29 31
Garrett JHS 25 24 24 24
Eldorado HS 25 27 29 29
East CTA 25 28 28 25
Las Vegas Academy 29 30 30 30
Fertitta MS 29 30 33 34
Faiss MS 21 21 30 30
Escobedo MS 29 29 31 31
Global Community HS 10 15 15 10
Johnson JHS 32 32 34 34
Jeffrey Behavior Jr/ Sr HS 7 5 5 9
Indian Springs Schools 6 7 10 7
Keller MS 24 26 27 27
Juvenile Detention N/A N/A N/A N/A
Johnston MS 29 29 32 31
Guinn MS 27 29 30 30
Greenspun JHS 26 27 30 30
Green Valley HS 29 30 30 28
Hyde Park MS 31 32 32 31
Hughes MS 21 17 26 24
Harney MS 29 29 30 31
Clark County Schools
‘N/A’ indicates that this subject is not offered at this school. Data reported as of December 1.
English Mathematics Science Social Studies
Page 65 of 125
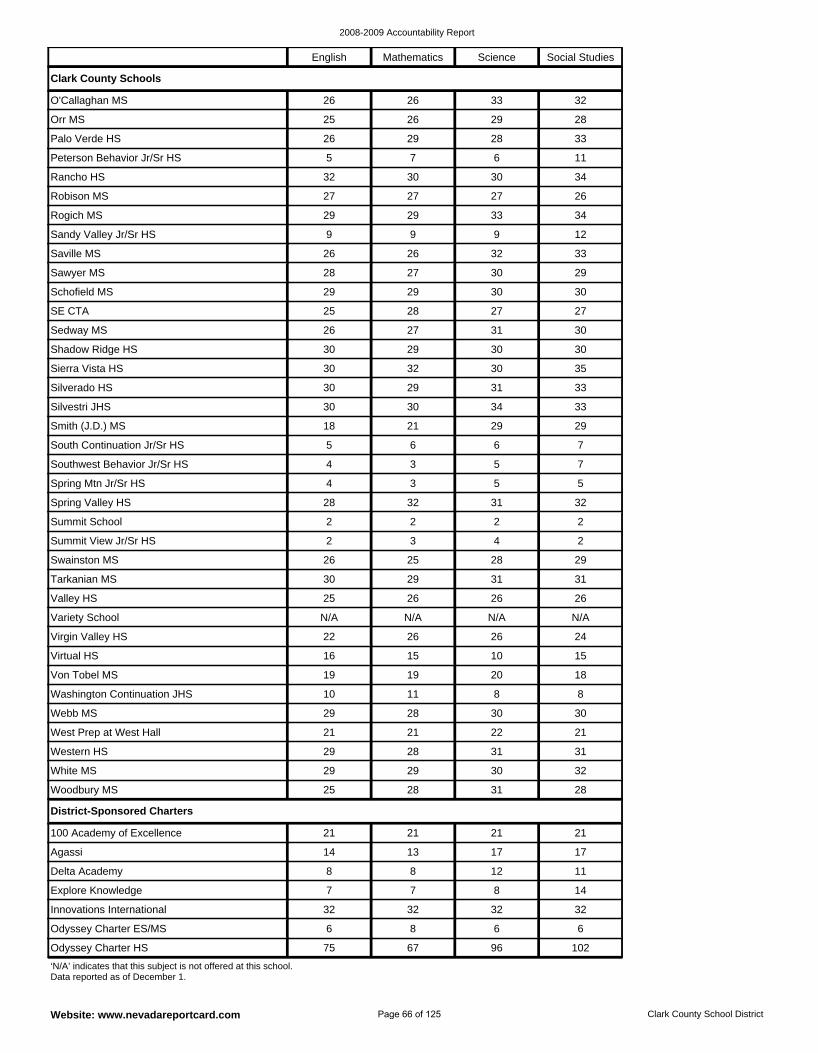
2008-2009 Accountability Report
Website: www.nevadareportcard.com Clark County School District
Explore Knowledge 7 7 8 14
Delta Academy 8 8 12 11
100 Academy of Excellence 21 21 21 21
Odyssey Charter HS 75 67 96 102
Agassi 14 13 17 17
Innovations International 32 32 32 32
Odyssey Charter ES/MS 6 8 6 6
District-Sponsored Charters
Variety School N/A N/A N/A N/A
Virgin Valley HS 22 26 26 24
Virtual HS 16 15 10 15
Swainston MS 26 25 28 29
Tarkanian MS 30 29 31 31
Valley HS 25 26 26 26
Von Tobel MS 19 19 20 18
Western HS 29 28 31 31
White MS 29 29 30 32
Woodbury MS 25 28 31 28
Washington Continuation JHS 10 11 8 8
Webb MS 29 28 30 30
West Prep at West Hall 21 21 22 21
Saville MS 26 26 32 33
Sandy Valley Jr/Sr HS 9 9 9 12
Rogich MS 29 29 33 34
SE CTA 25 28 27 27
Schofield MS 29 29 30 30
Sawyer MS 28 27 30 29
Palo Verde HS 26 29 28 33
Orr MS 25 26 29 28
O'Callaghan MS 26 26 33 32
Robison MS 27 27 27 26
Rancho HS 32 30 30 34
Peterson Behavior Jr/Sr HS 5 7 6 11
Spring Mtn Jr/Sr HS 4 3 5 5
Southwest Behavior Jr/Sr HS 4 3 5 7
South Continuation Jr/Sr HS 5 6 6 7
Summit View Jr/Sr HS 2 3 4 2
Summit School 2 2 2 2
Spring Valley HS 28 32 31 32
Sierra Vista HS 30 32 30 35
Shadow Ridge HS 30 29 30 30
Sedway MS 26 27 31 30
Smith (J.D.) MS 18 21 29 29
Silvestri JHS 30 30 34 33
Silverado HS 30 29 31 33
Clark County Schools
‘N/A’ indicates that this subject is not offered at this school. Data reported as of December 1.
English Mathematics Science Social Studies
Page 66 of 125
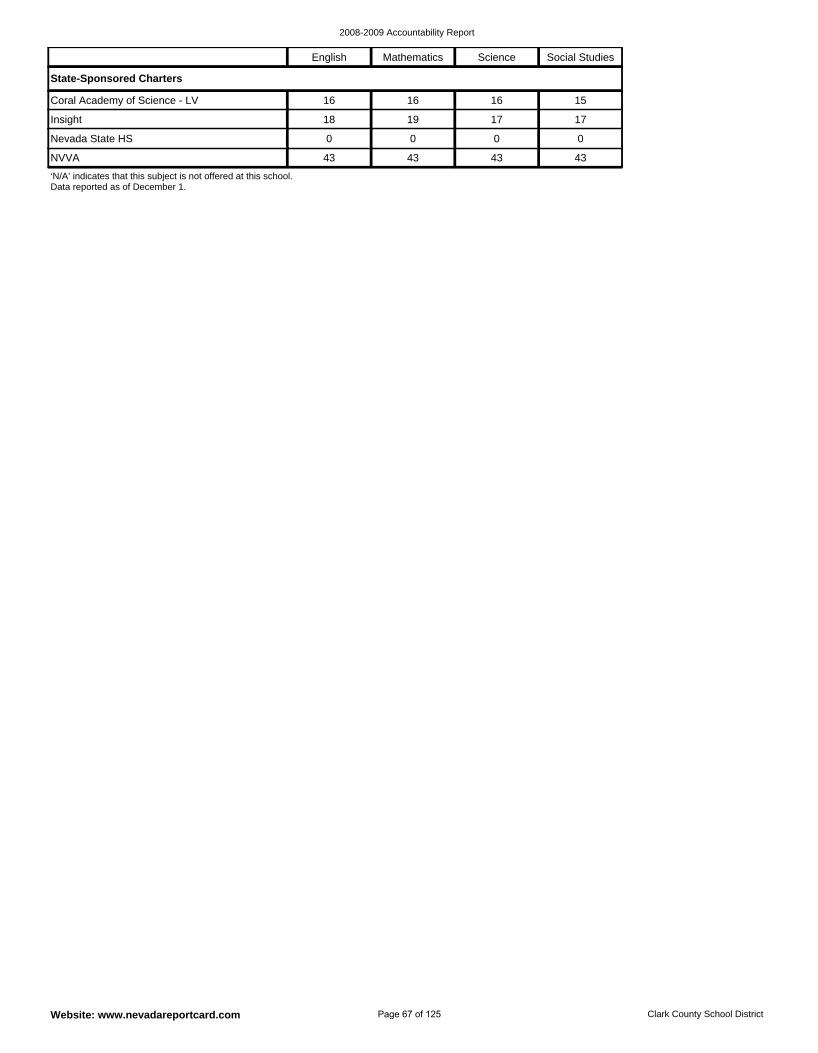
2008-2009 Accountability Report
Website: www.nevadareportcard.com Clark County School District
NVVA 43 43 43 43
Nevada State HS 0 0 0 0
Coral Academy of Science - LV 16 16 16 15
Insight 18 19 17 17
State-Sponsored Charters
‘N/A’ indicates that this subject is not offered at this school. Data reported as of December 1.
English Mathematics Science Social Studies
Page 67 of 125
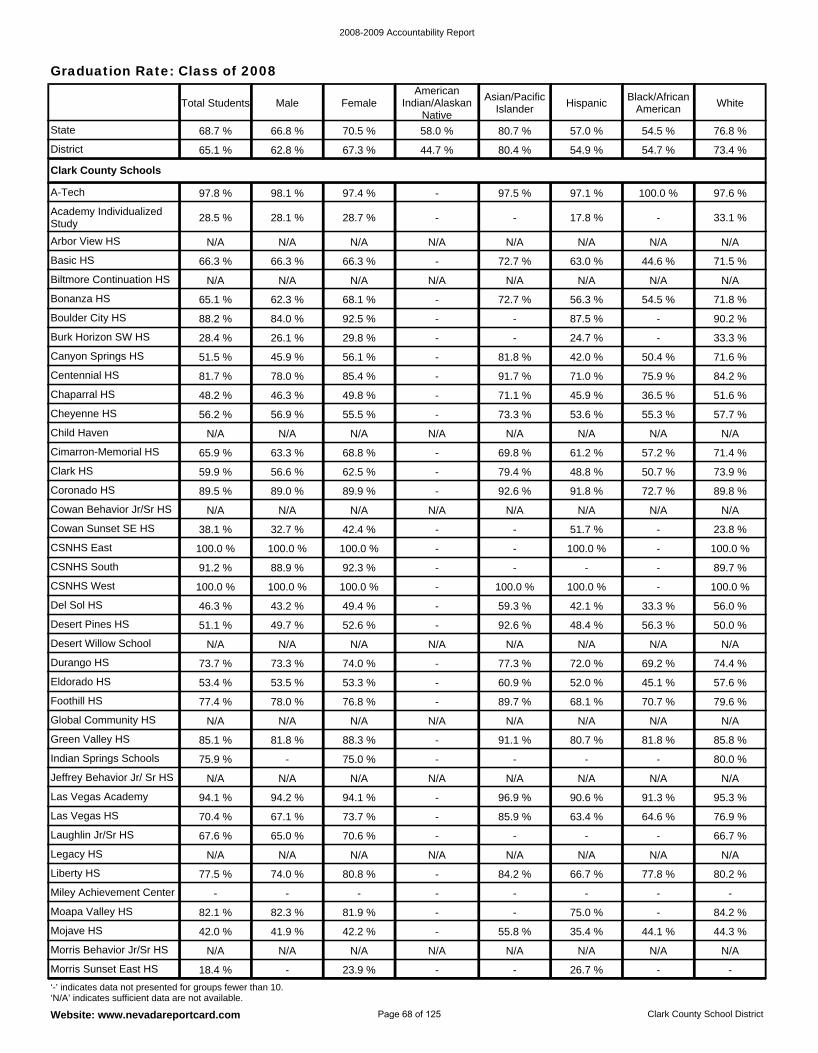
2008-2009 Accountability Report
Website: www.nevadareportcard.com Clark County School District
Graduation Rate: Class of 2008
Las Vegas Academy 94.1 % 94.2 % 94.1 % - 96.9 % 90.6 % 91.3 % 95.3 %
Jeffrey Behavior Jr/ Sr HS N/A N/A N/A N/A N/A N/A N/A N/A
Indian Springs Schools 75.9 % - 75.0 % - - - - 80.0 %
Legacy HS N/A N/A N/A N/A N/A N/A N/A N/A
Laughlin Jr/Sr HS 67.6 % 65.0 % 70.6 % - - - - 66.7 %
Las Vegas HS 70.4 % 67.1 % 73.7 % - 85.9 % 63.4 % 64.6 % 76.9 %
Green Valley HS 85.1 % 81.8 % 88.3 % - 91.1 % 80.7 % 81.8 % 85.8 %
Durango HS 73.7 % 73.3 % 74.0 % - 77.3 % 72.0 % 69.2 % 74.4 %
Desert Willow School N/A N/A N/A N/A N/A N/A N/A N/A
Global Community HS N/A N/A N/A N/A N/A N/A N/A N/A
Foothill HS 77.4 % 78.0 % 76.8 % - 89.7 % 68.1 % 70.7 % 79.6 %
Eldorado HS 53.4 % 53.5 % 53.3 % - 60.9 % 52.0 % 45.1 % 57.6 %
Moapa Valley HS 82.1 % 82.3 % 81.9 % - - 75.0 % - 84.2 %
Miley Achievement Center - - - - - - - -
Liberty HS 77.5 % 74.0 % 80.8 % - 84.2 % 66.7 % 77.8 % 80.2 %
Morris Sunset East HS 18.4 % - 23.9 % - - 26.7 % - -
Morris Behavior Jr/Sr HS N/A N/A N/A N/A N/A N/A N/A N/A
Mojave HS 42.0 % 41.9 % 42.2 % - 55.8 % 35.4 % 44.1 % 44.3 %
Boulder City HS 88.2 % 84.0 % 92.5 % - - 87.5 % - 90.2 %
Bonanza HS 65.1 % 62.3 % 68.1 % - 72.7 % 56.3 % 54.5 % 71.8 %
Burk Horizon SW HS 28.4 % 26.1 % 29.8 % - - 24.7 % - 33.3 %
Centennial HS 81.7 % 78.0 % 85.4 % - 91.7 % 71.0 % 75.9 % 84.2 %
Canyon Springs HS 51.5 % 45.9 % 56.1 % - 81.8 % 42.0 % 50.4 % 71.6 %
Biltmore Continuation HS N/A N/A N/A N/A N/A N/A N/A N/A
A-Tech 97.8 % 98.1 % 97.4 % - 97.5 % 97.1 % 100.0 % 97.6 %
Desert Pines HS 51.1 % 49.7 % 52.6 % - 92.6 % 48.4 % 56.3 % 50.0 %
Academy Individualized Study 28.5 % 28.1 % 28.7 % - - 17.8 % - 33.1 %
Basic HS 66.3 % 66.3 % 66.3 % - 72.7 % 63.0 % 44.6 % 71.5 %
Arbor View HS N/A N/A N/A N/A N/A N/A N/A N/A
Chaparral HS 48.2 % 46.3 % 49.8 % - 71.1 % 45.9 % 36.5 % 51.6 %
CSNHS East 100.0 % 100.0 % 100.0 % - - 100.0 % - 100.0 %
Cowan Sunset SE HS 38.1 % 32.7 % 42.4 % - - 51.7 % - 23.8 %
CSNHS South 91.2 % 88.9 % 92.3 % - - - - 89.7 %
Del Sol HS 46.3 % 43.2 % 49.4 % - 59.3 % 42.1 % 33.3 % 56.0 %
CSNHS West 100.0 % 100.0 % 100.0 % - 100.0 % 100.0 % - 100.0 %
Cowan Behavior Jr/Sr HS N/A N/A N/A N/A N/A N/A N/A N/A
Child Haven N/A N/A N/A N/A N/A N/A N/A N/A
Cheyenne HS 56.2 % 56.9 % 55.5 % - 73.3 % 53.6 % 55.3 % 57.7 %
Cimarron-Memorial HS 65.9 % 63.3 % 68.8 % - 69.8 % 61.2 % 57.2 % 71.4 %
Coronado HS 89.5 % 89.0 % 89.9 % - 92.6 % 91.8 % 72.7 % 89.8 %
Clark HS 59.9 % 56.6 % 62.5 % - 79.4 % 48.8 % 50.7 % 73.9 %
Clark County Schools
District 65.1 % 62.8 % 67.3 % 44.7 % 80.4 % 54.9 % 54.7 % 73.4 %
State 68.7 % 66.8 % 70.5 % 58.0 % 80.7 % 57.0 % 54.5 % 76.8 %
‘-’ indicates data not presented for groups fewer than 10. ‘N/A’ indicates sufficient data are not available.
Total Students Male FemaleAmerican
Indian/Alaskan Native
Asian/Pacific Islander Hispanic
Black/African American White
Page 68 of 125

2008-2009 Accountability Report
Website: www.nevadareportcard.com Clark County School District
NVVA N/A N/A N/A N/A N/A N/A N/A N/A
Nevada State HS 100.0 % 100.0 % 100.0 % - 100.0 % 100.0 % - 100.0 %
State-Sponsored Charters
Explore Knowledge - - - - - - - -
Delta Academy N/A N/A N/A N/A N/A N/A N/A N/A
Agassi N/A N/A N/A N/A N/A N/A N/A N/A
Odyssey Charter HS 28.6 % 26.5 % 30.6 % - - 25.0 % - 29.6 %
Innovations International N/A N/A N/A N/A N/A N/A N/A N/A
District-Sponsored Charters
Variety School N/A N/A N/A N/A N/A N/A N/A N/A
Valley HS 55.5 % 55.2 % 55.7 % - 72.0 % 49.3 % 53.0 % 64.9 %
Virgin Valley HS 90.2 % 90.3 % 90.0 % - - 83.8 % - 92.9 %
Western HS 41.3 % 36.7 % 45.8 % - 55.0 % 38.8 % 36.9 % 50.0 %
Virtual HS 31.8 % - 35.0 % - - - - 27.5 %
Sandy Valley Jr/Sr HS N/A N/A N/A N/A N/A N/A N/A N/A
SE CTA 89.8 % 89.2 % 90.3 % - 91.4 % 93.5 % 83.8 % 84.6 %
Shadow Ridge HS 71.3 % 70.4 % 72.2 % - 88.7 % 70.0 % 57.0 % 72.2 %
Palo Verde HS 76.7 % 71.7 % 81.5 % - 82.3 % 62.1 % 73.9 % 79.4 %
Peterson Behavior Jr/Sr HS N/A N/A N/A N/A N/A N/A N/A N/A
Rancho HS 52.0 % 47.1 % 56.6 % - 93.9 % 47.3 % 40.0 % 74.0 %
Southwest Behavior Jr/Sr HS N/A N/A N/A N/A N/A N/A N/A N/A
Spring Valley HS 73.8 % 73.7 % 73.9 % - 87.4 % 69.9 % 72.5 % 70.5 %
Stewart School N/A N/A N/A N/A N/A N/A N/A N/A
Sierra Vista HS 72.0 % 68.8 % 75.4 % - 81.8 % 60.9 % 59.4 % 77.6 %
Silverado HS 77.1 % 74.9 % 79.8 % - 86.3 % 77.3 % 59.6 % 78.3 %
South Continuation Jr/Sr HS N/A N/A N/A N/A N/A N/A N/A N/A
Clark County Schools
‘-’ indicates data not presented for groups fewer than 10. ‘N/A’ indicates sufficient data are not available.
Total Students Male FemaleAmerican
Indian/Alaskan Native
Asian/Pacific Islander Hispanic
Black/African American White
Page 69 of 125
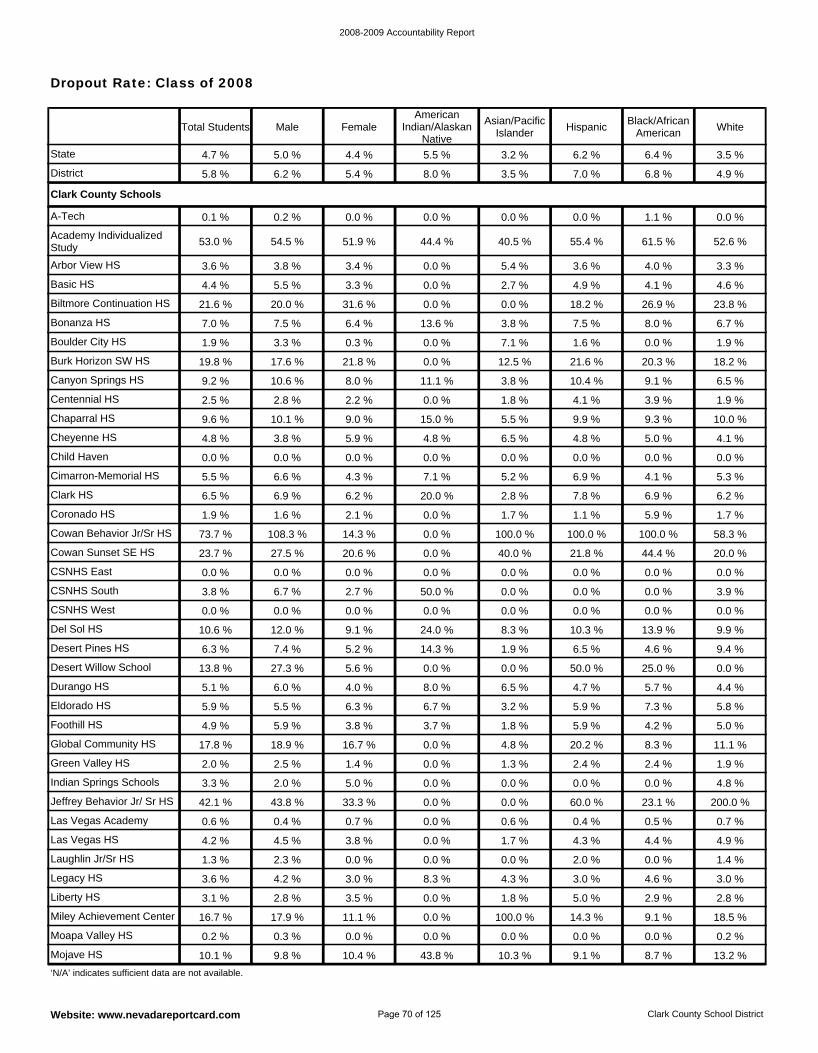
2008-2009 Accountability Report
Website: www.nevadareportcard.com Clark County School District
Dropout Rate: Class of 2008
Las Vegas Academy 0.6 % 0.4 % 0.7 % 0.0 % 0.6 % 0.4 % 0.5 % 0.7 %
Jeffrey Behavior Jr/ Sr HS 42.1 % 43.8 % 33.3 % 0.0 % 0.0 % 60.0 % 23.1 % 200.0 %
Indian Springs Schools 3.3 % 2.0 % 5.0 % 0.0 % 0.0 % 0.0 % 0.0 % 4.8 %
Legacy HS 3.6 % 4.2 % 3.0 % 8.3 % 4.3 % 3.0 % 4.6 % 3.0 %
Laughlin Jr/Sr HS 1.3 % 2.3 % 0.0 % 0.0 % 0.0 % 2.0 % 0.0 % 1.4 %
Las Vegas HS 4.2 % 4.5 % 3.8 % 0.0 % 1.7 % 4.3 % 4.4 % 4.9 %
Green Valley HS 2.0 % 2.5 % 1.4 % 0.0 % 1.3 % 2.4 % 2.4 % 1.9 %
Durango HS 5.1 % 6.0 % 4.0 % 8.0 % 6.5 % 4.7 % 5.7 % 4.4 %
Desert Willow School 13.8 % 27.3 % 5.6 % 0.0 % 0.0 % 50.0 % 25.0 % 0.0 %
Global Community HS 17.8 % 18.9 % 16.7 % 0.0 % 4.8 % 20.2 % 8.3 % 11.1 %
Foothill HS 4.9 % 5.9 % 3.8 % 3.7 % 1.8 % 5.9 % 4.2 % 5.0 %
Eldorado HS 5.9 % 5.5 % 6.3 % 6.7 % 3.2 % 5.9 % 7.3 % 5.8 %
Moapa Valley HS 0.2 % 0.3 % 0.0 % 0.0 % 0.0 % 0.0 % 0.0 % 0.2 %
Miley Achievement Center 16.7 % 17.9 % 11.1 % 0.0 % 100.0 % 14.3 % 9.1 % 18.5 %
Liberty HS 3.1 % 2.8 % 3.5 % 0.0 % 1.8 % 5.0 % 2.9 % 2.8 %
Mojave HS 10.1 % 9.8 % 10.4 % 43.8 % 10.3 % 9.1 % 8.7 % 13.2 %
Boulder City HS 1.9 % 3.3 % 0.3 % 0.0 % 7.1 % 1.6 % 0.0 % 1.9 %
Bonanza HS 7.0 % 7.5 % 6.4 % 13.6 % 3.8 % 7.5 % 8.0 % 6.7 %
Burk Horizon SW HS 19.8 % 17.6 % 21.8 % 0.0 % 12.5 % 21.6 % 20.3 % 18.2 %
Centennial HS 2.5 % 2.8 % 2.2 % 0.0 % 1.8 % 4.1 % 3.9 % 1.9 %
Canyon Springs HS 9.2 % 10.6 % 8.0 % 11.1 % 3.8 % 10.4 % 9.1 % 6.5 %
Biltmore Continuation HS 21.6 % 20.0 % 31.6 % 0.0 % 0.0 % 18.2 % 26.9 % 23.8 %
A-Tech 0.1 % 0.2 % 0.0 % 0.0 % 0.0 % 0.0 % 1.1 % 0.0 %
Desert Pines HS 6.3 % 7.4 % 5.2 % 14.3 % 1.9 % 6.5 % 4.6 % 9.4 %
Academy Individualized Study 53.0 % 54.5 % 51.9 % 44.4 % 40.5 % 55.4 % 61.5 % 52.6 %
Basic HS 4.4 % 5.5 % 3.3 % 0.0 % 2.7 % 4.9 % 4.1 % 4.6 %
Arbor View HS 3.6 % 3.8 % 3.4 % 0.0 % 5.4 % 3.6 % 4.0 % 3.3 %
Chaparral HS 9.6 % 10.1 % 9.0 % 15.0 % 5.5 % 9.9 % 9.3 % 10.0 %
CSNHS East 0.0 % 0.0 % 0.0 % 0.0 % 0.0 % 0.0 % 0.0 % 0.0 %
Cowan Sunset SE HS 23.7 % 27.5 % 20.6 % 0.0 % 40.0 % 21.8 % 44.4 % 20.0 %
CSNHS South 3.8 % 6.7 % 2.7 % 50.0 % 0.0 % 0.0 % 0.0 % 3.9 %
Del Sol HS 10.6 % 12.0 % 9.1 % 24.0 % 8.3 % 10.3 % 13.9 % 9.9 %
CSNHS West 0.0 % 0.0 % 0.0 % 0.0 % 0.0 % 0.0 % 0.0 % 0.0 %
Cowan Behavior Jr/Sr HS 73.7 % 108.3 % 14.3 % 0.0 % 100.0 % 100.0 % 100.0 % 58.3 %
Child Haven 0.0 % 0.0 % 0.0 % 0.0 % 0.0 % 0.0 % 0.0 % 0.0 %
Cheyenne HS 4.8 % 3.8 % 5.9 % 4.8 % 6.5 % 4.8 % 5.0 % 4.1 %
Cimarron-Memorial HS 5.5 % 6.6 % 4.3 % 7.1 % 5.2 % 6.9 % 4.1 % 5.3 %
Coronado HS 1.9 % 1.6 % 2.1 % 0.0 % 1.7 % 1.1 % 5.9 % 1.7 %
Clark HS 6.5 % 6.9 % 6.2 % 20.0 % 2.8 % 7.8 % 6.9 % 6.2 %
Clark County Schools
District 5.8 % 6.2 % 5.4 % 8.0 % 3.5 % 7.0 % 6.8 % 4.9 %
State 4.7 % 5.0 % 4.4 % 5.5 % 3.2 % 6.2 % 6.4 % 3.5 %
‘N/A’ indicates sufficient data are not available.
Total Students Male FemaleAmerican
Indian/Alaskan Native
Asian/Pacific Islander Hispanic
Black/African American White
Page 70 of 125
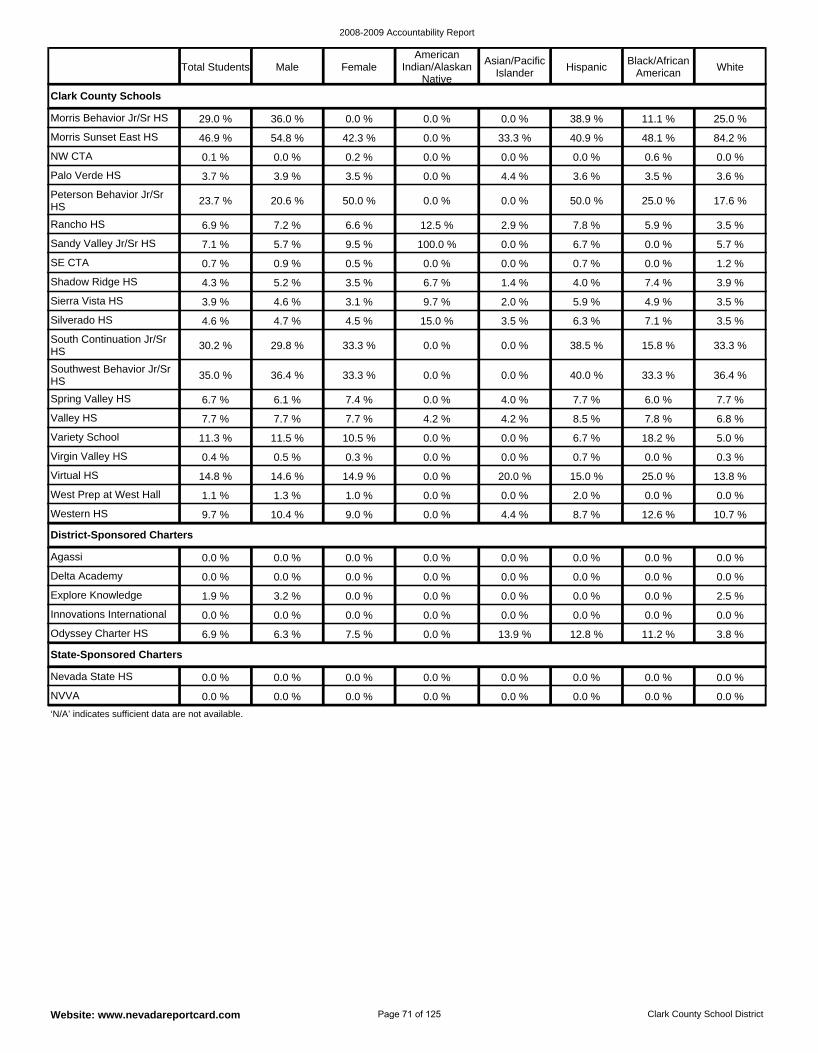
2008-2009 Accountability Report
Website: www.nevadareportcard.com Clark County School District
NVVA 0.0 % 0.0 % 0.0 % 0.0 % 0.0 % 0.0 % 0.0 % 0.0 %
Nevada State HS 0.0 % 0.0 % 0.0 % 0.0 % 0.0 % 0.0 % 0.0 % 0.0 %
State-Sponsored Charters
Delta Academy 0.0 % 0.0 % 0.0 % 0.0 % 0.0 % 0.0 % 0.0 % 0.0 %
Agassi 0.0 % 0.0 % 0.0 % 0.0 % 0.0 % 0.0 % 0.0 % 0.0 %
Explore Knowledge 1.9 % 3.2 % 0.0 % 0.0 % 0.0 % 0.0 % 0.0 % 2.5 %
Odyssey Charter HS 6.9 % 6.3 % 7.5 % 0.0 % 13.9 % 12.8 % 11.2 % 3.8 %
Innovations International 0.0 % 0.0 % 0.0 % 0.0 % 0.0 % 0.0 % 0.0 % 0.0 %
District-Sponsored Charters
Variety School 11.3 % 11.5 % 10.5 % 0.0 % 0.0 % 6.7 % 18.2 % 5.0 %
Valley HS 7.7 % 7.7 % 7.7 % 4.2 % 4.2 % 8.5 % 7.8 % 6.8 %
Spring Valley HS 6.7 % 6.1 % 7.4 % 0.0 % 4.0 % 7.7 % 6.0 % 7.7 %
Virgin Valley HS 0.4 % 0.5 % 0.3 % 0.0 % 0.0 % 0.7 % 0.0 % 0.3 %
Western HS 9.7 % 10.4 % 9.0 % 0.0 % 4.4 % 8.7 % 12.6 % 10.7 %
West Prep at West Hall 1.1 % 1.3 % 1.0 % 0.0 % 0.0 % 2.0 % 0.0 % 0.0 %
Virtual HS 14.8 % 14.6 % 14.9 % 0.0 % 20.0 % 15.0 % 25.0 % 13.8 %
Palo Verde HS 3.7 % 3.9 % 3.5 % 0.0 % 4.4 % 3.6 % 3.5 % 3.6 %
Peterson Behavior Jr/Sr HS 23.7 % 20.6 % 50.0 % 0.0 % 0.0 % 50.0 % 25.0 % 17.6 %
Rancho HS 6.9 % 7.2 % 6.6 % 12.5 % 2.9 % 7.8 % 5.9 % 3.5 %
Morris Behavior Jr/Sr HS 29.0 % 36.0 % 0.0 % 0.0 % 0.0 % 38.9 % 11.1 % 25.0 %
Morris Sunset East HS 46.9 % 54.8 % 42.3 % 0.0 % 33.3 % 40.9 % 48.1 % 84.2 %
NW CTA 0.1 % 0.0 % 0.2 % 0.0 % 0.0 % 0.0 % 0.6 % 0.0 %
Sandy Valley Jr/Sr HS 7.1 % 5.7 % 9.5 % 100.0 % 0.0 % 6.7 % 0.0 % 5.7 %
Silverado HS 4.6 % 4.7 % 4.5 % 15.0 % 3.5 % 6.3 % 7.1 % 3.5 %
South Continuation Jr/Sr HS 30.2 % 29.8 % 33.3 % 0.0 % 0.0 % 38.5 % 15.8 % 33.3 %
Southwest Behavior Jr/Sr HS 35.0 % 36.4 % 33.3 % 0.0 % 0.0 % 40.0 % 33.3 % 36.4 %
SE CTA 0.7 % 0.9 % 0.5 % 0.0 % 0.0 % 0.7 % 0.0 % 1.2 %
Shadow Ridge HS 4.3 % 5.2 % 3.5 % 6.7 % 1.4 % 4.0 % 7.4 % 3.9 %
Sierra Vista HS 3.9 % 4.6 % 3.1 % 9.7 % 2.0 % 5.9 % 4.9 % 3.5 %
Clark County Schools
‘N/A’ indicates sufficient data are not available.
Total Students Male FemaleAmerican
Indian/Alaskan Native
Asian/Pacific Islander Hispanic
Black/African American White
Page 71 of 125
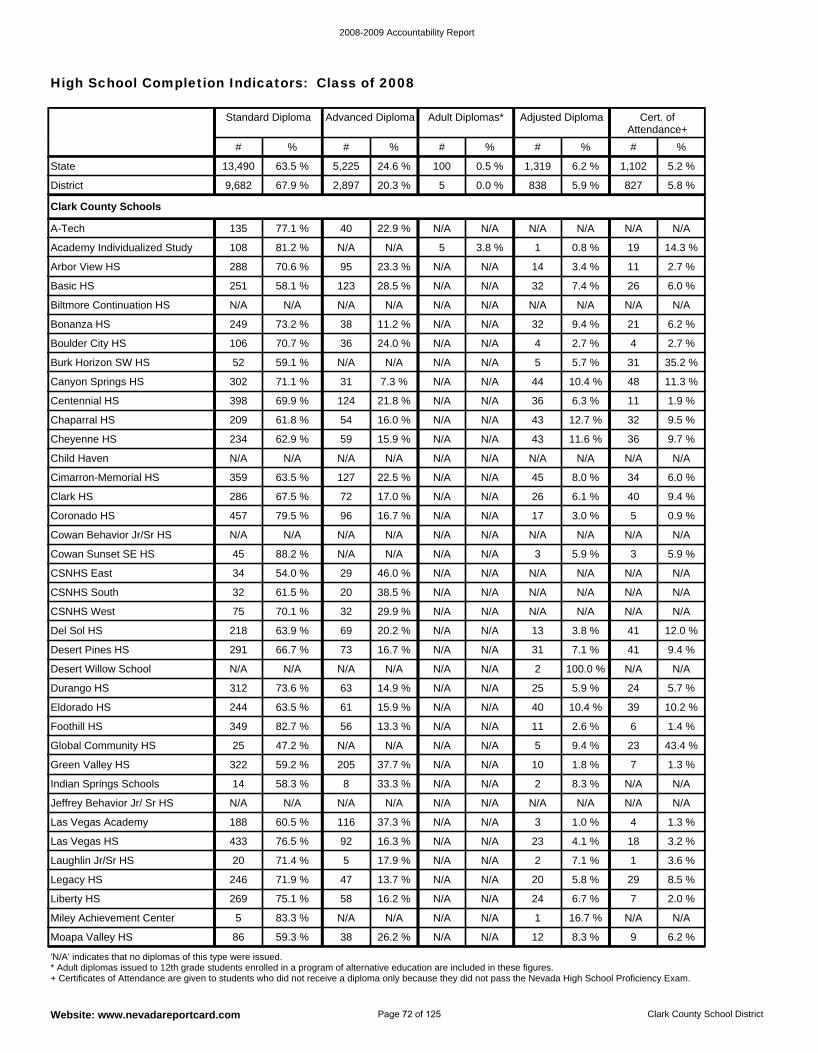
2008-2009 Accountability Report
Website: www.nevadareportcard.com Clark County School District
Indian Springs Schools 14 58.3 % 8 33.3 % N/A N/A 2 8.3 % N/A N/A
Green Valley HS 322 59.2 % 205 37.7 % N/A N/A 10 1.8 % 7 1.3 %
Global Community HS 25 47.2 % N/A N/A N/A N/A 5 9.4 % 23 43.4 %
Las Vegas HS 433 76.5 % 92 16.3 % N/A N/A 23 4.1 % 18 3.2 %
Las Vegas Academy 188 60.5 % 116 37.3 % N/A N/A 3 1.0 % 4 1.3 %
Jeffrey Behavior Jr/ Sr HS N/A N/A N/A N/A N/A N/A N/A N/A N/A N/A
Desert Willow School N/A N/A N/A N/A N/A N/A 2 100.0 % N/A N/A
Desert Pines HS 291 66.7 % 73 16.7 % N/A N/A 31 7.1 % 41 9.4 %
Foothill HS 349 82.7 % 56 13.3 % N/A N/A 11 2.6 % 6 1.4 %
Eldorado HS 244 63.5 % 61 15.9 % N/A N/A 40 10.4 % 39 10.2 %
Durango HS 312 73.6 % 63 14.9 % N/A N/A 25 5.9 % 24 5.7 %
Laughlin Jr/Sr HS 20 71.4 % 5 17.9 % N/A N/A 2 7.1 % 1 3.6 %
Miley Achievement Center 5 83.3 % N/A N/A N/A N/A 1 16.7 % N/A N/A
Liberty HS 269 75.1 % 58 16.2 % N/A N/A 24 6.7 % 7 2.0 %
Legacy HS 246 71.9 % 47 13.7 % N/A N/A 20 5.8 % 29 8.5 %
Moapa Valley HS 86 59.3 % 38 26.2 % N/A N/A 12 8.3 % 9 6.2 %
CSNHS West 75 70.1 % 32 29.9 % N/A N/A N/A N/A N/A N/A
Bonanza HS 249 73.2 % 38 11.2 % N/A N/A 32 9.4 % 21 6.2 %
Biltmore Continuation HS N/A N/A N/A N/A N/A N/A N/A N/A N/A N/A
Boulder City HS 106 70.7 % 36 24.0 % N/A N/A 4 2.7 % 4 2.7 %
Canyon Springs HS 302 71.1 % 31 7.3 % N/A N/A 44 10.4 % 48 11.3 %
Burk Horizon SW HS 52 59.1 % N/A N/A N/A N/A 5 5.7 % 31 35.2 %
Basic HS 251 58.1 % 123 28.5 % N/A N/A 32 7.4 % 26 6.0 %
Del Sol HS 218 63.9 % 69 20.2 % N/A N/A 13 3.8 % 41 12.0 %
A-Tech 135 77.1 % 40 22.9 % N/A N/A N/A N/A N/A N/A
Arbor View HS 288 70.6 % 95 23.3 % N/A N/A 14 3.4 % 11 2.7 %
Academy Individualized Study 108 81.2 % N/A N/A 5 3.8 % 1 0.8 % 19 14.3 %
Cowan Behavior Jr/Sr HS N/A N/A N/A N/A N/A N/A N/A N/A N/A N/A
Coronado HS 457 79.5 % 96 16.7 % N/A N/A 17 3.0 % 5 0.9 %
Cowan Sunset SE HS 45 88.2 % N/A N/A N/A N/A 3 5.9 % 3 5.9 %
CSNHS South 32 61.5 % 20 38.5 % N/A N/A N/A N/A N/A N/A
CSNHS East 34 54.0 % 29 46.0 % N/A N/A N/A N/A N/A N/A
Clark HS 286 67.5 % 72 17.0 % N/A N/A 26 6.1 % 40 9.4 %
Centennial HS 398 69.9 % 124 21.8 % N/A N/A 36 6.3 % 11 1.9 %
Chaparral HS 209 61.8 % 54 16.0 % N/A N/A 43 12.7 % 32 9.5 %
Cheyenne HS 234 62.9 % 59 15.9 % N/A N/A 43 11.6 % 36 9.7 %
Cimarron-Memorial HS 359 63.5 % 127 22.5 % N/A N/A 45 8.0 % 34 6.0 %
Child Haven N/A N/A N/A N/A N/A N/A N/A N/A N/A N/A
Clark County Schools
District 9,682 67.9 % 2,897 20.3 % 5 0.0 % 838 5.9 % 827 5.8 %
State 13,490 63.5 % 5,225 24.6 % 100 0.5 % 1,319 6.2 % 1,102 5.2 %
'N/A' indicates that no diplomas of this type were issued. * Adult diplomas issued to 12th grade students enrolled in a program of alternative education are included in these figures. + Certificates of Attendance are given to students who did not receive a diploma only because they did not pass the Nevada High School Proficiency Exam.
Standard Diploma Advanced Diploma Adult Diplomas* Adjusted Diploma Cert. of Attendance+
# % # % # % # % # %
High School Completion Indicators: Class of 2008
Page 72 of 125
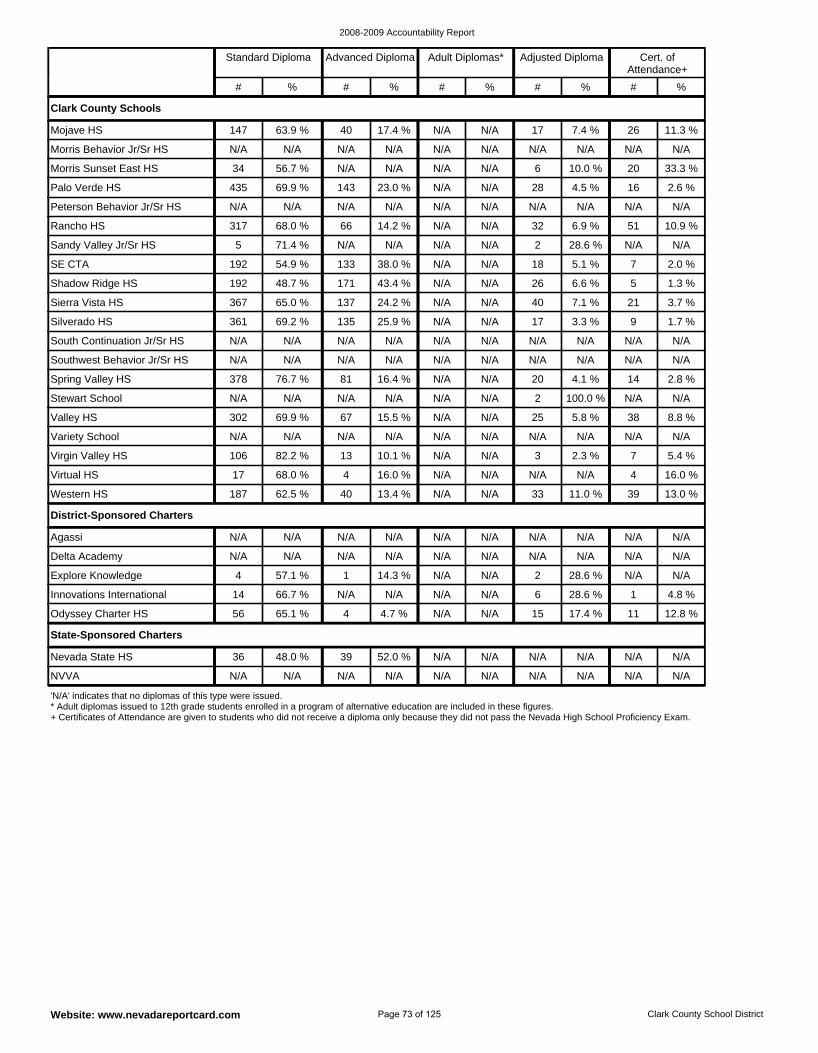
2008-2009 Accountability Report
Website: www.nevadareportcard.com Clark County School District
NVVA N/A N/A N/A N/A N/A N/A N/A N/A N/A N/A
Nevada State HS 36 48.0 % 39 52.0 % N/A N/A N/A N/A N/A N/A
State-Sponsored Charters
Delta Academy N/A N/A N/A N/A N/A N/A N/A N/A N/A N/A
Agassi N/A N/A N/A N/A N/A N/A N/A N/A N/A N/A
Explore Knowledge 4 57.1 % 1 14.3 % N/A N/A 2 28.6 % N/A N/A
Odyssey Charter HS 56 65.1 % 4 4.7 % N/A N/A 15 17.4 % 11 12.8 %
Innovations International 14 66.7 % N/A N/A N/A N/A 6 28.6 % 1 4.8 %
District-Sponsored Charters
Valley HS 302 69.9 % 67 15.5 % N/A N/A 25 5.8 % 38 8.8 %
Stewart School N/A N/A N/A N/A N/A N/A 2 100.0 % N/A N/A
Western HS 187 62.5 % 40 13.4 % N/A N/A 33 11.0 % 39 13.0 %
Variety School N/A N/A N/A N/A N/A N/A N/A N/A N/A N/A
Spring Valley HS 378 76.7 % 81 16.4 % N/A N/A 20 4.1 % 14 2.8 %
Virtual HS 17 68.0 % 4 16.0 % N/A N/A N/A N/A 4 16.0 %
Virgin Valley HS 106 82.2 % 13 10.1 % N/A N/A 3 2.3 % 7 5.4 %
Palo Verde HS 435 69.9 % 143 23.0 % N/A N/A 28 4.5 % 16 2.6 %
Peterson Behavior Jr/Sr HS N/A N/A N/A N/A N/A N/A N/A N/A N/A N/A
Rancho HS 317 68.0 % 66 14.2 % N/A N/A 32 6.9 % 51 10.9 %
Mojave HS 147 63.9 % 40 17.4 % N/A N/A 17 7.4 % 26 11.3 %
Morris Behavior Jr/Sr HS N/A N/A N/A N/A N/A N/A N/A N/A N/A N/A
Morris Sunset East HS 34 56.7 % N/A N/A N/A N/A 6 10.0 % 20 33.3 %
Sandy Valley Jr/Sr HS 5 71.4 % N/A N/A N/A N/A 2 28.6 % N/A N/A
Silverado HS 361 69.2 % 135 25.9 % N/A N/A 17 3.3 % 9 1.7 %
South Continuation Jr/Sr HS N/A N/A N/A N/A N/A N/A N/A N/A N/A N/A
Southwest Behavior Jr/Sr HS N/A N/A N/A N/A N/A N/A N/A N/A N/A N/A
SE CTA 192 54.9 % 133 38.0 % N/A N/A 18 5.1 % 7 2.0 %
Shadow Ridge HS 192 48.7 % 171 43.4 % N/A N/A 26 6.6 % 5 1.3 %
Sierra Vista HS 367 65.0 % 137 24.2 % N/A N/A 40 7.1 % 21 3.7 %
Clark County Schools
'N/A' indicates that no diplomas of this type were issued. * Adult diplomas issued to 12th grade students enrolled in a program of alternative education are included in these figures. + Certificates of Attendance are given to students who did not receive a diploma only because they did not pass the Nevada High School Proficiency Exam.
Standard Diploma Advanced Diploma Adult Diplomas* Adjusted Diploma Cert. of Attendance+
# % # % # % # % # %
Page 73 of 125
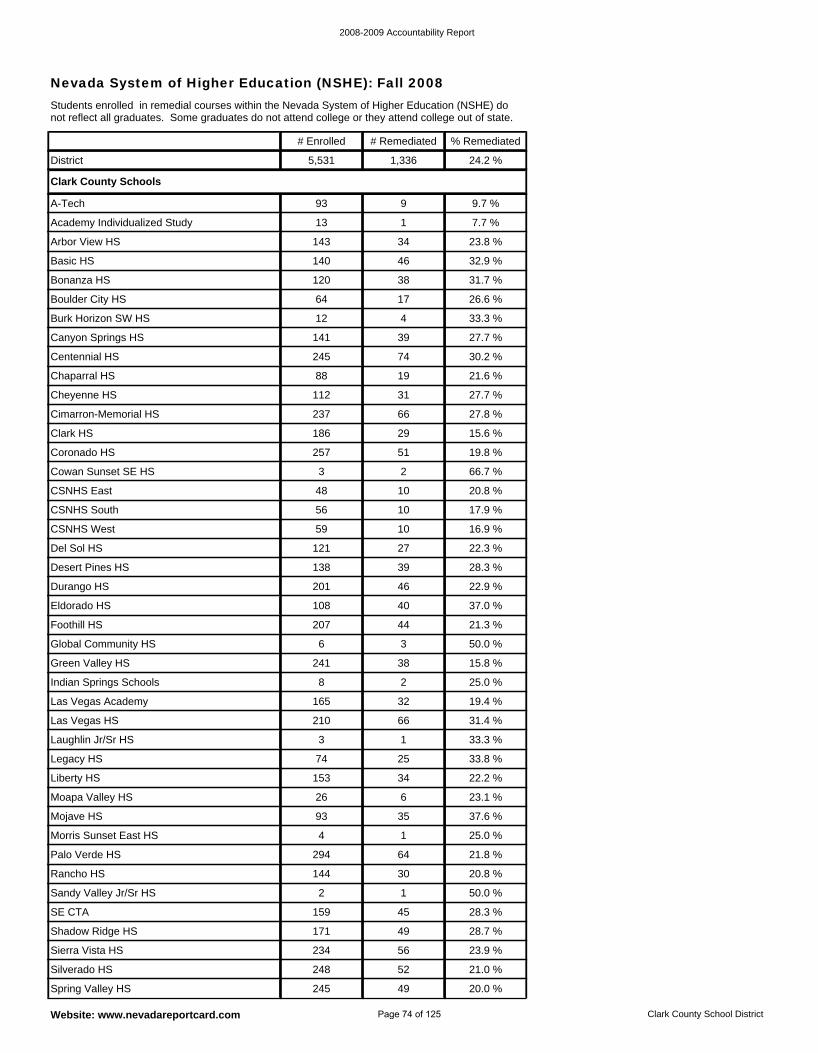
2008-2009 Accountability Report
Website: www.nevadareportcard.com Clark County School District
Nevada System of Higher Education (NSHE): Fall 2008
Moapa Valley HS 26 6 23.1 %
Liberty HS 153 34 22.2 %
Mojave HS 93 35 37.6 %
Palo Verde HS 294 64 21.8 %
Morris Sunset East HS 4 1 25.0 %
Legacy HS 74 25 33.8 %
Indian Springs Schools 8 2 25.0 %
Green Valley HS 241 38 15.8 %
Las Vegas Academy 165 32 19.4 %
Laughlin Jr/Sr HS 3 1 33.3 %
Las Vegas HS 210 66 31.4 %
Spring Valley HS 245 49 20.0 %
Silverado HS 248 52 21.0 %
Sandy Valley Jr/Sr HS 2 1 50.0 %
Rancho HS 144 30 20.8 %
SE CTA 159 45 28.3 %
Sierra Vista HS 234 56 23.9 %
Shadow Ridge HS 171 49 28.7 %
Centennial HS 245 74 30.2 %
Canyon Springs HS 141 39 27.7 %
Burk Horizon SW HS 12 4 33.3 %
Cimarron-Memorial HS 237 66 27.8 %
Cheyenne HS 112 31 27.7 %
Chaparral HS 88 19 21.6 %
Arbor View HS 143 34 23.8 %
Academy Individualized Study 13 1 7.7 %
A-Tech 93 9 9.7 %
Boulder City HS 64 17 26.6 %
Bonanza HS 120 38 31.7 %
Basic HS 140 46 32.9 %
Durango HS 201 46 22.9 %
Desert Pines HS 138 39 28.3 %
Del Sol HS 121 27 22.3 %
Global Community HS 6 3 50.0 %
Foothill HS 207 44 21.3 %
Eldorado HS 108 40 37.0 %
Cowan Sunset SE HS 3 2 66.7 %
Coronado HS 257 51 19.8 %
Clark HS 186 29 15.6 %
CSNHS West 59 10 16.9 %
CSNHS South 56 10 17.9 %
CSNHS East 48 10 20.8 %
Clark County Schools
District 5,531 1,336 24.2 %
# Enrolled # Remediated % Remediated
Students enrolled in remedial courses within the Nevada System of Higher Education (NSHE) do not reflect all graduates. Some graduates do not attend college or they attend college out of state.
Page 74 of 125
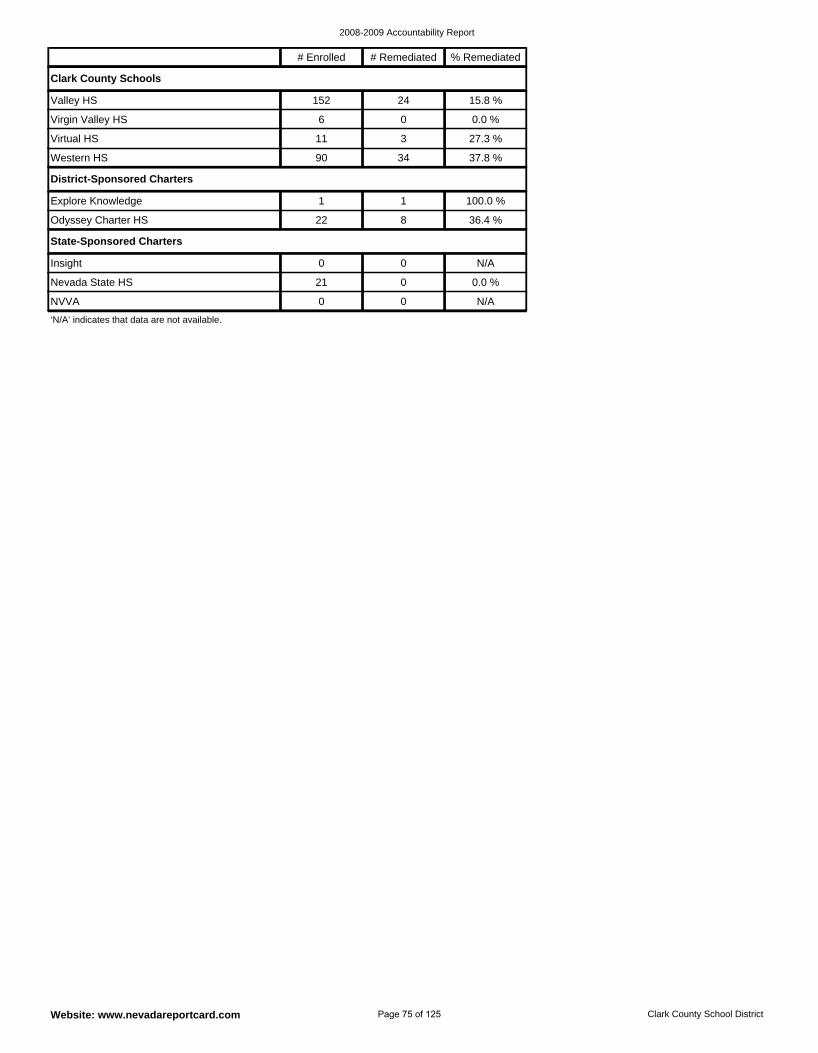
2008-2009 Accountability Report
Website: www.nevadareportcard.com Clark County School District
NVVA 0 0 N/A
Insight 0 0 N/A
Nevada State HS 21 0 0.0 %
State-Sponsored Charters
Odyssey Charter HS 22 8 36.4 %
Explore Knowledge 1 1 100.0 %
District-Sponsored Charters
Valley HS 152 24 15.8 %
Western HS 90 34 37.8 %
Virtual HS 11 3 27.3 %
Virgin Valley HS 6 0 0.0 %
Clark County Schools
‘N/A’ indicates that data are not available.
# Enrolled # Remediated % Remediated
Page 75 of 125
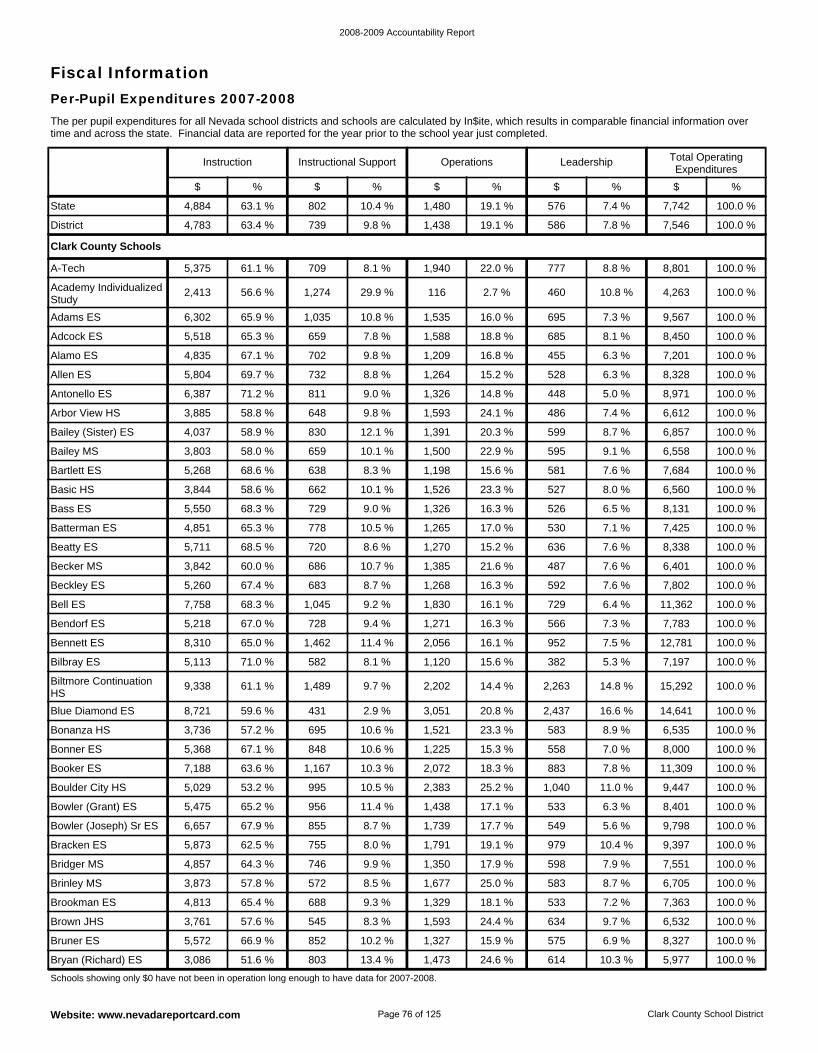
2008-2009 Accountability Report
Website: www.nevadareportcard.com Clark County School District
Bracken ES 5,873 62.5 % 755 8.0 % 1,791 19.1 % 979 10.4 % 9,397 100.0 %
Bowler (Joseph) Sr ES 6,657 67.9 % 855 8.7 % 1,739 17.7 % 549 5.6 % 9,798 100.0 %
Bowler (Grant) ES 5,475 65.2 % 956 11.4 % 1,438 17.1 % 533 6.3 % 8,401 100.0 %
Brookman ES 4,813 65.4 % 688 9.3 % 1,329 18.1 % 533 7.2 % 7,363 100.0 %
Brinley MS 3,873 57.8 % 572 8.5 % 1,677 25.0 % 583 8.7 % 6,705 100.0 %
Bridger MS 4,857 64.3 % 746 9.9 % 1,350 17.9 % 598 7.9 % 7,551 100.0 %
Bonanza HS 3,736 57.2 % 695 10.6 % 1,521 23.3 % 583 8.9 % 6,535 100.0 %
Blue Diamond ES 8,721 59.6 % 431 2.9 % 3,051 20.8 % 2,437 16.6 % 14,641 100.0 %
Boulder City HS 5,029 53.2 % 995 10.5 % 2,383 25.2 % 1,040 11.0 % 9,447 100.0 %
Booker ES 7,188 63.6 % 1,167 10.3 % 2,072 18.3 % 883 7.8 % 11,309 100.0 %
Bonner ES 5,368 67.1 % 848 10.6 % 1,225 15.3 % 558 7.0 % 8,000 100.0 %
Brown JHS 3,761 57.6 % 545 8.3 % 1,593 24.4 % 634 9.7 % 6,532 100.0 %
Bryan (Richard) ES 3,086 51.6 % 803 13.4 % 1,473 24.6 % 614 10.3 % 5,977 100.0 %
Bruner ES 5,572 66.9 % 852 10.2 % 1,327 15.9 % 575 6.9 % 8,327 100.0 %
Bilbray ES 5,113 71.0 % 582 8.1 % 1,120 15.6 % 382 5.3 % 7,197 100.0 %
Allen ES 5,804 69.7 % 732 8.8 % 1,264 15.2 % 528 6.3 % 8,328 100.0 %
Alamo ES 4,835 67.1 % 702 9.8 % 1,209 16.8 % 455 6.3 % 7,201 100.0 %
Antonello ES 6,387 71.2 % 811 9.0 % 1,326 14.8 % 448 5.0 % 8,971 100.0 %
Bailey (Sister) ES 4,037 58.9 % 830 12.1 % 1,391 20.3 % 599 8.7 % 6,857 100.0 %
Arbor View HS 3,885 58.8 % 648 9.8 % 1,593 24.1 % 486 7.4 % 6,612 100.0 %
Adcock ES 5,518 65.3 % 659 7.8 % 1,588 18.8 % 685 8.1 % 8,450 100.0 %
Biltmore Continuation HS
9,338 61.1 % 1,489 9.7 % 2,202 14.4 % 2,263 14.8 % 15,292 100.0 %
A-Tech 5,375 61.1 % 709 8.1 % 1,940 22.0 % 777 8.8 % 8,801 100.0 %
Adams ES 6,302 65.9 % 1,035 10.8 % 1,535 16.0 % 695 7.3 % 9,567 100.0 %
Academy Individualized Study
2,413 56.6 % 1,274 29.9 % 116 2.7 % 460 10.8 % 4,263 100.0 %
Beckley ES 5,260 67.4 % 683 8.7 % 1,268 16.3 % 592 7.6 % 7,802 100.0 %
Becker MS 3,842 60.0 % 686 10.7 % 1,385 21.6 % 487 7.6 % 6,401 100.0 %
Bell ES 7,758 68.3 % 1,045 9.2 % 1,830 16.1 % 729 6.4 % 11,362 100.0 %
Bennett ES 8,310 65.0 % 1,462 11.4 % 2,056 16.1 % 952 7.5 % 12,781 100.0 %
Bendorf ES 5,218 67.0 % 728 9.4 % 1,271 16.3 % 566 7.3 % 7,783 100.0 %
Beatty ES 5,711 68.5 % 720 8.6 % 1,270 15.2 % 636 7.6 % 8,338 100.0 %
Bailey MS 3,803 58.0 % 659 10.1 % 1,500 22.9 % 595 9.1 % 6,558 100.0 %
Bartlett ES 5,268 68.6 % 638 8.3 % 1,198 15.6 % 581 7.6 % 7,684 100.0 %
Basic HS 3,844 58.6 % 662 10.1 % 1,526 23.3 % 527 8.0 % 6,560 100.0 %
Batterman ES 4,851 65.3 % 778 10.5 % 1,265 17.0 % 530 7.1 % 7,425 100.0 %
Bass ES 5,550 68.3 % 729 9.0 % 1,326 16.3 % 526 6.5 % 8,131 100.0 %
Clark County Schools
District 4,783 63.4 % 739 9.8 % 1,438 19.1 % 586 7.8 % 7,546 100.0 %
State 4,884 63.1 % 802 10.4 % 1,480 19.1 % 576 7.4 % 7,742 100.0 %
Schools showing only $0 have not been in operation long enough to have data for 2007-2008.
Instruction Instructional Support Operations Leadership Total Operating Expenditures
$ % $ % $ % $ % $ %
Per-Pupil Expenditures 2007-2008The per pupil expenditures for all Nevada school districts and schools are calculated by In$ite, which results in comparable financial information over time and across the state. Financial data are reported for the year prior to the school year just completed.
Fiscal Information
Page 76 of 125
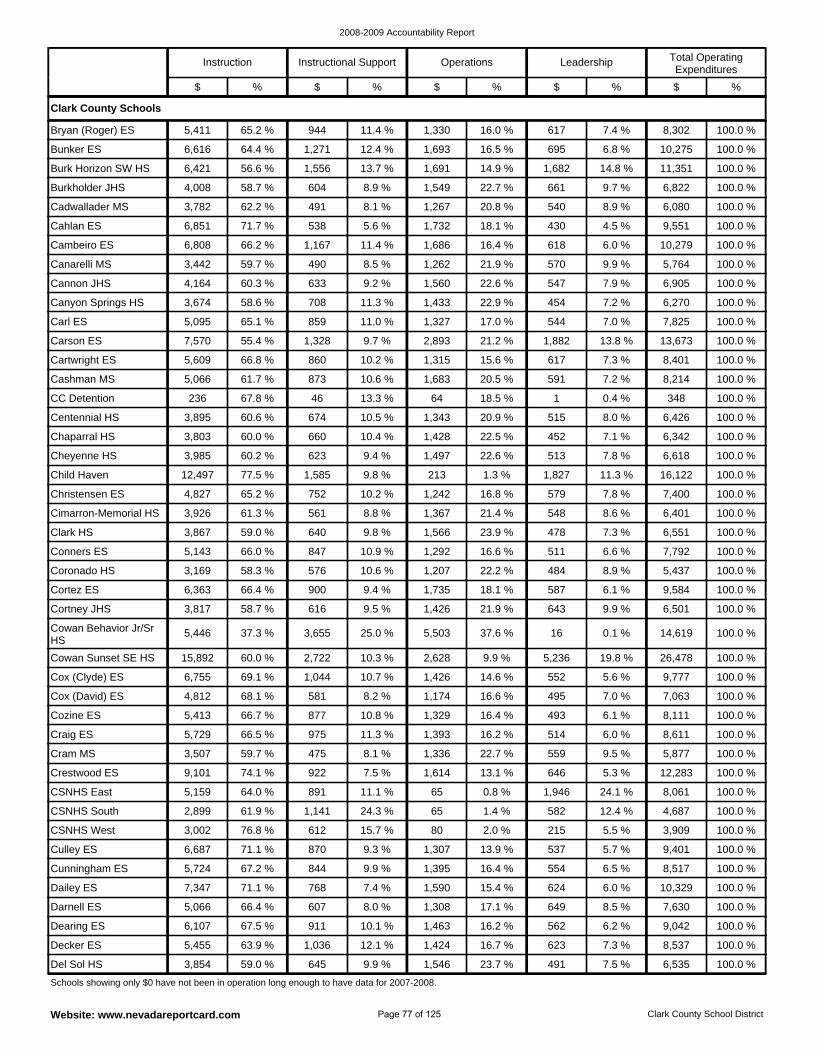
2008-2009 Accountability Report
Website: www.nevadareportcard.com Clark County School District
Crestwood ES 9,101 74.1 % 922 7.5 % 1,614 13.1 % 646 5.3 % 12,283 100.0 %
Cram MS 3,507 59.7 % 475 8.1 % 1,336 22.7 % 559 9.5 % 5,877 100.0 %
Craig ES 5,729 66.5 % 975 11.3 % 1,393 16.2 % 514 6.0 % 8,611 100.0 %
CSNHS West 3,002 76.8 % 612 15.7 % 80 2.0 % 215 5.5 % 3,909 100.0 %
CSNHS South 2,899 61.9 % 1,141 24.3 % 65 1.4 % 582 12.4 % 4,687 100.0 %
CSNHS East 5,159 64.0 % 891 11.1 % 65 0.8 % 1,946 24.1 % 8,061 100.0 %
Cozine ES 5,413 66.7 % 877 10.8 % 1,329 16.4 % 493 6.1 % 8,111 100.0 %
Cowan Behavior Jr/Sr HS
5,446 37.3 % 3,655 25.0 % 5,503 37.6 % 16 0.1 % 14,619 100.0 %
Cortney JHS 3,817 58.7 % 616 9.5 % 1,426 21.9 % 643 9.9 % 6,501 100.0 %
Cox (David) ES 4,812 68.1 % 581 8.2 % 1,174 16.6 % 495 7.0 % 7,063 100.0 %
Cox (Clyde) ES 6,755 69.1 % 1,044 10.7 % 1,426 14.6 % 552 5.6 % 9,777 100.0 %
Cowan Sunset SE HS 15,892 60.0 % 2,722 10.3 % 2,628 9.9 % 5,236 19.8 % 26,478 100.0 %
Del Sol HS 3,854 59.0 % 645 9.9 % 1,546 23.7 % 491 7.5 % 6,535 100.0 %
Dailey ES 7,347 71.1 % 768 7.4 % 1,590 15.4 % 624 6.0 % 10,329 100.0 %
Cunningham ES 5,724 67.2 % 844 9.9 % 1,395 16.4 % 554 6.5 % 8,517 100.0 %
Culley ES 6,687 71.1 % 870 9.3 % 1,307 13.9 % 537 5.7 % 9,401 100.0 %
Decker ES 5,455 63.9 % 1,036 12.1 % 1,424 16.7 % 623 7.3 % 8,537 100.0 %
Dearing ES 6,107 67.5 % 911 10.1 % 1,463 16.2 % 562 6.2 % 9,042 100.0 %
Darnell ES 5,066 66.4 % 607 8.0 % 1,308 17.1 % 649 8.5 % 7,630 100.0 %
Coronado HS 3,169 58.3 % 576 10.6 % 1,207 22.2 % 484 8.9 % 5,437 100.0 %
Cambeiro ES 6,808 66.2 % 1,167 11.4 % 1,686 16.4 % 618 6.0 % 10,279 100.0 %
Cahlan ES 6,851 71.7 % 538 5.6 % 1,732 18.1 % 430 4.5 % 9,551 100.0 %
Cadwallader MS 3,782 62.2 % 491 8.1 % 1,267 20.8 % 540 8.9 % 6,080 100.0 %
Canyon Springs HS 3,674 58.6 % 708 11.3 % 1,433 22.9 % 454 7.2 % 6,270 100.0 %
Cannon JHS 4,164 60.3 % 633 9.2 % 1,560 22.6 % 547 7.9 % 6,905 100.0 %
Canarelli MS 3,442 59.7 % 490 8.5 % 1,262 21.9 % 570 9.9 % 5,764 100.0 %
Bryan (Roger) ES 5,411 65.2 % 944 11.4 % 1,330 16.0 % 617 7.4 % 8,302 100.0 %
Cortez ES 6,363 66.4 % 900 9.4 % 1,735 18.1 % 587 6.1 % 9,584 100.0 %
Burkholder JHS 4,008 58.7 % 604 8.9 % 1,549 22.7 % 661 9.7 % 6,822 100.0 %
Burk Horizon SW HS 6,421 56.6 % 1,556 13.7 % 1,691 14.9 % 1,682 14.8 % 11,351 100.0 %
Bunker ES 6,616 64.4 % 1,271 12.4 % 1,693 16.5 % 695 6.8 % 10,275 100.0 %
Carl ES 5,095 65.1 % 859 11.0 % 1,327 17.0 % 544 7.0 % 7,825 100.0 %
Christensen ES 4,827 65.2 % 752 10.2 % 1,242 16.8 % 579 7.8 % 7,400 100.0 %
Child Haven 12,497 77.5 % 1,585 9.8 % 213 1.3 % 1,827 11.3 % 16,122 100.0 %
Cheyenne HS 3,985 60.2 % 623 9.4 % 1,497 22.6 % 513 7.8 % 6,618 100.0 %
Conners ES 5,143 66.0 % 847 10.9 % 1,292 16.6 % 511 6.6 % 7,792 100.0 %
Clark HS 3,867 59.0 % 640 9.8 % 1,566 23.9 % 478 7.3 % 6,551 100.0 %
Cimarron-Memorial HS 3,926 61.3 % 561 8.8 % 1,367 21.4 % 548 8.6 % 6,401 100.0 %
Cashman MS 5,066 61.7 % 873 10.6 % 1,683 20.5 % 591 7.2 % 8,214 100.0 %
Cartwright ES 5,609 66.8 % 860 10.2 % 1,315 15.6 % 617 7.3 % 8,401 100.0 %
Carson ES 7,570 55.4 % 1,328 9.7 % 2,893 21.2 % 1,882 13.8 % 13,673 100.0 %
Centennial HS 3,895 60.6 % 674 10.5 % 1,343 20.9 % 515 8.0 % 6,426 100.0 %
Chaparral HS 3,803 60.0 % 660 10.4 % 1,428 22.5 % 452 7.1 % 6,342 100.0 %
CC Detention 236 67.8 % 46 13.3 % 64 18.5 % 1 0.4 % 348 100.0 %
Clark County Schools
Schools showing only $0 have not been in operation long enough to have data for 2007-2008.
Instruction Instructional Support Operations Leadership Total Operating Expenditures
$ % $ % $ % $ % $ %
Page 77 of 125

2008-2009 Accountability Report
Website: www.nevadareportcard.com Clark County School District
Garehime ES 5,538 66.2 % 943 11.3 % 1,318 15.8 % 564 6.7 % 8,363 100.0 %
Galloway ES 5,012 66.0 % 770 10.1 % 1,189 15.7 % 620 8.2 % 7,591 100.0 %
Fyfe ES 6,748 65.4 % 1,276 12.4 % 1,527 14.8 % 762 7.4 % 10,314 100.0 %
Gehring ES 4,791 64.7 % 815 11.0 % 1,255 16.9 % 547 7.4 % 7,409 100.0 %
Garside JHS 3,885 60.1 % 629 9.7 % 1,339 20.7 % 609 9.4 % 6,462 100.0 %
Garrett JHS 4,887 59.2 % 789 9.6 % 1,791 21.7 % 795 9.6 % 8,261 100.0 %
Frias ES 5,261 69.3 % 713 9.4 % 1,176 15.5 % 443 5.8 % 7,593 100.0 %
Foothill HS 3,620 59.6 % 633 10.4 % 1,358 22.4 % 463 7.6 % 6,073 100.0 %
Fong ES 6,202 68.9 % 819 9.1 % 1,346 14.9 % 636 7.1 % 9,003 100.0 %
French ES 5,851 64.1 % 1,078 11.8 % 1,509 16.5 % 693 7.6 % 9,132 100.0 %
Fremont MS 5,039 63.4 % 873 11.0 % 1,387 17.5 % 650 8.2 % 7,949 100.0 %
Forbuss ES 1,006 40.7 % 325 13.2 % 1,091 44.1 % 49 2.0 % 2,470 100.0 %
Goolsby ES 5,937 68.7 % 783 9.1 % 1,304 15.1 % 617 7.1 % 8,641 100.0 %
Goodsprings ES 12,852 36.0 % 14,717 41.3 % 5,872 16.5 % 2,217 6.2 % 35,657 100.0 %
Gilbert ES 6,500 61.4 % 1,336 12.6 % 1,834 17.3 % 922 8.7 % 10,592 100.0 %
Gibson (Robert) MS 4,194 62.1 % 627 9.3 % 1,383 20.5 % 551 8.2 % 6,755 100.0 %
Gibson (James) ES 4,993 64.3 % 819 10.6 % 1,348 17.4 % 603 7.8 % 7,764 100.0 %
Goldfarb ES 4,604 66.3 % 597 8.6 % 1,233 17.8 % 509 7.3 % 6,943 100.0 %
Global Community HS 5,206 52.7 % 1,738 17.6 % 2,121 21.5 % 819 8.3 % 9,885 100.0 %
Givens ES 4,922 68.2 % 587 8.1 % 1,248 17.3 % 464 6.4 % 7,221 100.0 %
Findlay MS 3,500 58.7 % 592 9.9 % 1,336 22.4 % 530 8.9 % 5,959 100.0 %
Diaz ES 0 0.0 % 0 0.0 % 0 0.0 % 0 0.0 % 0 100.0 %
Detwiler ES 6,157 65.2 % 1,019 10.8 % 1,560 16.5 % 704 7.5 % 9,439 100.0 %
Deskin ES 5,191 68.5 % 641 8.5 % 1,279 16.9 % 472 6.2 % 7,582 100.0 %
Dondero ES 6,009 67.0 % 872 9.7 % 1,417 15.8 % 665 7.4 % 8,963 100.0 %
Diskin ES 5,427 63.5 % 917 10.7 % 1,508 17.6 % 699 8.2 % 8,551 100.0 %
Dickens ES 2,789 52.5 % 666 12.5 % 1,361 25.6 % 498 9.4 % 5,314 100.0 %
Derfelt ES 5,513 62.3 % 1,022 11.6 % 1,554 17.6 % 757 8.6 % 8,846 100.0 %
Fitzgerald ES 7,515 64.2 % 1,229 10.5 % 2,135 18.2 % 832 7.1 % 11,711 100.0 %
Desert Rose HS 0 0.0 % 0 0.0 % 0 0.0 % 0 0.0 % 0 100.0 %
Desert Pines HS 3,664 58.7 % 669 10.7 % 1,395 22.4 % 512 8.2 % 6,240 100.0 %
Desert Oasis HS 0 0.0 % 0 0.0 % 0 0.0 % 0 0.0 % 0 100.0 %
Dooley ES 5,835 66.6 % 890 10.2 % 1,354 15.5 % 683 7.8 % 8,760 100.0 %
Escobedo MS 3,834 55.4 % 574 8.3 % 1,808 26.1 % 707 10.2 % 6,923 100.0 %
Elizondo ES 4,621 65.4 % 678 9.6 % 1,270 18.0 % 492 7.0 % 7,060 100.0 %
Eldorado HS 3,964 60.7 % 697 10.7 % 1,316 20.2 % 548 8.4 % 6,526 100.0 %
Fertitta MS 3,216 58.4 % 559 10.1 % 1,274 23.1 % 458 8.3 % 5,507 100.0 %
Ferron ES 5,757 63.4 % 1,105 12.2 % 1,528 16.8 % 697 7.7 % 9,088 100.0 %
Faiss MS 3,568 55.9 % 594 9.3 % 1,669 26.2 % 551 8.6 % 6,383 100.0 %
Earl (Marion) ES 5,472 65.7 % 795 9.6 % 1,416 17.0 % 640 7.7 % 8,322 100.0 %
Earl (Ira) ES 5,724 67.8 % 784 9.3 % 1,369 16.2 % 568 6.7 % 8,444 100.0 %
Durango HS 3,970 61.2 % 613 9.4 % 1,440 22.2 % 467 7.2 % 6,490 100.0 %
Edwards ES 6,277 67.0 % 985 10.5 % 1,495 16.0 % 612 6.5 % 9,369 100.0 %
Eisenberg ES 5,864 66.5 % 950 10.8 % 1,391 15.8 % 611 6.9 % 8,816 100.0 %
East CTA 0 0.0 % 0 0.0 % 0 0.0 % 0 0.0 % 0 100.0 %
Clark County Schools
Schools showing only $0 have not been in operation long enough to have data for 2007-2008.
Instruction Instructional Support Operations Leadership Total Operating Expenditures
$ % $ % $ % $ % $ %
Page 78 of 125
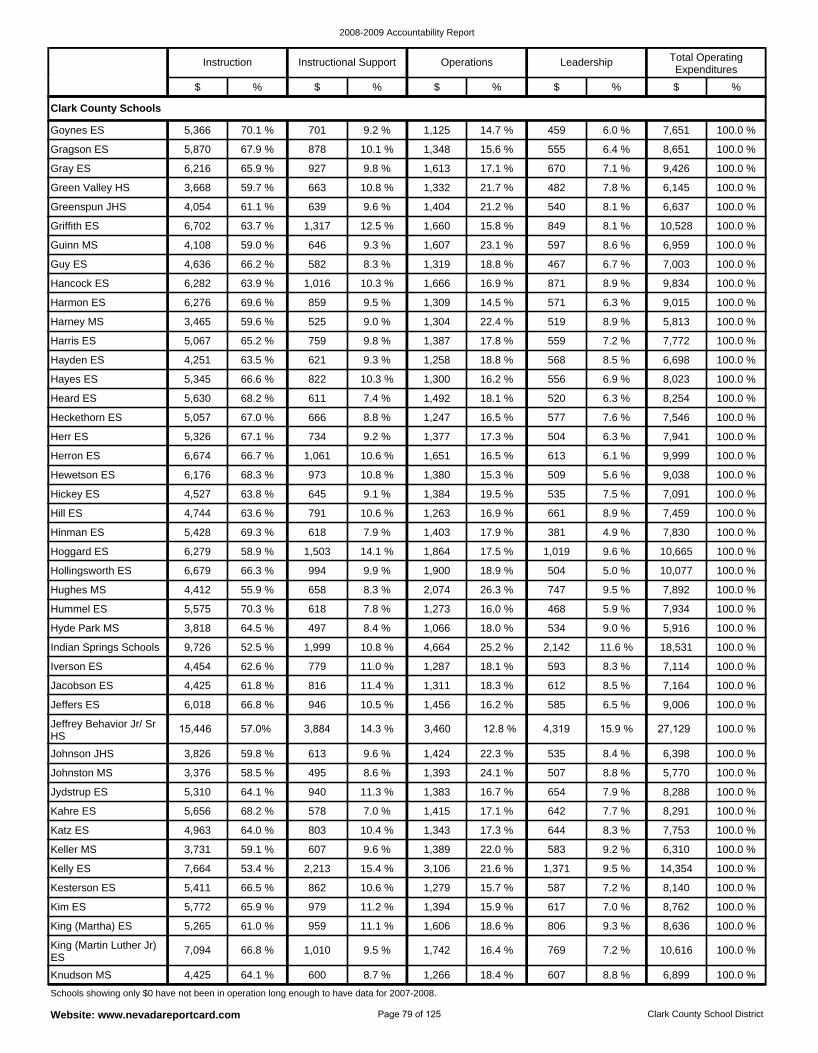
2008-2009 Accountability Report
Website: www.nevadareportcard.com Clark County School District
Johnston MS 3,376 58.5 % 495 8.6 % 1,393 24.1 % 507 8.8 % 5,770 100.0 %
Johnson JHS 3,826 59.8 % 613 9.6 % 1,424 22.3 % 535 8.4 % 6,398 100.0 %
Jeffrey Behavior Jr/ Sr HS
15,446 57.0% 3,884 14.3 % 3,460 12.8 % 4,319 15.9 % 27,129 100.0 %
Katz ES 4,963 64.0 % 803 10.4 % 1,343 17.3 % 644 8.3 % 7,753 100.0 %
Kahre ES 5,656 68.2 % 578 7.0 % 1,415 17.1 % 642 7.7 % 8,291 100.0 %
Jydstrup ES 5,310 64.1 % 940 11.3 % 1,383 16.7 % 654 7.9 % 8,288 100.0 %
Jeffers ES 6,018 66.8 % 946 10.5 % 1,456 16.2 % 585 6.5 % 9,006 100.0 %
Hyde Park MS 3,818 64.5 % 497 8.4 % 1,066 18.0 % 534 9.0 % 5,916 100.0 %
Hummel ES 5,575 70.3 % 618 7.8 % 1,273 16.0 % 468 5.9 % 7,934 100.0 %
Jacobson ES 4,425 61.8 % 816 11.4 % 1,311 18.3 % 612 8.5 % 7,164 100.0 %
Iverson ES 4,454 62.6 % 779 11.0 % 1,287 18.1 % 593 8.3 % 7,114 100.0 %
Indian Springs Schools 9,726 52.5 % 1,999 10.8 % 4,664 25.2 % 2,142 11.6 % 18,531 100.0 %
Knudson MS 4,425 64.1 % 600 8.7 % 1,266 18.4 % 607 8.8 % 6,899 100.0 %
Kesterson ES 5,411 66.5 % 862 10.6 % 1,279 15.7 % 587 7.2 % 8,140 100.0 %
Kelly ES 7,664 53.4 % 2,213 15.4 % 3,106 21.6 % 1,371 9.5 % 14,354 100.0 %
Keller MS 3,731 59.1 % 607 9.6 % 1,389 22.0 % 583 9.2 % 6,310 100.0 %
King (Martin Luther Jr) ES
7,094 66.8 % 1,010 9.5 % 1,742 16.4 % 769 7.2 % 10,616 100.0 %
King (Martha) ES 5,265 61.0 % 959 11.1 % 1,606 18.6 % 806 9.3 % 8,636 100.0 %
Kim ES 5,772 65.9 % 979 11.2 % 1,394 15.9 % 617 7.0 % 8,762 100.0 %
Hollingsworth ES 6,679 66.3 % 994 9.9 % 1,900 18.9 % 504 5.0 % 10,077 100.0 %
Guinn MS 4,108 59.0 % 646 9.3 % 1,607 23.1 % 597 8.6 % 6,959 100.0 %
Griffith ES 6,702 63.7 % 1,317 12.5 % 1,660 15.8 % 849 8.1 % 10,528 100.0 %
Greenspun JHS 4,054 61.1 % 639 9.6 % 1,404 21.2 % 540 8.1 % 6,637 100.0 %
Harmon ES 6,276 69.6 % 859 9.5 % 1,309 14.5 % 571 6.3 % 9,015 100.0 %
Hancock ES 6,282 63.9 % 1,016 10.3 % 1,666 16.9 % 871 8.9 % 9,834 100.0 %
Guy ES 4,636 66.2 % 582 8.3 % 1,319 18.8 % 467 6.7 % 7,003 100.0 %
Goynes ES 5,366 70.1 % 701 9.2 % 1,125 14.7 % 459 6.0 % 7,651 100.0 %
Hughes MS 4,412 55.9 % 658 8.3 % 2,074 26.3 % 747 9.5 % 7,892 100.0 %
Green Valley HS 3,668 59.7 % 663 10.8 % 1,332 21.7 % 482 7.8 % 6,145 100.0 %
Gray ES 6,216 65.9 % 927 9.8 % 1,613 17.1 % 670 7.1 % 9,426 100.0 %
Gragson ES 5,870 67.9 % 878 10.1 % 1,348 15.6 % 555 6.4 % 8,651 100.0 %
Harney MS 3,465 59.6 % 525 9.0 % 1,304 22.4 % 519 8.9 % 5,813 100.0 %
Hickey ES 4,527 63.8 % 645 9.1 % 1,384 19.5 % 535 7.5 % 7,091 100.0 %
Hewetson ES 6,176 68.3 % 973 10.8 % 1,380 15.3 % 509 5.6 % 9,038 100.0 %
Herron ES 6,674 66.7 % 1,061 10.6 % 1,651 16.5 % 613 6.1 % 9,999 100.0 %
Hoggard ES 6,279 58.9 % 1,503 14.1 % 1,864 17.5 % 1,019 9.6 % 10,665 100.0 %
Hinman ES 5,428 69.3 % 618 7.9 % 1,403 17.9 % 381 4.9 % 7,830 100.0 %
Hill ES 4,744 63.6 % 791 10.6 % 1,263 16.9 % 661 8.9 % 7,459 100.0 %
Hayes ES 5,345 66.6 % 822 10.3 % 1,300 16.2 % 556 6.9 % 8,023 100.0 %
Hayden ES 4,251 63.5 % 621 9.3 % 1,258 18.8 % 568 8.5 % 6,698 100.0 %
Harris ES 5,067 65.2 % 759 9.8 % 1,387 17.8 % 559 7.2 % 7,772 100.0 %
Heckethorn ES 5,057 67.0 % 666 8.8 % 1,247 16.5 % 577 7.6 % 7,546 100.0 %
Herr ES 5,326 67.1 % 734 9.2 % 1,377 17.3 % 504 6.3 % 7,941 100.0 %
Heard ES 5,630 68.2 % 611 7.4 % 1,492 18.1 % 520 6.3 % 8,254 100.0 %
Clark County Schools
Schools showing only $0 have not been in operation long enough to have data for 2007-2008.
Instruction Instructional Support Operations Leadership Total Operating Expenditures
$ % $ % $ % $ % $ %
Page 79 of 125
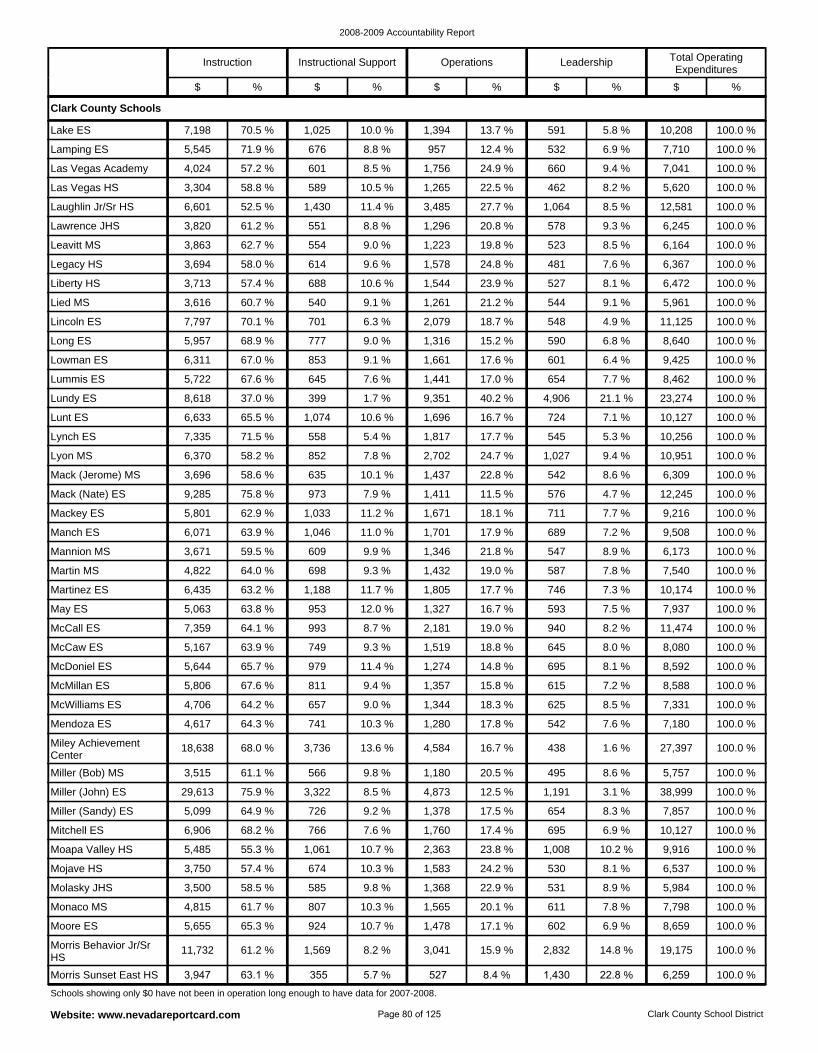
2008-2009 Accountability Report
Website: www.nevadareportcard.com Clark County School District
Miller (Bob) MS 3,515 61.1 % 566 9.8 % 1,180 20.5 % 495 8.6 % 5,757 100.0 %
Miley Achievement Center
18,638 68.0 % 3,736 13.6 % 4,584 16.7 % 438 1.6 % 27,397 100.0 %
Mendoza ES 4,617 64.3 % 741 10.3 % 1,280 17.8 % 542 7.6 % 7,180 100.0 %
Mitchell ES 6,906 68.2 % 766 7.6 % 1,760 17.4 % 695 6.9 % 10,127 100.0 %
Miller (Sandy) ES 5,099 64.9 % 726 9.2 % 1,378 17.5 % 654 8.3 % 7,857 100.0 %
Miller (John) ES 29,613 75.9 % 3,322 8.5 % 4,873 12.5 % 1,191 3.1 % 38,999 100.0 %
McWilliams ES 4,706 64.2 % 657 9.0 % 1,344 18.3 % 625 8.5 % 7,331 100.0 %
McCall ES 7,359 64.1 % 993 8.7 % 2,181 19.0 % 940 8.2 % 11,474 100.0 %
May ES 5,063 63.8 % 953 12.0 % 1,327 16.7 % 593 7.5 % 7,937 100.0 %
McMillan ES 5,806 67.6 % 811 9.4 % 1,357 15.8 % 615 7.2 % 8,588 100.0 %
McDoniel ES 5,644 65.7 % 979 11.4 % 1,274 14.8 % 695 8.1 % 8,592 100.0 %
McCaw ES 5,167 63.9 % 749 9.3 % 1,519 18.8 % 645 8.0 % 8,080 100.0 %
Morris Sunset East HS 3,947 63.1 % 355 5.7 % 527 8.4 % 1,430 22.8 % 6,259 100.0 %
Molasky JHS 3,500 58.5 % 585 9.8 % 1,368 22.9 % 531 8.9 % 5,984 100.0 %
Mojave HS 3,750 57.4 % 674 10.3 % 1,583 24.2 % 530 8.1 % 6,537 100.0 %
Moapa Valley HS 5,485 55.3 % 1,061 10.7 % 2,363 23.8 % 1,008 10.2 % 9,916 100.0 %
Morris Behavior Jr/Sr HS
11,732 61.2 % 1,569 8.2 % 3,041 15.9 % 2,832 14.8 % 19,175 100.0 %
Moore ES 5,655 65.3 % 924 10.7 % 1,478 17.1 % 602 6.9 % 8,659 100.0 %
Monaco MS 4,815 61.7 % 807 10.3 % 1,565 20.1 % 611 7.8 % 7,798 100.0 %
Martin MS 4,822 64.0 % 698 9.3 % 1,432 19.0 % 587 7.8 % 7,540 100.0 %
Leavitt MS 3,863 62.7 % 554 9.0 % 1,223 19.8 % 523 8.5 % 6,164 100.0 %
Lawrence JHS 3,820 61.2 % 551 8.8 % 1,296 20.8 % 578 9.3 % 6,245 100.0 %
Laughlin Jr/Sr HS 6,601 52.5 % 1,430 11.4 % 3,485 27.7 % 1,064 8.5 % 12,581 100.0 %
Lied MS 3,616 60.7 % 540 9.1 % 1,261 21.2 % 544 9.1 % 5,961 100.0 %
Liberty HS 3,713 57.4 % 688 10.6 % 1,544 23.9 % 527 8.1 % 6,472 100.0 %
Legacy HS 3,694 58.0 % 614 9.6 % 1,578 24.8 % 481 7.6 % 6,367 100.0 %
Lake ES 7,198 70.5 % 1,025 10.0 % 1,394 13.7 % 591 5.8 % 10,208 100.0 %
Martinez ES 6,435 63.2 % 1,188 11.7 % 1,805 17.7 % 746 7.3 % 10,174 100.0 %
Las Vegas HS 3,304 58.8 % 589 10.5 % 1,265 22.5 % 462 8.2 % 5,620 100.0 %
Las Vegas Academy 4,024 57.2 % 601 8.5 % 1,756 24.9 % 660 9.4 % 7,041 100.0 %
Lamping ES 5,545 71.9 % 676 8.8 % 957 12.4 % 532 6.9 % 7,710 100.0 %
Lincoln ES 7,797 70.1 % 701 6.3 % 2,079 18.7 % 548 4.9 % 11,125 100.0 %
Mack (Nate) ES 9,285 75.8 % 973 7.9 % 1,411 11.5 % 576 4.7 % 12,245 100.0 %
Mack (Jerome) MS 3,696 58.6 % 635 10.1 % 1,437 22.8 % 542 8.6 % 6,309 100.0 %
Lyon MS 6,370 58.2 % 852 7.8 % 2,702 24.7 % 1,027 9.4 % 10,951 100.0 %
Mannion MS 3,671 59.5 % 609 9.9 % 1,346 21.8 % 547 8.9 % 6,173 100.0 %
Manch ES 6,071 63.9 % 1,046 11.0 % 1,701 17.9 % 689 7.2 % 9,508 100.0 %
Mackey ES 5,801 62.9 % 1,033 11.2 % 1,671 18.1 % 711 7.7 % 9,216 100.0 %
Lummis ES 5,722 67.6 % 645 7.6 % 1,441 17.0 % 654 7.7 % 8,462 100.0 %
Lowman ES 6,311 67.0 % 853 9.1 % 1,661 17.6 % 601 6.4 % 9,425 100.0 %
Long ES 5,957 68.9 % 777 9.0 % 1,316 15.2 % 590 6.8 % 8,640 100.0 %
Lunt ES 6,633 65.5 % 1,074 10.6 % 1,696 16.7 % 724 7.1 % 10,127 100.0 %
Lynch ES 7,335 71.5 % 558 5.4 % 1,817 17.7 % 545 5.3 % 10,256 100.0 %
Lundy ES 8,618 37.0 % 399 1.7 % 9,351 40.2 % 4,906 21.1 % 23,274 100.0 %
Clark County Schools
Schools showing only $0 have not been in operation long enough to have data for 2007-2008.
Instruction Instructional Support Operations Leadership Total Operating Expenditures
$ % $ % $ % $ % $ %
Page 80 of 125
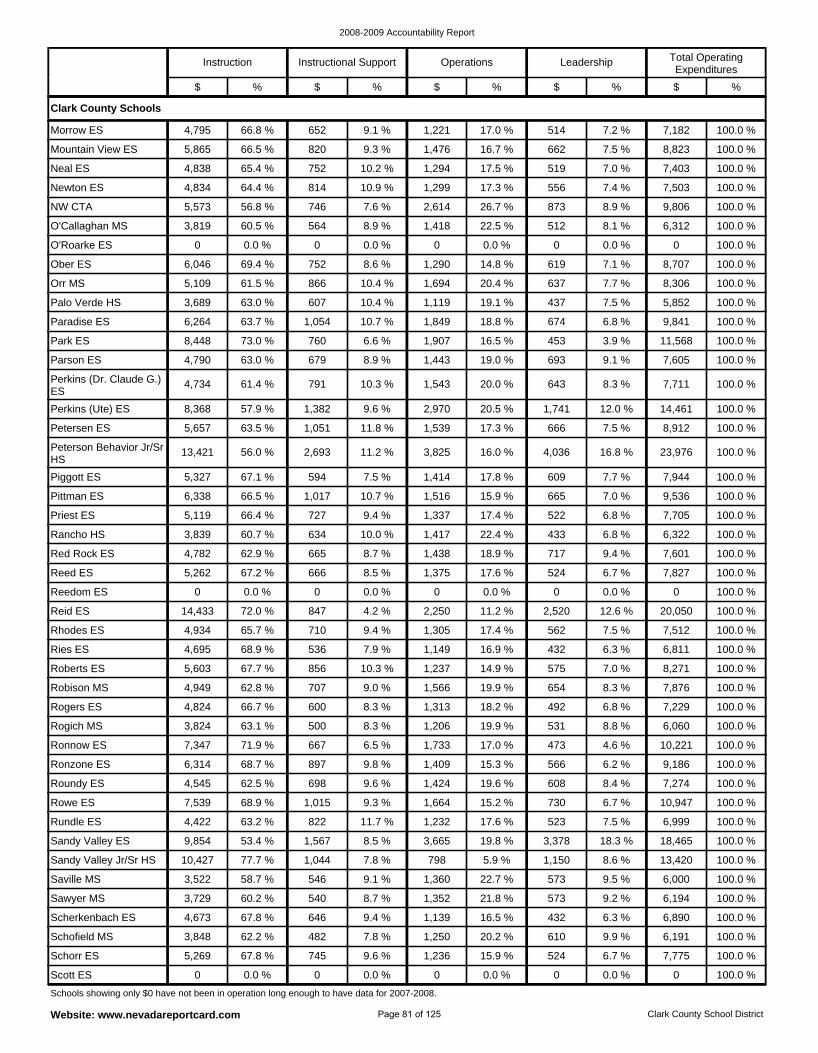
2008-2009 Accountability Report
Website: www.nevadareportcard.com Clark County School District
Roundy ES 4,545 62.5 % 698 9.6 % 1,424 19.6 % 608 8.4 % 7,274 100.0 %
Ronzone ES 6,314 68.7 % 897 9.8 % 1,409 15.3 % 566 6.2 % 9,186 100.0 %
Ronnow ES 7,347 71.9 % 667 6.5 % 1,733 17.0 % 473 4.6 % 10,221 100.0 %
Sandy Valley ES 9,854 53.4 % 1,567 8.5 % 3,665 19.8 % 3,378 18.3 % 18,465 100.0 %
Rundle ES 4,422 63.2 % 822 11.7 % 1,232 17.6 % 523 7.5 % 6,999 100.0 %
Rowe ES 7,539 68.9 % 1,015 9.3 % 1,664 15.2 % 730 6.7 % 10,947 100.0 %
Rogich MS 3,824 63.1 % 500 8.3 % 1,206 19.9 % 531 8.8 % 6,060 100.0 %
Ries ES 4,695 68.9 % 536 7.9 % 1,149 16.9 % 432 6.3 % 6,811 100.0 %
Rhodes ES 4,934 65.7 % 710 9.4 % 1,305 17.4 % 562 7.5 % 7,512 100.0 %
Rogers ES 4,824 66.7 % 600 8.3 % 1,313 18.2 % 492 6.8 % 7,229 100.0 %
Robison MS 4,949 62.8 % 707 9.0 % 1,566 19.9 % 654 8.3 % 7,876 100.0 %
Roberts ES 5,603 67.7 % 856 10.3 % 1,237 14.9 % 575 7.0 % 8,271 100.0 %
Scott ES 0 0.0 % 0 0.0 % 0 0.0 % 0 0.0 % 0 100.0 %
Sawyer MS 3,729 60.2 % 540 8.7 % 1,352 21.8 % 573 9.2 % 6,194 100.0 %
Saville MS 3,522 58.7 % 546 9.1 % 1,360 22.7 % 573 9.5 % 6,000 100.0 %
Sandy Valley Jr/Sr HS 10,427 77.7 % 1,044 7.8 % 798 5.9 % 1,150 8.6 % 13,420 100.0 %
Schorr ES 5,269 67.8 % 745 9.6 % 1,236 15.9 % 524 6.7 % 7,775 100.0 %
Schofield MS 3,848 62.2 % 482 7.8 % 1,250 20.2 % 610 9.9 % 6,191 100.0 %
Scherkenbach ES 4,673 67.8 % 646 9.4 % 1,139 16.5 % 432 6.3 % 6,890 100.0 %
Reedom ES 0 0.0 % 0 0.0 % 0 0.0 % 0 0.0 % 0 100.0 %
O'Roarke ES 0 0.0 % 0 0.0 % 0 0.0 % 0 0.0 % 0 100.0 %
O'Callaghan MS 3,819 60.5 % 564 8.9 % 1,418 22.5 % 512 8.1 % 6,312 100.0 %
NW CTA 5,573 56.8 % 746 7.6 % 2,614 26.7 % 873 8.9 % 9,806 100.0 %
Palo Verde HS 3,689 63.0 % 607 10.4 % 1,119 19.1 % 437 7.5 % 5,852 100.0 %
Orr MS 5,109 61.5 % 866 10.4 % 1,694 20.4 % 637 7.7 % 8,306 100.0 %
Ober ES 6,046 69.4 % 752 8.6 % 1,290 14.8 % 619 7.1 % 8,707 100.0 %
Morrow ES 4,795 66.8 % 652 9.1 % 1,221 17.0 % 514 7.2 % 7,182 100.0 %
Reid ES 14,433 72.0 % 847 4.2 % 2,250 11.2 % 2,520 12.6 % 20,050 100.0 %
Newton ES 4,834 64.4 % 814 10.9 % 1,299 17.3 % 556 7.4 % 7,503 100.0 %
Neal ES 4,838 65.4 % 752 10.2 % 1,294 17.5 % 519 7.0 % 7,403 100.0 %
Mountain View ES 5,865 66.5 % 820 9.3 % 1,476 16.7 % 662 7.5 % 8,823 100.0 %
Paradise ES 6,264 63.7 % 1,054 10.7 % 1,849 18.8 % 674 6.8 % 9,841 100.0 %
Priest ES 5,119 66.4 % 727 9.4 % 1,337 17.4 % 522 6.8 % 7,705 100.0 %
Pittman ES 6,338 66.5 % 1,017 10.7 % 1,516 15.9 % 665 7.0 % 9,536 100.0 %
Piggott ES 5,327 67.1 % 594 7.5 % 1,414 17.8 % 609 7.7 % 7,944 100.0 %
Reed ES 5,262 67.2 % 666 8.5 % 1,375 17.6 % 524 6.7 % 7,827 100.0 %
Red Rock ES 4,782 62.9 % 665 8.7 % 1,438 18.9 % 717 9.4 % 7,601 100.0 %
Rancho HS 3,839 60.7 % 634 10.0 % 1,417 22.4 % 433 6.8 % 6,322 100.0 %
Perkins (Dr. Claude G.) ES
4,734 61.4 % 791 10.3 % 1,543 20.0 % 643 8.3 % 7,711 100.0 %
Parson ES 4,790 63.0 % 679 8.9 % 1,443 19.0 % 693 9.1 % 7,605 100.0 %
Park ES 8,448 73.0 % 760 6.6 % 1,907 16.5 % 453 3.9 % 11,568 100.0 %
Petersen ES 5,657 63.5 % 1,051 11.8 % 1,539 17.3 % 666 7.5 % 8,912 100.0 %
Peterson Behavior Jr/Sr HS
13,421 56.0 % 2,693 11.2 % 3,825 16.0 % 4,036 16.8 % 23,976 100.0 %
Perkins (Ute) ES 8,368 57.9 % 1,382 9.6 % 2,970 20.5 % 1,741 12.0 % 14,461 100.0 %
Clark County Schools
Schools showing only $0 have not been in operation long enough to have data for 2007-2008.
Instruction Instructional Support Operations Leadership Total Operating Expenditures
$ % $ % $ % $ % $ %
Page 81 of 125
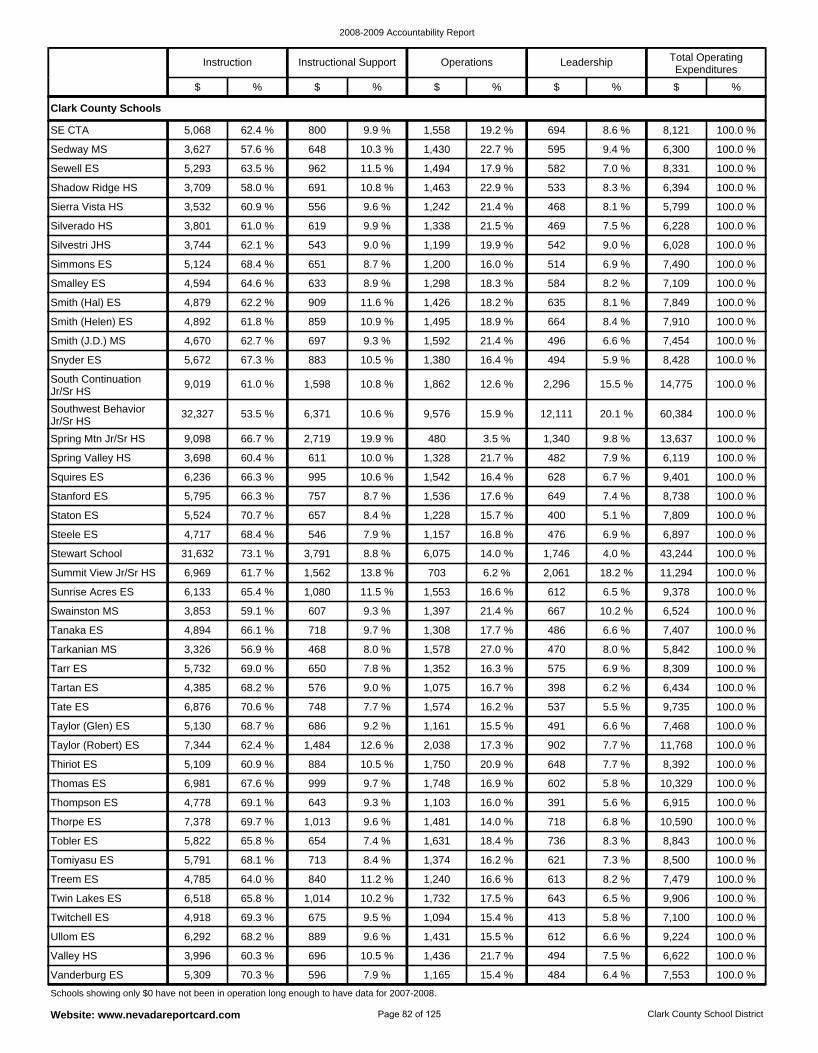
2008-2009 Accountability Report
Website: www.nevadareportcard.com Clark County School District
Thomas ES 6,981 67.6 % 999 9.7 % 1,748 16.9 % 602 5.8 % 10,329 100.0 %
Thiriot ES 5,109 60.9 % 884 10.5 % 1,750 20.9 % 648 7.7 % 8,392 100.0 %
Taylor (Robert) ES 7,344 62.4 % 1,484 12.6 % 2,038 17.3 % 902 7.7 % 11,768 100.0 %
Tobler ES 5,822 65.8 % 654 7.4 % 1,631 18.4 % 736 8.3 % 8,843 100.0 %
Thorpe ES 7,378 69.7 % 1,013 9.6 % 1,481 14.0 % 718 6.8 % 10,590 100.0 %
Thompson ES 4,778 69.1 % 643 9.3 % 1,103 16.0 % 391 5.6 % 6,915 100.0 %
Taylor (Glen) ES 5,130 68.7 % 686 9.2 % 1,161 15.5 % 491 6.6 % 7,468 100.0 %
Tarkanian MS 3,326 56.9 % 468 8.0 % 1,578 27.0 % 470 8.0 % 5,842 100.0 %
Tanaka ES 4,894 66.1 % 718 9.7 % 1,308 17.7 % 486 6.6 % 7,407 100.0 %
Tate ES 6,876 70.6 % 748 7.7 % 1,574 16.2 % 537 5.5 % 9,735 100.0 %
Tartan ES 4,385 68.2 % 576 9.0 % 1,075 16.7 % 398 6.2 % 6,434 100.0 %
Tarr ES 5,732 69.0 % 650 7.8 % 1,352 16.3 % 575 6.9 % 8,309 100.0 %
Vanderburg ES 5,309 70.3 % 596 7.9 % 1,165 15.4 % 484 6.4 % 7,553 100.0 %
Twin Lakes ES 6,518 65.8 % 1,014 10.2 % 1,732 17.5 % 643 6.5 % 9,906 100.0 %
Treem ES 4,785 64.0 % 840 11.2 % 1,240 16.6 % 613 8.2 % 7,479 100.0 %
Tomiyasu ES 5,791 68.1 % 713 8.4 % 1,374 16.2 % 621 7.3 % 8,500 100.0 %
Valley HS 3,996 60.3 % 696 10.5 % 1,436 21.7 % 494 7.5 % 6,622 100.0 %
Ullom ES 6,292 68.2 % 889 9.6 % 1,431 15.5 % 612 6.6 % 9,224 100.0 %
Twitchell ES 4,918 69.3 % 675 9.5 % 1,094 15.4 % 413 5.8 % 7,100 100.0 %
Sunrise Acres ES 6,133 65.4 % 1,080 11.5 % 1,553 16.6 % 612 6.5 % 9,378 100.0 %
Silvestri JHS 3,744 62.1 % 543 9.0 % 1,199 19.9 % 542 9.0 % 6,028 100.0 %
Silverado HS 3,801 61.0 % 619 9.9 % 1,338 21.5 % 469 7.5 % 6,228 100.0 %
Sierra Vista HS 3,532 60.9 % 556 9.6 % 1,242 21.4 % 468 8.1 % 5,799 100.0 %
Smith (Hal) ES 4,879 62.2 % 909 11.6 % 1,426 18.2 % 635 8.1 % 7,849 100.0 %
Smalley ES 4,594 64.6 % 633 8.9 % 1,298 18.3 % 584 8.2 % 7,109 100.0 %
Simmons ES 5,124 68.4 % 651 8.7 % 1,200 16.0 % 514 6.9 % 7,490 100.0 %
SE CTA 5,068 62.4 % 800 9.9 % 1,558 19.2 % 694 8.6 % 8,121 100.0 %
Swainston MS 3,853 59.1 % 607 9.3 % 1,397 21.4 % 667 10.2 % 6,524 100.0 %
Shadow Ridge HS 3,709 58.0 % 691 10.8 % 1,463 22.9 % 533 8.3 % 6,394 100.0 %
Sewell ES 5,293 63.5 % 962 11.5 % 1,494 17.9 % 582 7.0 % 8,331 100.0 %
Sedway MS 3,627 57.6 % 648 10.3 % 1,430 22.7 % 595 9.4 % 6,300 100.0 %
Smith (Helen) ES 4,892 61.8 % 859 10.9 % 1,495 18.9 % 664 8.4 % 7,910 100.0 %
Staton ES 5,524 70.7 % 657 8.4 % 1,228 15.7 % 400 5.1 % 7,809 100.0 %
Stanford ES 5,795 66.3 % 757 8.7 % 1,536 17.6 % 649 7.4 % 8,738 100.0 %
Squires ES 6,236 66.3 % 995 10.6 % 1,542 16.4 % 628 6.7 % 9,401 100.0 %
Summit View Jr/Sr HS 6,969 61.7 % 1,562 13.8 % 703 6.2 % 2,061 18.2 % 11,294 100.0 %
Stewart School 31,632 73.1 % 3,791 8.8 % 6,075 14.0 % 1,746 4.0 % 43,244 100.0 %
Steele ES 4,717 68.4 % 546 7.9 % 1,157 16.8 % 476 6.9 % 6,897 100.0 %
South Continuation Jr/Sr HS
9,019 61.0 % 1,598 10.8 % 1,862 12.6 % 2,296 15.5 % 14,775 100.0 %
Snyder ES 5,672 67.3 % 883 10.5 % 1,380 16.4 % 494 5.9 % 8,428 100.0 %
Smith (J.D.) MS 4,670 62.7 % 697 9.3 % 1,592 21.4 % 496 6.6 % 7,454 100.0 %
Spring Mtn Jr/Sr HS 9,098 66.7 % 2,719 19.9 % 480 3.5 % 1,340 9.8 % 13,637 100.0 %
Spring Valley HS 3,698 60.4 % 611 10.0 % 1,328 21.7 % 482 7.9 % 6,119 100.0 %
Southwest Behavior Jr/Sr HS
32,327 53.5 % 6,371 10.6 % 9,576 15.9 % 12,111 20.1 % 60,384 100.0 %
Clark County Schools
Schools showing only $0 have not been in operation long enough to have data for 2007-2008.
Instruction Instructional Support Operations Leadership Total Operating Expenditures
$ % $ % $ % $ % $ %
Page 82 of 125
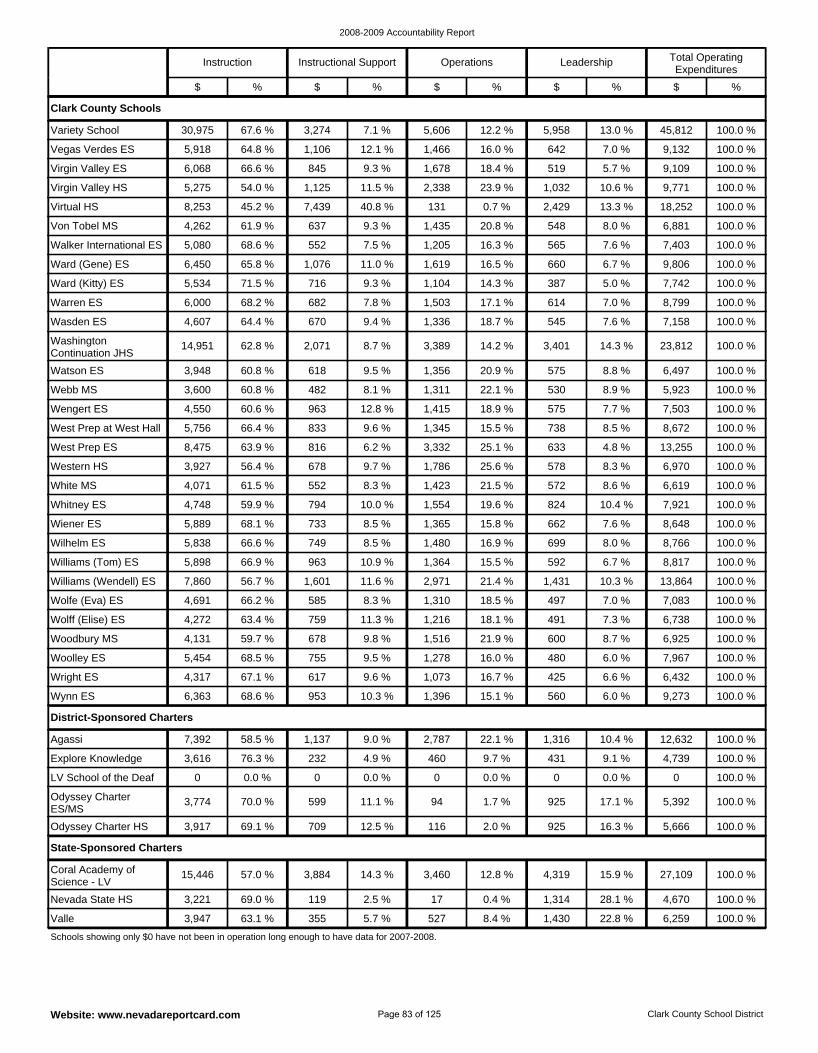
2008-2009 Accountability Report
Website: www.nevadareportcard.com Clark County School District
Nevada State HS 3,221 69.0 % 119 2.5 % 17 0.4 % 1,314 28.1 % 4,670 100.0 %
Valle 3,947 63.1 % 355 5.7 % 527 8.4 % 1,430 22.8 % 6,259 100.0 %
Coral Academy of Science - LV
15,446 57.0 % 3,884 14.3 % 3,460 12.8 % 4,319 15.9 % 27,109 100.0 %
State-Sponsored Charters
LV School of the Deaf 0 0.0 % 0 0.0 % 0 0.0 % 0 0.0 % 0 100.0 %
Explore Knowledge 3,616 76.3 % 232 4.9 % 460 9.7 % 431 9.1 % 4,739 100.0 %
Agassi 7,392 58.5 % 1,137 9.0 % 2,787 22.1 % 1,316 10.4 % 12,632 100.0 %
Odyssey Charter HS 3,917 69.1 % 709 12.5 % 116 2.0 % 925 16.3 % 5,666 100.0 %
Odyssey Charter ES/MS
3,774 70.0 % 599 11.1 % 94 1.7 % 925 17.1 % 5,392 100.0 %
District-Sponsored Charters
Wilhelm ES 5,838 66.6 % 749 8.5 % 1,480 16.9 % 699 8.0 % 8,766 100.0 %
Williams (Tom) ES 5,898 66.9 % 963 10.9 % 1,364 15.5 % 592 6.7 % 8,817 100.0 %
Williams (Wendell) ES 7,860 56.7 % 1,601 11.6 % 2,971 21.4 % 1,431 10.3 % 13,864 100.0 %
Wynn ES 6,363 68.6 % 953 10.3 % 1,396 15.1 % 560 6.0 % 9,273 100.0 %
Whitney ES 4,748 59.9 % 794 10.0 % 1,554 19.6 % 824 10.4 % 7,921 100.0 %
Wiener ES 5,889 68.1 % 733 8.5 % 1,365 15.8 % 662 7.6 % 8,648 100.0 %
Woolley ES 5,454 68.5 % 755 9.5 % 1,278 16.0 % 480 6.0 % 7,967 100.0 %
Wright ES 4,317 67.1 % 617 9.6 % 1,073 16.7 % 425 6.6 % 6,432 100.0 %
White MS 4,071 61.5 % 552 8.3 % 1,423 21.5 % 572 8.6 % 6,619 100.0 %
Wolfe (Eva) ES 4,691 66.2 % 585 8.3 % 1,310 18.5 % 497 7.0 % 7,083 100.0 %
Wolff (Elise) ES 4,272 63.4 % 759 11.3 % 1,216 18.1 % 491 7.3 % 6,738 100.0 %
Woodbury MS 4,131 59.7 % 678 9.8 % 1,516 21.9 % 600 8.7 % 6,925 100.0 %
Walker International ES 5,080 68.6 % 552 7.5 % 1,205 16.3 % 565 7.6 % 7,403 100.0 %
Von Tobel MS 4,262 61.9 % 637 9.3 % 1,435 20.8 % 548 8.0 % 6,881 100.0 %
Ward (Kitty) ES 5,534 71.5 % 716 9.3 % 1,104 14.3 % 387 5.0 % 7,742 100.0 %
Ward (Gene) ES 6,450 65.8 % 1,076 11.0 % 1,619 16.5 % 660 6.7 % 9,806 100.0 %
Virtual HS 8,253 45.2 % 7,439 40.8 % 131 0.7 % 2,429 13.3 % 18,252 100.0 %
Vegas Verdes ES 5,918 64.8 % 1,106 12.1 % 1,466 16.0 % 642 7.0 % 9,132 100.0 %
Variety School 30,975 67.6 % 3,274 7.1 % 5,606 12.2 % 5,958 13.0 % 45,812 100.0 %
Virgin Valley HS 5,275 54.0 % 1,125 11.5 % 2,338 23.9 % 1,032 10.6 % 9,771 100.0 %
Virgin Valley ES 6,068 66.6 % 845 9.3 % 1,678 18.4 % 519 5.7 % 9,109 100.0 %
West Prep at West Hall 5,756 66.4 % 833 9.6 % 1,345 15.5 % 738 8.5 % 8,672 100.0 %
Wengert ES 4,550 60.6 % 963 12.8 % 1,415 18.9 % 575 7.7 % 7,503 100.0 %
Western HS 3,927 56.4 % 678 9.7 % 1,786 25.6 % 578 8.3 % 6,970 100.0 %
West Prep ES 8,475 63.9 % 816 6.2 % 3,332 25.1 % 633 4.8 % 13,255 100.0 %
Webb MS 3,600 60.8 % 482 8.1 % 1,311 22.1 % 530 8.9 % 5,923 100.0 %
Wasden ES 4,607 64.4 % 670 9.4 % 1,336 18.7 % 545 7.6 % 7,158 100.0 %
Warren ES 6,000 68.2 % 682 7.8 % 1,503 17.1 % 614 7.0 % 8,799 100.0 %
Watson ES 3,948 60.8 % 618 9.5 % 1,356 20.9 % 575 8.8 % 6,497 100.0 %
Washington Continuation JHS
14,951 62.8 % 2,071 8.7 % 3,389 14.2 % 3,401 14.3 % 23,812 100.0 %
Clark County Schools
Schools showing only $0 have not been in operation long enough to have data for 2007-2008.
Instruction Instructional Support Operations Leadership Total Operating Expenditures
$ % $ % $ % $ % $ %
Page 83 of 125
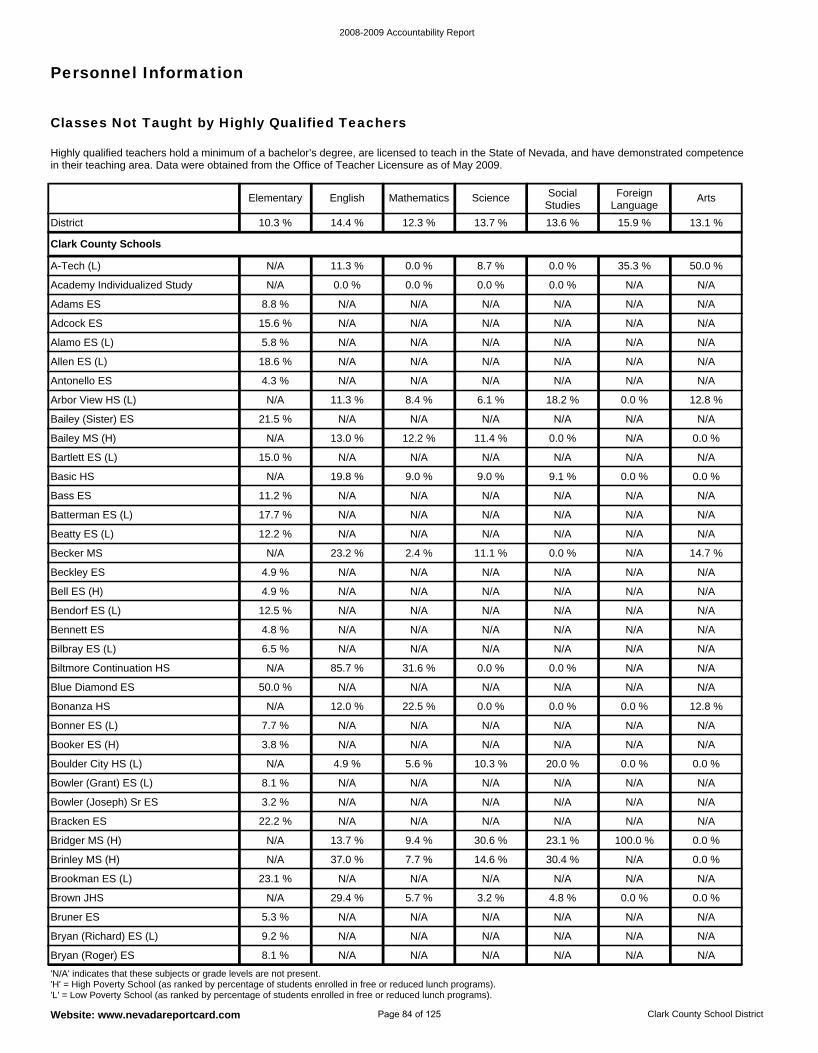
2008-2009 Accountability Report
Website: www.nevadareportcard.com Clark County School District
Personnel Information
Classes Not Taught by Highly Qualified Teachers
Highly qualified teachers hold a minimum of a bachelor’s degree, are licensed to teach in the State of Nevada, and have demonstrated competence in their teaching area. Data were obtained from the Office of Teacher Licensure as of May 2009.
Brookman ES (L) 23.1 % N/A N/A N/A N/A N/A N/A
Brinley MS (H) N/A 37.0 % 7.7 % 14.6 % 30.4 % N/A 0.0 %
Bridger MS (H) N/A 13.7 % 9.4 % 30.6 % 23.1 % 100.0 % 0.0 %
Bryan (Richard) ES (L) 9.2 % N/A N/A N/A N/A N/A N/A
Bruner ES 5.3 % N/A N/A N/A N/A N/A N/A
Brown JHS N/A 29.4 % 5.7 % 3.2 % 4.8 % 0.0 % 0.0 %
Bracken ES 22.2 % N/A N/A N/A N/A N/A N/A
Booker ES (H) 3.8 % N/A N/A N/A N/A N/A N/A
Bonner ES (L) 7.7 % N/A N/A N/A N/A N/A N/A
Bowler (Joseph) Sr ES 3.2 % N/A N/A N/A N/A N/A N/A
Bowler (Grant) ES (L) 8.1 % N/A N/A N/A N/A N/A N/A
Boulder City HS (L) N/A 4.9 % 5.6 % 10.3 % 20.0 % 0.0 % 0.0 %
Bryan (Roger) ES 8.1 % N/A N/A N/A N/A N/A N/A
Arbor View HS (L) N/A 11.3 % 8.4 % 6.1 % 18.2 % 0.0 % 12.8 %
Antonello ES 4.3 % N/A N/A N/A N/A N/A N/A
Allen ES (L) 18.6 % N/A N/A N/A N/A N/A N/A
Bartlett ES (L) 15.0 % N/A N/A N/A N/A N/A N/A
Bailey MS (H) N/A 13.0 % 12.2 % 11.4 % 0.0 % N/A 0.0 %
Bailey (Sister) ES 21.5 % N/A N/A N/A N/A N/A N/A
Academy Individualized Study N/A 0.0 % 0.0 % 0.0 % 0.0 % N/A N/A
A-Tech (L) N/A 11.3 % 0.0 % 8.7 % 0.0 % 35.3 % 50.0 %
Bonanza HS N/A 12.0 % 22.5 % 0.0 % 0.0 % 0.0 % 12.8 %
Alamo ES (L) 5.8 % N/A N/A N/A N/A N/A N/A
Adcock ES 15.6 % N/A N/A N/A N/A N/A N/A
Adams ES 8.8 % N/A N/A N/A N/A N/A N/A
Bennett ES 4.8 % N/A N/A N/A N/A N/A N/A
Bendorf ES (L) 12.5 % N/A N/A N/A N/A N/A N/A
Bell ES (H) 4.9 % N/A N/A N/A N/A N/A N/A
Blue Diamond ES 50.0 % N/A N/A N/A N/A N/A N/A
Biltmore Continuation HS N/A 85.7 % 31.6 % 0.0 % 0.0 % N/A N/A
Bilbray ES (L) 6.5 % N/A N/A N/A N/A N/A N/A
Batterman ES (L) 17.7 % N/A N/A N/A N/A N/A N/A
Bass ES 11.2 % N/A N/A N/A N/A N/A N/A
Basic HS N/A 19.8 % 9.0 % 9.0 % 9.1 % 0.0 % 0.0 %
Beckley ES 4.9 % N/A N/A N/A N/A N/A N/A
Becker MS N/A 23.2 % 2.4 % 11.1 % 0.0 % N/A 14.7 %
Beatty ES (L) 12.2 % N/A N/A N/A N/A N/A N/A
Clark County Schools
District 10.3 % 14.4 % 12.3 % 13.7 % 13.6 % 15.9 % 13.1 %
'N/A' indicates that these subjects or grade levels are not present. 'H' = High Poverty School (as ranked by percentage of students enrolled in free or reduced lunch programs). 'L' = Low Poverty School (as ranked by percentage of students enrolled in free or reduced lunch programs).
Elementary English Mathematics Science Social Studies
Foreign Language
Arts
Page 84 of 125
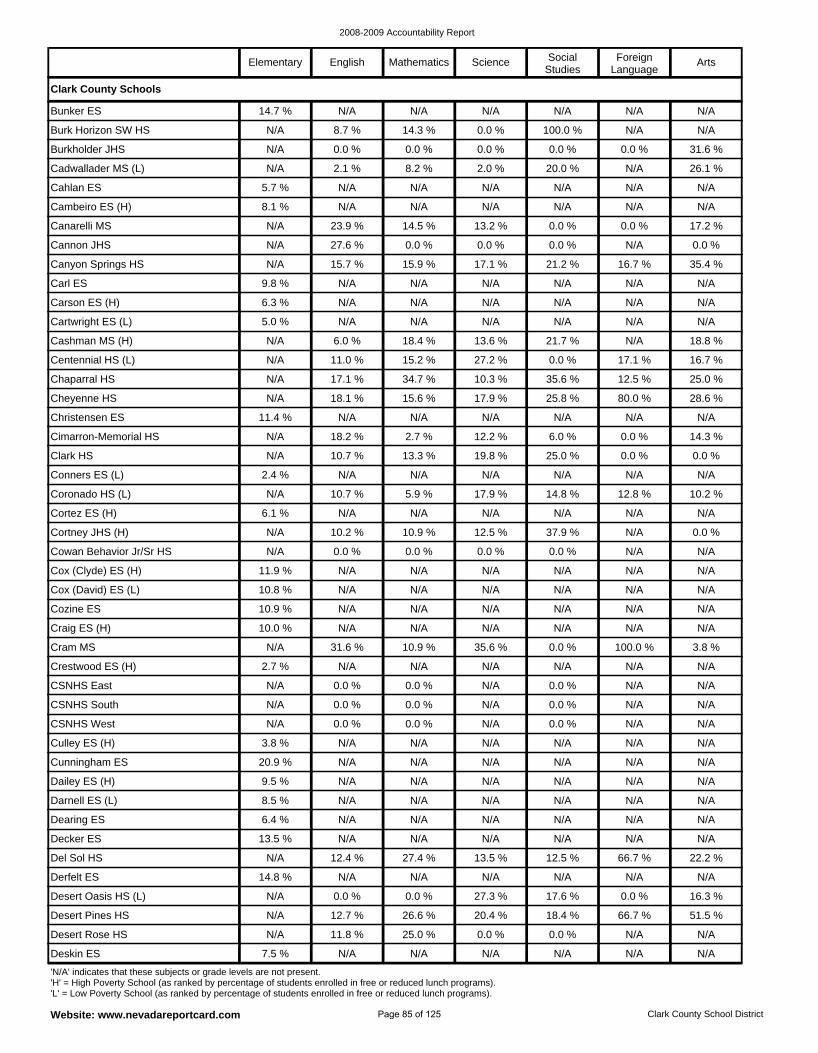
2008-2009 Accountability Report
Website: www.nevadareportcard.com Clark County School District
Cunningham ES 20.9 % N/A N/A N/A N/A N/A N/A
Culley ES (H) 3.8 % N/A N/A N/A N/A N/A N/A
CSNHS West N/A 0.0 % 0.0 % N/A 0.0 % N/A N/A
Dearing ES 6.4 % N/A N/A N/A N/A N/A N/A
Darnell ES (L) 8.5 % N/A N/A N/A N/A N/A N/A
Dailey ES (H) 9.5 % N/A N/A N/A N/A N/A N/A
CSNHS South N/A 0.0 % 0.0 % N/A 0.0 % N/A N/A
Craig ES (H) 10.0 % N/A N/A N/A N/A N/A N/A
Cozine ES 10.9 % N/A N/A N/A N/A N/A N/A
CSNHS East N/A 0.0 % 0.0 % N/A 0.0 % N/A N/A
Crestwood ES (H) 2.7 % N/A N/A N/A N/A N/A N/A
Cram MS N/A 31.6 % 10.9 % 35.6 % 0.0 % 100.0 % 3.8 %
Deskin ES 7.5 % N/A N/A N/A N/A N/A N/A
Derfelt ES 14.8 % N/A N/A N/A N/A N/A N/A
Del Sol HS N/A 12.4 % 27.4 % 13.5 % 12.5 % 66.7 % 22.2 %
Decker ES 13.5 % N/A N/A N/A N/A N/A N/A
Desert Rose HS N/A 11.8 % 25.0 % 0.0 % 0.0 % N/A N/A
Desert Pines HS N/A 12.7 % 26.6 % 20.4 % 18.4 % 66.7 % 51.5 %
Desert Oasis HS (L) N/A 0.0 % 0.0 % 27.3 % 17.6 % 0.0 % 16.3 %
Cox (Clyde) ES (H) 11.9 % N/A N/A N/A N/A N/A N/A
Cannon JHS N/A 27.6 % 0.0 % 0.0 % 0.0 % N/A 0.0 %
Canarelli MS N/A 23.9 % 14.5 % 13.2 % 0.0 % 0.0 % 17.2 %
Cambeiro ES (H) 8.1 % N/A N/A N/A N/A N/A N/A
Carson ES (H) 6.3 % N/A N/A N/A N/A N/A N/A
Carl ES 9.8 % N/A N/A N/A N/A N/A N/A
Canyon Springs HS N/A 15.7 % 15.9 % 17.1 % 21.2 % 16.7 % 35.4 %
Burk Horizon SW HS N/A 8.7 % 14.3 % 0.0 % 100.0 % N/A N/A
Bunker ES 14.7 % N/A N/A N/A N/A N/A N/A
Cox (David) ES (L) 10.8 % N/A N/A N/A N/A N/A N/A
Cahlan ES 5.7 % N/A N/A N/A N/A N/A N/A
Cadwallader MS (L) N/A 2.1 % 8.2 % 2.0 % 20.0 % N/A 26.1 %
Burkholder JHS N/A 0.0 % 0.0 % 0.0 % 0.0 % 0.0 % 31.6 %
Cartwright ES (L) 5.0 % N/A N/A N/A N/A N/A N/A
Coronado HS (L) N/A 10.7 % 5.9 % 17.9 % 14.8 % 12.8 % 10.2 %
Conners ES (L) 2.4 % N/A N/A N/A N/A N/A N/A
Clark HS N/A 10.7 % 13.3 % 19.8 % 25.0 % 0.0 % 0.0 %
Cowan Behavior Jr/Sr HS N/A 0.0 % 0.0 % 0.0 % 0.0 % N/A N/A
Cortney JHS (H) N/A 10.2 % 10.9 % 12.5 % 37.9 % N/A 0.0 %
Cortez ES (H) 6.1 % N/A N/A N/A N/A N/A N/A
Chaparral HS N/A 17.1 % 34.7 % 10.3 % 35.6 % 12.5 % 25.0 %
Centennial HS (L) N/A 11.0 % 15.2 % 27.2 % 0.0 % 17.1 % 16.7 %
Cashman MS (H) N/A 6.0 % 18.4 % 13.6 % 21.7 % N/A 18.8 %
Cimarron-Memorial HS N/A 18.2 % 2.7 % 12.2 % 6.0 % 0.0 % 14.3 %
Christensen ES 11.4 % N/A N/A N/A N/A N/A N/A
Cheyenne HS N/A 18.1 % 15.6 % 17.9 % 25.8 % 80.0 % 28.6 %
Clark County Schools
'N/A' indicates that these subjects or grade levels are not present. 'H' = High Poverty School (as ranked by percentage of students enrolled in free or reduced lunch programs). 'L' = Low Poverty School (as ranked by percentage of students enrolled in free or reduced lunch programs).
Elementary English Mathematics Science Social Studies
Foreign Language
Arts
Page 85 of 125
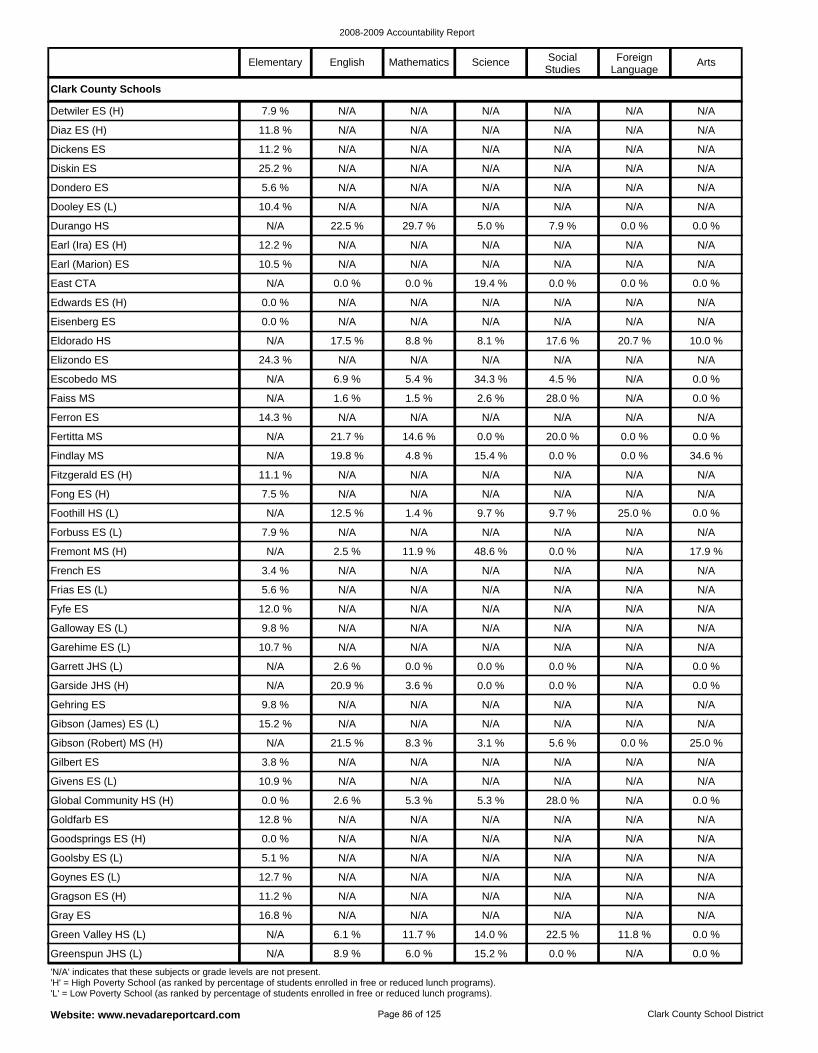
2008-2009 Accountability Report
Website: www.nevadareportcard.com Clark County School District
Gilbert ES 3.8 % N/A N/A N/A N/A N/A N/A
Gibson (Robert) MS (H) N/A 21.5 % 8.3 % 3.1 % 5.6 % 0.0 % 25.0 %
Gibson (James) ES (L) 15.2 % N/A N/A N/A N/A N/A N/A
Goldfarb ES 12.8 % N/A N/A N/A N/A N/A N/A
Global Community HS (H) 0.0 % 2.6 % 5.3 % 5.3 % 28.0 % N/A 0.0 %
Givens ES (L) 10.9 % N/A N/A N/A N/A N/A N/A
Gehring ES 9.8 % N/A N/A N/A N/A N/A N/A
Galloway ES (L) 9.8 % N/A N/A N/A N/A N/A N/A
Fyfe ES 12.0 % N/A N/A N/A N/A N/A N/A
Garside JHS (H) N/A 20.9 % 3.6 % 0.0 % 0.0 % N/A 0.0 %
Garrett JHS (L) N/A 2.6 % 0.0 % 0.0 % 0.0 % N/A 0.0 %
Garehime ES (L) 10.7 % N/A N/A N/A N/A N/A N/A
Greenspun JHS (L) N/A 8.9 % 6.0 % 15.2 % 0.0 % N/A 0.0 %
Goynes ES (L) 12.7 % N/A N/A N/A N/A N/A N/A
Goolsby ES (L) 5.1 % N/A N/A N/A N/A N/A N/A
Goodsprings ES (H) 0.0 % N/A N/A N/A N/A N/A N/A
Green Valley HS (L) N/A 6.1 % 11.7 % 14.0 % 22.5 % 11.8 % 0.0 %
Gray ES 16.8 % N/A N/A N/A N/A N/A N/A
Gragson ES (H) 11.2 % N/A N/A N/A N/A N/A N/A
French ES 3.4 % N/A N/A N/A N/A N/A N/A
Earl (Ira) ES (H) 12.2 % N/A N/A N/A N/A N/A N/A
Durango HS N/A 22.5 % 29.7 % 5.0 % 7.9 % 0.0 % 0.0 %
Dooley ES (L) 10.4 % N/A N/A N/A N/A N/A N/A
Edwards ES (H) 0.0 % N/A N/A N/A N/A N/A N/A
East CTA N/A 0.0 % 0.0 % 19.4 % 0.0 % 0.0 % 0.0 %
Earl (Marion) ES 10.5 % N/A N/A N/A N/A N/A N/A
Diaz ES (H) 11.8 % N/A N/A N/A N/A N/A N/A
Detwiler ES (H) 7.9 % N/A N/A N/A N/A N/A N/A
Frias ES (L) 5.6 % N/A N/A N/A N/A N/A N/A
Dondero ES 5.6 % N/A N/A N/A N/A N/A N/A
Diskin ES 25.2 % N/A N/A N/A N/A N/A N/A
Dickens ES 11.2 % N/A N/A N/A N/A N/A N/A
Eisenberg ES 0.0 % N/A N/A N/A N/A N/A N/A
Fong ES (H) 7.5 % N/A N/A N/A N/A N/A N/A
Fitzgerald ES (H) 11.1 % N/A N/A N/A N/A N/A N/A
Findlay MS N/A 19.8 % 4.8 % 15.4 % 0.0 % 0.0 % 34.6 %
Fremont MS (H) N/A 2.5 % 11.9 % 48.6 % 0.0 % N/A 17.9 %
Forbuss ES (L) 7.9 % N/A N/A N/A N/A N/A N/A
Foothill HS (L) N/A 12.5 % 1.4 % 9.7 % 9.7 % 25.0 % 0.0 %
Escobedo MS N/A 6.9 % 5.4 % 34.3 % 4.5 % N/A 0.0 %
Elizondo ES 24.3 % N/A N/A N/A N/A N/A N/A
Eldorado HS N/A 17.5 % 8.8 % 8.1 % 17.6 % 20.7 % 10.0 %
Fertitta MS N/A 21.7 % 14.6 % 0.0 % 20.0 % 0.0 % 0.0 %
Ferron ES 14.3 % N/A N/A N/A N/A N/A N/A
Faiss MS N/A 1.6 % 1.5 % 2.6 % 28.0 % N/A 0.0 %
Clark County Schools
'N/A' indicates that these subjects or grade levels are not present. 'H' = High Poverty School (as ranked by percentage of students enrolled in free or reduced lunch programs). 'L' = Low Poverty School (as ranked by percentage of students enrolled in free or reduced lunch programs).
Elementary English Mathematics Science Social Studies
Foreign Language
Arts
Page 86 of 125
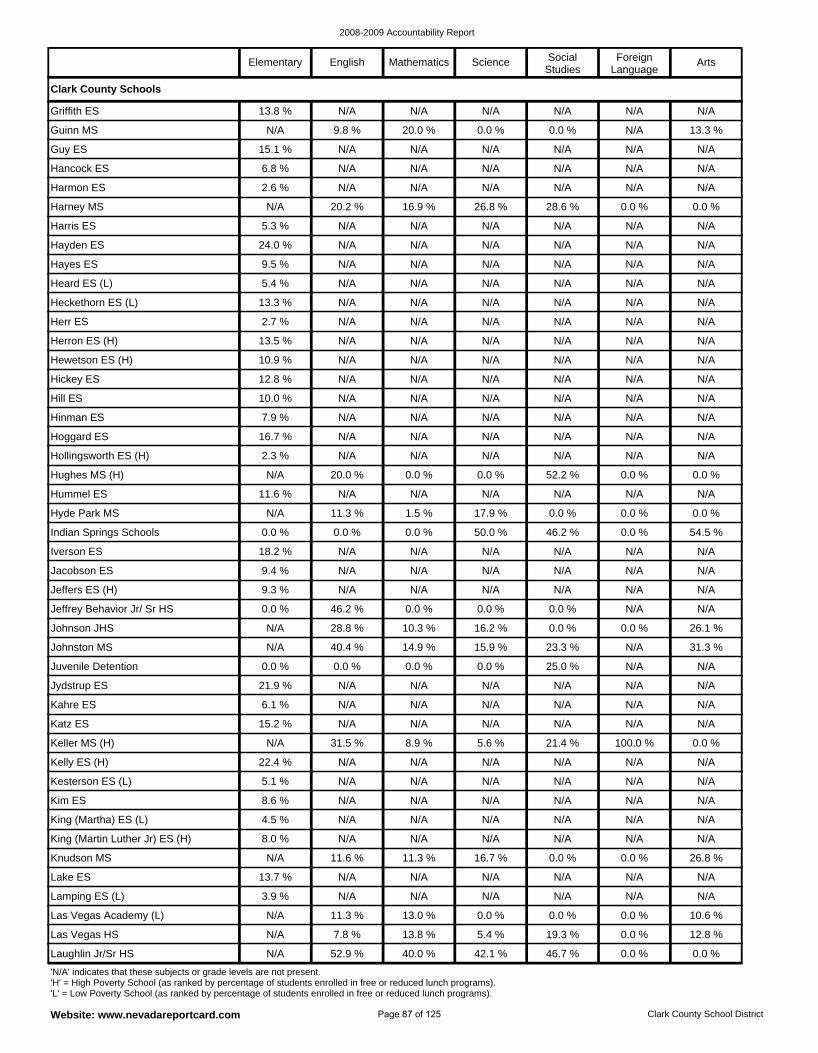
2008-2009 Accountability Report
Website: www.nevadareportcard.com Clark County School District
Kelly ES (H) 22.4 % N/A N/A N/A N/A N/A N/A
Keller MS (H) N/A 31.5 % 8.9 % 5.6 % 21.4 % 100.0 % 0.0 %
Katz ES 15.2 % N/A N/A N/A N/A N/A N/A
King (Martha) ES (L) 4.5 % N/A N/A N/A N/A N/A N/A
Kim ES 8.6 % N/A N/A N/A N/A N/A N/A
Kesterson ES (L) 5.1 % N/A N/A N/A N/A N/A N/A
Kahre ES 6.1 % N/A N/A N/A N/A N/A N/A
Johnson JHS N/A 28.8 % 10.3 % 16.2 % 0.0 % 0.0 % 26.1 %
Jeffrey Behavior Jr/ Sr HS 0.0 % 46.2 % 0.0 % 0.0 % 0.0 % N/A N/A
Jydstrup ES 21.9 % N/A N/A N/A N/A N/A N/A
Juvenile Detention 0.0 % 0.0 % 0.0 % 0.0 % 25.0 % N/A N/A
Johnston MS N/A 40.4 % 14.9 % 15.9 % 23.3 % N/A 31.3 %
Laughlin Jr/Sr HS N/A 52.9 % 40.0 % 42.1 % 46.7 % 0.0 % 0.0 %
Lake ES 13.7 % N/A N/A N/A N/A N/A N/A
Knudson MS N/A 11.6 % 11.3 % 16.7 % 0.0 % 0.0 % 26.8 %
King (Martin Luther Jr) ES (H) 8.0 % N/A N/A N/A N/A N/A N/A
Las Vegas HS N/A 7.8 % 13.8 % 5.4 % 19.3 % 0.0 % 12.8 %
Las Vegas Academy (L) N/A 11.3 % 13.0 % 0.0 % 0.0 % 0.0 % 10.6 %
Lamping ES (L) 3.9 % N/A N/A N/A N/A N/A N/A
Jacobson ES 9.4 % N/A N/A N/A N/A N/A N/A
Hayden ES 24.0 % N/A N/A N/A N/A N/A N/A
Harris ES 5.3 % N/A N/A N/A N/A N/A N/A
Harney MS N/A 20.2 % 16.9 % 26.8 % 28.6 % 0.0 % 0.0 %
Heckethorn ES (L) 13.3 % N/A N/A N/A N/A N/A N/A
Heard ES (L) 5.4 % N/A N/A N/A N/A N/A N/A
Hayes ES 9.5 % N/A N/A N/A N/A N/A N/A
Guinn MS N/A 9.8 % 20.0 % 0.0 % 0.0 % N/A 13.3 %
Griffith ES 13.8 % N/A N/A N/A N/A N/A N/A
Jeffers ES (H) 9.3 % N/A N/A N/A N/A N/A N/A
Harmon ES 2.6 % N/A N/A N/A N/A N/A N/A
Hancock ES 6.8 % N/A N/A N/A N/A N/A N/A
Guy ES 15.1 % N/A N/A N/A N/A N/A N/A
Herr ES 2.7 % N/A N/A N/A N/A N/A N/A
Hummel ES 11.6 % N/A N/A N/A N/A N/A N/A
Hughes MS (H) N/A 20.0 % 0.0 % 0.0 % 52.2 % 0.0 % 0.0 %
Hollingsworth ES (H) 2.3 % N/A N/A N/A N/A N/A N/A
Iverson ES 18.2 % N/A N/A N/A N/A N/A N/A
Indian Springs Schools 0.0 % 0.0 % 0.0 % 50.0 % 46.2 % 0.0 % 54.5 %
Hyde Park MS N/A 11.3 % 1.5 % 17.9 % 0.0 % 0.0 % 0.0 %
Hickey ES 12.8 % N/A N/A N/A N/A N/A N/A
Hewetson ES (H) 10.9 % N/A N/A N/A N/A N/A N/A
Herron ES (H) 13.5 % N/A N/A N/A N/A N/A N/A
Hoggard ES 16.7 % N/A N/A N/A N/A N/A N/A
Hinman ES 7.9 % N/A N/A N/A N/A N/A N/A
Hill ES 10.0 % N/A N/A N/A N/A N/A N/A
Clark County Schools
'N/A' indicates that these subjects or grade levels are not present. 'H' = High Poverty School (as ranked by percentage of students enrolled in free or reduced lunch programs). 'L' = Low Poverty School (as ranked by percentage of students enrolled in free or reduced lunch programs).
Elementary English Mathematics Science Social Studies
Foreign Language
Arts
Page 87 of 125
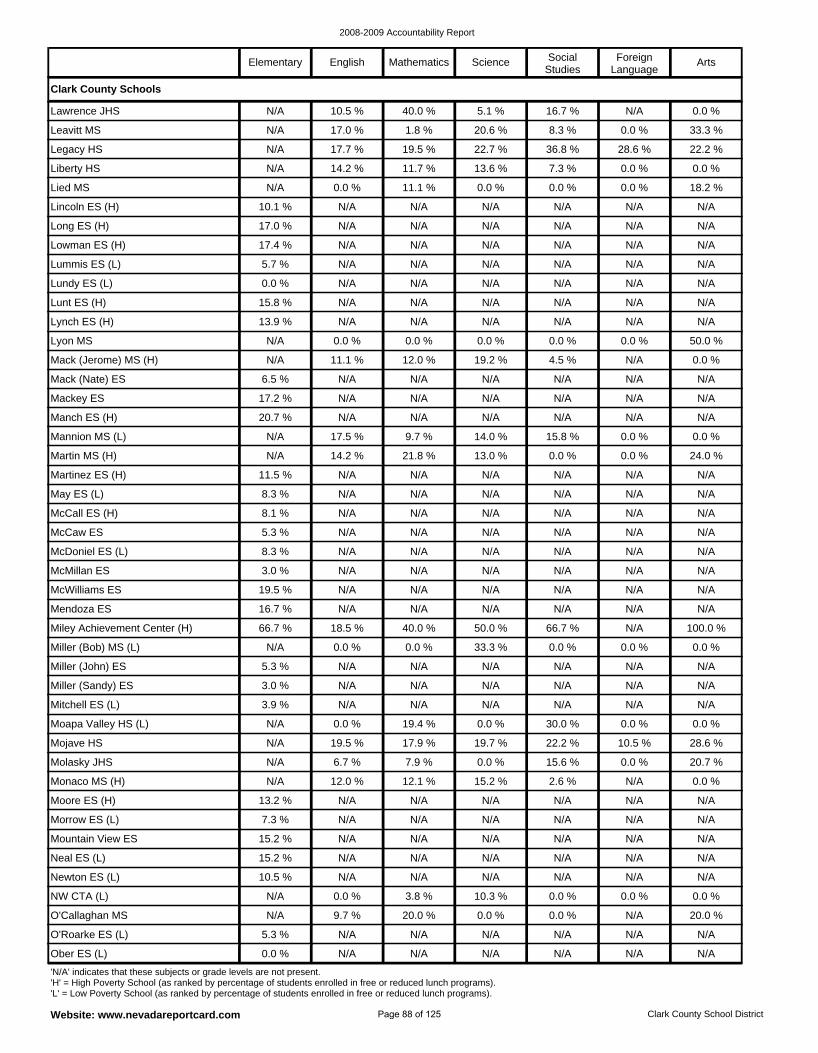
2008-2009 Accountability Report
Website: www.nevadareportcard.com Clark County School District
Molasky JHS N/A 6.7 % 7.9 % 0.0 % 15.6 % 0.0 % 20.7 %
Mojave HS N/A 19.5 % 17.9 % 19.7 % 22.2 % 10.5 % 28.6 %
Moapa Valley HS (L) N/A 0.0 % 19.4 % 0.0 % 30.0 % 0.0 % 0.0 %
Morrow ES (L) 7.3 % N/A N/A N/A N/A N/A N/A
Moore ES (H) 13.2 % N/A N/A N/A N/A N/A N/A
Monaco MS (H) N/A 12.0 % 12.1 % 15.2 % 2.6 % N/A 0.0 %
Mitchell ES (L) 3.9 % N/A N/A N/A N/A N/A N/A
Miley Achievement Center (H) 66.7 % 18.5 % 40.0 % 50.0 % 66.7 % N/A 100.0 %
Mendoza ES 16.7 % N/A N/A N/A N/A N/A N/A
Miller (Sandy) ES 3.0 % N/A N/A N/A N/A N/A N/A
Miller (John) ES 5.3 % N/A N/A N/A N/A N/A N/A
Miller (Bob) MS (L) N/A 0.0 % 0.0 % 33.3 % 0.0 % 0.0 % 0.0 %
Ober ES (L) 0.0 % N/A N/A N/A N/A N/A N/A
Newton ES (L) 10.5 % N/A N/A N/A N/A N/A N/A
Neal ES (L) 15.2 % N/A N/A N/A N/A N/A N/A
Mountain View ES 15.2 % N/A N/A N/A N/A N/A N/A
O'Roarke ES (L) 5.3 % N/A N/A N/A N/A N/A N/A
O'Callaghan MS N/A 9.7 % 20.0 % 0.0 % 0.0 % N/A 20.0 %
NW CTA (L) N/A 0.0 % 3.8 % 10.3 % 0.0 % 0.0 % 0.0 %
McMillan ES 3.0 % N/A N/A N/A N/A N/A N/A
Lowman ES (H) 17.4 % N/A N/A N/A N/A N/A N/A
Long ES (H) 17.0 % N/A N/A N/A N/A N/A N/A
Lincoln ES (H) 10.1 % N/A N/A N/A N/A N/A N/A
Lunt ES (H) 15.8 % N/A N/A N/A N/A N/A N/A
Lundy ES (L) 0.0 % N/A N/A N/A N/A N/A N/A
Lummis ES (L) 5.7 % N/A N/A N/A N/A N/A N/A
Leavitt MS N/A 17.0 % 1.8 % 20.6 % 8.3 % 0.0 % 33.3 %
Lawrence JHS N/A 10.5 % 40.0 % 5.1 % 16.7 % N/A 0.0 %
McWilliams ES 19.5 % N/A N/A N/A N/A N/A N/A
Lied MS N/A 0.0 % 11.1 % 0.0 % 0.0 % 0.0 % 18.2 %
Liberty HS N/A 14.2 % 11.7 % 13.6 % 7.3 % 0.0 % 0.0 %
Legacy HS N/A 17.7 % 19.5 % 22.7 % 36.8 % 28.6 % 22.2 %
Lynch ES (H) 13.9 % N/A N/A N/A N/A N/A N/A
May ES (L) 8.3 % N/A N/A N/A N/A N/A N/A
Martinez ES (H) 11.5 % N/A N/A N/A N/A N/A N/A
Martin MS (H) N/A 14.2 % 21.8 % 13.0 % 0.0 % 0.0 % 24.0 %
McDoniel ES (L) 8.3 % N/A N/A N/A N/A N/A N/A
McCaw ES 5.3 % N/A N/A N/A N/A N/A N/A
McCall ES (H) 8.1 % N/A N/A N/A N/A N/A N/A
Mack (Nate) ES 6.5 % N/A N/A N/A N/A N/A N/A
Mack (Jerome) MS (H) N/A 11.1 % 12.0 % 19.2 % 4.5 % N/A 0.0 %
Lyon MS N/A 0.0 % 0.0 % 0.0 % 0.0 % 0.0 % 50.0 %
Mannion MS (L) N/A 17.5 % 9.7 % 14.0 % 15.8 % 0.0 % 0.0 %
Manch ES (H) 20.7 % N/A N/A N/A N/A N/A N/A
Mackey ES 17.2 % N/A N/A N/A N/A N/A N/A
Clark County Schools
'N/A' indicates that these subjects or grade levels are not present. 'H' = High Poverty School (as ranked by percentage of students enrolled in free or reduced lunch programs). 'L' = Low Poverty School (as ranked by percentage of students enrolled in free or reduced lunch programs).
Elementary English Mathematics Science Social Studies
Foreign Language
Arts
Page 88 of 125
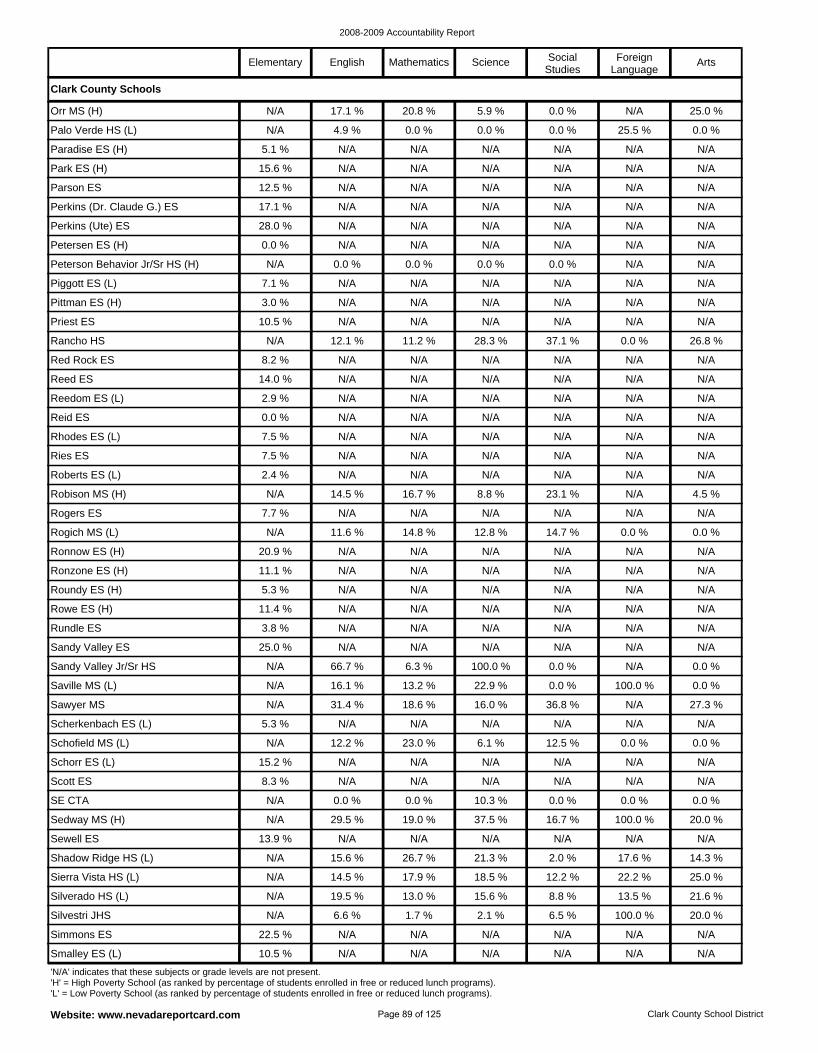
2008-2009 Accountability Report
Website: www.nevadareportcard.com Clark County School District
Schorr ES (L) 15.2 % N/A N/A N/A N/A N/A N/A
Schofield MS (L) N/A 12.2 % 23.0 % 6.1 % 12.5 % 0.0 % 0.0 %
Scherkenbach ES (L) 5.3 % N/A N/A N/A N/A N/A N/A
Sedway MS (H) N/A 29.5 % 19.0 % 37.5 % 16.7 % 100.0 % 20.0 %
SE CTA N/A 0.0 % 0.0 % 10.3 % 0.0 % 0.0 % 0.0 %
Scott ES 8.3 % N/A N/A N/A N/A N/A N/A
Sawyer MS N/A 31.4 % 18.6 % 16.0 % 36.8 % N/A 27.3 %
Rundle ES 3.8 % N/A N/A N/A N/A N/A N/A
Rowe ES (H) 11.4 % N/A N/A N/A N/A N/A N/A
Saville MS (L) N/A 16.1 % 13.2 % 22.9 % 0.0 % 100.0 % 0.0 %
Sandy Valley Jr/Sr HS N/A 66.7 % 6.3 % 100.0 % 0.0 % N/A 0.0 %
Sandy Valley ES 25.0 % N/A N/A N/A N/A N/A N/A
Smalley ES (L) 10.5 % N/A N/A N/A N/A N/A N/A
Sierra Vista HS (L) N/A 14.5 % 17.9 % 18.5 % 12.2 % 22.2 % 25.0 %
Shadow Ridge HS (L) N/A 15.6 % 26.7 % 21.3 % 2.0 % 17.6 % 14.3 %
Sewell ES 13.9 % N/A N/A N/A N/A N/A N/A
Simmons ES 22.5 % N/A N/A N/A N/A N/A N/A
Silvestri JHS N/A 6.6 % 1.7 % 2.1 % 6.5 % 100.0 % 20.0 %
Silverado HS (L) N/A 19.5 % 13.0 % 15.6 % 8.8 % 13.5 % 21.6 %
Ronzone ES (H) 11.1 % N/A N/A N/A N/A N/A N/A
Petersen ES (H) 0.0 % N/A N/A N/A N/A N/A N/A
Perkins (Ute) ES 28.0 % N/A N/A N/A N/A N/A N/A
Perkins (Dr. Claude G.) ES 17.1 % N/A N/A N/A N/A N/A N/A
Pittman ES (H) 3.0 % N/A N/A N/A N/A N/A N/A
Piggott ES (L) 7.1 % N/A N/A N/A N/A N/A N/A
Peterson Behavior Jr/Sr HS (H) N/A 0.0 % 0.0 % 0.0 % 0.0 % N/A N/A
Palo Verde HS (L) N/A 4.9 % 0.0 % 0.0 % 0.0 % 25.5 % 0.0 %
Orr MS (H) N/A 17.1 % 20.8 % 5.9 % 0.0 % N/A 25.0 %
Roundy ES (H) 5.3 % N/A N/A N/A N/A N/A N/A
Parson ES 12.5 % N/A N/A N/A N/A N/A N/A
Park ES (H) 15.6 % N/A N/A N/A N/A N/A N/A
Paradise ES (H) 5.1 % N/A N/A N/A N/A N/A N/A
Priest ES 10.5 % N/A N/A N/A N/A N/A N/A
Robison MS (H) N/A 14.5 % 16.7 % 8.8 % 23.1 % N/A 4.5 %
Roberts ES (L) 2.4 % N/A N/A N/A N/A N/A N/A
Ries ES 7.5 % N/A N/A N/A N/A N/A N/A
Ronnow ES (H) 20.9 % N/A N/A N/A N/A N/A N/A
Rogich MS (L) N/A 11.6 % 14.8 % 12.8 % 14.7 % 0.0 % 0.0 %
Rogers ES 7.7 % N/A N/A N/A N/A N/A N/A
Reed ES 14.0 % N/A N/A N/A N/A N/A N/A
Red Rock ES 8.2 % N/A N/A N/A N/A N/A N/A
Rancho HS N/A 12.1 % 11.2 % 28.3 % 37.1 % 0.0 % 26.8 %
Rhodes ES (L) 7.5 % N/A N/A N/A N/A N/A N/A
Reid ES 0.0 % N/A N/A N/A N/A N/A N/A
Reedom ES (L) 2.9 % N/A N/A N/A N/A N/A N/A
Clark County Schools
'N/A' indicates that these subjects or grade levels are not present. 'H' = High Poverty School (as ranked by percentage of students enrolled in free or reduced lunch programs). 'L' = Low Poverty School (as ranked by percentage of students enrolled in free or reduced lunch programs).
Elementary English Mathematics Science Social Studies
Foreign Language
Arts
Page 89 of 125
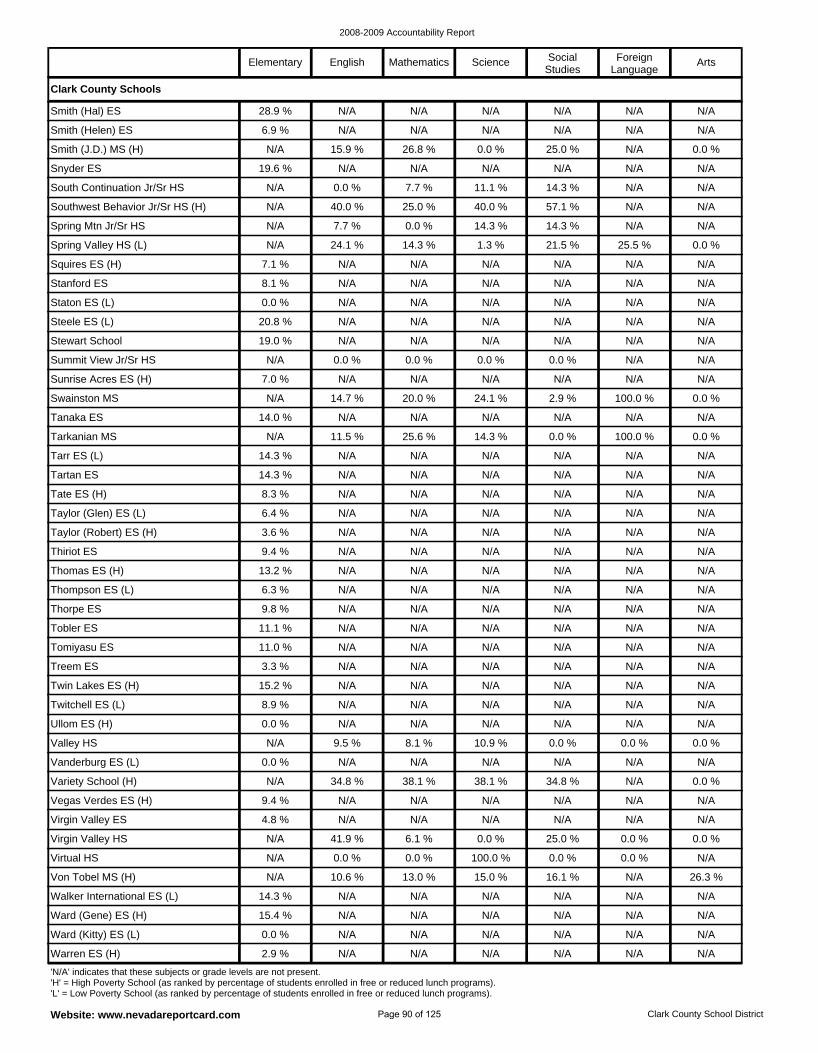
2008-2009 Accountability Report
Website: www.nevadareportcard.com Clark County School District
Vanderburg ES (L) 0.0 % N/A N/A N/A N/A N/A N/A
Valley HS N/A 9.5 % 8.1 % 10.9 % 0.0 % 0.0 % 0.0 %
Ullom ES (H) 0.0 % N/A N/A N/A N/A N/A N/A
Virgin Valley ES 4.8 % N/A N/A N/A N/A N/A N/A
Vegas Verdes ES (H) 9.4 % N/A N/A N/A N/A N/A N/A
Variety School (H) N/A 34.8 % 38.1 % 38.1 % 34.8 % N/A 0.0 %
Twitchell ES (L) 8.9 % N/A N/A N/A N/A N/A N/A
Tobler ES 11.1 % N/A N/A N/A N/A N/A N/A
Thorpe ES 9.8 % N/A N/A N/A N/A N/A N/A
Twin Lakes ES (H) 15.2 % N/A N/A N/A N/A N/A N/A
Treem ES 3.3 % N/A N/A N/A N/A N/A N/A
Tomiyasu ES 11.0 % N/A N/A N/A N/A N/A N/A
Warren ES (H) 2.9 % N/A N/A N/A N/A N/A N/A
Von Tobel MS (H) N/A 10.6 % 13.0 % 15.0 % 16.1 % N/A 26.3 %
Virtual HS N/A 0.0 % 0.0 % 100.0 % 0.0 % 0.0 % N/A
Virgin Valley HS N/A 41.9 % 6.1 % 0.0 % 25.0 % 0.0 % 0.0 %
Ward (Kitty) ES (L) 0.0 % N/A N/A N/A N/A N/A N/A
Ward (Gene) ES (H) 15.4 % N/A N/A N/A N/A N/A N/A
Walker International ES (L) 14.3 % N/A N/A N/A N/A N/A N/A
Thomas ES (H) 13.2 % N/A N/A N/A N/A N/A N/A
Spring Valley HS (L) N/A 24.1 % 14.3 % 1.3 % 21.5 % 25.5 % 0.0 %
Spring Mtn Jr/Sr HS N/A 7.7 % 0.0 % 14.3 % 14.3 % N/A N/A
Southwest Behavior Jr/Sr HS (H) N/A 40.0 % 25.0 % 40.0 % 57.1 % N/A N/A
Staton ES (L) 0.0 % N/A N/A N/A N/A N/A N/A
Stanford ES 8.1 % N/A N/A N/A N/A N/A N/A
Squires ES (H) 7.1 % N/A N/A N/A N/A N/A N/A
Smith (Helen) ES 6.9 % N/A N/A N/A N/A N/A N/A
Smith (Hal) ES 28.9 % N/A N/A N/A N/A N/A N/A
Thompson ES (L) 6.3 % N/A N/A N/A N/A N/A N/A
South Continuation Jr/Sr HS N/A 0.0 % 7.7 % 11.1 % 14.3 % N/A N/A
Snyder ES 19.6 % N/A N/A N/A N/A N/A N/A
Smith (J.D.) MS (H) N/A 15.9 % 26.8 % 0.0 % 25.0 % N/A 0.0 %
Steele ES (L) 20.8 % N/A N/A N/A N/A N/A N/A
Tate ES (H) 8.3 % N/A N/A N/A N/A N/A N/A
Tartan ES 14.3 % N/A N/A N/A N/A N/A N/A
Tarr ES (L) 14.3 % N/A N/A N/A N/A N/A N/A
Thiriot ES 9.4 % N/A N/A N/A N/A N/A N/A
Taylor (Robert) ES (H) 3.6 % N/A N/A N/A N/A N/A N/A
Taylor (Glen) ES (L) 6.4 % N/A N/A N/A N/A N/A N/A
Sunrise Acres ES (H) 7.0 % N/A N/A N/A N/A N/A N/A
Summit View Jr/Sr HS N/A 0.0 % 0.0 % 0.0 % 0.0 % N/A N/A
Stewart School 19.0 % N/A N/A N/A N/A N/A N/A
Tarkanian MS N/A 11.5 % 25.6 % 14.3 % 0.0 % 100.0 % 0.0 %
Tanaka ES 14.0 % N/A N/A N/A N/A N/A N/A
Swainston MS N/A 14.7 % 20.0 % 24.1 % 2.9 % 100.0 % 0.0 %
Clark County Schools
'N/A' indicates that these subjects or grade levels are not present. 'H' = High Poverty School (as ranked by percentage of students enrolled in free or reduced lunch programs). 'L' = Low Poverty School (as ranked by percentage of students enrolled in free or reduced lunch programs).
Elementary English Mathematics Science Social Studies
Foreign Language
Arts
Page 90 of 125
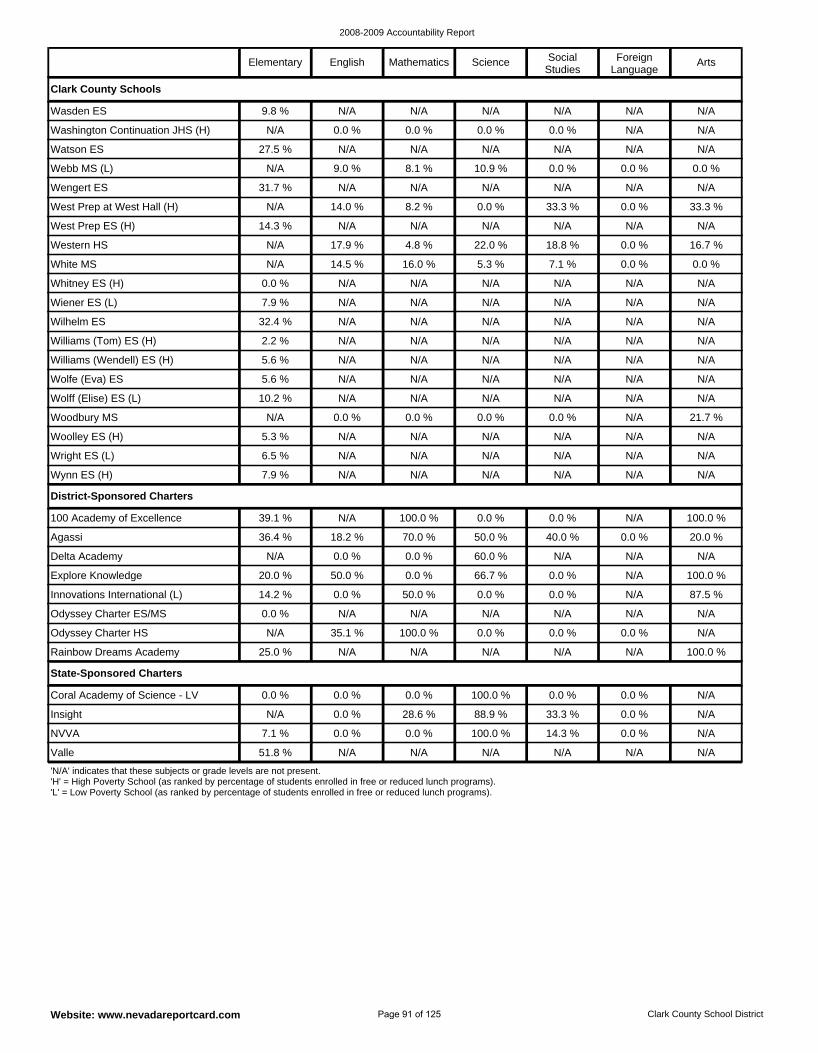
2008-2009 Accountability Report
Website: www.nevadareportcard.com Clark County School District
Coral Academy of Science - LV 0.0 % 0.0 % 0.0 % 100.0 % 0.0 % 0.0 % N/A
Valle 51.8 % N/A N/A N/A N/A N/A N/A
Insight N/A 0.0 % 28.6 % 88.9 % 33.3 % 0.0 % N/A
NVVA 7.1 % 0.0 % 0.0 % 100.0 % 14.3 % 0.0 % N/A
State-Sponsored Charters
Explore Knowledge 20.0 % 50.0 % 0.0 % 66.7 % 0.0 % N/A 100.0 %
100 Academy of Excellence 39.1 % N/A 100.0 % 0.0 % 0.0 % N/A 100.0 %
Agassi 36.4 % 18.2 % 70.0 % 50.0 % 40.0 % 0.0 % 20.0 %
Innovations International (L) 14.2 % 0.0 % 50.0 % 0.0 % 0.0 % N/A 87.5 %
Rainbow Dreams Academy 25.0 % N/A N/A N/A N/A N/A 100.0 %
Delta Academy N/A 0.0 % 0.0 % 60.0 % N/A N/A N/A
Odyssey Charter ES/MS 0.0 % N/A N/A N/A N/A N/A N/A
Odyssey Charter HS N/A 35.1 % 100.0 % 0.0 % 0.0 % 0.0 % N/A
District-Sponsored Charters
Woolley ES (H) 5.3 % N/A N/A N/A N/A N/A N/A
Woodbury MS N/A 0.0 % 0.0 % 0.0 % 0.0 % N/A 21.7 %
Wynn ES (H) 7.9 % N/A N/A N/A N/A N/A N/A
Wright ES (L) 6.5 % N/A N/A N/A N/A N/A N/A
West Prep at West Hall (H) N/A 14.0 % 8.2 % 0.0 % 33.3 % 0.0 % 33.3 %
Wengert ES 31.7 % N/A N/A N/A N/A N/A N/A
Western HS N/A 17.9 % 4.8 % 22.0 % 18.8 % 0.0 % 16.7 %
West Prep ES (H) 14.3 % N/A N/A N/A N/A N/A N/A
Washington Continuation JHS (H) N/A 0.0 % 0.0 % 0.0 % 0.0 % N/A N/A
Wasden ES 9.8 % N/A N/A N/A N/A N/A N/A
Webb MS (L) N/A 9.0 % 8.1 % 10.9 % 0.0 % 0.0 % 0.0 %
Watson ES 27.5 % N/A N/A N/A N/A N/A N/A
Williams (Wendell) ES (H) 5.6 % N/A N/A N/A N/A N/A N/A
Williams (Tom) ES (H) 2.2 % N/A N/A N/A N/A N/A N/A
Wolff (Elise) ES (L) 10.2 % N/A N/A N/A N/A N/A N/A
Wolfe (Eva) ES 5.6 % N/A N/A N/A N/A N/A N/A
Whitney ES (H) 0.0 % N/A N/A N/A N/A N/A N/A
White MS N/A 14.5 % 16.0 % 5.3 % 7.1 % 0.0 % 0.0 %
Wilhelm ES 32.4 % N/A N/A N/A N/A N/A N/A
Wiener ES (L) 7.9 % N/A N/A N/A N/A N/A N/A
Clark County Schools
'N/A' indicates that these subjects or grade levels are not present. 'H' = High Poverty School (as ranked by percentage of students enrolled in free or reduced lunch programs). 'L' = Low Poverty School (as ranked by percentage of students enrolled in free or reduced lunch programs).
Elementary English Mathematics Science Social Studies
Foreign Language
Arts
Page 91 of 125
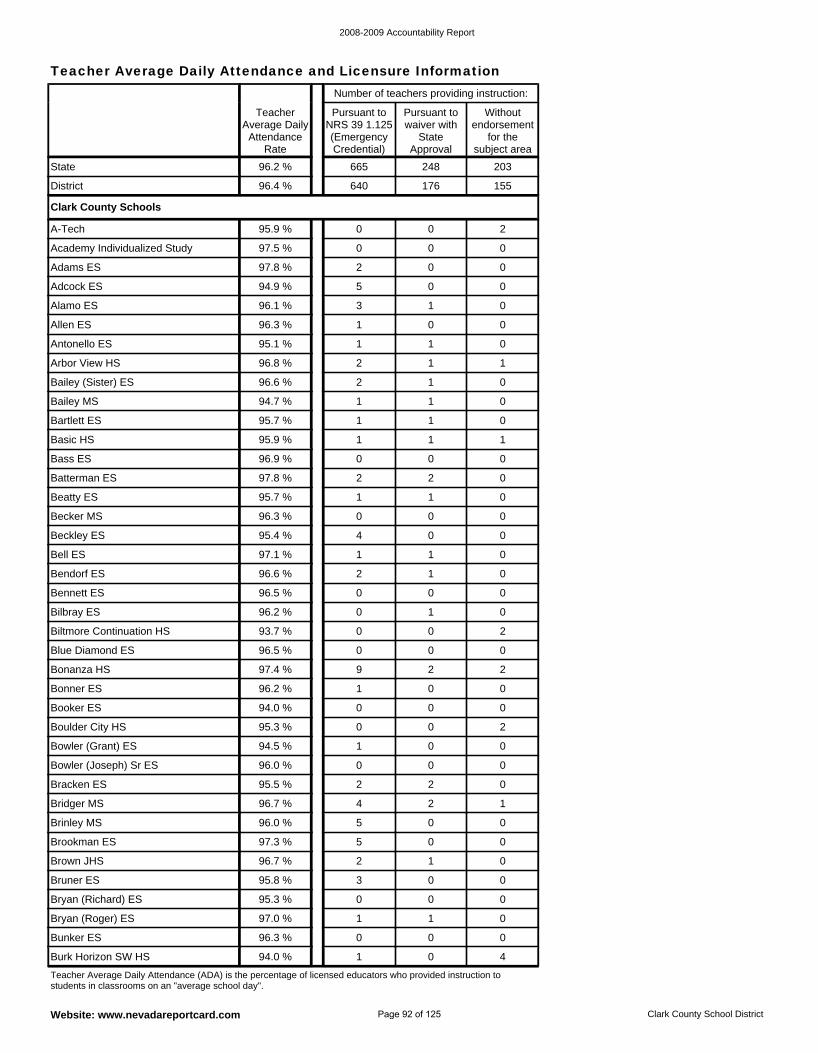
2008-2009 Accountability Report
Website: www.nevadareportcard.com Clark County School District
Bracken ES 95.5 % 2 2 0
Bowler (Joseph) Sr ES 96.0 % 0 0 0
Bowler (Grant) ES 94.5 % 1 0 0
Brookman ES 97.3 % 5 0 0
Brinley MS 96.0 % 5 0 0
Bridger MS 96.7 % 4 2 1
Bonanza HS 97.4 % 9 2 2
Blue Diamond ES 96.5 % 0 0 0
Boulder City HS 95.3 % 0 0 2
Booker ES 94.0 % 0 0 0
Bonner ES 96.2 % 1 0 0
Brown JHS 96.7 % 2 1 0
Bryan (Roger) ES 97.0 % 1 1 0
Bryan (Richard) ES 95.3 % 0 0 0
Bruner ES 95.8 % 3 0 0
Burk Horizon SW HS 94.0 % 1 0 4
Bunker ES 96.3 % 0 0 0
Bilbray ES 96.2 % 0 1 0
Allen ES 96.3 % 1 0 0
Alamo ES 96.1 % 3 1 0
Antonello ES 95.1 % 1 1 0
Bailey (Sister) ES 96.6 % 2 1 0
Arbor View HS 96.8 % 2 1 1
Adcock ES 94.9 % 5 0 0
Biltmore Continuation HS 93.7 % 0 0 2
A-Tech 95.9 % 0 0 2
Adams ES 97.8 % 2 0 0
Academy Individualized Study 97.5 % 0 0 0
Beckley ES 95.4 % 4 0 0
Becker MS 96.3 % 0 0 0
Bell ES 97.1 % 1 1 0
Bennett ES 96.5 % 0 0 0
Bendorf ES 96.6 % 2 1 0
Beatty ES 95.7 % 1 1 0
Bailey MS 94.7 % 1 1 0
Bartlett ES 95.7 % 1 1 0
Basic HS 95.9 % 1 1 1
Batterman ES 97.8 % 2 2 0
Bass ES 96.9 % 0 0 0
Clark County Schools
District 96.4 % 640 176 155
State 96.2 % 665 248 203
Teacher Average Daily Attendance (ADA) is the percentage of licensed educators who provided instruction to students in classrooms on an "average school day".
Number of teachers providing instruction:
Teacher Average Daily
Attendance Rate
Pursuant to NRS 39 1.125 (Emergency Credential)
Pursuant to waiver with
State Approval
Without endorsement
for the subject area
Teacher Average Daily Attendance and Licensure Information
Page 92 of 125
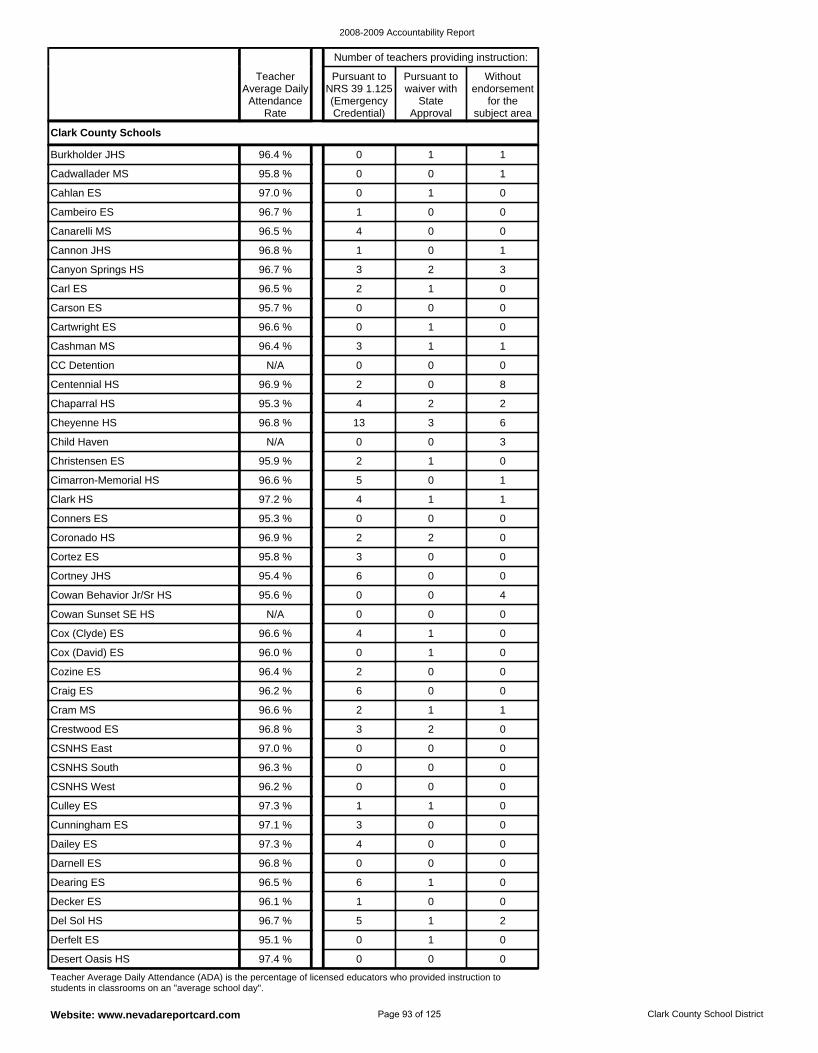
2008-2009 Accountability Report
Website: www.nevadareportcard.com Clark County School District
CSNHS West 96.2 % 0 0 0
CSNHS South 96.3 % 0 0 0
CSNHS East 97.0 % 0 0 0
Dailey ES 97.3 % 4 0 0
Cunningham ES 97.1 % 3 0 0
Culley ES 97.3 % 1 1 0
Crestwood ES 96.8 % 3 2 0
Cox (David) ES 96.0 % 0 1 0
Cox (Clyde) ES 96.6 % 4 1 0
Cram MS 96.6 % 2 1 1
Craig ES 96.2 % 6 0 0
Cozine ES 96.4 % 2 0 0
Decker ES 96.1 % 1 0 0
Dearing ES 96.5 % 6 1 0
Darnell ES 96.8 % 0 0 0
Desert Oasis HS 97.4 % 0 0 0
Derfelt ES 95.1 % 0 1 0
Del Sol HS 96.7 % 5 1 2
Cowan Behavior Jr/Sr HS 95.6 % 0 0 4
Canyon Springs HS 96.7 % 3 2 3
Cannon JHS 96.8 % 1 0 1
Canarelli MS 96.5 % 4 0 0
Cartwright ES 96.6 % 0 1 0
Carson ES 95.7 % 0 0 0
Carl ES 96.5 % 2 1 0
Burkholder JHS 96.4 % 0 1 1
Cowan Sunset SE HS N/A 0 0 0
Cambeiro ES 96.7 % 1 0 0
Cahlan ES 97.0 % 0 1 0
Cadwallader MS 95.8 % 0 0 1
Cashman MS 96.4 % 3 1 1
Conners ES 95.3 % 0 0 0
Clark HS 97.2 % 4 1 1
Cimarron-Memorial HS 96.6 % 5 0 1
Cortney JHS 95.4 % 6 0 0
Cortez ES 95.8 % 3 0 0
Coronado HS 96.9 % 2 2 0
Chaparral HS 95.3 % 4 2 2
Centennial HS 96.9 % 2 0 8
CC Detention N/A 0 0 0
Child Haven N/A 0 0 3
Christensen ES 95.9 % 2 1 0
Cheyenne HS 96.8 % 13 3 6
Clark County Schools
Teacher Average Daily Attendance (ADA) is the percentage of licensed educators who provided instruction to students in classrooms on an "average school day".
Number of teachers providing instruction:
Teacher Average Daily
Attendance Rate
Pursuant to NRS 39 1.125 (Emergency Credential)
Pursuant to waiver with
State Approval
Without endorsement
for the subject area
Page 93 of 125
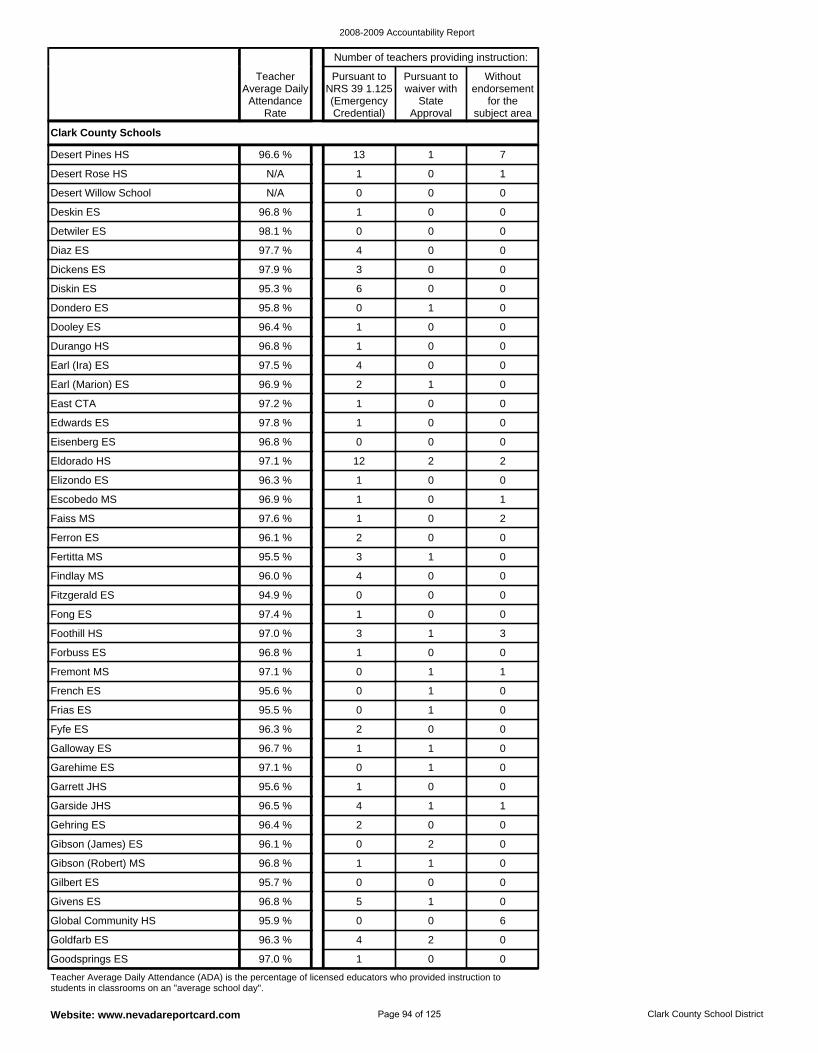
2008-2009 Accountability Report
Website: www.nevadareportcard.com Clark County School District
Garrett JHS 95.6 % 1 0 0
Garehime ES 97.1 % 0 1 0
Galloway ES 96.7 % 1 1 0
Gibson (James) ES 96.1 % 0 2 0
Gehring ES 96.4 % 2 0 0
Garside JHS 96.5 % 4 1 1
Fyfe ES 96.3 % 2 0 0
Forbuss ES 96.8 % 1 0 0
Foothill HS 97.0 % 3 1 3
Frias ES 95.5 % 0 1 0
French ES 95.6 % 0 1 0
Fremont MS 97.1 % 0 1 1
Givens ES 96.8 % 5 1 0
Gilbert ES 95.7 % 0 0 0
Gibson (Robert) MS 96.8 % 1 1 0
Goodsprings ES 97.0 % 1 0 0
Goldfarb ES 96.3 % 4 2 0
Global Community HS 95.9 % 0 0 6
Fitzgerald ES 94.9 % 0 0 0
Dickens ES 97.9 % 3 0 0
Diaz ES 97.7 % 4 0 0
Detwiler ES 98.1 % 0 0 0
Dooley ES 96.4 % 1 0 0
Dondero ES 95.8 % 0 1 0
Diskin ES 95.3 % 6 0 0
Desert Pines HS 96.6 % 13 1 7
Fong ES 97.4 % 1 0 0
Deskin ES 96.8 % 1 0 0
Desert Willow School N/A 0 0 0
Desert Rose HS N/A 1 0 1
Durango HS 96.8 % 1 0 0
Faiss MS 97.6 % 1 0 2
Escobedo MS 96.9 % 1 0 1
Elizondo ES 96.3 % 1 0 0
Findlay MS 96.0 % 4 0 0
Fertitta MS 95.5 % 3 1 0
Ferron ES 96.1 % 2 0 0
East CTA 97.2 % 1 0 0
Earl (Marion) ES 96.9 % 2 1 0
Earl (Ira) ES 97.5 % 4 0 0
Eisenberg ES 96.8 % 0 0 0
Eldorado HS 97.1 % 12 2 2
Edwards ES 97.8 % 1 0 0
Clark County Schools
Teacher Average Daily Attendance (ADA) is the percentage of licensed educators who provided instruction to students in classrooms on an "average school day".
Number of teachers providing instruction:
Teacher Average Daily
Attendance Rate
Pursuant to NRS 39 1.125 (Emergency Credential)
Pursuant to waiver with
State Approval
Without endorsement
for the subject area
Page 94 of 125
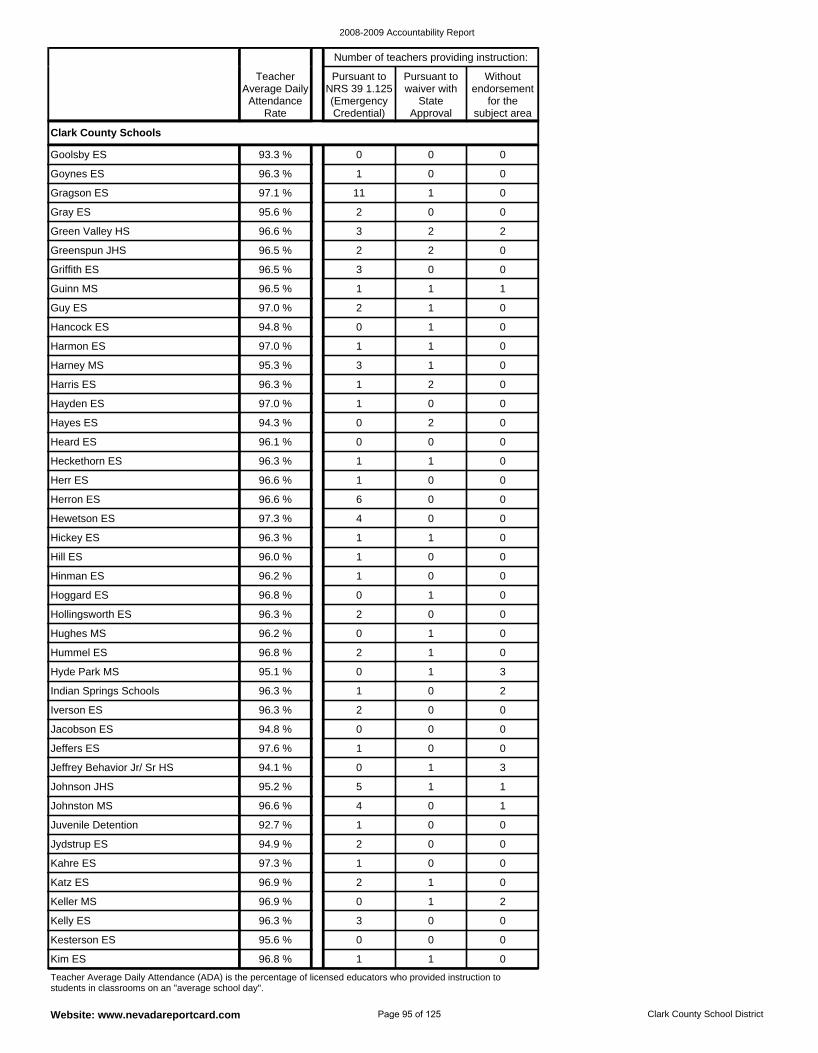
2008-2009 Accountability Report
Website: www.nevadareportcard.com Clark County School District
Johnson JHS 95.2 % 5 1 1
Jeffrey Behavior Jr/ Sr HS 94.1 % 0 1 3
Jeffers ES 97.6 % 1 0 0
Jydstrup ES 94.9 % 2 0 0
Juvenile Detention 92.7 % 1 0 0
Johnston MS 96.6 % 4 0 1
Jacobson ES 94.8 % 0 0 0
Hummel ES 96.8 % 2 1 0
Hughes MS 96.2 % 0 1 0
Iverson ES 96.3 % 2 0 0
Indian Springs Schools 96.3 % 1 0 2
Hyde Park MS 95.1 % 0 1 3
Keller MS 96.9 % 0 1 2
Katz ES 96.9 % 2 1 0
Kahre ES 97.3 % 1 0 0
Kim ES 96.8 % 1 1 0
Kesterson ES 95.6 % 0 0 0
Kelly ES 96.3 % 3 0 0
Hoggard ES 96.8 % 0 1 0
Griffith ES 96.5 % 3 0 0
Greenspun JHS 96.5 % 2 2 0
Green Valley HS 96.6 % 3 2 2
Hancock ES 94.8 % 0 1 0
Guy ES 97.0 % 2 1 0
Guinn MS 96.5 % 1 1 1
Goolsby ES 93.3 % 0 0 0
Hollingsworth ES 96.3 % 2 0 0
Gray ES 95.6 % 2 0 0
Gragson ES 97.1 % 11 1 0
Goynes ES 96.3 % 1 0 0
Harmon ES 97.0 % 1 1 0
Hewetson ES 97.3 % 4 0 0
Herron ES 96.6 % 6 0 0
Herr ES 96.6 % 1 0 0
Hinman ES 96.2 % 1 0 0
Hill ES 96.0 % 1 0 0
Hickey ES 96.3 % 1 1 0
Hayden ES 97.0 % 1 0 0
Harris ES 96.3 % 1 2 0
Harney MS 95.3 % 3 1 0
Heard ES 96.1 % 0 0 0
Heckethorn ES 96.3 % 1 1 0
Hayes ES 94.3 % 0 2 0
Clark County Schools
Teacher Average Daily Attendance (ADA) is the percentage of licensed educators who provided instruction to students in classrooms on an "average school day".
Number of teachers providing instruction:
Teacher Average Daily
Attendance Rate
Pursuant to NRS 39 1.125 (Emergency Credential)
Pursuant to waiver with
State Approval
Without endorsement
for the subject area
Page 95 of 125
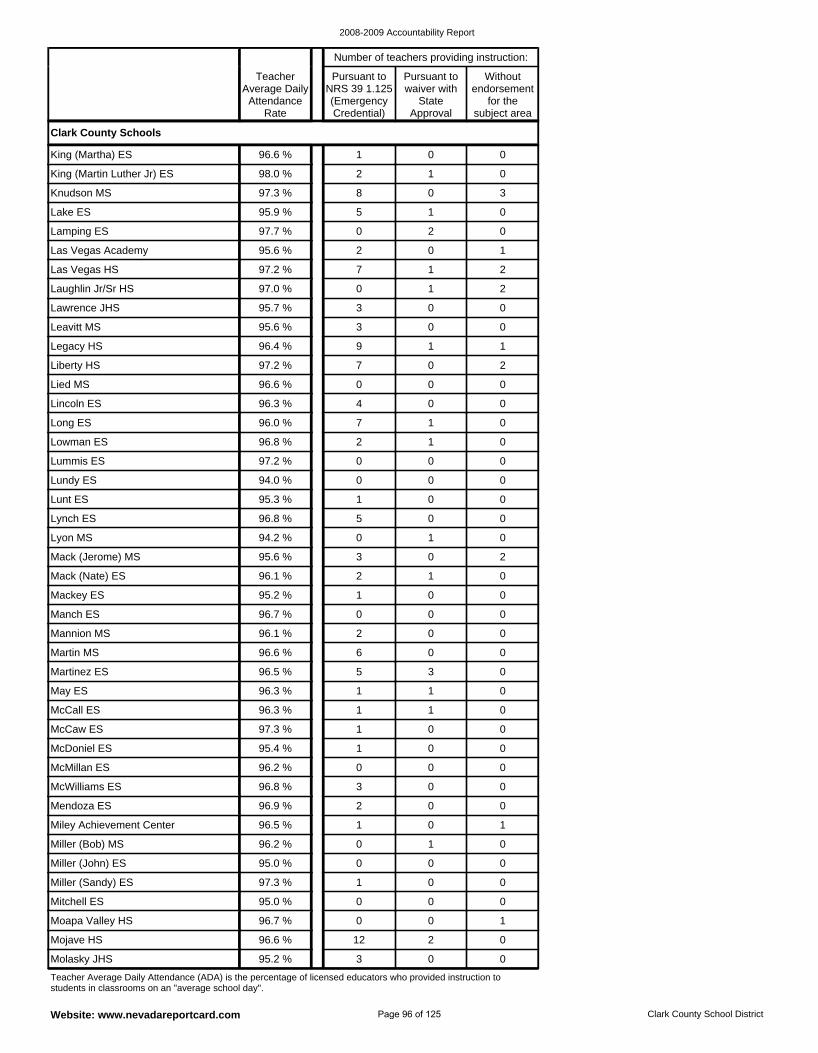
2008-2009 Accountability Report
Website: www.nevadareportcard.com Clark County School District
McWilliams ES 96.8 % 3 0 0
McMillan ES 96.2 % 0 0 0
McDoniel ES 95.4 % 1 0 0
Miller (Bob) MS 96.2 % 0 1 0
Miley Achievement Center 96.5 % 1 0 1
Mendoza ES 96.9 % 2 0 0
McCaw ES 97.3 % 1 0 0
Martin MS 96.6 % 6 0 0
Mannion MS 96.1 % 2 0 0
McCall ES 96.3 % 1 1 0
May ES 96.3 % 1 1 0
Martinez ES 96.5 % 5 3 0
Mitchell ES 95.0 % 0 0 0
Miller (Sandy) ES 97.3 % 1 0 0
Miller (John) ES 95.0 % 0 0 0
Molasky JHS 95.2 % 3 0 0
Mojave HS 96.6 % 12 2 0
Moapa Valley HS 96.7 % 0 0 1
Mackey ES 95.2 % 1 0 0
Las Vegas HS 97.2 % 7 1 2
Las Vegas Academy 95.6 % 2 0 1
Lamping ES 97.7 % 0 2 0
Leavitt MS 95.6 % 3 0 0
Lawrence JHS 95.7 % 3 0 0
Laughlin Jr/Sr HS 97.0 % 0 1 2
King (Martha) ES 96.6 % 1 0 0
Manch ES 96.7 % 0 0 0
Lake ES 95.9 % 5 1 0
Knudson MS 97.3 % 8 0 3
King (Martin Luther Jr) ES 98.0 % 2 1 0
Legacy HS 96.4 % 9 1 1
Lynch ES 96.8 % 5 0 0
Lunt ES 95.3 % 1 0 0
Lundy ES 94.0 % 0 0 0
Mack (Nate) ES 96.1 % 2 1 0
Mack (Jerome) MS 95.6 % 3 0 2
Lyon MS 94.2 % 0 1 0
Lincoln ES 96.3 % 4 0 0
Lied MS 96.6 % 0 0 0
Liberty HS 97.2 % 7 0 2
Lowman ES 96.8 % 2 1 0
Lummis ES 97.2 % 0 0 0
Long ES 96.0 % 7 1 0
Clark County Schools
Teacher Average Daily Attendance (ADA) is the percentage of licensed educators who provided instruction to students in classrooms on an "average school day".
Number of teachers providing instruction:
Teacher Average Daily
Attendance Rate
Pursuant to NRS 39 1.125 (Emergency Credential)
Pursuant to waiver with
State Approval
Without endorsement
for the subject area
Page 96 of 125
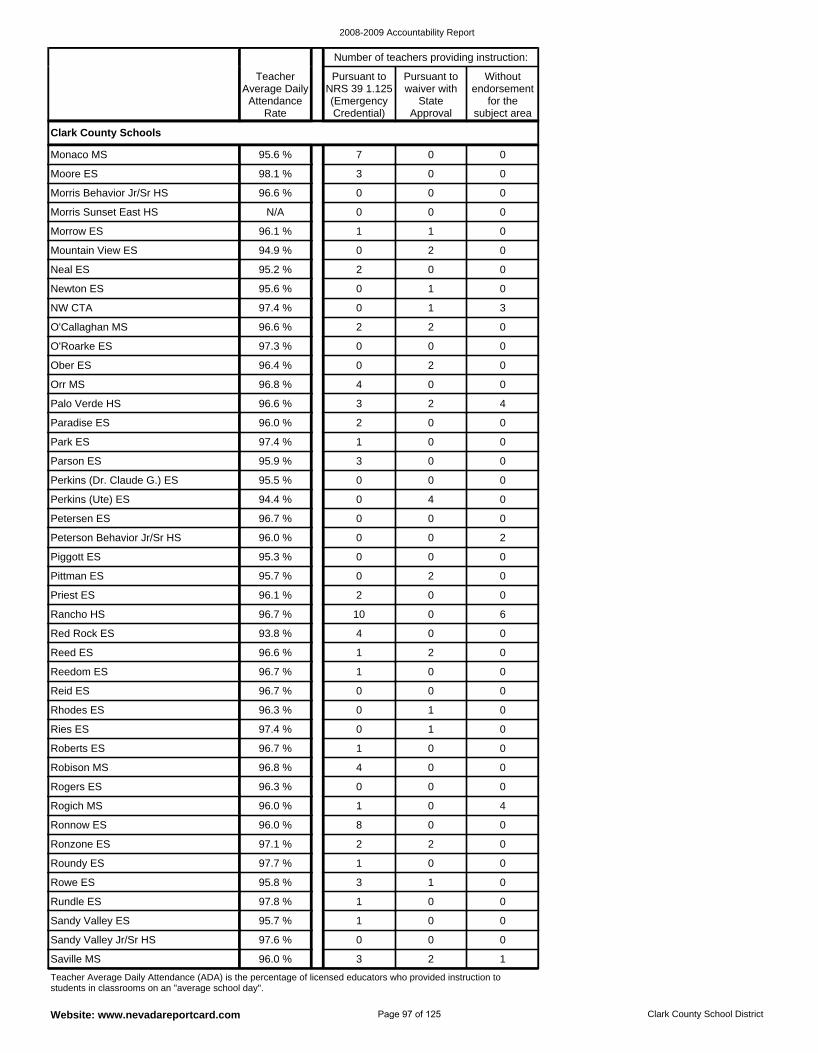
2008-2009 Accountability Report
Website: www.nevadareportcard.com Clark County School District
Rogers ES 96.3 % 0 0 0
Robison MS 96.8 % 4 0 0
Roberts ES 96.7 % 1 0 0
Ronzone ES 97.1 % 2 2 0
Ronnow ES 96.0 % 8 0 0
Rogich MS 96.0 % 1 0 4
Ries ES 97.4 % 0 1 0
Reed ES 96.6 % 1 2 0
Red Rock ES 93.8 % 4 0 0
Rhodes ES 96.3 % 0 1 0
Reid ES 96.7 % 0 0 0
Reedom ES 96.7 % 1 0 0
Rundle ES 97.8 % 1 0 0
Rowe ES 95.8 % 3 1 0
Roundy ES 97.7 % 1 0 0
Saville MS 96.0 % 3 2 1
Sandy Valley Jr/Sr HS 97.6 % 0 0 0
Sandy Valley ES 95.7 % 1 0 0
Priest ES 96.1 % 2 0 0
Neal ES 95.2 % 2 0 0
Mountain View ES 94.9 % 0 2 0
Morrow ES 96.1 % 1 1 0
O'Callaghan MS 96.6 % 2 2 0
NW CTA 97.4 % 0 1 3
Newton ES 95.6 % 0 1 0
Monaco MS 95.6 % 7 0 0
Rancho HS 96.7 % 10 0 6
Morris Sunset East HS N/A 0 0 0
Morris Behavior Jr/Sr HS 96.6 % 0 0 0
Moore ES 98.1 % 3 0 0
O'Roarke ES 97.3 % 0 0 0
Petersen ES 96.7 % 0 0 0
Perkins (Ute) ES 94.4 % 0 4 0
Perkins (Dr. Claude G.) ES 95.5 % 0 0 0
Pittman ES 95.7 % 0 2 0
Piggott ES 95.3 % 0 0 0
Peterson Behavior Jr/Sr HS 96.0 % 0 0 2
Palo Verde HS 96.6 % 3 2 4
Orr MS 96.8 % 4 0 0
Ober ES 96.4 % 0 2 0
Park ES 97.4 % 1 0 0
Parson ES 95.9 % 3 0 0
Paradise ES 96.0 % 2 0 0
Clark County Schools
Teacher Average Daily Attendance (ADA) is the percentage of licensed educators who provided instruction to students in classrooms on an "average school day".
Number of teachers providing instruction:
Teacher Average Daily
Attendance Rate
Pursuant to NRS 39 1.125 (Emergency Credential)
Pursuant to waiver with
State Approval
Without endorsement
for the subject area
Page 97 of 125
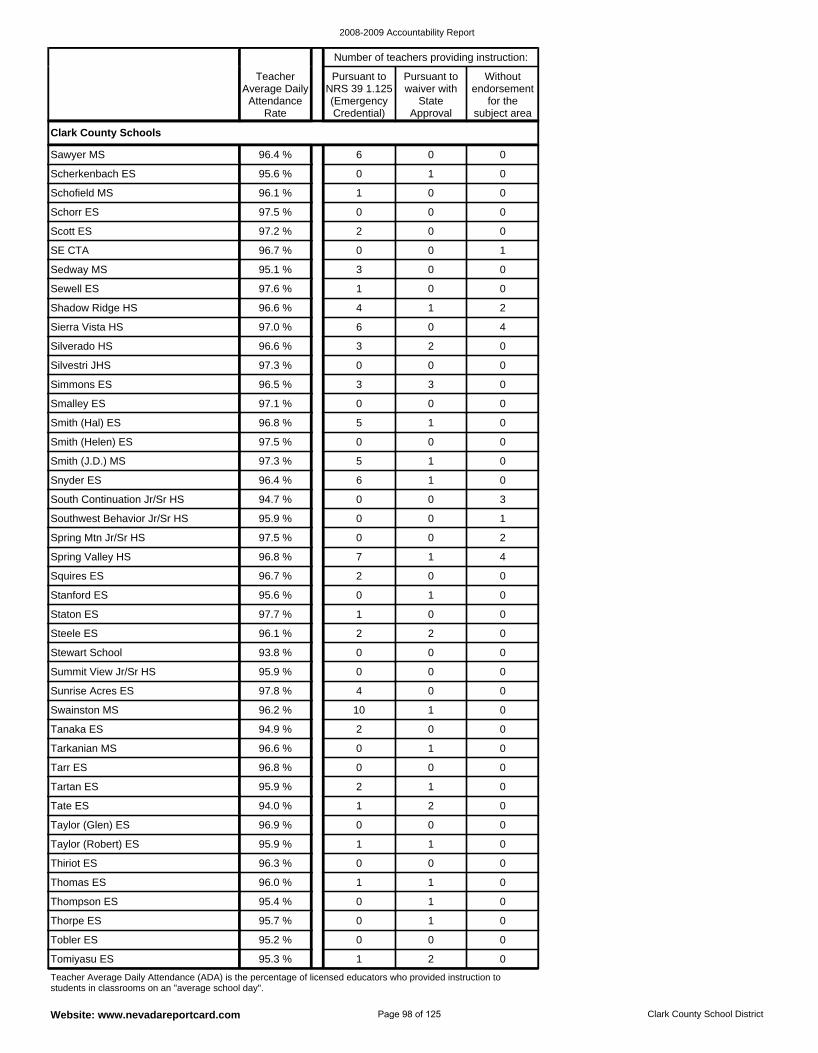
2008-2009 Accountability Report
Website: www.nevadareportcard.com Clark County School District
Tartan ES 95.9 % 2 1 0
Tarr ES 96.8 % 0 0 0
Tarkanian MS 96.6 % 0 1 0
Taylor (Robert) ES 95.9 % 1 1 0
Taylor (Glen) ES 96.9 % 0 0 0
Tate ES 94.0 % 1 2 0
Tanaka ES 94.9 % 2 0 0
Stewart School 93.8 % 0 0 0
Steele ES 96.1 % 2 2 0
Swainston MS 96.2 % 10 1 0
Sunrise Acres ES 97.8 % 4 0 0
Summit View Jr/Sr HS 95.9 % 0 0 0
Thompson ES 95.4 % 0 1 0
Thomas ES 96.0 % 1 1 0
Thiriot ES 96.3 % 0 0 0
Tomiyasu ES 95.3 % 1 2 0
Tobler ES 95.2 % 0 0 0
Thorpe ES 95.7 % 0 1 0
Stanford ES 95.6 % 0 1 0
Sedway MS 95.1 % 3 0 0
SE CTA 96.7 % 0 0 1
Scott ES 97.2 % 2 0 0
Sierra Vista HS 97.0 % 6 0 4
Shadow Ridge HS 96.6 % 4 1 2
Sewell ES 97.6 % 1 0 0
Sawyer MS 96.4 % 6 0 0
Staton ES 97.7 % 1 0 0
Schorr ES 97.5 % 0 0 0
Schofield MS 96.1 % 1 0 0
Scherkenbach ES 95.6 % 0 1 0
Silverado HS 96.6 % 3 2 0
Southwest Behavior Jr/Sr HS 95.9 % 0 0 1
South Continuation Jr/Sr HS 94.7 % 0 0 3
Snyder ES 96.4 % 6 1 0
Squires ES 96.7 % 2 0 0
Spring Valley HS 96.8 % 7 1 4
Spring Mtn Jr/Sr HS 97.5 % 0 0 2
Smalley ES 97.1 % 0 0 0
Simmons ES 96.5 % 3 3 0
Silvestri JHS 97.3 % 0 0 0
Smith (Helen) ES 97.5 % 0 0 0
Smith (J.D.) MS 97.3 % 5 1 0
Smith (Hal) ES 96.8 % 5 1 0
Clark County Schools
Teacher Average Daily Attendance (ADA) is the percentage of licensed educators who provided instruction to students in classrooms on an "average school day".
Number of teachers providing instruction:
Teacher Average Daily
Attendance Rate
Pursuant to NRS 39 1.125 (Emergency Credential)
Pursuant to waiver with
State Approval
Without endorsement
for the subject area
Page 98 of 125
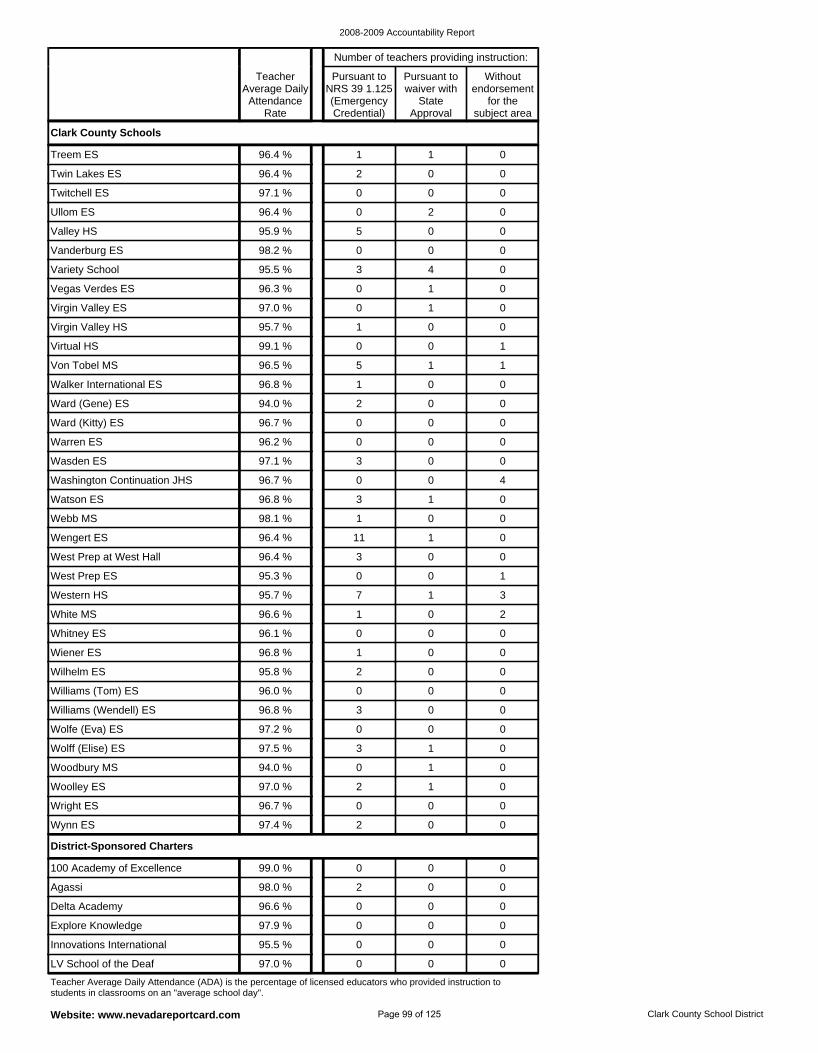
2008-2009 Accountability Report
Website: www.nevadareportcard.com Clark County School District
Explore Knowledge 97.9 % 0 0 0
100 Academy of Excellence 99.0 % 0 0 0
Agassi 98.0 % 2 0 0
Innovations International 95.5 % 0 0 0
Delta Academy 96.6 % 0 0 0
LV School of the Deaf 97.0 % 0 0 0
District-Sponsored Charters
Wiener ES 96.8 % 1 0 0
Wilhelm ES 95.8 % 2 0 0
Williams (Tom) ES 96.0 % 0 0 0
Western HS 95.7 % 7 1 3
White MS 96.6 % 1 0 2
Whitney ES 96.1 % 0 0 0
Williams (Wendell) ES 96.8 % 3 0 0
Woolley ES 97.0 % 2 1 0
Wright ES 96.7 % 0 0 0
Wynn ES 97.4 % 2 0 0
Wolfe (Eva) ES 97.2 % 0 0 0
Wolff (Elise) ES 97.5 % 3 1 0
Woodbury MS 94.0 % 0 1 0
Vegas Verdes ES 96.3 % 0 1 0
Variety School 95.5 % 3 4 0
Virgin Valley ES 97.0 % 0 1 0
Virtual HS 99.1 % 0 0 1
Virgin Valley HS 95.7 % 1 0 0
Vanderburg ES 98.2 % 0 0 0
Twin Lakes ES 96.4 % 2 0 0
Treem ES 96.4 % 1 1 0
Twitchell ES 97.1 % 0 0 0
Valley HS 95.9 % 5 0 0
Ullom ES 96.4 % 0 2 0
Von Tobel MS 96.5 % 5 1 1
Webb MS 98.1 % 1 0 0
Watson ES 96.8 % 3 1 0
Wengert ES 96.4 % 11 1 0
West Prep ES 95.3 % 0 0 1
West Prep at West Hall 96.4 % 3 0 0
Washington Continuation JHS 96.7 % 0 0 4
Ward (Gene) ES 94.0 % 2 0 0
Walker International ES 96.8 % 1 0 0
Ward (Kitty) ES 96.7 % 0 0 0
Wasden ES 97.1 % 3 0 0
Warren ES 96.2 % 0 0 0
Clark County Schools
Teacher Average Daily Attendance (ADA) is the percentage of licensed educators who provided instruction to students in classrooms on an "average school day".
Number of teachers providing instruction:
Teacher Average Daily
Attendance Rate
Pursuant to NRS 39 1.125 (Emergency Credential)
Pursuant to waiver with
State Approval
Without endorsement
for the subject area
Page 99 of 125
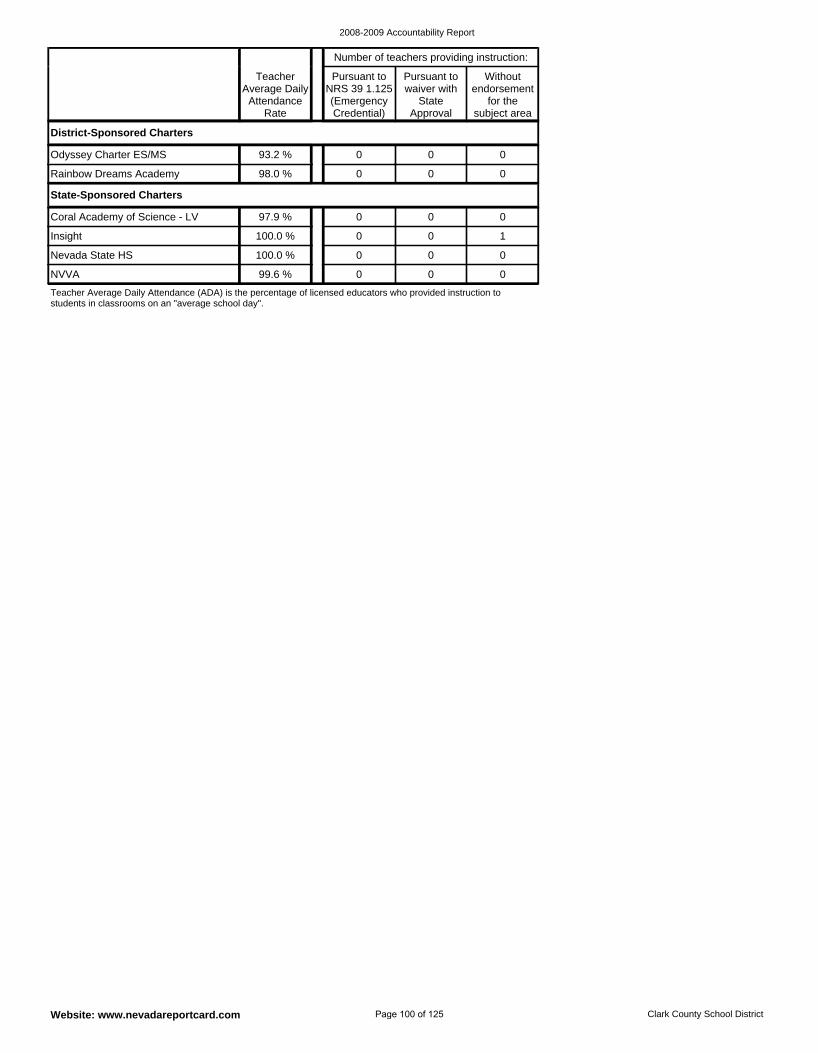
2008-2009 Accountability Report
Website: www.nevadareportcard.com Clark County School District
Coral Academy of Science - LV 97.9 % 0 0 0
Nevada State HS 100.0 % 0 0 0
Insight 100.0 % 0 0 1
NVVA 99.6 % 0 0 0
State-Sponsored Charters
Odyssey Charter ES/MS 93.2 % 0 0 0
Rainbow Dreams Academy 98.0 % 0 0 0
District-Sponsored Charters
Teacher Average Daily Attendance (ADA) is the percentage of licensed educators who provided instruction to students in classrooms on an "average school day".
Number of teachers providing instruction:
Teacher Average Daily
Attendance Rate
Pursuant to NRS 39 1.125 (Emergency Credential)
Pursuant to waiver with
State Approval
Without endorsement
for the subject area
Page 100 of 125
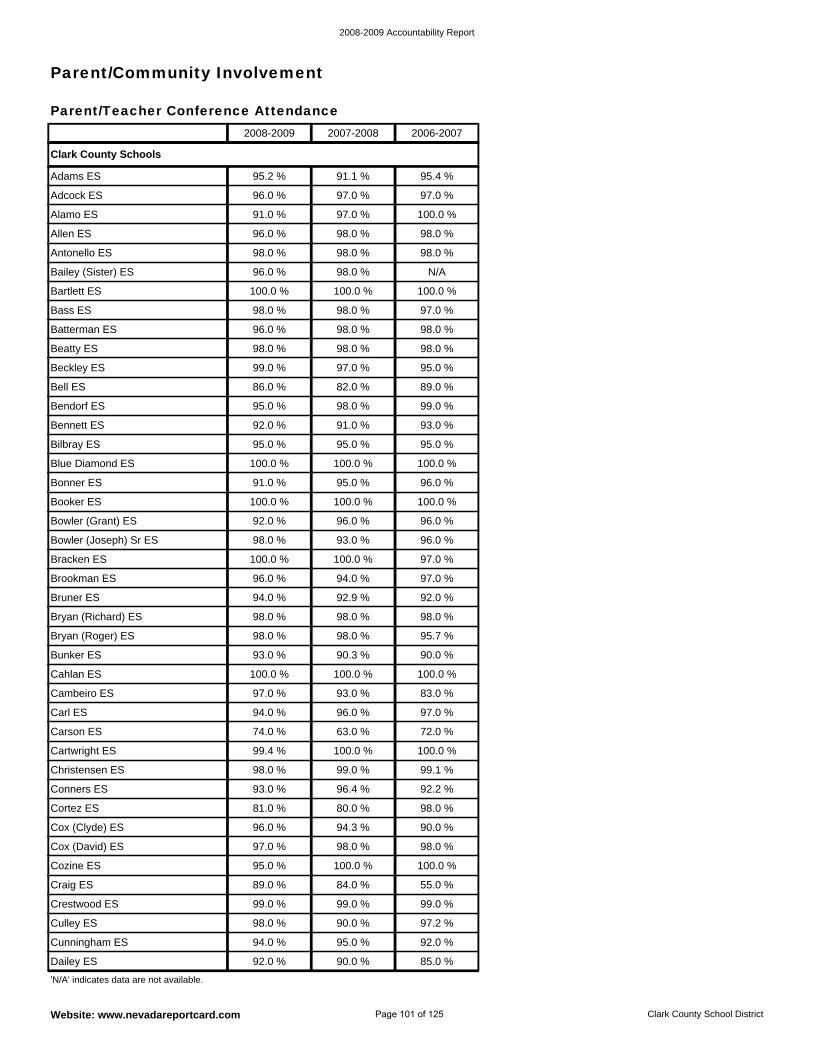
2008-2009 Accountability Report
Website: www.nevadareportcard.com Clark County School District
Parent/Community Involvement
Parent/Teacher Conference Attendance
Cortez ES 81.0 % 80.0 % 98.0 %
Conners ES 93.0 % 96.4 % 92.2 %
Christensen ES 98.0 % 99.0 % 99.1 %
Cozine ES 95.0 % 100.0 % 100.0 %
Cox (David) ES 97.0 % 98.0 % 98.0 %
Cox (Clyde) ES 96.0 % 94.3 % 90.0 %
Cartwright ES 99.4 % 100.0 % 100.0 %
Cahlan ES 100.0 % 100.0 % 100.0 %
Bunker ES 93.0 % 90.3 % 90.0 %
Carson ES 74.0 % 63.0 % 72.0 %
Carl ES 94.0 % 96.0 % 97.0 %
Cambeiro ES 97.0 % 93.0 % 83.0 %
Culley ES 98.0 % 90.0 % 97.2 %
Crestwood ES 99.0 % 99.0 % 99.0 %
Craig ES 89.0 % 84.0 % 55.0 %
Dailey ES 92.0 % 90.0 % 85.0 %
Cunningham ES 94.0 % 95.0 % 92.0 %
Bass ES 98.0 % 98.0 % 97.0 %
Bartlett ES 100.0 % 100.0 % 100.0 %
Bailey (Sister) ES 96.0 % 98.0 % N/A
Beckley ES 99.0 % 97.0 % 95.0 %
Beatty ES 98.0 % 98.0 % 98.0 %
Batterman ES 96.0 % 98.0 % 98.0 %
Adcock ES 96.0 % 97.0 % 97.0 %
Adams ES 95.2 % 91.1 % 95.4 %
Bryan (Roger) ES 98.0 % 98.0 % 95.7 %
Antonello ES 98.0 % 98.0 % 98.0 %
Allen ES 96.0 % 98.0 % 98.0 %
Alamo ES 91.0 % 97.0 % 100.0 %
Bell ES 86.0 % 82.0 % 89.0 %
Bracken ES 100.0 % 100.0 % 97.0 %
Bowler (Joseph) Sr ES 98.0 % 93.0 % 96.0 %
Bowler (Grant) ES 92.0 % 96.0 % 96.0 %
Bryan (Richard) ES 98.0 % 98.0 % 98.0 %
Bruner ES 94.0 % 92.9 % 92.0 %
Brookman ES 96.0 % 94.0 % 97.0 %
Bilbray ES 95.0 % 95.0 % 95.0 %
Bennett ES 92.0 % 91.0 % 93.0 %
Bendorf ES 95.0 % 98.0 % 99.0 %
Booker ES 100.0 % 100.0 % 100.0 %
Bonner ES 91.0 % 95.0 % 96.0 %
Blue Diamond ES 100.0 % 100.0 % 100.0 %
Clark County Schools
'N/A' indicates data are not available.
2008-2009 2007-2008 2006-2007
Page 101 of 125
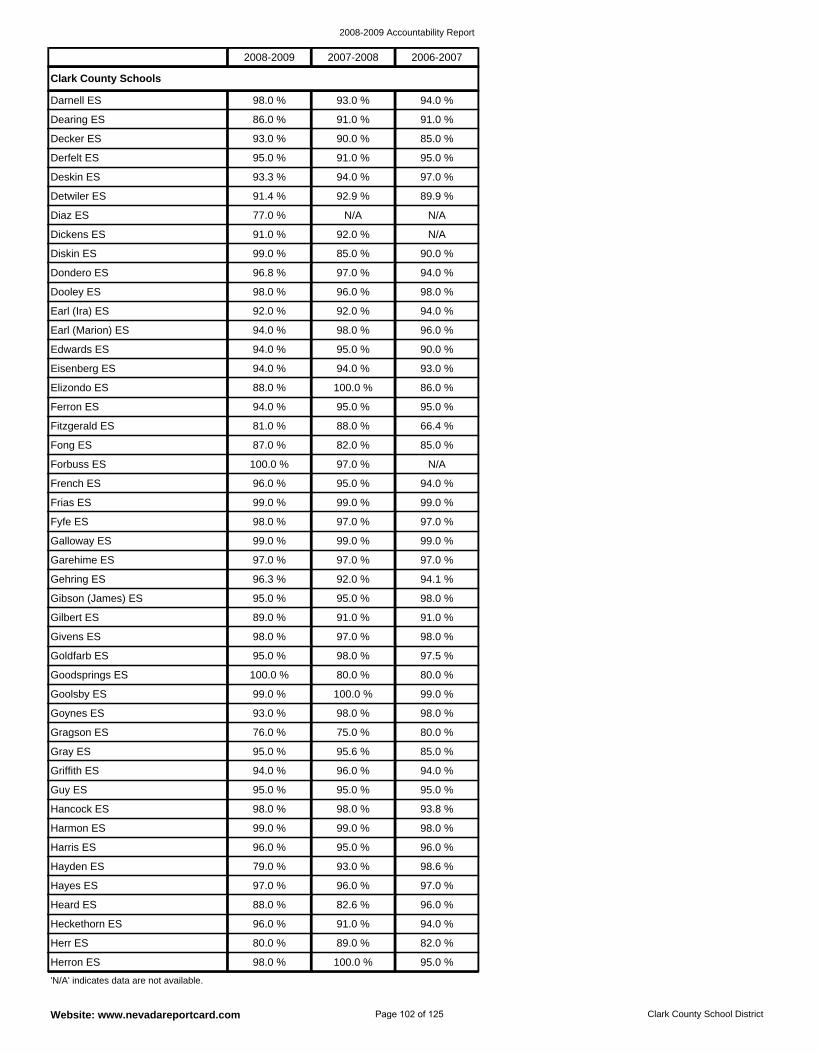
2008-2009 Accountability Report
Website: www.nevadareportcard.com Clark County School District
Gray ES 95.0 % 95.6 % 85.0 %
Gragson ES 76.0 % 75.0 % 80.0 %
Goynes ES 93.0 % 98.0 % 98.0 %
Hancock ES 98.0 % 98.0 % 93.8 %
Guy ES 95.0 % 95.0 % 95.0 %
Griffith ES 94.0 % 96.0 % 94.0 %
Goolsby ES 99.0 % 100.0 % 99.0 %
Gilbert ES 89.0 % 91.0 % 91.0 %
Gibson (James) ES 95.0 % 95.0 % 98.0 %
Goodsprings ES 100.0 % 80.0 % 80.0 %
Goldfarb ES 95.0 % 98.0 % 97.5 %
Givens ES 98.0 % 97.0 % 98.0 %
Herron ES 98.0 % 100.0 % 95.0 %
Herr ES 80.0 % 89.0 % 82.0 %
Hayden ES 79.0 % 93.0 % 98.6 %
Harris ES 96.0 % 95.0 % 96.0 %
Harmon ES 99.0 % 99.0 % 98.0 %
Heckethorn ES 96.0 % 91.0 % 94.0 %
Heard ES 88.0 % 82.6 % 96.0 %
Hayes ES 97.0 % 96.0 % 97.0 %
Garehime ES 97.0 % 97.0 % 97.0 %
Dickens ES 91.0 % 92.0 % N/A
Diaz ES 77.0 % N/A N/A
Detwiler ES 91.4 % 92.9 % 89.9 %
Dooley ES 98.0 % 96.0 % 98.0 %
Dondero ES 96.8 % 97.0 % 94.0 %
Diskin ES 99.0 % 85.0 % 90.0 %
Dearing ES 86.0 % 91.0 % 91.0 %
Darnell ES 98.0 % 93.0 % 94.0 %
Gehring ES 96.3 % 92.0 % 94.1 %
Deskin ES 93.3 % 94.0 % 97.0 %
Derfelt ES 95.0 % 91.0 % 95.0 %
Decker ES 93.0 % 90.0 % 85.0 %
Earl (Ira) ES 92.0 % 92.0 % 94.0 %
French ES 96.0 % 95.0 % 94.0 %
Forbuss ES 100.0 % 97.0 % N/A
Fong ES 87.0 % 82.0 % 85.0 %
Galloway ES 99.0 % 99.0 % 99.0 %
Fyfe ES 98.0 % 97.0 % 97.0 %
Frias ES 99.0 % 99.0 % 99.0 %
Eisenberg ES 94.0 % 94.0 % 93.0 %
Edwards ES 94.0 % 95.0 % 90.0 %
Earl (Marion) ES 94.0 % 98.0 % 96.0 %
Fitzgerald ES 81.0 % 88.0 % 66.4 %
Ferron ES 94.0 % 95.0 % 95.0 %
Elizondo ES 88.0 % 100.0 % 86.0 %
Clark County Schools
'N/A' indicates data are not available.
2008-2009 2007-2008 2006-2007
Page 102 of 125
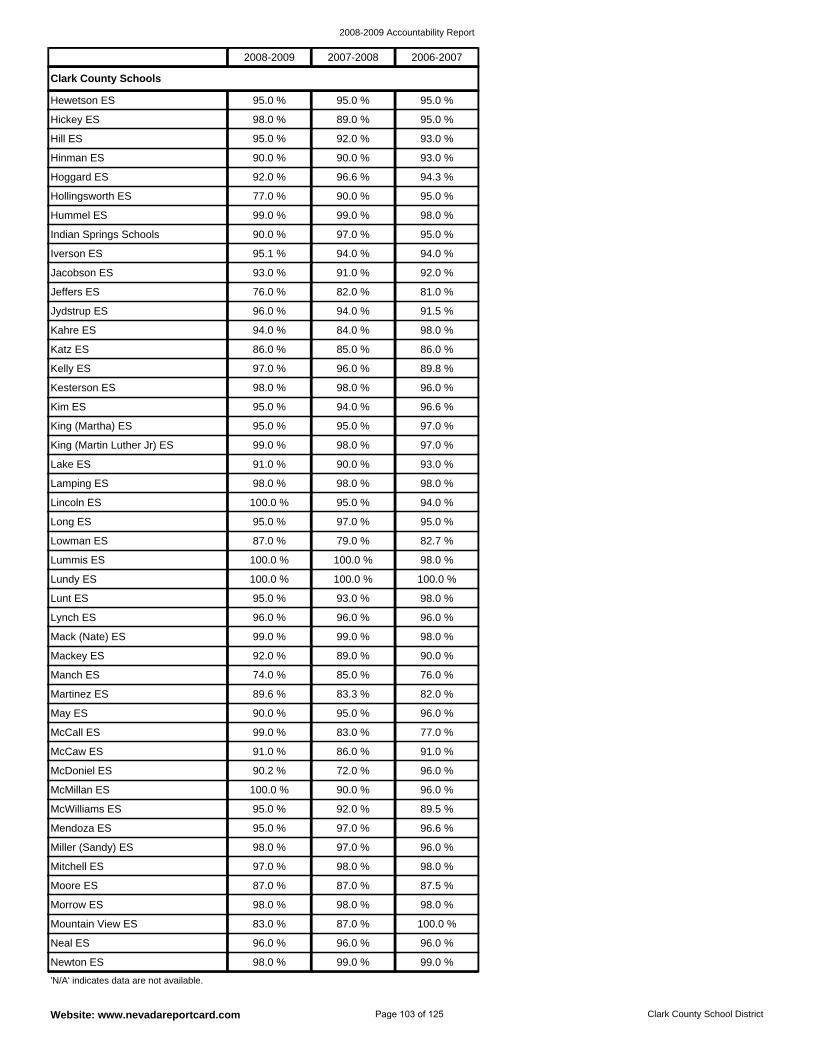
2008-2009 Accountability Report
Website: www.nevadareportcard.com Clark County School District
McCaw ES 91.0 % 86.0 % 91.0 %
McCall ES 99.0 % 83.0 % 77.0 %
May ES 90.0 % 95.0 % 96.0 %
McWilliams ES 95.0 % 92.0 % 89.5 %
McMillan ES 100.0 % 90.0 % 96.0 %
McDoniel ES 90.2 % 72.0 % 96.0 %
Martinez ES 89.6 % 83.3 % 82.0 %
Lynch ES 96.0 % 96.0 % 96.0 %
Lunt ES 95.0 % 93.0 % 98.0 %
Manch ES 74.0 % 85.0 % 76.0 %
Mackey ES 92.0 % 89.0 % 90.0 %
Mack (Nate) ES 99.0 % 99.0 % 98.0 %
Newton ES 98.0 % 99.0 % 99.0 %
Neal ES 96.0 % 96.0 % 96.0 %
Mitchell ES 97.0 % 98.0 % 98.0 %
Miller (Sandy) ES 98.0 % 97.0 % 96.0 %
Mendoza ES 95.0 % 97.0 % 96.6 %
Mountain View ES 83.0 % 87.0 % 100.0 %
Morrow ES 98.0 % 98.0 % 98.0 %
Moore ES 87.0 % 87.0 % 87.5 %
Lummis ES 100.0 % 100.0 % 98.0 %
Indian Springs Schools 90.0 % 97.0 % 95.0 %
Hummel ES 99.0 % 99.0 % 98.0 %
Hollingsworth ES 77.0 % 90.0 % 95.0 %
Jeffers ES 76.0 % 82.0 % 81.0 %
Jacobson ES 93.0 % 91.0 % 92.0 %
Iverson ES 95.1 % 94.0 % 94.0 %
Hickey ES 98.0 % 89.0 % 95.0 %
Hewetson ES 95.0 % 95.0 % 95.0 %
Lundy ES 100.0 % 100.0 % 100.0 %
Hoggard ES 92.0 % 96.6 % 94.3 %
Hinman ES 90.0 % 90.0 % 93.0 %
Hill ES 95.0 % 92.0 % 93.0 %
Jydstrup ES 96.0 % 94.0 % 91.5 %
Lamping ES 98.0 % 98.0 % 98.0 %
Lake ES 91.0 % 90.0 % 93.0 %
King (Martin Luther Jr) ES 99.0 % 98.0 % 97.0 %
Lowman ES 87.0 % 79.0 % 82.7 %
Long ES 95.0 % 97.0 % 95.0 %
Lincoln ES 100.0 % 95.0 % 94.0 %
Kelly ES 97.0 % 96.0 % 89.8 %
Katz ES 86.0 % 85.0 % 86.0 %
Kahre ES 94.0 % 84.0 % 98.0 %
King (Martha) ES 95.0 % 95.0 % 97.0 %
Kim ES 95.0 % 94.0 % 96.6 %
Kesterson ES 98.0 % 98.0 % 96.0 %
Clark County Schools
'N/A' indicates data are not available.
2008-2009 2007-2008 2006-2007
Page 103 of 125
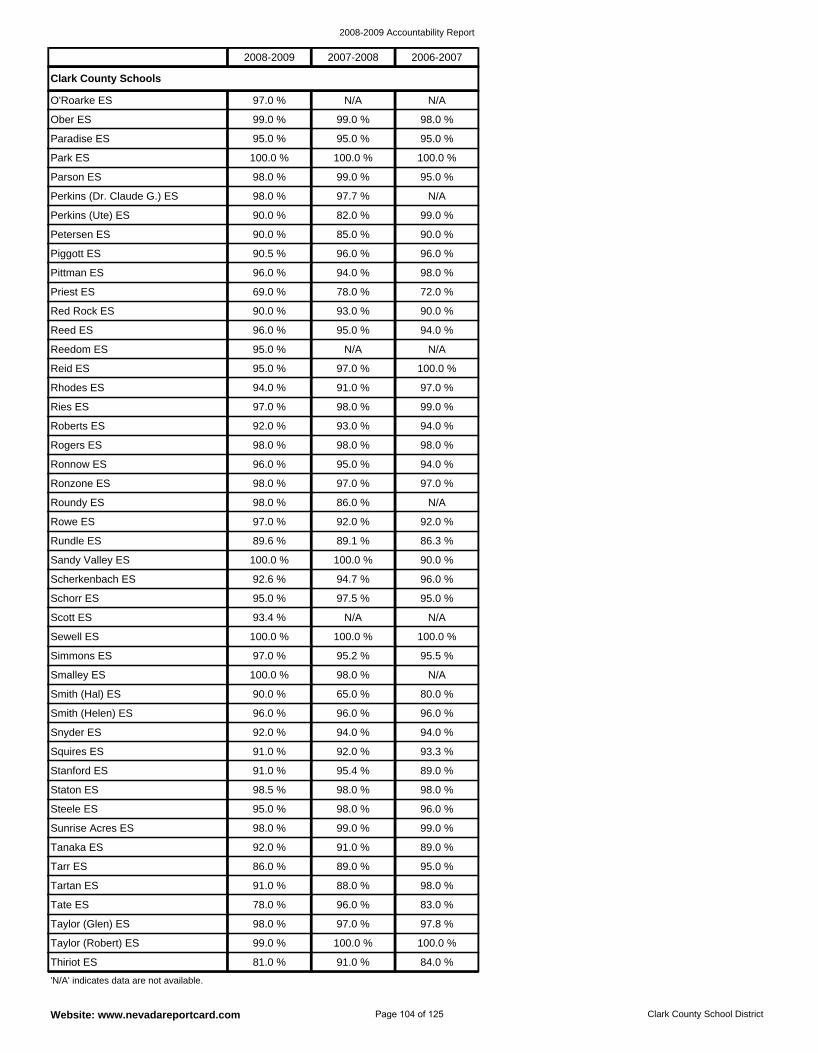
2008-2009 Accountability Report
Website: www.nevadareportcard.com Clark County School District
Squires ES 91.0 % 92.0 % 93.3 %
Snyder ES 92.0 % 94.0 % 94.0 %
Smith (Helen) ES 96.0 % 96.0 % 96.0 %
Steele ES 95.0 % 98.0 % 96.0 %
Staton ES 98.5 % 98.0 % 98.0 %
Stanford ES 91.0 % 95.4 % 89.0 %
Smith (Hal) ES 90.0 % 65.0 % 80.0 %
Scott ES 93.4 % N/A N/A
Schorr ES 95.0 % 97.5 % 95.0 %
Smalley ES 100.0 % 98.0 % N/A
Simmons ES 97.0 % 95.2 % 95.5 %
Sewell ES 100.0 % 100.0 % 100.0 %
Thiriot ES 81.0 % 91.0 % 84.0 %
Taylor (Robert) ES 99.0 % 100.0 % 100.0 %
Tarr ES 86.0 % 89.0 % 95.0 %
Tanaka ES 92.0 % 91.0 % 89.0 %
Sunrise Acres ES 98.0 % 99.0 % 99.0 %
Taylor (Glen) ES 98.0 % 97.0 % 97.8 %
Tate ES 78.0 % 96.0 % 83.0 %
Tartan ES 91.0 % 88.0 % 98.0 %
Sandy Valley ES 100.0 % 100.0 % 90.0 %
Petersen ES 90.0 % 85.0 % 90.0 %
Perkins (Ute) ES 90.0 % 82.0 % 99.0 %
Perkins (Dr. Claude G.) ES 98.0 % 97.7 % N/A
Priest ES 69.0 % 78.0 % 72.0 %
Pittman ES 96.0 % 94.0 % 98.0 %
Piggott ES 90.5 % 96.0 % 96.0 %
Ober ES 99.0 % 99.0 % 98.0 %
O'Roarke ES 97.0 % N/A N/A
Scherkenbach ES 92.6 % 94.7 % 96.0 %
Parson ES 98.0 % 99.0 % 95.0 %
Park ES 100.0 % 100.0 % 100.0 %
Paradise ES 95.0 % 95.0 % 95.0 %
Red Rock ES 90.0 % 93.0 % 90.0 %
Ronzone ES 98.0 % 97.0 % 97.0 %
Ronnow ES 96.0 % 95.0 % 94.0 %
Rogers ES 98.0 % 98.0 % 98.0 %
Rundle ES 89.6 % 89.1 % 86.3 %
Rowe ES 97.0 % 92.0 % 92.0 %
Roundy ES 98.0 % 86.0 % N/A
Reid ES 95.0 % 97.0 % 100.0 %
Reedom ES 95.0 % N/A N/A
Reed ES 96.0 % 95.0 % 94.0 %
Roberts ES 92.0 % 93.0 % 94.0 %
Ries ES 97.0 % 98.0 % 99.0 %
Rhodes ES 94.0 % 91.0 % 97.0 %
Clark County Schools
'N/A' indicates data are not available.
2008-2009 2007-2008 2006-2007
Page 104 of 125
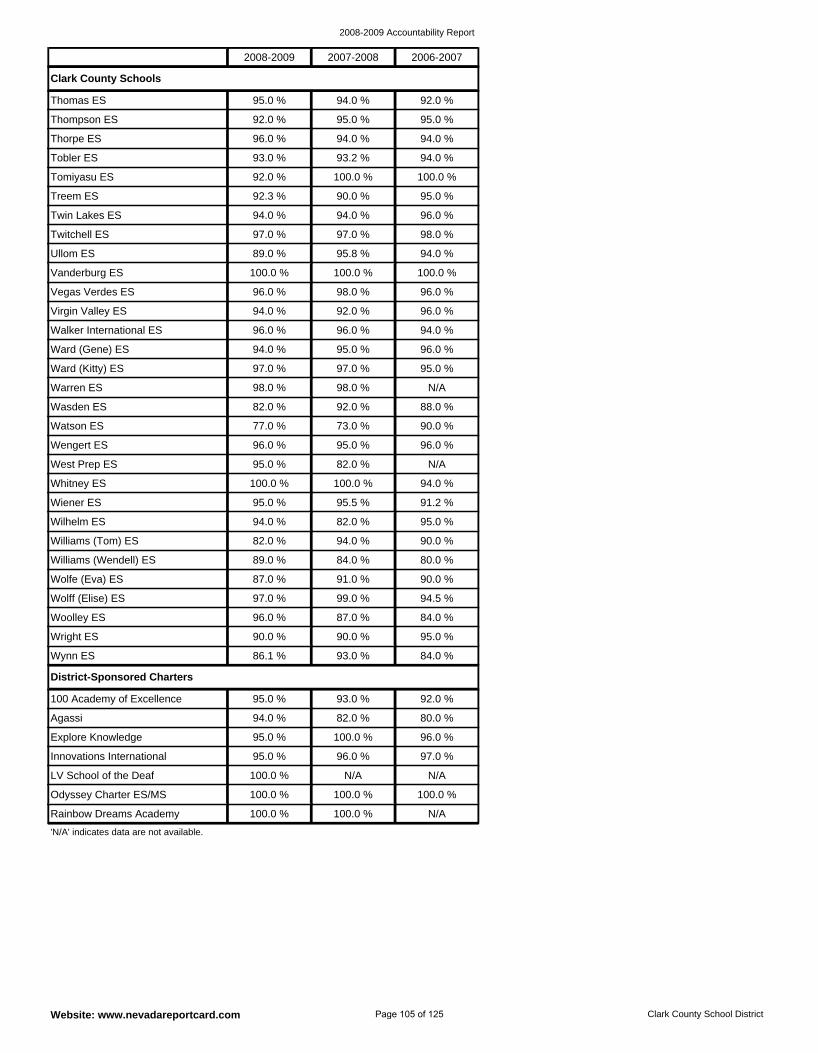
2008-2009 Accountability Report
Website: www.nevadareportcard.com Clark County School District
Agassi 94.0 % 82.0 % 80.0 %
Explore Knowledge 95.0 % 100.0 % 96.0 %
Rainbow Dreams Academy 100.0 % 100.0 % N/A
100 Academy of Excellence 95.0 % 93.0 % 92.0 %
Odyssey Charter ES/MS 100.0 % 100.0 % 100.0 %
LV School of the Deaf 100.0 % N/A N/A
Innovations International 95.0 % 96.0 % 97.0 %
District-Sponsored Charters
Wiener ES 95.0 % 95.5 % 91.2 %
Williams (Tom) ES 82.0 % 94.0 % 90.0 %
Wilhelm ES 94.0 % 82.0 % 95.0 %
Wright ES 90.0 % 90.0 % 95.0 %
West Prep ES 95.0 % 82.0 % N/A
Whitney ES 100.0 % 100.0 % 94.0 %
Woolley ES 96.0 % 87.0 % 84.0 %
Wynn ES 86.1 % 93.0 % 84.0 %
Wengert ES 96.0 % 95.0 % 96.0 %
Williams (Wendell) ES 89.0 % 84.0 % 80.0 %
Wolfe (Eva) ES 87.0 % 91.0 % 90.0 %
Wolff (Elise) ES 97.0 % 99.0 % 94.5 %
Twin Lakes ES 94.0 % 94.0 % 96.0 %
Treem ES 92.3 % 90.0 % 95.0 %
Ullom ES 89.0 % 95.8 % 94.0 %
Twitchell ES 97.0 % 97.0 % 98.0 %
Tomiyasu ES 92.0 % 100.0 % 100.0 %
Thompson ES 92.0 % 95.0 % 95.0 %
Thomas ES 95.0 % 94.0 % 92.0 %
Tobler ES 93.0 % 93.2 % 94.0 %
Thorpe ES 96.0 % 94.0 % 94.0 %
Warren ES 98.0 % 98.0 % N/A
Ward (Kitty) ES 97.0 % 97.0 % 95.0 %
Watson ES 77.0 % 73.0 % 90.0 %
Wasden ES 82.0 % 92.0 % 88.0 %
Ward (Gene) ES 94.0 % 95.0 % 96.0 %
Vegas Verdes ES 96.0 % 98.0 % 96.0 %
Vanderburg ES 100.0 % 100.0 % 100.0 %
Walker International ES 96.0 % 96.0 % 94.0 %
Virgin Valley ES 94.0 % 92.0 % 96.0 %
Clark County Schools
'N/A' indicates data are not available.
2008-2009 2007-2008 2006-2007
Page 105 of 125
2008-2009 Accountability Report
Website: www.nevadareportcard.com Clark County School District
District Communication EffortsParents and community members were encouraged to be active participants in the educational process. The District promoted frequent two-way communication with parents, family, and the community through a variety of meetings, forums, publications and media. • Superintendents and District staff attended community meetings and appeared on radio and television shows, encouraging feedback and fostering positive working relationships. • The Board of School Trustees conducted monthly Parent Advisory Committee (PAC) meetings at various locations in the regions they served. • The Board of School Trustees initiated an interactive television program, “School Matters,” on Vegas PBS that allows community members to ask questions and receive real-time answers on a variety of important district topics. “School Matters” airs several times throughout each school year. • The Board of School Trustees made video coverage of the regular meetings available online with live streaming during the meetings and archived videos afterward. • Video messages from the Superintendent, District staff and the Board were made available online. • The District initiated an extensive public input process related to state-mandated budget cuts. • The District hosted a number of news conferences in order to expand the information provided to the community. • The District developed and distributed to parents a series of grade-specific learning activities to assist with learning over the summer. The entire series was available online. • The Board of School Trustees held Community Linkage meetings to gather community input. • The Board of School Trustees also provided monthly newsletters as well as special edition newsletters to their districts, which included calendar events, helpful information and articles on a variety of topics. • Surveys were distributed to more than 230,000 households requesting feedback from parents regarding all aspects of their child’s schooling. • The District hosted a variety of forums on specific topics at various locations throughout the school year. • The CCSD website contained timely information for parents and provided links to individual school’s Web sites. The online “Straight Talk” feature enabled the community to send comments, suggestions, and concerns directly to the Board of School Trustees and Superintendents. • The District presented “Inside Education,” a 30-minute news program highlighting activities in the District, weekly on Vegas PBS. • Schools throughout the District produced and distributed newsletters about their specific school programs, activities and events. • The District's parental online communication systems, ParentLink, provided a way in English and Spanish for parents and guardians to quickly and securely track their students’ academic progress. In addition, most schools utilized outgoing voice messaging to inform parents of student progress or other important matters. • Parents and community members regularly participated and provided input to critical committees, such as: o Career and Joint Technical Skills Committee o Attendance Zone Advisory Commission (AZAC) o CCSD Textbook Commission o Sex Education Advisory Council o Nevada Partnership for Inclusive Education o Region Child Development Centers • Several District publications provided important information and a means to communicate with District personnel. Those publications were posted on the District’s website. • A parent liaison position is in place and is actively involved with numerous parent organizations to increase parent involvement and communication. The following initiatives were coordinated through the Parent Services office. o Participated in Jo Mackey Parent Information Night. o Participated in the City of Las Vegas- Councilman Ross-Family Information Night. o Coordinated and recruited participants for the Parent School Partnership Training-included teachers, parents and support staff in collaboration with Nevada State Parent Information Center. o Coordinated and recruited participants for the Math and Parent Partnership Training in collaboration with Nevada State Parent Information Resource Center. o Coordinated the CCSD Administrator’s Training with Dr. Karen Mapp. o Coordinated and planned second State Wide Parent Involvement Summit- hosted at the Northwest Career and Technical Academy. o Created the Parent Glossary of Terms to be included in the CCSD Back to School Reporter. o Participated in the Desert Rose Health and Wellness Fair. o Conducted Behavioral Communications Workshop at the Nevada State Annual Convention. o Participated in the Jo Mackey Family Spring Carnival. o Participated on Diversity Panel for the 2008 HOBY Leadership Conference. o Completed the Nevada PIRC Train the Trainer- Teacher Training on Effective Parent Engagement. o Coordinate the district wide Parent Engagement Forum-meets monthly throughout the school year. o Participate in the Latino Youth Leadership Conference-Planning Committee 2008. o Participate with and advise the Statewide Parent Advisory Council created in 2007.
Page 106 of 125
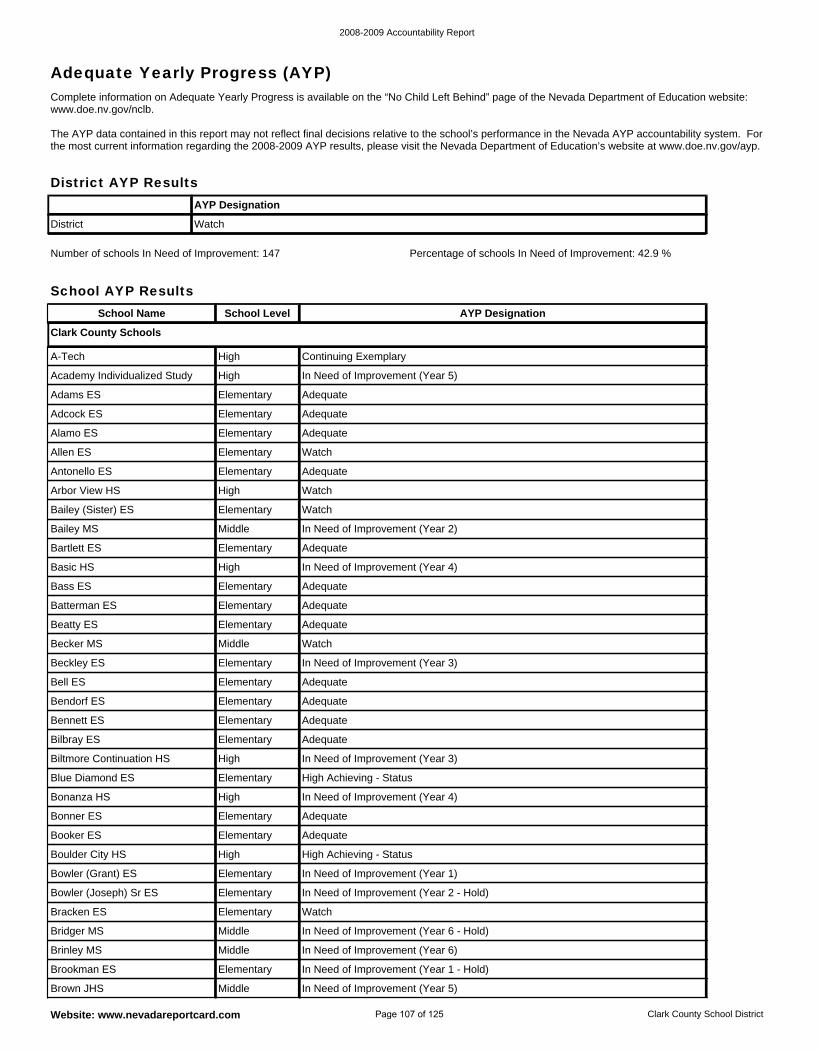
2008-2009 Accountability Report
Website: www.nevadareportcard.com Clark County School District
Adequate Yearly Progress (AYP)Complete information on Adequate Yearly Progress is available on the “No Child Left Behind” page of the Nevada Department of Education website: www.doe.nv.gov/nclb. The AYP data contained in this report may not reflect final decisions relative to the school’s performance in the Nevada AYP accountability system. For the most current information regarding the 2008-2009 AYP results, please visit the Nevada Department of Education’s website at www.doe.nv.gov/ayp.
District AYP Results
School AYP Results
Brown JHS Middle In Need of Improvement (Year 5)
Brookman ES Elementary In Need of Improvement (Year 1 - Hold)
Brinley MS Middle In Need of Improvement (Year 6)
Bridger MS Middle In Need of Improvement (Year 6 - Hold)
Boulder City HS High High Achieving - Status
Booker ES Elementary Adequate
Bracken ES Elementary Watch
Bowler (Joseph) Sr ES Elementary In Need of Improvement (Year 2 - Hold)
Bowler (Grant) ES Elementary In Need of Improvement (Year 1)
Arbor View HS High Watch
Antonello ES Elementary Adequate
Allen ES Elementary Watch
Bartlett ES Elementary Adequate
Bailey MS Middle In Need of Improvement (Year 2)
Bailey (Sister) ES Elementary Watch
Academy Individualized Study High In Need of Improvement (Year 5)
A-Tech High Continuing Exemplary
Bonner ES Elementary Adequate
Alamo ES Elementary Adequate
Adcock ES Elementary Adequate
Adams ES Elementary Adequate
Basic HS High In Need of Improvement (Year 4)
Bilbray ES Elementary Adequate
Bennett ES Elementary Adequate
Bendorf ES Elementary Adequate
Bonanza HS High In Need of Improvement (Year 4)
Blue Diamond ES Elementary High Achieving - Status
Biltmore Continuation HS High In Need of Improvement (Year 3)
Beatty ES Elementary Adequate
Batterman ES Elementary Adequate
Bass ES Elementary Adequate
Bell ES Elementary Adequate
Beckley ES Elementary In Need of Improvement (Year 3)
Becker MS Middle Watch
Clark County Schools
School Name School Level AYP Designation
District Watch
AYP Designation
Number of schools In Need of Improvement: 147 Percentage of schools In Need of Improvement: 42.9 %
Page 107 of 125
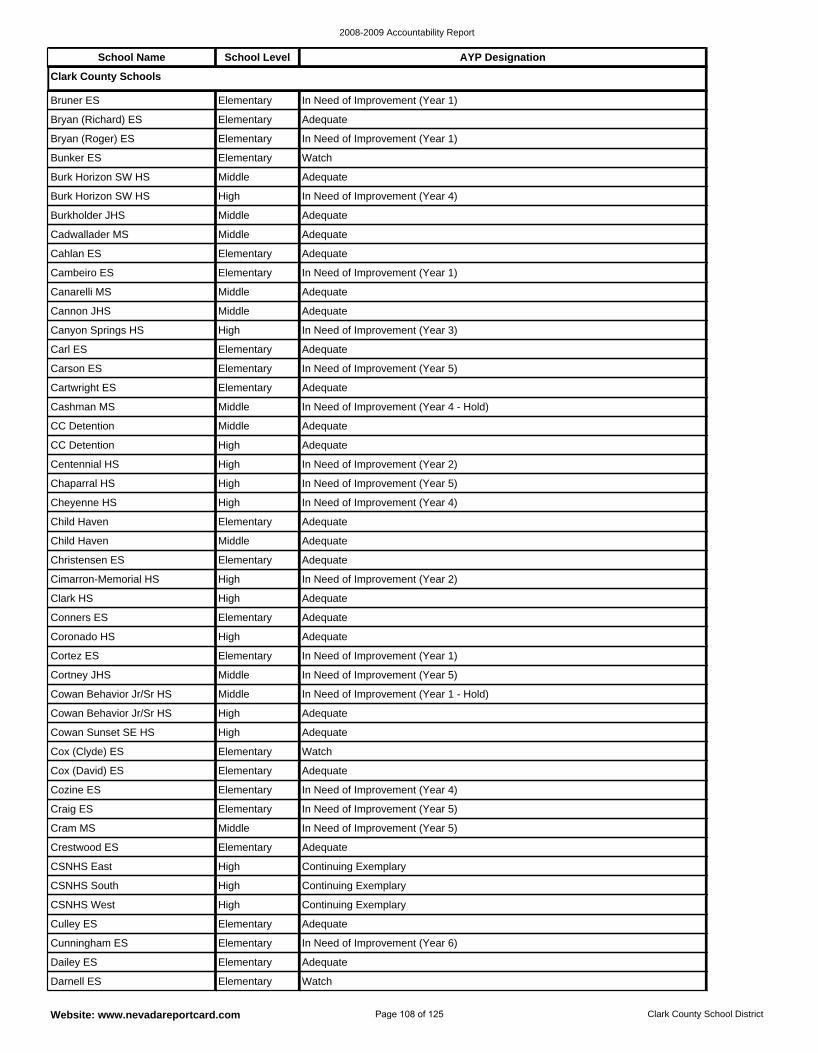
2008-2009 Accountability Report
Website: www.nevadareportcard.com Clark County School District
Cox (Clyde) ES Elementary Watch
Cowan Sunset SE HS High Adequate
Cowan Behavior Jr/Sr HS High Adequate
Craig ES Elementary In Need of Improvement (Year 5)
Cozine ES Elementary In Need of Improvement (Year 4)
Cox (David) ES Elementary Adequate
Cowan Behavior Jr/Sr HS Middle In Need of Improvement (Year 1 - Hold)
Conners ES Elementary Adequate
Clark HS High Adequate
Cimarron-Memorial HS High In Need of Improvement (Year 2)
Cortney JHS Middle In Need of Improvement (Year 5)
Cortez ES Elementary In Need of Improvement (Year 1)
Coronado HS High Adequate
Darnell ES Elementary Watch
Dailey ES Elementary Adequate
Cunningham ES Elementary In Need of Improvement (Year 6)
CSNHS East High Continuing Exemplary
Crestwood ES Elementary Adequate
Cram MS Middle In Need of Improvement (Year 5)
Culley ES Elementary Adequate
CSNHS West High Continuing Exemplary
CSNHS South High Continuing Exemplary
Cadwallader MS Middle Adequate
Burkholder JHS Middle Adequate
Burk Horizon SW HS High In Need of Improvement (Year 4)
Canarelli MS Middle Adequate
Cambeiro ES Elementary In Need of Improvement (Year 1)
Cahlan ES Elementary Adequate
Bryan (Richard) ES Elementary Adequate
Bruner ES Elementary In Need of Improvement (Year 1)
Christensen ES Elementary Adequate
Burk Horizon SW HS Middle Adequate
Bunker ES Elementary Watch
Bryan (Roger) ES Elementary In Need of Improvement (Year 1)
Cannon JHS Middle Adequate
Chaparral HS High In Need of Improvement (Year 5)
Centennial HS High In Need of Improvement (Year 2)
CC Detention High Adequate
Child Haven Middle Adequate
Child Haven Elementary Adequate
Cheyenne HS High In Need of Improvement (Year 4)
Carson ES Elementary In Need of Improvement (Year 5)
Carl ES Elementary Adequate
Canyon Springs HS High In Need of Improvement (Year 3)
CC Detention Middle Adequate
Cashman MS Middle In Need of Improvement (Year 4 - Hold)
Cartwright ES Elementary Adequate
Clark County Schools
School Name School Level AYP Designation
Page 108 of 125
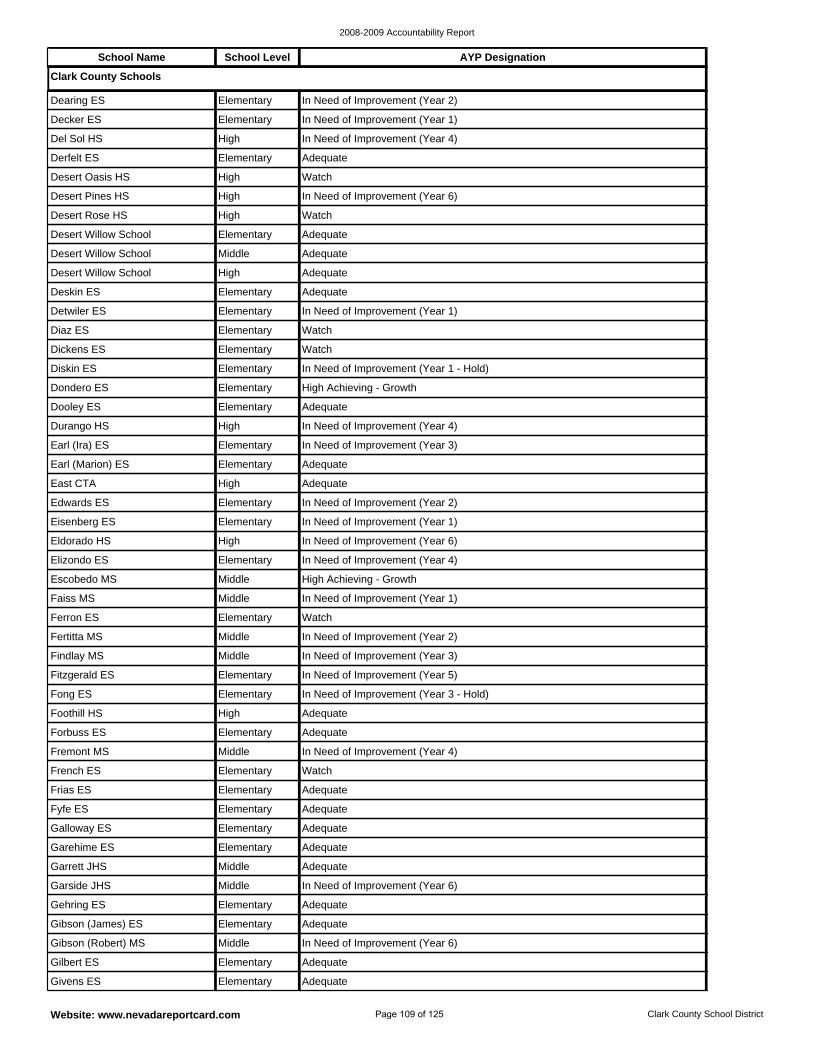
2008-2009 Accountability Report
Website: www.nevadareportcard.com Clark County School District
Fremont MS Middle In Need of Improvement (Year 4)
Forbuss ES Elementary Adequate
Foothill HS High Adequate
Fyfe ES Elementary Adequate
Frias ES Elementary Adequate
French ES Elementary Watch
Fong ES Elementary In Need of Improvement (Year 3 - Hold)
Ferron ES Elementary Watch
Faiss MS Middle In Need of Improvement (Year 1)
Escobedo MS Middle High Achieving - Growth
Fitzgerald ES Elementary In Need of Improvement (Year 5)
Findlay MS Middle In Need of Improvement (Year 3)
Fertitta MS Middle In Need of Improvement (Year 2)
Givens ES Elementary Adequate
Gilbert ES Elementary Adequate
Gibson (Robert) MS Middle In Need of Improvement (Year 6)
Garrett JHS Middle Adequate
Garehime ES Elementary Adequate
Galloway ES Elementary Adequate
Gibson (James) ES Elementary Adequate
Gehring ES Elementary Adequate
Garside JHS Middle In Need of Improvement (Year 6)
Desert Willow School Elementary Adequate
Desert Rose HS High Watch
Desert Pines HS High In Need of Improvement (Year 6)
Deskin ES Elementary Adequate
Desert Willow School High Adequate
Desert Willow School Middle Adequate
Decker ES Elementary In Need of Improvement (Year 1)
Dearing ES Elementary In Need of Improvement (Year 2)
Elizondo ES Elementary In Need of Improvement (Year 4)
Desert Oasis HS High Watch
Derfelt ES Elementary Adequate
Del Sol HS High In Need of Improvement (Year 4)
Detwiler ES Elementary In Need of Improvement (Year 1)
East CTA High Adequate
Earl (Marion) ES Elementary Adequate
Earl (Ira) ES Elementary In Need of Improvement (Year 3)
Eldorado HS High In Need of Improvement (Year 6)
Eisenberg ES Elementary In Need of Improvement (Year 1)
Edwards ES Elementary In Need of Improvement (Year 2)
Diskin ES Elementary In Need of Improvement (Year 1 - Hold)
Dickens ES Elementary Watch
Diaz ES Elementary Watch
Durango HS High In Need of Improvement (Year 4)
Dooley ES Elementary Adequate
Dondero ES Elementary High Achieving - Growth
Clark County Schools
School Name School Level AYP Designation
Page 109 of 125
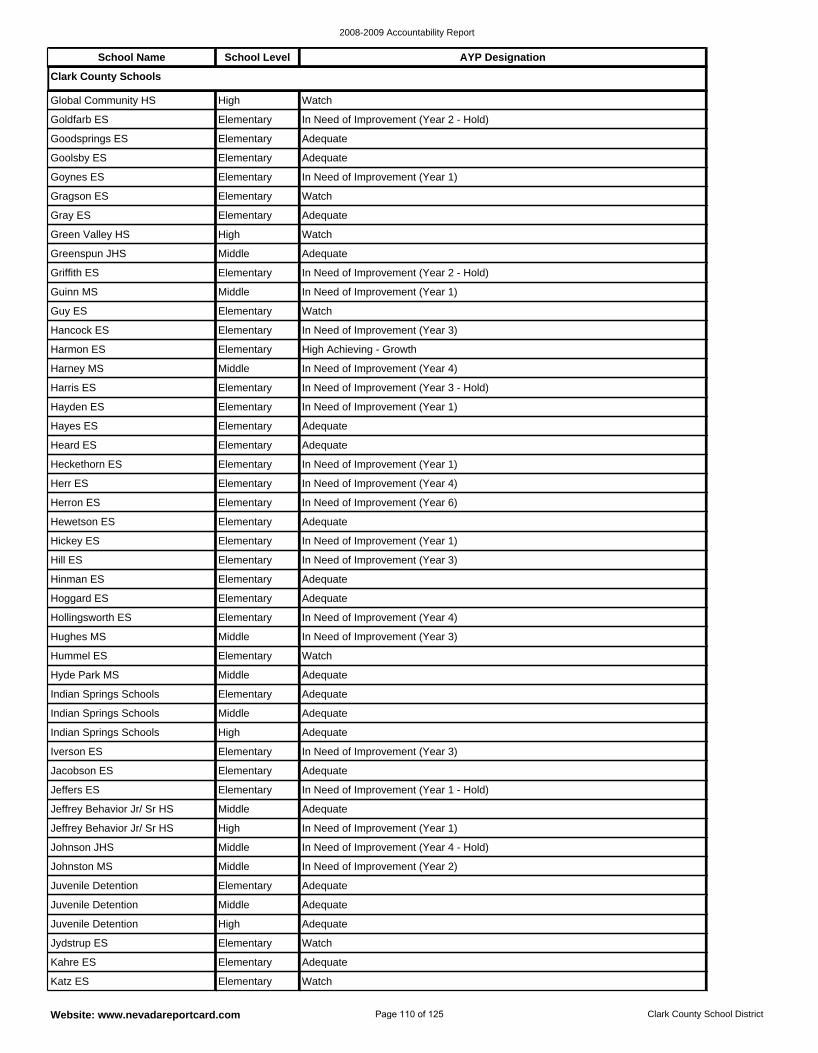
2008-2009 Accountability Report
Website: www.nevadareportcard.com Clark County School District
Iverson ES Elementary In Need of Improvement (Year 3)
Indian Springs Schools High Adequate
Indian Springs Schools Middle Adequate
Jeffrey Behavior Jr/ Sr HS Middle Adequate
Jeffers ES Elementary In Need of Improvement (Year 1 - Hold)
Jacobson ES Elementary Adequate
Indian Springs Schools Elementary Adequate
Hollingsworth ES Elementary In Need of Improvement (Year 4)
Hoggard ES Elementary Adequate
Hinman ES Elementary Adequate
Hyde Park MS Middle Adequate
Hummel ES Elementary Watch
Hughes MS Middle In Need of Improvement (Year 3)
Katz ES Elementary Watch
Kahre ES Elementary Adequate
Jydstrup ES Elementary Watch
Johnston MS Middle In Need of Improvement (Year 2)
Johnson JHS Middle In Need of Improvement (Year 4 - Hold)
Jeffrey Behavior Jr/ Sr HS High In Need of Improvement (Year 1)
Juvenile Detention High Adequate
Juvenile Detention Middle Adequate
Juvenile Detention Elementary Adequate
Green Valley HS High Watch
Gray ES Elementary Adequate
Gragson ES Elementary Watch
Guinn MS Middle In Need of Improvement (Year 1)
Griffith ES Elementary In Need of Improvement (Year 2 - Hold)
Greenspun JHS Middle Adequate
Goldfarb ES Elementary In Need of Improvement (Year 2 - Hold)
Global Community HS High Watch
Hill ES Elementary In Need of Improvement (Year 3)
Goynes ES Elementary In Need of Improvement (Year 1)
Goolsby ES Elementary Adequate
Goodsprings ES Elementary Adequate
Guy ES Elementary Watch
Herr ES Elementary In Need of Improvement (Year 4)
Heckethorn ES Elementary In Need of Improvement (Year 1)
Heard ES Elementary Adequate
Hickey ES Elementary In Need of Improvement (Year 1)
Hewetson ES Elementary Adequate
Herron ES Elementary In Need of Improvement (Year 6)
Harney MS Middle In Need of Improvement (Year 4)
Harmon ES Elementary High Achieving - Growth
Hancock ES Elementary In Need of Improvement (Year 3)
Hayes ES Elementary Adequate
Hayden ES Elementary In Need of Improvement (Year 1)
Harris ES Elementary In Need of Improvement (Year 3 - Hold)
Clark County Schools
School Name School Level AYP Designation
Page 110 of 125
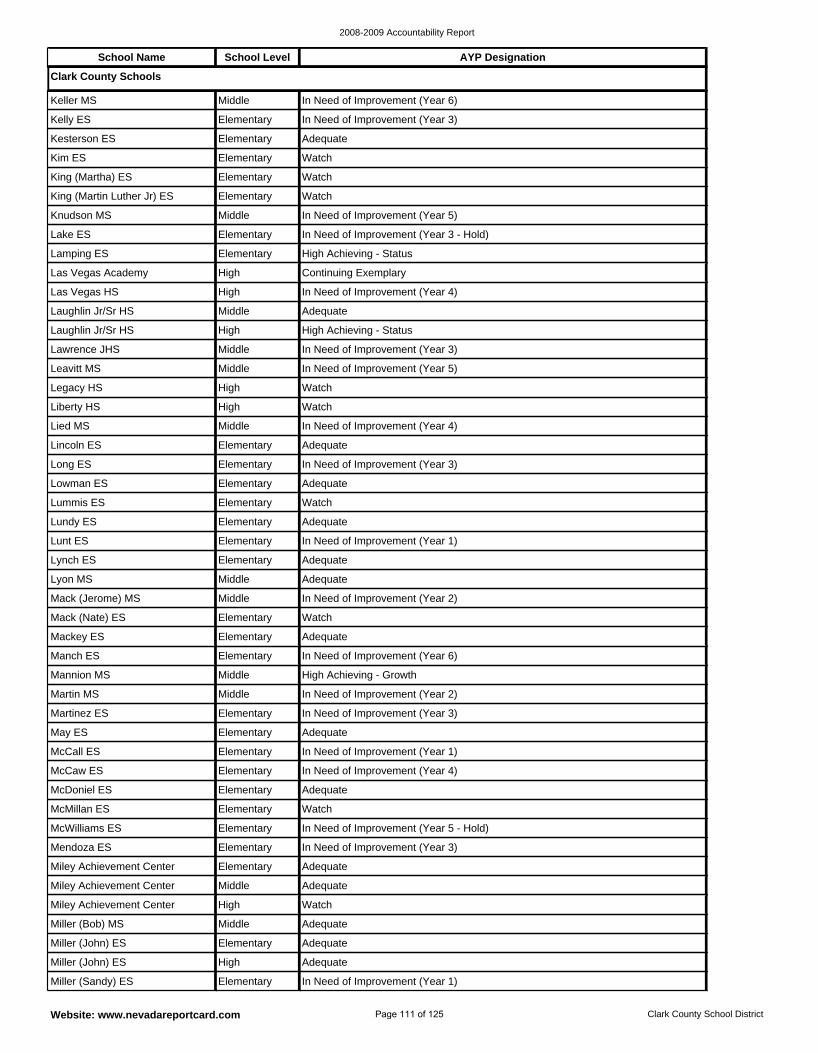
2008-2009 Accountability Report
Website: www.nevadareportcard.com Clark County School District
McCall ES Elementary In Need of Improvement (Year 1)
May ES Elementary Adequate
Martinez ES Elementary In Need of Improvement (Year 3)
McMillan ES Elementary Watch
McDoniel ES Elementary Adequate
McCaw ES Elementary In Need of Improvement (Year 4)
Martin MS Middle In Need of Improvement (Year 2)
Mack (Nate) ES Elementary Watch
Mack (Jerome) MS Middle In Need of Improvement (Year 2)
Lyon MS Middle Adequate
Mannion MS Middle High Achieving - Growth
Manch ES Elementary In Need of Improvement (Year 6)
Mackey ES Elementary Adequate
Miller (Sandy) ES Elementary In Need of Improvement (Year 1)
Miller (John) ES High Adequate
Miller (John) ES Elementary Adequate
Miley Achievement Center Elementary Adequate
Mendoza ES Elementary In Need of Improvement (Year 3)
McWilliams ES Elementary In Need of Improvement (Year 5 - Hold)
Miller (Bob) MS Middle Adequate
Miley Achievement Center High Watch
Miley Achievement Center Middle Adequate
Lake ES Elementary In Need of Improvement (Year 3 - Hold)
Knudson MS Middle In Need of Improvement (Year 5)
King (Martin Luther Jr) ES Elementary Watch
Las Vegas HS High In Need of Improvement (Year 4)
Las Vegas Academy High Continuing Exemplary
Lamping ES Elementary High Achieving - Status
Kelly ES Elementary In Need of Improvement (Year 3)
Keller MS Middle In Need of Improvement (Year 6)
Lynch ES Elementary Adequate
King (Martha) ES Elementary Watch
Kim ES Elementary Watch
Kesterson ES Elementary Adequate
Laughlin Jr/Sr HS Middle Adequate
Lowman ES Elementary Adequate
Long ES Elementary In Need of Improvement (Year 3)
Lincoln ES Elementary Adequate
Lunt ES Elementary In Need of Improvement (Year 1)
Lundy ES Elementary Adequate
Lummis ES Elementary Watch
Leavitt MS Middle In Need of Improvement (Year 5)
Lawrence JHS Middle In Need of Improvement (Year 3)
Laughlin Jr/Sr HS High High Achieving - Status
Lied MS Middle In Need of Improvement (Year 4)
Liberty HS High Watch
Legacy HS High Watch
Clark County Schools
School Name School Level AYP Designation
Page 111 of 125
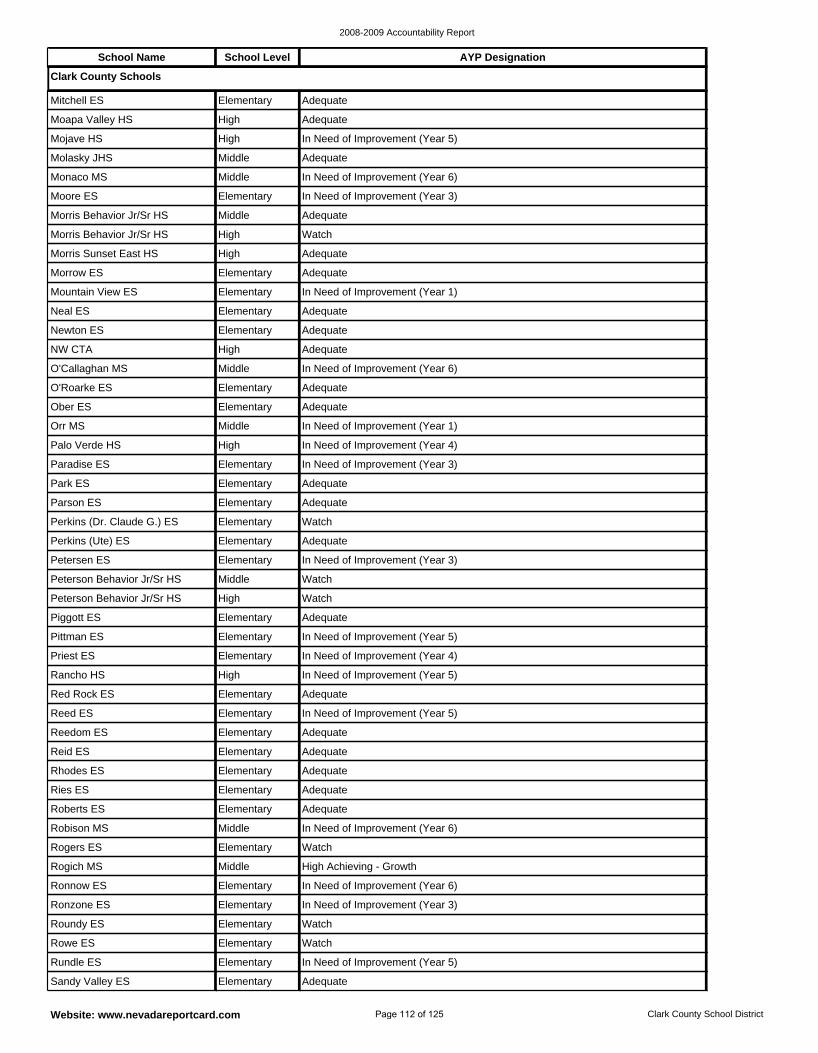
2008-2009 Accountability Report
Website: www.nevadareportcard.com Clark County School District
Reid ES Elementary Adequate
Reedom ES Elementary Adequate
Reed ES Elementary In Need of Improvement (Year 5)
Roberts ES Elementary Adequate
Ries ES Elementary Adequate
Rhodes ES Elementary Adequate
Red Rock ES Elementary Adequate
Piggott ES Elementary Adequate
Peterson Behavior Jr/Sr HS High Watch
Peterson Behavior Jr/Sr HS Middle Watch
Rancho HS High In Need of Improvement (Year 5)
Priest ES Elementary In Need of Improvement (Year 4)
Pittman ES Elementary In Need of Improvement (Year 5)
Sandy Valley ES Elementary Adequate
Rundle ES Elementary In Need of Improvement (Year 5)
Rowe ES Elementary Watch
Rogich MS Middle High Achieving - Growth
Rogers ES Elementary Watch
Robison MS Middle In Need of Improvement (Year 6)
Roundy ES Elementary Watch
Ronzone ES Elementary In Need of Improvement (Year 3)
Ronnow ES Elementary In Need of Improvement (Year 6)
Morris Behavior Jr/Sr HS High Watch
Morris Behavior Jr/Sr HS Middle Adequate
Moore ES Elementary In Need of Improvement (Year 3)
Mountain View ES Elementary In Need of Improvement (Year 1)
Morrow ES Elementary Adequate
Morris Sunset East HS High Adequate
Moapa Valley HS High Adequate
Mitchell ES Elementary Adequate
Petersen ES Elementary In Need of Improvement (Year 3)
Monaco MS Middle In Need of Improvement (Year 6)
Molasky JHS Middle Adequate
Mojave HS High In Need of Improvement (Year 5)
Neal ES Elementary Adequate
Park ES Elementary Adequate
Paradise ES Elementary In Need of Improvement (Year 3)
Palo Verde HS High In Need of Improvement (Year 4)
Perkins (Ute) ES Elementary Adequate
Perkins (Dr. Claude G.) ES Elementary Watch
Parson ES Elementary Adequate
O'Callaghan MS Middle In Need of Improvement (Year 6)
NW CTA High Adequate
Newton ES Elementary Adequate
Orr MS Middle In Need of Improvement (Year 1)
Ober ES Elementary Adequate
O'Roarke ES Elementary Adequate
Clark County Schools
School Name School Level AYP Designation
Page 112 of 125
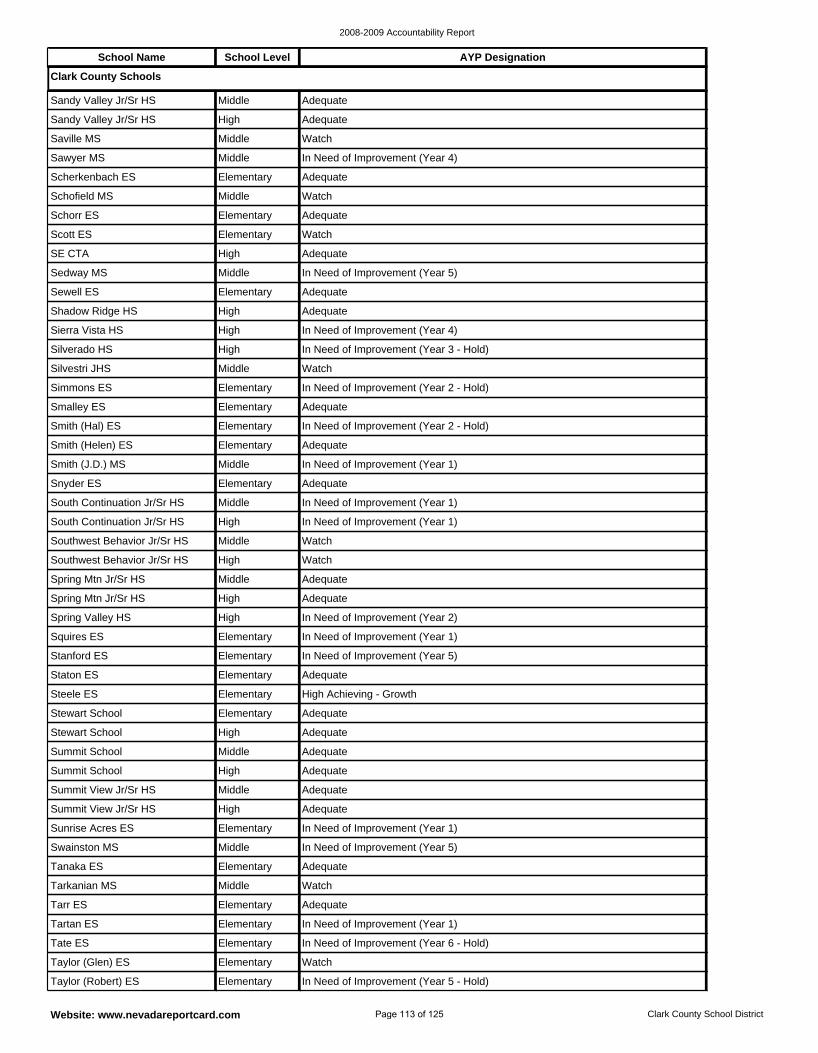
2008-2009 Accountability Report
Website: www.nevadareportcard.com Clark County School District
Summit School Middle Adequate
Stewart School High Adequate
Stewart School Elementary Adequate
Summit View Jr/Sr HS High Adequate
Summit View Jr/Sr HS Middle Adequate
Summit School High Adequate
Steele ES Elementary High Achieving - Growth
Spring Valley HS High In Need of Improvement (Year 2)
Spring Mtn Jr/Sr HS High Adequate
Spring Mtn Jr/Sr HS Middle Adequate
Staton ES Elementary Adequate
Stanford ES Elementary In Need of Improvement (Year 5)
Squires ES Elementary In Need of Improvement (Year 1)
Taylor (Robert) ES Elementary In Need of Improvement (Year 5 - Hold)
Taylor (Glen) ES Elementary Watch
Tate ES Elementary In Need of Improvement (Year 6 - Hold)
Tanaka ES Elementary Adequate
Swainston MS Middle In Need of Improvement (Year 5)
Sunrise Acres ES Elementary In Need of Improvement (Year 1)
Tartan ES Elementary In Need of Improvement (Year 1)
Tarr ES Elementary Adequate
Tarkanian MS Middle Watch
Scott ES Elementary Watch
Schorr ES Elementary Adequate
Schofield MS Middle Watch
Sewell ES Elementary Adequate
Sedway MS Middle In Need of Improvement (Year 5)
SE CTA High Adequate
Sandy Valley Jr/Sr HS High Adequate
Sandy Valley Jr/Sr HS Middle Adequate
Southwest Behavior Jr/Sr HS High Watch
Scherkenbach ES Elementary Adequate
Sawyer MS Middle In Need of Improvement (Year 4)
Saville MS Middle Watch
Shadow Ridge HS High Adequate
Snyder ES Elementary Adequate
Smith (J.D.) MS Middle In Need of Improvement (Year 1)
Smith (Helen) ES Elementary Adequate
Southwest Behavior Jr/Sr HS Middle Watch
South Continuation Jr/Sr HS High In Need of Improvement (Year 1)
South Continuation Jr/Sr HS Middle In Need of Improvement (Year 1)
Silvestri JHS Middle Watch
Silverado HS High In Need of Improvement (Year 3 - Hold)
Sierra Vista HS High In Need of Improvement (Year 4)
Smith (Hal) ES Elementary In Need of Improvement (Year 2 - Hold)
Smalley ES Elementary Adequate
Simmons ES Elementary In Need of Improvement (Year 2 - Hold)
Clark County Schools
School Name School Level AYP Designation
Page 113 of 125
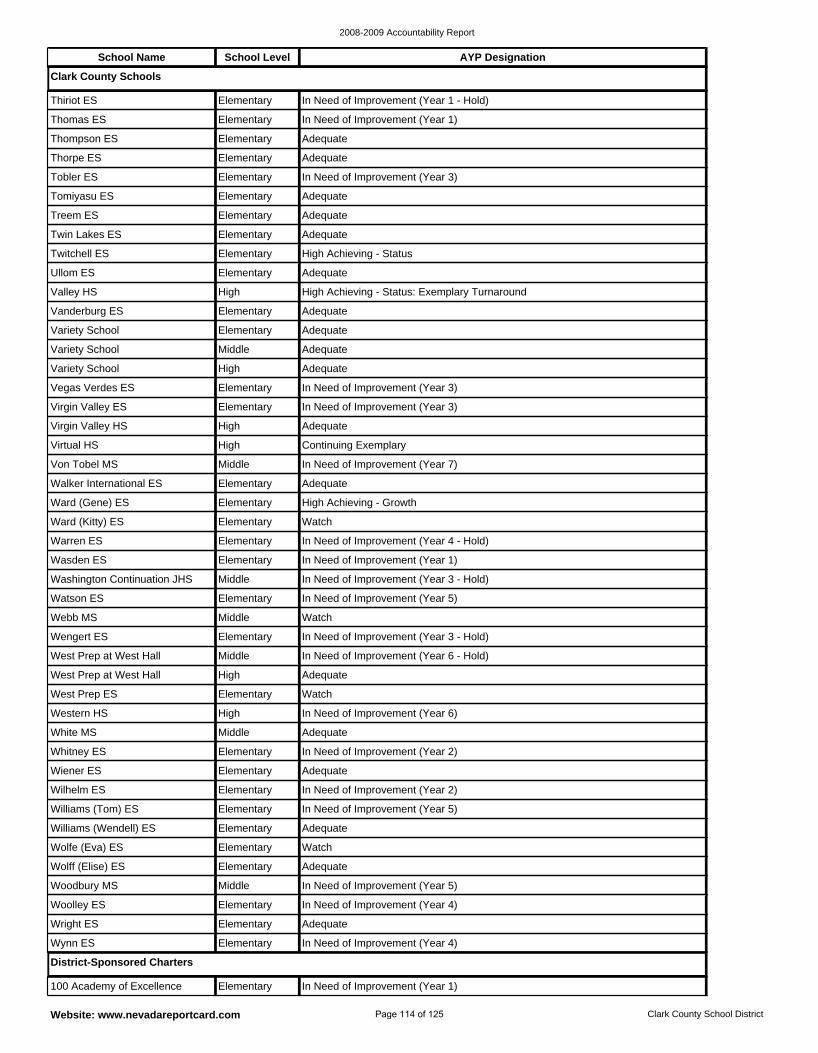
2008-2009 Accountability Report
Website: www.nevadareportcard.com Clark County School District
100 Academy of Excellence Elementary In Need of Improvement (Year 1)
District-Sponsored Charters
West Prep ES Elementary Watch
West Prep at West Hall High Adequate
Western HS High In Need of Improvement (Year 6)
Whitney ES Elementary In Need of Improvement (Year 2)
White MS Middle Adequate
Watson ES Elementary In Need of Improvement (Year 5)
Washington Continuation JHS Middle In Need of Improvement (Year 3 - Hold)
Webb MS Middle Watch
West Prep at West Hall Middle In Need of Improvement (Year 6 - Hold)
Wengert ES Elementary In Need of Improvement (Year 3 - Hold)
Woodbury MS Middle In Need of Improvement (Year 5)
Wolff (Elise) ES Elementary Adequate
Woolley ES Elementary In Need of Improvement (Year 4)
Wynn ES Elementary In Need of Improvement (Year 4)
Wright ES Elementary Adequate
Wilhelm ES Elementary In Need of Improvement (Year 2)
Wiener ES Elementary Adequate
Williams (Tom) ES Elementary In Need of Improvement (Year 5)
Wolfe (Eva) ES Elementary Watch
Williams (Wendell) ES Elementary Adequate
Wasden ES Elementary In Need of Improvement (Year 1)
Twitchell ES Elementary High Achieving - Status
Twin Lakes ES Elementary Adequate
Treem ES Elementary Adequate
Vanderburg ES Elementary Adequate
Valley HS High High Achieving - Status: Exemplary Turnaround
Ullom ES Elementary Adequate
Thompson ES Elementary Adequate
Thomas ES Elementary In Need of Improvement (Year 1)
Thiriot ES Elementary In Need of Improvement (Year 1 - Hold)
Tomiyasu ES Elementary Adequate
Tobler ES Elementary In Need of Improvement (Year 3)
Thorpe ES Elementary Adequate
Walker International ES Elementary Adequate
Von Tobel MS Middle In Need of Improvement (Year 7)
Virtual HS High Continuing Exemplary
Warren ES Elementary In Need of Improvement (Year 4 - Hold)
Ward (Kitty) ES Elementary Watch
Ward (Gene) ES Elementary High Achieving - Growth
Variety School High Adequate
Variety School Middle Adequate
Variety School Elementary Adequate
Virgin Valley HS High Adequate
Virgin Valley ES Elementary In Need of Improvement (Year 3)
Vegas Verdes ES Elementary In Need of Improvement (Year 3)
Clark County Schools
School Name School Level AYP Designation
Page 114 of 125
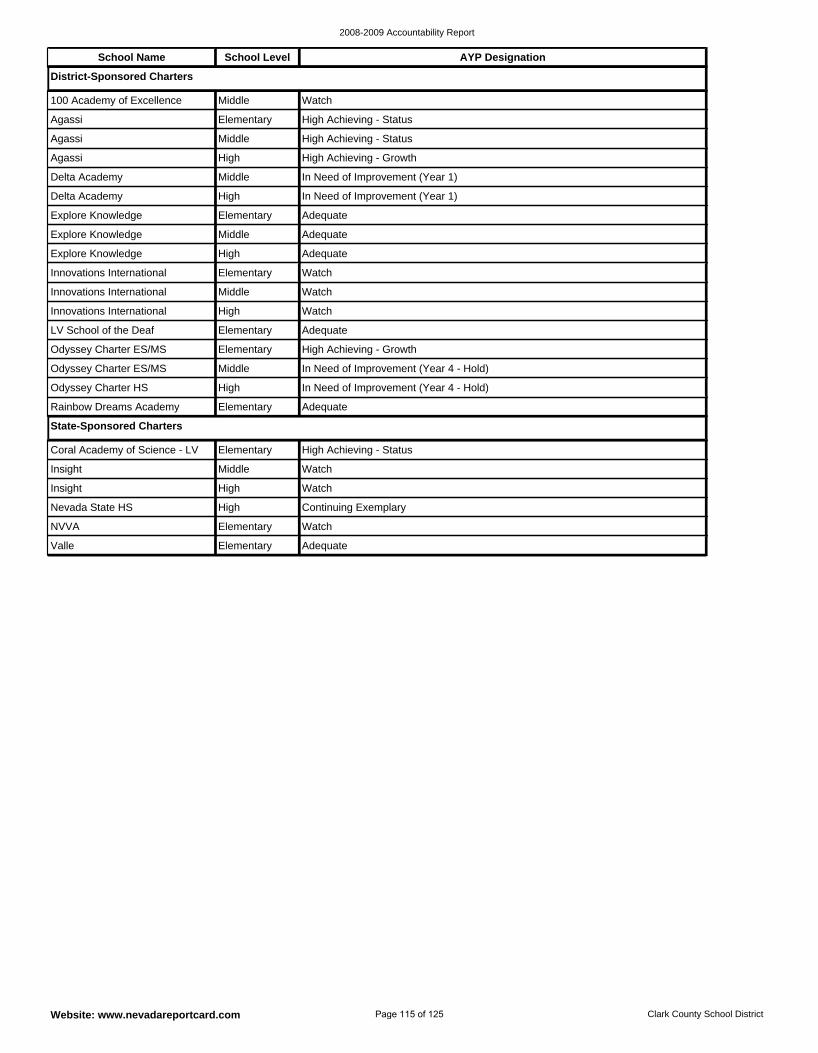
2008-2009 Accountability Report
Website: www.nevadareportcard.com Clark County School District
Insight Middle Watch
Coral Academy of Science - LV Elementary High Achieving - Status
Valle Elementary Adequate
Insight High Watch
NVVA Elementary Watch
Nevada State HS High Continuing Exemplary
State-Sponsored Charters
Odyssey Charter ES/MS Elementary High Achieving - Growth
LV School of the Deaf Elementary Adequate
Odyssey Charter HS High In Need of Improvement (Year 4 - Hold)
Rainbow Dreams Academy Elementary Adequate
Innovations International High Watch
Odyssey Charter ES/MS Middle In Need of Improvement (Year 4 - Hold)
Agassi High High Achieving - Growth
Delta Academy Middle In Need of Improvement (Year 1)
Agassi Middle High Achieving - Status
100 Academy of Excellence Middle Watch
Agassi Elementary High Achieving - Status
Delta Academy High In Need of Improvement (Year 1)
Innovations International Elementary Watch
Innovations International Middle Watch
Explore Knowledge High Adequate
Explore Knowledge Elementary Adequate
Explore Knowledge Middle Adequate
District-Sponsored Charters
School Name School Level AYP Designation
Page 115 of 125
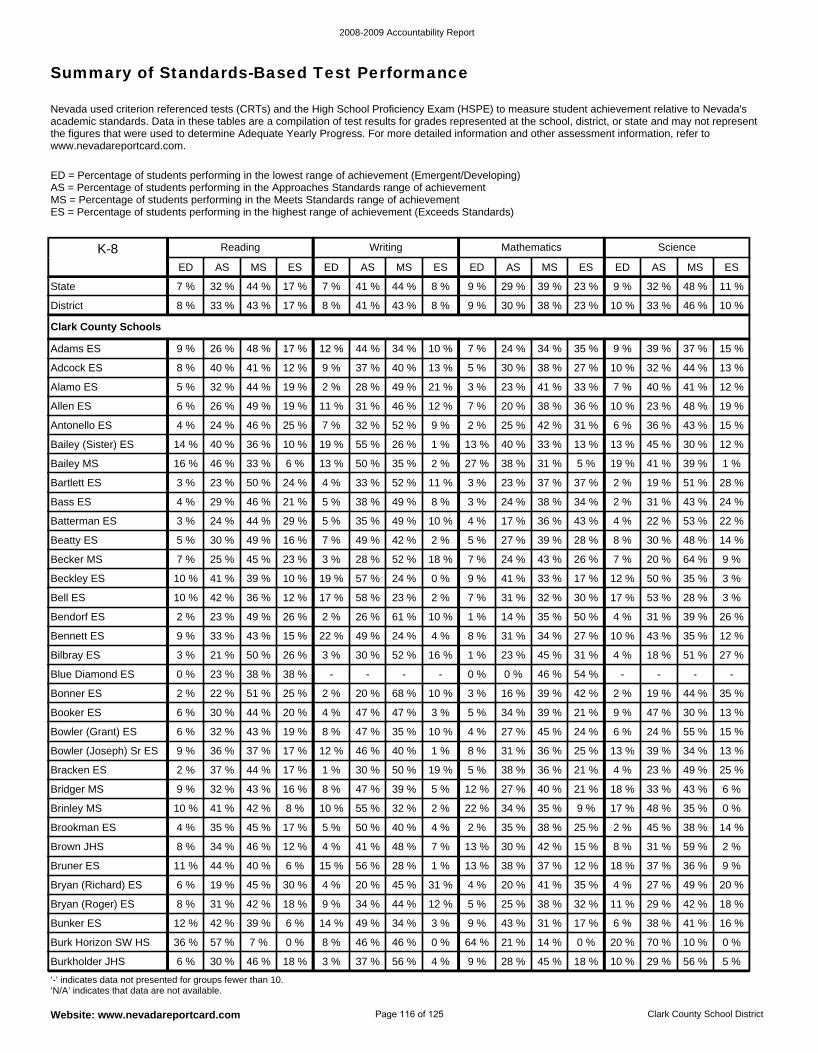
2008-2009 Accountability Report
Website: www.nevadareportcard.com Clark County School District
Summary of Standards-Based Test Performance
Nevada used criterion referenced tests (CRTs) and the High School Proficiency Exam (HSPE) to measure student achievement relative to Nevada's academic standards. Data in these tables are a compilation of test results for grades represented at the school, district, or state and may not represent the figures that were used to determine Adequate Yearly Progress. For more detailed information and other assessment information, refer to www.nevadareportcard.com.
ED = Percentage of students performing in the lowest range of achievement (Emergent/Developing) AS = Percentage of students performing in the Approaches Standards range of achievement MS = Percentage of students performing in the Meets Standards range of achievement ES = Percentage of students performing in the highest range of achievement (Exceeds Standards)
Bryan (Roger) ES 8 % 31 % 42 % 18 % 9 % 34 % 44 % 12 % 5 % 25 % 38 % 32 % 11 % 29 % 42 % 18 %
Bryan (Richard) ES 6 % 19 % 45 % 30 % 4 % 20 % 45 % 31 % 4 % 20 % 41 % 35 % 4 % 27 % 49 % 20 %
Bruner ES 11 % 44 % 40 % 6 % 15 % 56 % 28 % 1 % 13 % 38 % 37 % 12 % 18 % 37 % 36 % 9 %
Burkholder JHS 6 % 30 % 46 % 18 % 3 % 37 % 56 % 4 % 9 % 28 % 45 % 18 % 10 % 29 % 56 % 5 %
Burk Horizon SW HS 36 % 57 % 7 % 0 % 8 % 46 % 46 % 0 % 64 % 21 % 14 % 0 % 20 % 70 % 10 % 0 %
Bunker ES 12 % 42 % 39 % 6 % 14 % 49 % 34 % 3 % 9 % 43 % 31 % 17 % 6 % 38 % 41 % 16 %
Bridger MS 9 % 32 % 43 % 16 % 8 % 47 % 39 % 5 % 12 % 27 % 40 % 21 % 18 % 33 % 43 % 6 %
Bracken ES 2 % 37 % 44 % 17 % 1 % 30 % 50 % 19 % 5 % 38 % 36 % 21 % 4 % 23 % 49 % 25 %
Brown JHS 8 % 34 % 46 % 12 % 4 % 41 % 48 % 7 % 13 % 30 % 42 % 15 % 8 % 31 % 59 % 2 %
Brookman ES 4 % 35 % 45 % 17 % 5 % 50 % 40 % 4 % 2 % 35 % 38 % 25 % 2 % 45 % 38 % 14 %
Brinley MS 10 % 41 % 42 % 8 % 10 % 55 % 32 % 2 % 22 % 34 % 35 % 9 % 17 % 48 % 35 % 0 %
Bowler (Grant) ES 6 % 32 % 43 % 19 % 8 % 47 % 35 % 10 % 4 % 27 % 45 % 24 % 6 % 24 % 55 % 15 %
Bailey (Sister) ES 14 % 40 % 36 % 10 % 19 % 55 % 26 % 1 % 13 % 40 % 33 % 13 % 13 % 45 % 30 % 12 %
Antonello ES 4 % 24 % 46 % 25 % 7 % 32 % 52 % 9 % 2 % 25 % 42 % 31 % 6 % 36 % 43 % 15 %
Bailey MS 16 % 46 % 33 % 6 % 13 % 50 % 35 % 2 % 27 % 38 % 31 % 5 % 19 % 41 % 39 % 1 %
Bass ES 4 % 29 % 46 % 21 % 5 % 38 % 49 % 8 % 3 % 24 % 38 % 34 % 2 % 31 % 43 % 24 %
Bartlett ES 3 % 23 % 50 % 24 % 4 % 33 % 52 % 11 % 3 % 23 % 37 % 37 % 2 % 19 % 51 % 28 %
Allen ES 6 % 26 % 49 % 19 % 11 % 31 % 46 % 12 % 7 % 20 % 38 % 36 % 10 % 23 % 48 % 19 %
Bowler (Joseph) Sr ES 9 % 36 % 37 % 17 % 12 % 46 % 40 % 1 % 8 % 31 % 36 % 25 % 13 % 39 % 34 % 13 %
Adams ES 9 % 26 % 48 % 17 % 12 % 44 % 34 % 10 % 7 % 24 % 34 % 35 % 9 % 39 % 37 % 15 %
Alamo ES 5 % 32 % 44 % 19 % 2 % 28 % 49 % 21 % 3 % 23 % 41 % 33 % 7 % 40 % 41 % 12 %
Adcock ES 8 % 40 % 41 % 12 % 9 % 37 % 40 % 13 % 5 % 30 % 38 % 27 % 10 % 32 % 44 % 13 %
Bilbray ES 3 % 21 % 50 % 26 % 3 % 30 % 52 % 16 % 1 % 23 % 45 % 31 % 4 % 18 % 51 % 27 %
Bennett ES 9 % 33 % 43 % 15 % 22 % 49 % 24 % 4 % 8 % 31 % 34 % 27 % 10 % 43 % 35 % 12 %
Blue Diamond ES 0 % 23 % 38 % 38 % - - - - 0 % 0 % 46 % 54 % - - - -
Booker ES 6 % 30 % 44 % 20 % 4 % 47 % 47 % 3 % 5 % 34 % 39 % 21 % 9 % 47 % 30 % 13 %
Bonner ES 2 % 22 % 51 % 25 % 2 % 20 % 68 % 10 % 3 % 16 % 39 % 42 % 2 % 19 % 44 % 35 %
Bendorf ES 2 % 23 % 49 % 26 % 2 % 26 % 61 % 10 % 1 % 14 % 35 % 50 % 4 % 31 % 39 % 26 %
Batterman ES 3 % 24 % 44 % 29 % 5 % 35 % 49 % 10 % 4 % 17 % 36 % 43 % 4 % 22 % 53 % 22 %
Beatty ES 5 % 30 % 49 % 16 % 7 % 49 % 42 % 2 % 5 % 27 % 39 % 28 % 8 % 30 % 48 % 14 %
Becker MS 7 % 25 % 45 % 23 % 3 % 28 % 52 % 18 % 7 % 24 % 43 % 26 % 7 % 20 % 64 % 9 %
Bell ES 10 % 42 % 36 % 12 % 17 % 58 % 23 % 2 % 7 % 31 % 32 % 30 % 17 % 53 % 28 % 3 %
Beckley ES 10 % 41 % 39 % 10 % 19 % 57 % 24 % 0 % 9 % 41 % 33 % 17 % 12 % 50 % 35 % 3 %
Clark County Schools
District 8 % 33 % 43 % 17 % 8 % 41 % 43 % 8 % 9 % 30 % 38 % 23 % 10 % 33 % 46 % 10 %
State 7 % 32 % 44 % 17 % 7 % 41 % 44 % 8 % 9 % 29 % 39 % 23 % 9 % 32 % 48 % 11 %
‘-’ indicates data not presented for groups fewer than 10. ‘N/A’ indicates that data are not available.
K-8 Reading Writing Mathematics Science
ED AS MS ES ED AS MS ES ED AS MS ES ED AS MS ES
Page 116 of 125
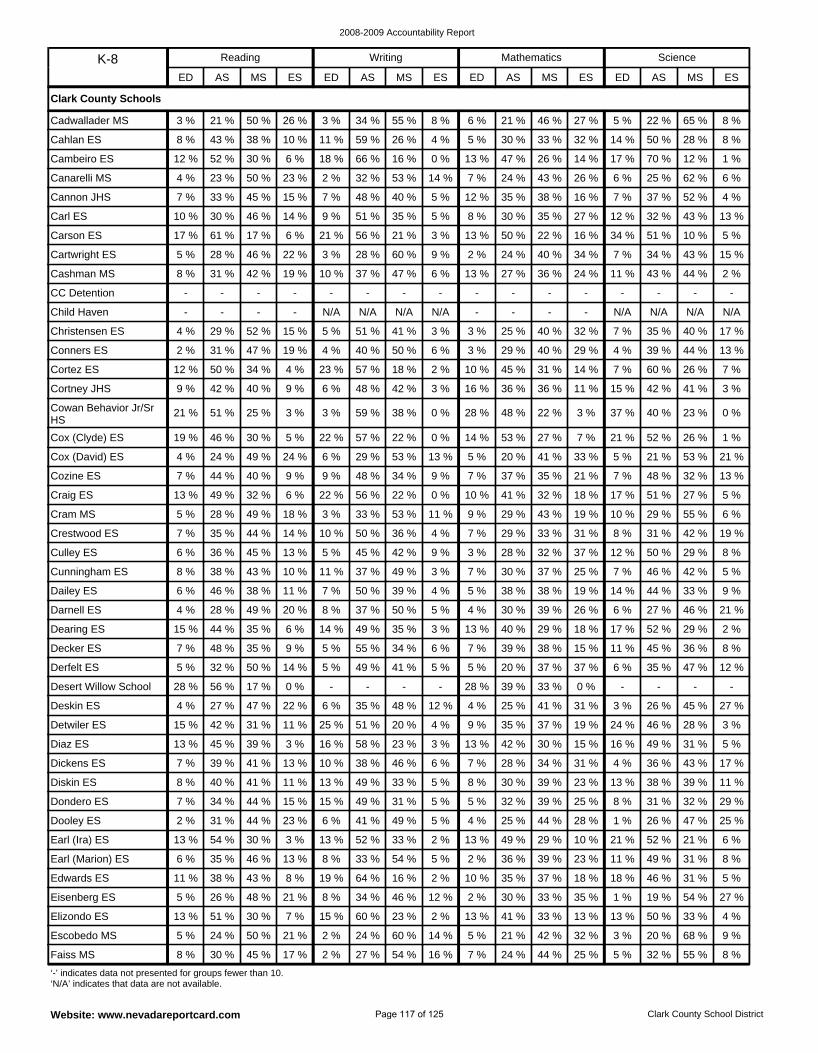
2008-2009 Accountability Report
Website: www.nevadareportcard.com Clark County School District
Dickens ES 7 % 39 % 41 % 13 % 10 % 38 % 46 % 6 % 7 % 28 % 34 % 31 % 4 % 36 % 43 % 17 %
Diaz ES 13 % 45 % 39 % 3 % 16 % 58 % 23 % 3 % 13 % 42 % 30 % 15 % 16 % 49 % 31 % 5 %
Detwiler ES 15 % 42 % 31 % 11 % 25 % 51 % 20 % 4 % 9 % 35 % 37 % 19 % 24 % 46 % 28 % 3 %
Dooley ES 2 % 31 % 44 % 23 % 6 % 41 % 49 % 5 % 4 % 25 % 44 % 28 % 1 % 26 % 47 % 25 %
Dondero ES 7 % 34 % 44 % 15 % 15 % 49 % 31 % 5 % 5 % 32 % 39 % 25 % 8 % 31 % 32 % 29 %
Diskin ES 8 % 40 % 41 % 11 % 13 % 49 % 33 % 5 % 8 % 30 % 39 % 23 % 13 % 38 % 39 % 11 %
Deskin ES 4 % 27 % 47 % 22 % 6 % 35 % 48 % 12 % 4 % 25 % 41 % 31 % 3 % 26 % 45 % 27 %
Dearing ES 15 % 44 % 35 % 6 % 14 % 49 % 35 % 3 % 13 % 40 % 29 % 18 % 17 % 52 % 29 % 2 %
Darnell ES 4 % 28 % 49 % 20 % 8 % 37 % 50 % 5 % 4 % 30 % 39 % 26 % 6 % 27 % 46 % 21 %
Desert Willow School 28 % 56 % 17 % 0 % - - - - 28 % 39 % 33 % 0 % - - - -
Derfelt ES 5 % 32 % 50 % 14 % 5 % 49 % 41 % 5 % 5 % 20 % 37 % 37 % 6 % 35 % 47 % 12 %
Decker ES 7 % 48 % 35 % 9 % 5 % 55 % 34 % 6 % 7 % 39 % 38 % 15 % 11 % 45 % 36 % 8 %
Faiss MS 8 % 30 % 45 % 17 % 2 % 27 % 54 % 16 % 7 % 24 % 44 % 25 % 5 % 32 % 55 % 8 %
Edwards ES 11 % 38 % 43 % 8 % 19 % 64 % 16 % 2 % 10 % 35 % 37 % 18 % 18 % 46 % 31 % 5 %
Earl (Marion) ES 6 % 35 % 46 % 13 % 8 % 33 % 54 % 5 % 2 % 36 % 39 % 23 % 11 % 49 % 31 % 8 %
Earl (Ira) ES 13 % 54 % 30 % 3 % 13 % 52 % 33 % 2 % 13 % 49 % 29 % 10 % 21 % 52 % 21 % 6 %
Escobedo MS 5 % 24 % 50 % 21 % 2 % 24 % 60 % 14 % 5 % 21 % 42 % 32 % 3 % 20 % 68 % 9 %
Elizondo ES 13 % 51 % 30 % 7 % 15 % 60 % 23 % 2 % 13 % 41 % 33 % 13 % 13 % 50 % 33 % 4 %
Eisenberg ES 5 % 26 % 48 % 21 % 8 % 34 % 46 % 12 % 2 % 30 % 33 % 35 % 1 % 19 % 54 % 27 %
Cunningham ES 8 % 38 % 43 % 10 % 11 % 37 % 49 % 3 % 7 % 30 % 37 % 25 % 7 % 46 % 42 % 5 %
Carson ES 17 % 61 % 17 % 6 % 21 % 56 % 21 % 3 % 13 % 50 % 22 % 16 % 34 % 51 % 10 % 5 %
Carl ES 10 % 30 % 46 % 14 % 9 % 51 % 35 % 5 % 8 % 30 % 35 % 27 % 12 % 32 % 43 % 13 %
Cannon JHS 7 % 33 % 45 % 15 % 7 % 48 % 40 % 5 % 12 % 35 % 38 % 16 % 7 % 37 % 52 % 4 %
CC Detention - - - - - - - - - - - - - - - -
Cashman MS 8 % 31 % 42 % 19 % 10 % 37 % 47 % 6 % 13 % 27 % 36 % 24 % 11 % 43 % 44 % 2 %
Cartwright ES 5 % 28 % 46 % 22 % 3 % 28 % 60 % 9 % 2 % 24 % 40 % 34 % 7 % 34 % 43 % 15 %
Cadwallader MS 3 % 21 % 50 % 26 % 3 % 34 % 55 % 8 % 6 % 21 % 46 % 27 % 5 % 22 % 65 % 8 %
Dailey ES 6 % 46 % 38 % 11 % 7 % 50 % 39 % 4 % 5 % 38 % 38 % 19 % 14 % 44 % 33 % 9 %
Canarelli MS 4 % 23 % 50 % 23 % 2 % 32 % 53 % 14 % 7 % 24 % 43 % 26 % 6 % 25 % 62 % 6 %
Cambeiro ES 12 % 52 % 30 % 6 % 18 % 66 % 16 % 0 % 13 % 47 % 26 % 14 % 17 % 70 % 12 % 1 %
Cahlan ES 8 % 43 % 38 % 10 % 11 % 59 % 26 % 4 % 5 % 30 % 33 % 32 % 14 % 50 % 28 % 8 %
Child Haven - - - - N/A N/A N/A N/A - - - - N/A N/A N/A N/A
Craig ES 13 % 49 % 32 % 6 % 22 % 56 % 22 % 0 % 10 % 41 % 32 % 18 % 17 % 51 % 27 % 5 %
Cozine ES 7 % 44 % 40 % 9 % 9 % 48 % 34 % 9 % 7 % 37 % 35 % 21 % 7 % 48 % 32 % 13 %
Cox (David) ES 4 % 24 % 49 % 24 % 6 % 29 % 53 % 13 % 5 % 20 % 41 % 33 % 5 % 21 % 53 % 21 %
Culley ES 6 % 36 % 45 % 13 % 5 % 45 % 42 % 9 % 3 % 28 % 32 % 37 % 12 % 50 % 29 % 8 %
Crestwood ES 7 % 35 % 44 % 14 % 10 % 50 % 36 % 4 % 7 % 29 % 33 % 31 % 8 % 31 % 42 % 19 %
Cram MS 5 % 28 % 49 % 18 % 3 % 33 % 53 % 11 % 9 % 29 % 43 % 19 % 10 % 29 % 55 % 6 %
Cortez ES 12 % 50 % 34 % 4 % 23 % 57 % 18 % 2 % 10 % 45 % 31 % 14 % 7 % 60 % 26 % 7 %
Conners ES 2 % 31 % 47 % 19 % 4 % 40 % 50 % 6 % 3 % 29 % 40 % 29 % 4 % 39 % 44 % 13 %
Christensen ES 4 % 29 % 52 % 15 % 5 % 51 % 41 % 3 % 3 % 25 % 40 % 32 % 7 % 35 % 40 % 17 %
Cowan Behavior Jr/Sr HS
21 % 51 % 25 % 3 % 3 % 59 % 38 % 0 % 28 % 48 % 22 % 3 % 37 % 40 % 23 % 0 %
Cox (Clyde) ES 19 % 46 % 30 % 5 % 22 % 57 % 22 % 0 % 14 % 53 % 27 % 7 % 21 % 52 % 26 % 1 %
Cortney JHS 9 % 42 % 40 % 9 % 6 % 48 % 42 % 3 % 16 % 36 % 36 % 11 % 15 % 42 % 41 % 3 %
Clark County Schools
‘-’ indicates data not presented for groups fewer than 10. ‘N/A’ indicates that data are not available.
K-8 Reading Writing Mathematics Science
ED AS MS ES ED AS MS ES ED AS MS ES ED AS MS ES
Page 117 of 125
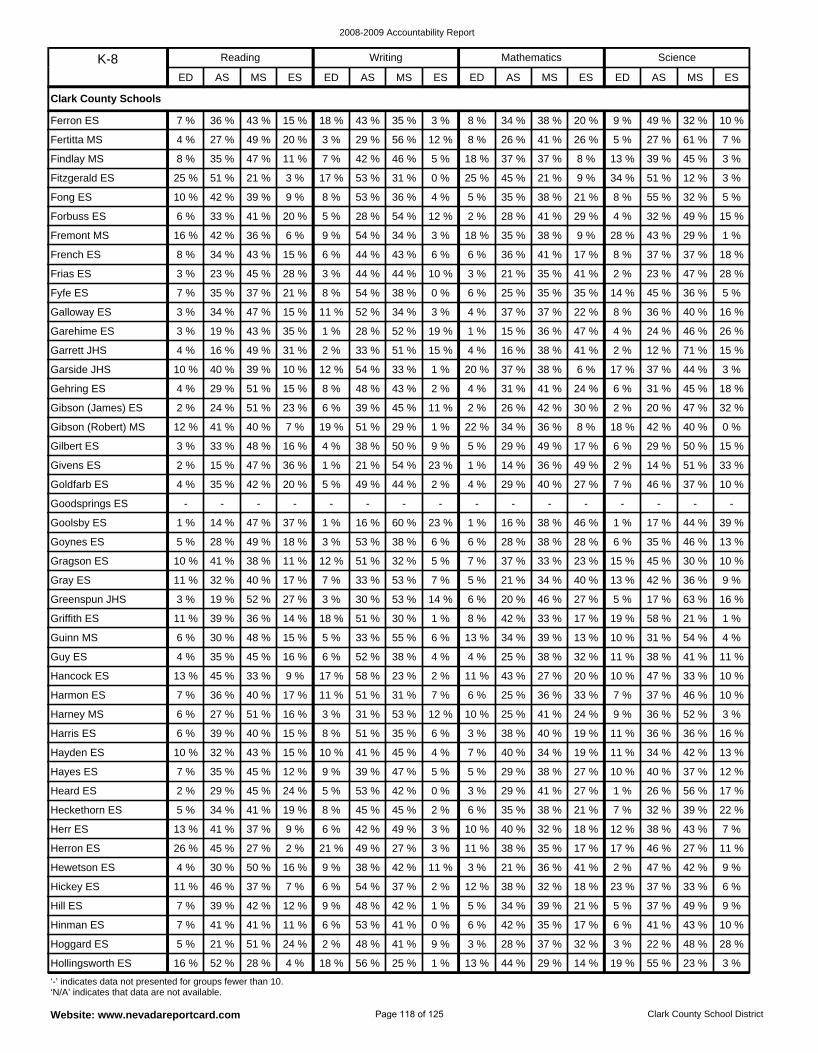
2008-2009 Accountability Report
Website: www.nevadareportcard.com Clark County School District
Hayden ES 10 % 32 % 43 % 15 % 10 % 41 % 45 % 4 % 7 % 40 % 34 % 19 % 11 % 34 % 42 % 13 %
Harris ES 6 % 39 % 40 % 15 % 8 % 51 % 35 % 6 % 3 % 38 % 40 % 19 % 11 % 36 % 36 % 16 %
Harney MS 6 % 27 % 51 % 16 % 3 % 31 % 53 % 12 % 10 % 25 % 41 % 24 % 9 % 36 % 52 % 3 %
Heckethorn ES 5 % 34 % 41 % 19 % 8 % 45 % 45 % 2 % 6 % 35 % 38 % 21 % 7 % 32 % 39 % 22 %
Heard ES 2 % 29 % 45 % 24 % 5 % 53 % 42 % 0 % 3 % 29 % 41 % 27 % 1 % 26 % 56 % 17 %
Hayes ES 7 % 35 % 45 % 12 % 9 % 39 % 47 % 5 % 5 % 29 % 38 % 27 % 10 % 40 % 37 % 12 %
Harmon ES 7 % 36 % 40 % 17 % 11 % 51 % 31 % 7 % 6 % 25 % 36 % 33 % 7 % 37 % 46 % 10 %
Griffith ES 11 % 39 % 36 % 14 % 18 % 51 % 30 % 1 % 8 % 42 % 33 % 17 % 19 % 58 % 21 % 1 %
Greenspun JHS 3 % 19 % 52 % 27 % 3 % 30 % 53 % 14 % 6 % 20 % 46 % 27 % 5 % 17 % 63 % 16 %
Hancock ES 13 % 45 % 33 % 9 % 17 % 58 % 23 % 2 % 11 % 43 % 27 % 20 % 10 % 47 % 33 % 10 %
Guy ES 4 % 35 % 45 % 16 % 6 % 52 % 38 % 4 % 4 % 25 % 38 % 32 % 11 % 38 % 41 % 11 %
Guinn MS 6 % 30 % 48 % 15 % 5 % 33 % 55 % 6 % 13 % 34 % 39 % 13 % 10 % 31 % 54 % 4 %
Hollingsworth ES 16 % 52 % 28 % 4 % 18 % 56 % 25 % 1 % 13 % 44 % 29 % 14 % 19 % 55 % 23 % 3 %
Hoggard ES 5 % 21 % 51 % 24 % 2 % 48 % 41 % 9 % 3 % 28 % 37 % 32 % 3 % 22 % 48 % 28 %
Hewetson ES 4 % 30 % 50 % 16 % 9 % 38 % 42 % 11 % 3 % 21 % 36 % 41 % 2 % 47 % 42 % 9 %
Herron ES 26 % 45 % 27 % 2 % 21 % 49 % 27 % 3 % 11 % 38 % 35 % 17 % 17 % 46 % 27 % 11 %
Herr ES 13 % 41 % 37 % 9 % 6 % 42 % 49 % 3 % 10 % 40 % 32 % 18 % 12 % 38 % 43 % 7 %
Hinman ES 7 % 41 % 41 % 11 % 6 % 53 % 41 % 0 % 6 % 42 % 35 % 17 % 6 % 41 % 43 % 10 %
Hill ES 7 % 39 % 42 % 12 % 9 % 48 % 42 % 1 % 5 % 34 % 39 % 21 % 5 % 37 % 49 % 9 %
Hickey ES 11 % 46 % 37 % 7 % 6 % 54 % 37 % 2 % 12 % 38 % 32 % 18 % 23 % 37 % 33 % 6 %
Gragson ES 10 % 41 % 38 % 11 % 12 % 51 % 32 % 5 % 7 % 37 % 33 % 23 % 15 % 45 % 30 % 10 %
Fremont MS 16 % 42 % 36 % 6 % 9 % 54 % 34 % 3 % 18 % 35 % 38 % 9 % 28 % 43 % 29 % 1 %
Forbuss ES 6 % 33 % 41 % 20 % 5 % 28 % 54 % 12 % 2 % 28 % 41 % 29 % 4 % 32 % 49 % 15 %
Fong ES 10 % 42 % 39 % 9 % 8 % 53 % 36 % 4 % 5 % 35 % 38 % 21 % 8 % 55 % 32 % 5 %
Fyfe ES 7 % 35 % 37 % 21 % 8 % 54 % 38 % 0 % 6 % 25 % 35 % 35 % 14 % 45 % 36 % 5 %
Frias ES 3 % 23 % 45 % 28 % 3 % 44 % 44 % 10 % 3 % 21 % 35 % 41 % 2 % 23 % 47 % 28 %
French ES 8 % 34 % 43 % 15 % 6 % 44 % 43 % 6 % 6 % 36 % 41 % 17 % 8 % 37 % 37 % 18 %
Ferron ES 7 % 36 % 43 % 15 % 18 % 43 % 35 % 3 % 8 % 34 % 38 % 20 % 9 % 49 % 32 % 10 %
Gray ES 11 % 32 % 40 % 17 % 7 % 33 % 53 % 7 % 5 % 21 % 34 % 40 % 13 % 42 % 36 % 9 %
Fitzgerald ES 25 % 51 % 21 % 3 % 17 % 53 % 31 % 0 % 25 % 45 % 21 % 9 % 34 % 51 % 12 % 3 %
Findlay MS 8 % 35 % 47 % 11 % 7 % 42 % 46 % 5 % 18 % 37 % 37 % 8 % 13 % 39 % 45 % 3 %
Fertitta MS 4 % 27 % 49 % 20 % 3 % 29 % 56 % 12 % 8 % 26 % 41 % 26 % 5 % 27 % 61 % 7 %
Galloway ES 3 % 34 % 47 % 15 % 11 % 52 % 34 % 3 % 4 % 37 % 37 % 22 % 8 % 36 % 40 % 16 %
Goldfarb ES 4 % 35 % 42 % 20 % 5 % 49 % 44 % 2 % 4 % 29 % 40 % 27 % 7 % 46 % 37 % 10 %
Givens ES 2 % 15 % 47 % 36 % 1 % 21 % 54 % 23 % 1 % 14 % 36 % 49 % 2 % 14 % 51 % 33 %
Gilbert ES 3 % 33 % 48 % 16 % 4 % 38 % 50 % 9 % 5 % 29 % 49 % 17 % 6 % 29 % 50 % 15 %
Goynes ES 5 % 28 % 49 % 18 % 3 % 53 % 38 % 6 % 6 % 28 % 38 % 28 % 6 % 35 % 46 % 13 %
Goolsby ES 1 % 14 % 47 % 37 % 1 % 16 % 60 % 23 % 1 % 16 % 38 % 46 % 1 % 17 % 44 % 39 %
Goodsprings ES - - - - - - - - - - - - - - - -
Garside JHS 10 % 40 % 39 % 10 % 12 % 54 % 33 % 1 % 20 % 37 % 38 % 6 % 17 % 37 % 44 % 3 %
Garrett JHS 4 % 16 % 49 % 31 % 2 % 33 % 51 % 15 % 4 % 16 % 38 % 41 % 2 % 12 % 71 % 15 %
Garehime ES 3 % 19 % 43 % 35 % 1 % 28 % 52 % 19 % 1 % 15 % 36 % 47 % 4 % 24 % 46 % 26 %
Gibson (James) ES 2 % 24 % 51 % 23 % 6 % 39 % 45 % 11 % 2 % 26 % 42 % 30 % 2 % 20 % 47 % 32 %
Gibson (Robert) MS 12 % 41 % 40 % 7 % 19 % 51 % 29 % 1 % 22 % 34 % 36 % 8 % 18 % 42 % 40 % 0 %
Gehring ES 4 % 29 % 51 % 15 % 8 % 48 % 43 % 2 % 4 % 31 % 41 % 24 % 6 % 31 % 45 % 18 %
Clark County Schools
‘-’ indicates data not presented for groups fewer than 10. ‘N/A’ indicates that data are not available.
K-8 Reading Writing Mathematics Science
ED AS MS ES ED AS MS ES ED AS MS ES ED AS MS ES
Page 118 of 125
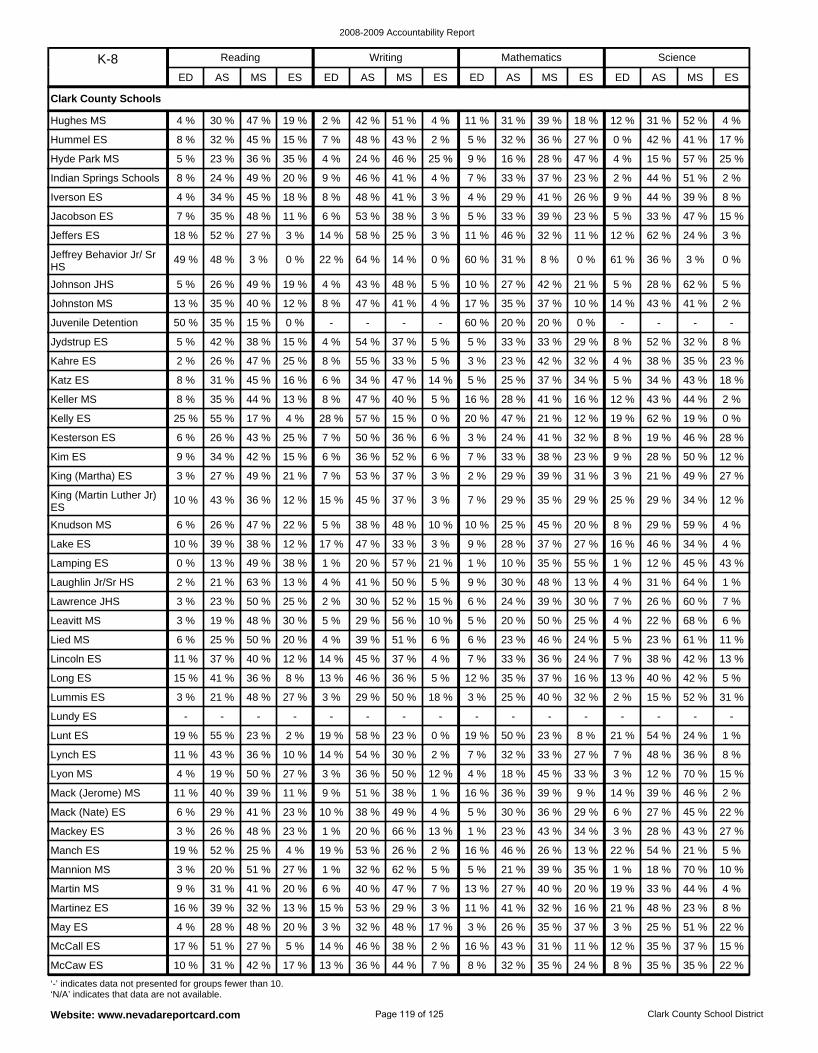
2008-2009 Accountability Report
Website: www.nevadareportcard.com Clark County School District
Lyon MS 4 % 19 % 50 % 27 % 3 % 36 % 50 % 12 % 4 % 18 % 45 % 33 % 3 % 12 % 70 % 15 %
Lynch ES 11 % 43 % 36 % 10 % 14 % 54 % 30 % 2 % 7 % 32 % 33 % 27 % 7 % 48 % 36 % 8 %
Lunt ES 19 % 55 % 23 % 2 % 19 % 58 % 23 % 0 % 19 % 50 % 23 % 8 % 21 % 54 % 24 % 1 %
Mackey ES 3 % 26 % 48 % 23 % 1 % 20 % 66 % 13 % 1 % 23 % 43 % 34 % 3 % 28 % 43 % 27 %
Mack (Nate) ES 6 % 29 % 41 % 23 % 10 % 38 % 49 % 4 % 5 % 30 % 36 % 29 % 6 % 27 % 45 % 22 %
Mack (Jerome) MS 11 % 40 % 39 % 11 % 9 % 51 % 38 % 1 % 16 % 36 % 39 % 9 % 14 % 39 % 46 % 2 %
Lundy ES - - - - - - - - - - - - - - - -
Lied MS 6 % 25 % 50 % 20 % 4 % 39 % 51 % 6 % 6 % 23 % 46 % 24 % 5 % 23 % 61 % 11 %
Leavitt MS 3 % 19 % 48 % 30 % 5 % 29 % 56 % 10 % 5 % 20 % 50 % 25 % 4 % 22 % 68 % 6 %
Lummis ES 3 % 21 % 48 % 27 % 3 % 29 % 50 % 18 % 3 % 25 % 40 % 32 % 2 % 15 % 52 % 31 %
Long ES 15 % 41 % 36 % 8 % 13 % 46 % 36 % 5 % 12 % 35 % 37 % 16 % 13 % 40 % 42 % 5 %
Lincoln ES 11 % 37 % 40 % 12 % 14 % 45 % 37 % 4 % 7 % 33 % 36 % 24 % 7 % 38 % 42 % 13 %
McCaw ES 10 % 31 % 42 % 17 % 13 % 36 % 44 % 7 % 8 % 32 % 35 % 24 % 8 % 35 % 35 % 22 %
Martin MS 9 % 31 % 41 % 20 % 6 % 40 % 47 % 7 % 13 % 27 % 40 % 20 % 19 % 33 % 44 % 4 %
Mannion MS 3 % 20 % 51 % 27 % 1 % 32 % 62 % 5 % 5 % 21 % 39 % 35 % 1 % 18 % 70 % 10 %
Manch ES 19 % 52 % 25 % 4 % 19 % 53 % 26 % 2 % 16 % 46 % 26 % 13 % 22 % 54 % 21 % 5 %
McCall ES 17 % 51 % 27 % 5 % 14 % 46 % 38 % 2 % 16 % 43 % 31 % 11 % 12 % 35 % 37 % 15 %
May ES 4 % 28 % 48 % 20 % 3 % 32 % 48 % 17 % 3 % 26 % 35 % 37 % 3 % 25 % 51 % 22 %
Martinez ES 16 % 39 % 32 % 13 % 15 % 53 % 29 % 3 % 11 % 41 % 32 % 16 % 21 % 48 % 23 % 8 %
Laughlin Jr/Sr HS 2 % 21 % 63 % 13 % 4 % 41 % 50 % 5 % 9 % 30 % 48 % 13 % 4 % 31 % 64 % 1 %
Jeffers ES 18 % 52 % 27 % 3 % 14 % 58 % 25 % 3 % 11 % 46 % 32 % 11 % 12 % 62 % 24 % 3 %
Jacobson ES 7 % 35 % 48 % 11 % 6 % 53 % 38 % 3 % 5 % 33 % 39 % 23 % 5 % 33 % 47 % 15 %
Iverson ES 4 % 34 % 45 % 18 % 8 % 48 % 41 % 3 % 4 % 29 % 41 % 26 % 9 % 44 % 39 % 8 %
Johnston MS 13 % 35 % 40 % 12 % 8 % 47 % 41 % 4 % 17 % 35 % 37 % 10 % 14 % 43 % 41 % 2 %
Johnson JHS 5 % 26 % 49 % 19 % 4 % 43 % 48 % 5 % 10 % 27 % 42 % 21 % 5 % 28 % 62 % 5 %
Jeffrey Behavior Jr/ Sr HS
49 % 48 % 3 % 0 % 22 % 64 % 14 % 0 % 60 % 31 % 8 % 0 % 61 % 36 % 3 % 0 %
Hughes MS 4 % 30 % 47 % 19 % 2 % 42 % 51 % 4 % 11 % 31 % 39 % 18 % 12 % 31 % 52 % 4 %
Lawrence JHS 3 % 23 % 50 % 25 % 2 % 30 % 52 % 15 % 6 % 24 % 39 % 30 % 7 % 26 % 60 % 7 %
Indian Springs Schools 8 % 24 % 49 % 20 % 9 % 46 % 41 % 4 % 7 % 33 % 37 % 23 % 2 % 44 % 51 % 2 %
Hyde Park MS 5 % 23 % 36 % 35 % 4 % 24 % 46 % 25 % 9 % 16 % 28 % 47 % 4 % 15 % 57 % 25 %
Hummel ES 8 % 32 % 45 % 15 % 7 % 48 % 43 % 2 % 5 % 32 % 36 % 27 % 0 % 42 % 41 % 17 %
Juvenile Detention 50 % 35 % 15 % 0 % - - - - 60 % 20 % 20 % 0 % - - - -
King (Martin Luther Jr) ES
10 % 43 % 36 % 12 % 15 % 45 % 37 % 3 % 7 % 29 % 35 % 29 % 25 % 29 % 34 % 12 %
King (Martha) ES 3 % 27 % 49 % 21 % 7 % 53 % 37 % 3 % 2 % 29 % 39 % 31 % 3 % 21 % 49 % 27 %
Kim ES 9 % 34 % 42 % 15 % 6 % 36 % 52 % 6 % 7 % 33 % 38 % 23 % 9 % 28 % 50 % 12 %
Lamping ES 0 % 13 % 49 % 38 % 1 % 20 % 57 % 21 % 1 % 10 % 35 % 55 % 1 % 12 % 45 % 43 %
Lake ES 10 % 39 % 38 % 12 % 17 % 47 % 33 % 3 % 9 % 28 % 37 % 27 % 16 % 46 % 34 % 4 %
Knudson MS 6 % 26 % 47 % 22 % 5 % 38 % 48 % 10 % 10 % 25 % 45 % 20 % 8 % 29 % 59 % 4 %
Katz ES 8 % 31 % 45 % 16 % 6 % 34 % 47 % 14 % 5 % 25 % 37 % 34 % 5 % 34 % 43 % 18 %
Kahre ES 2 % 26 % 47 % 25 % 8 % 55 % 33 % 5 % 3 % 23 % 42 % 32 % 4 % 38 % 35 % 23 %
Jydstrup ES 5 % 42 % 38 % 15 % 4 % 54 % 37 % 5 % 5 % 33 % 33 % 29 % 8 % 52 % 32 % 8 %
Kelly ES 25 % 55 % 17 % 4 % 28 % 57 % 15 % 0 % 20 % 47 % 21 % 12 % 19 % 62 % 19 % 0 %
Kesterson ES 6 % 26 % 43 % 25 % 7 % 50 % 36 % 6 % 3 % 24 % 41 % 32 % 8 % 19 % 46 % 28 %
Keller MS 8 % 35 % 44 % 13 % 8 % 47 % 40 % 5 % 16 % 28 % 41 % 16 % 12 % 43 % 44 % 2 %
Clark County Schools
‘-’ indicates data not presented for groups fewer than 10. ‘N/A’ indicates that data are not available.
K-8 Reading Writing Mathematics Science
ED AS MS ES ED AS MS ES ED AS MS ES ED AS MS ES
Page 119 of 125

2008-2009 Accountability Report
Website: www.nevadareportcard.com Clark County School District
Reedom ES 2 % 25 % 46 % 27 % 2 % 39 % 47 % 12 % 3 % 22 % 43 % 33 % 6 % 18 % 59 % 18 %
Reed ES 14 % 39 % 39 % 8 % 14 % 52 % 33 % 1 % 11 % 43 % 35 % 11 % 14 % 48 % 33 % 5 %
Red Rock ES 12 % 42 % 39 % 7 % 7 % 50 % 37 % 5 % 8 % 34 % 41 % 17 % 12 % 44 % 39 % 5 %
Ries ES 6 % 28 % 50 % 16 % 2 % 33 % 59 % 6 % 5 % 24 % 39 % 32 % 9 % 36 % 45 % 10 %
Rhodes ES 4 % 27 % 48 % 21 % 3 % 40 % 45 % 13 % 4 % 24 % 42 % 31 % 6 % 28 % 48 % 18 %
Reid ES 0 % 33 % 58 % 8 % - - - - 0 % 33 % 50 % 17 % - - - -
Priest ES 16 % 45 % 32 % 7 % 9 % 64 % 24 % 2 % 10 % 41 % 32 % 17 % 14 % 48 % 29 % 9 %
Petersen ES 22 % 44 % 29 % 5 % 25 % 53 % 21 % 2 % 17 % 46 % 31 % 6 % 22 % 54 % 19 % 5 %
Perkins (Dr. Claude G.) ES
10 % 49 % 33 % 8 % 6 % 52 % 38 % 4 % 9 % 39 % 31 % 22 % 17 % 48 % 27 % 8 %
Pittman ES 7 % 45 % 37 % 11 % 13 % 42 % 43 % 3 % 7 % 36 % 31 % 26 % 11 % 53 % 30 % 6 %
Piggott ES 3 % 26 % 46 % 25 % 2 % 48 % 47 % 2 % 1 % 20 % 40 % 38 % 2 % 33 % 40 % 25 %
Peterson Behavior Jr/Sr HS
37 % 38 % 21 % 4 % 3 % 57 % 38 % 3 % 34 % 48 % 15 % 3 % 50 % 37 % 13 % 0 %
Roundy ES 20 % 46 % 29 % 5 % 22 % 52 % 23 % 4 % 14 % 42 % 31 % 13 % 31 % 45 % 20 % 4 %
Rogers ES 5 % 28 % 46 % 21 % 5 % 28 % 52 % 15 % 2 % 22 % 33 % 43 % 5 % 35 % 44 % 17 %
Robison MS 15 % 45 % 34 % 5 % 13 % 51 % 35 % 1 % 23 % 39 % 32 % 6 % 16 % 41 % 42 % 1 %
Roberts ES 2 % 26 % 48 % 24 % 3 % 37 % 51 % 8 % 3 % 23 % 40 % 34 % 1 % 26 % 56 % 17 %
Ronzone ES 12 % 38 % 38 % 12 % 11 % 42 % 44 % 3 % 9 % 34 % 37 % 20 % 7 % 48 % 38 % 8 %
Ronnow ES 11 % 45 % 40 % 4 % 16 % 53 % 31 % 1 % 7 % 37 % 38 % 19 % 17 % 46 % 33 % 3 %
Rogich MS 2 % 13 % 47 % 38 % 1 % 16 % 52 % 31 % 3 % 13 % 41 % 43 % 2 % 17 % 69 % 12 %
Miller (John) ES N/A N/A N/A N/A N/A N/A N/A N/A N/A N/A N/A N/A N/A N/A N/A N/A
Miller (Bob) MS 1 % 16 % 43 % 39 % 1 % 19 % 57 % 23 % 3 % 14 % 39 % 43 % 3 % 13 % 64 % 20 %
Miley Achievement Center
24 % 41 % 17 % 17 % 42 % 42 % 17 % 0 % 37 % 33 % 15 % 15 % 60 % 30 % 0 % 10 %
Monaco MS 14 % 40 % 40 % 6 % 15 % 52 % 30 % 2 % 23 % 39 % 33 % 5 % 23 % 42 % 35 % 0 %
Molasky JHS 5 % 29 % 45 % 20 % 3 % 32 % 52 % 14 % 12 % 30 % 42 % 17 % 7 % 23 % 63 % 8 %
Miller (Sandy) ES 5 % 38 % 36 % 22 % 3 % 44 % 47 % 7 % 5 % 34 % 40 % 21 % 2 % 34 % 44 % 21 %
McDoniel ES 4 % 31 % 49 % 16 % 0 % 29 % 59 % 12 % 5 % 26 % 39 % 30 % 0 % 16 % 47 % 37 %
Perkins (Ute) ES 3 % 38 % 41 % 18 % 0 % 62 % 38 % 0 % 9 % 41 % 41 % 9 % 0 % 57 % 29 % 14 %
Mendoza ES 10 % 37 % 39 % 14 % 14 % 44 % 39 % 3 % 5 % 39 % 38 % 18 % 5 % 42 % 43 % 10 %
McWilliams ES 18 % 43 % 32 % 8 % 24 % 48 % 27 % 1 % 13 % 40 % 28 % 18 % 19 % 50 % 23 % 7 %
McMillan ES 5 % 34 % 45 % 16 % 3 % 43 % 45 % 9 % 11 % 32 % 35 % 22 % 13 % 38 % 41 % 8 %
Moore ES 12 % 47 % 33 % 8 % 18 % 65 % 17 % 1 % 12 % 42 % 31 % 16 % 20 % 53 % 21 % 6 %
Orr MS 12 % 40 % 39 % 10 % 12 % 50 % 35 % 3 % 16 % 30 % 39 % 15 % 21 % 45 % 33 % 1 %
Ober ES 3 % 20 % 41 % 36 % 4 % 33 % 53 % 10 % 1 % 17 % 23 % 58 % 9 % 21 % 37 % 33 %
O'Roarke ES 2 % 22 % 52 % 25 % 1 % 28 % 58 % 13 % 1 % 22 % 38 % 38 % 2 % 29 % 45 % 24 %
Parson ES 9 % 41 % 40 % 9 % 15 % 49 % 36 % 0 % 11 % 40 % 37 % 12 % 18 % 46 % 29 % 7 %
Park ES 12 % 44 % 35 % 10 % 17 % 46 % 35 % 2 % 14 % 31 % 32 % 23 % 12 % 46 % 33 % 10 %
Paradise ES 13 % 49 % 34 % 4 % 12 % 55 % 31 % 1 % 11 % 45 % 33 % 12 % 12 % 51 % 34 % 4 %
Mountain View ES 11 % 47 % 35 % 7 % 7 % 54 % 37 % 2 % 12 % 38 % 34 % 15 % 15 % 44 % 32 % 8 %
Morrow ES 1 % 21 % 50 % 28 % 2 % 33 % 55 % 10 % 1 % 24 % 34 % 40 % 3 % 24 % 35 % 37 %
Morris Behavior Jr/Sr HS
65 % 31 % 3 % 1 % 22 % 65 % 13 % 0 % 58 % 35 % 7 % 0 % 68 % 20 % 12 % 0 %
Newton ES 4 % 28 % 53 % 16 % 8 % 46 % 43 % 3 % 3 % 29 % 41 % 27 % 6 % 29 % 49 % 17 %
O'Callaghan MS 6 % 32 % 46 % 16 % 9 % 45 % 42 % 4 % 14 % 31 % 40 % 15 % 7 % 28 % 59 % 6 %
Neal ES 5 % 30 % 45 % 20 % 4 % 39 % 50 % 7 % 6 % 31 % 39 % 24 % 3 % 31 % 52 % 14 %
Clark County Schools
‘-’ indicates data not presented for groups fewer than 10. ‘N/A’ indicates that data are not available.
K-8 Reading Writing Mathematics Science
ED AS MS ES ED AS MS ES ED AS MS ES ED AS MS ES
Page 120 of 125
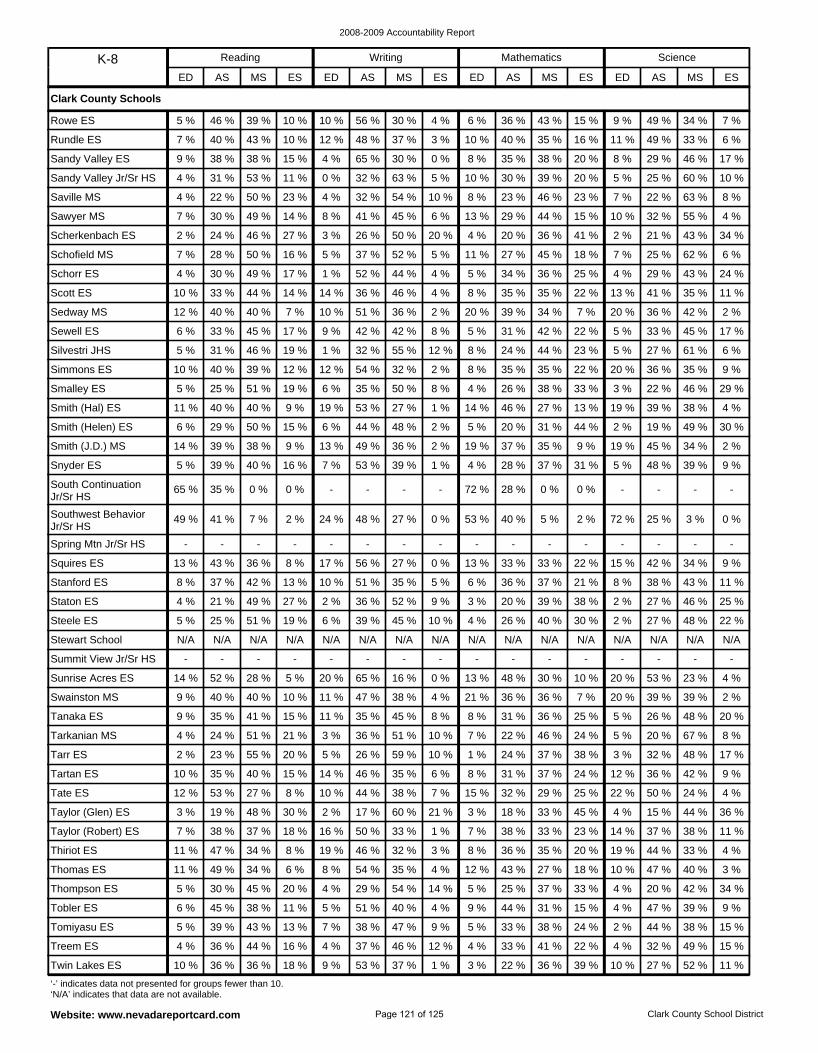
2008-2009 Accountability Report
Website: www.nevadareportcard.com Clark County School District
Tartan ES 10 % 35 % 40 % 15 % 14 % 46 % 35 % 6 % 8 % 31 % 37 % 24 % 12 % 36 % 42 % 9 %
Tarr ES 2 % 23 % 55 % 20 % 5 % 26 % 59 % 10 % 1 % 24 % 37 % 38 % 3 % 32 % 48 % 17 %
Tarkanian MS 4 % 24 % 51 % 21 % 3 % 36 % 51 % 10 % 7 % 22 % 46 % 24 % 5 % 20 % 67 % 8 %
Taylor (Robert) ES 7 % 38 % 37 % 18 % 16 % 50 % 33 % 1 % 7 % 38 % 33 % 23 % 14 % 37 % 38 % 11 %
Taylor (Glen) ES 3 % 19 % 48 % 30 % 2 % 17 % 60 % 21 % 3 % 18 % 33 % 45 % 4 % 15 % 44 % 36 %
Tate ES 12 % 53 % 27 % 8 % 10 % 44 % 38 % 7 % 15 % 32 % 29 % 25 % 22 % 50 % 24 % 4 %
Tanaka ES 9 % 35 % 41 % 15 % 11 % 35 % 45 % 8 % 8 % 31 % 36 % 25 % 5 % 26 % 48 % 20 %
Stewart School N/A N/A N/A N/A N/A N/A N/A N/A N/A N/A N/A N/A N/A N/A N/A N/A
Steele ES 5 % 25 % 51 % 19 % 6 % 39 % 45 % 10 % 4 % 26 % 40 % 30 % 2 % 27 % 48 % 22 %
Swainston MS 9 % 40 % 40 % 10 % 11 % 47 % 38 % 4 % 21 % 36 % 36 % 7 % 20 % 39 % 39 % 2 %
Sunrise Acres ES 14 % 52 % 28 % 5 % 20 % 65 % 16 % 0 % 13 % 48 % 30 % 10 % 20 % 53 % 23 % 4 %
Summit View Jr/Sr HS - - - - - - - - - - - - - - - -
Twin Lakes ES 10 % 36 % 36 % 18 % 9 % 53 % 37 % 1 % 3 % 22 % 36 % 39 % 10 % 27 % 52 % 11 %
Thompson ES 5 % 30 % 45 % 20 % 4 % 29 % 54 % 14 % 5 % 25 % 37 % 33 % 4 % 20 % 42 % 34 %
Thomas ES 11 % 49 % 34 % 6 % 8 % 54 % 35 % 4 % 12 % 43 % 27 % 18 % 10 % 47 % 40 % 3 %
Thiriot ES 11 % 47 % 34 % 8 % 19 % 46 % 32 % 3 % 8 % 36 % 35 % 20 % 19 % 44 % 33 % 4 %
Treem ES 4 % 36 % 44 % 16 % 4 % 37 % 46 % 12 % 4 % 33 % 41 % 22 % 4 % 32 % 49 % 15 %
Tomiyasu ES 5 % 39 % 43 % 13 % 7 % 38 % 47 % 9 % 5 % 33 % 38 % 24 % 2 % 44 % 38 % 15 %
Tobler ES 6 % 45 % 38 % 11 % 5 % 51 % 40 % 4 % 9 % 44 % 31 % 15 % 4 % 47 % 39 % 9 %
Stanford ES 8 % 37 % 42 % 13 % 10 % 51 % 35 % 5 % 6 % 36 % 37 % 21 % 8 % 38 % 43 % 11 %
Scherkenbach ES 2 % 24 % 46 % 27 % 3 % 26 % 50 % 20 % 4 % 20 % 36 % 41 % 2 % 21 % 43 % 34 %
Sawyer MS 7 % 30 % 49 % 14 % 8 % 41 % 45 % 6 % 13 % 29 % 44 % 15 % 10 % 32 % 55 % 4 %
Saville MS 4 % 22 % 50 % 23 % 4 % 32 % 54 % 10 % 8 % 23 % 46 % 23 % 7 % 22 % 63 % 8 %
Scott ES 10 % 33 % 44 % 14 % 14 % 36 % 46 % 4 % 8 % 35 % 35 % 22 % 13 % 41 % 35 % 11 %
Schorr ES 4 % 30 % 49 % 17 % 1 % 52 % 44 % 4 % 5 % 34 % 36 % 25 % 4 % 29 % 43 % 24 %
Schofield MS 7 % 28 % 50 % 16 % 5 % 37 % 52 % 5 % 11 % 27 % 45 % 18 % 7 % 25 % 62 % 6 %
Rowe ES 5 % 46 % 39 % 10 % 10 % 56 % 30 % 4 % 6 % 36 % 43 % 15 % 9 % 49 % 34 % 7 %
Staton ES 4 % 21 % 49 % 27 % 2 % 36 % 52 % 9 % 3 % 20 % 39 % 38 % 2 % 27 % 46 % 25 %
Sandy Valley Jr/Sr HS 4 % 31 % 53 % 11 % 0 % 32 % 63 % 5 % 10 % 30 % 39 % 20 % 5 % 25 % 60 % 10 %
Sandy Valley ES 9 % 38 % 38 % 15 % 4 % 65 % 30 % 0 % 8 % 35 % 38 % 20 % 8 % 29 % 46 % 17 %
Rundle ES 7 % 40 % 43 % 10 % 12 % 48 % 37 % 3 % 10 % 40 % 35 % 16 % 11 % 49 % 33 % 6 %
Sedway MS 12 % 40 % 40 % 7 % 10 % 51 % 36 % 2 % 20 % 39 % 34 % 7 % 20 % 36 % 42 % 2 %
South Continuation Jr/Sr HS
65 % 35 % 0 % 0 % - - - - 72 % 28 % 0 % 0 % - - - -
Snyder ES 5 % 39 % 40 % 16 % 7 % 53 % 39 % 1 % 4 % 28 % 37 % 31 % 5 % 48 % 39 % 9 %
Smith (J.D.) MS 14 % 39 % 38 % 9 % 13 % 49 % 36 % 2 % 19 % 37 % 35 % 9 % 19 % 45 % 34 % 2 %
Squires ES 13 % 43 % 36 % 8 % 17 % 56 % 27 % 0 % 13 % 33 % 33 % 22 % 15 % 42 % 34 % 9 %
Spring Mtn Jr/Sr HS - - - - - - - - - - - - - - - -
Southwest Behavior Jr/Sr HS
49 % 41 % 7 % 2 % 24 % 48 % 27 % 0 % 53 % 40 % 5 % 2 % 72 % 25 % 3 % 0 %
Simmons ES 10 % 40 % 39 % 12 % 12 % 54 % 32 % 2 % 8 % 35 % 35 % 22 % 20 % 36 % 35 % 9 %
Silvestri JHS 5 % 31 % 46 % 19 % 1 % 32 % 55 % 12 % 8 % 24 % 44 % 23 % 5 % 27 % 61 % 6 %
Sewell ES 6 % 33 % 45 % 17 % 9 % 42 % 42 % 8 % 5 % 31 % 42 % 22 % 5 % 33 % 45 % 17 %
Smith (Hal) ES 11 % 40 % 40 % 9 % 19 % 53 % 27 % 1 % 14 % 46 % 27 % 13 % 19 % 39 % 38 % 4 %
Smith (Helen) ES 6 % 29 % 50 % 15 % 6 % 44 % 48 % 2 % 5 % 20 % 31 % 44 % 2 % 19 % 49 % 30 %
Smalley ES 5 % 25 % 51 % 19 % 6 % 35 % 50 % 8 % 4 % 26 % 38 % 33 % 3 % 22 % 46 % 29 %
Clark County Schools
‘-’ indicates data not presented for groups fewer than 10. ‘N/A’ indicates that data are not available.
K-8 Reading Writing Mathematics Science
ED AS MS ES ED AS MS ES ED AS MS ES ED AS MS ES
Page 121 of 125
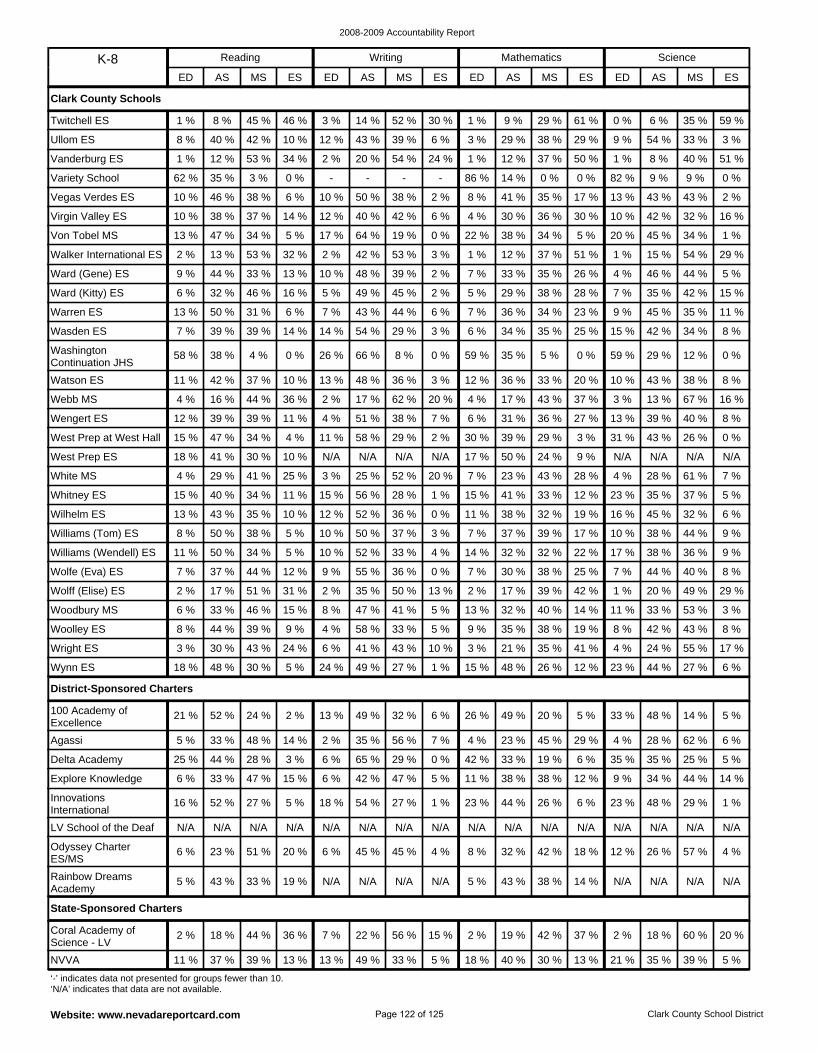
2008-2009 Accountability Report
Website: www.nevadareportcard.com Clark County School District
NVVA 11 % 37 % 39 % 13 % 13 % 49 % 33 % 5 % 18 % 40 % 30 % 13 % 21 % 35 % 39 % 5 %
Coral Academy of Science - LV
2 % 18 % 44 % 36 % 7 % 22 % 56 % 15 % 2 % 19 % 42 % 37 % 2 % 18 % 60 % 20 %
State-Sponsored Charters
Delta Academy 25 % 44 % 28 % 3 % 6 % 65 % 29 % 0 % 42 % 33 % 19 % 6 % 35 % 35 % 25 % 5 %
Explore Knowledge 6 % 33 % 47 % 15 % 6 % 42 % 47 % 5 % 11 % 38 % 38 % 12 % 9 % 34 % 44 % 14 %
100 Academy of Excellence
21 % 52 % 24 % 2 % 13 % 49 % 32 % 6 % 26 % 49 % 20 % 5 % 33 % 48 % 14 % 5 %
Agassi 5 % 33 % 48 % 14 % 2 % 35 % 56 % 7 % 4 % 23 % 45 % 29 % 4 % 28 % 62 % 6 %
Odyssey Charter ES/MS
6 % 23 % 51 % 20 % 6 % 45 % 45 % 4 % 8 % 32 % 42 % 18 % 12 % 26 % 57 % 4 %
Rainbow Dreams Academy
5 % 43 % 33 % 19 % N/A N/A N/A N/A 5 % 43 % 38 % 14 % N/A N/A N/A N/A
Innovations International
16 % 52 % 27 % 5 % 18 % 54 % 27 % 1 % 23 % 44 % 26 % 6 % 23 % 48 % 29 % 1 %
LV School of the Deaf N/A N/A N/A N/A N/A N/A N/A N/A N/A N/A N/A N/A N/A N/A N/A N/A
District-Sponsored Charters
Williams (Wendell) ES 11 % 50 % 34 % 5 % 10 % 52 % 33 % 4 % 14 % 32 % 32 % 22 % 17 % 38 % 36 % 9 %
Wolfe (Eva) ES 7 % 37 % 44 % 12 % 9 % 55 % 36 % 0 % 7 % 30 % 38 % 25 % 7 % 44 % 40 % 8 %
Williams (Tom) ES 8 % 50 % 38 % 5 % 10 % 50 % 37 % 3 % 7 % 37 % 39 % 17 % 10 % 38 % 44 % 9 %
Whitney ES 15 % 40 % 34 % 11 % 15 % 56 % 28 % 1 % 15 % 41 % 33 % 12 % 23 % 35 % 37 % 5 %
Wilhelm ES 13 % 43 % 35 % 10 % 12 % 52 % 36 % 0 % 11 % 38 % 32 % 19 % 16 % 45 % 32 % 6 %
Wright ES 3 % 30 % 43 % 24 % 6 % 41 % 43 % 10 % 3 % 21 % 35 % 41 % 4 % 24 % 55 % 17 %
Wynn ES 18 % 48 % 30 % 5 % 24 % 49 % 27 % 1 % 15 % 48 % 26 % 12 % 23 % 44 % 27 % 6 %
Woolley ES 8 % 44 % 39 % 9 % 4 % 58 % 33 % 5 % 9 % 35 % 38 % 19 % 8 % 42 % 43 % 8 %
Wolff (Elise) ES 2 % 17 % 51 % 31 % 2 % 35 % 50 % 13 % 2 % 17 % 39 % 42 % 1 % 20 % 49 % 29 %
Woodbury MS 6 % 33 % 46 % 15 % 8 % 47 % 41 % 5 % 13 % 32 % 40 % 14 % 11 % 33 % 53 % 3 %
Von Tobel MS 13 % 47 % 34 % 5 % 17 % 64 % 19 % 0 % 22 % 38 % 34 % 5 % 20 % 45 % 34 % 1 %
Virgin Valley ES 10 % 38 % 37 % 14 % 12 % 40 % 42 % 6 % 4 % 30 % 36 % 30 % 10 % 42 % 32 % 16 %
Ward (Gene) ES 9 % 44 % 33 % 13 % 10 % 48 % 39 % 2 % 7 % 33 % 35 % 26 % 4 % 46 % 44 % 5 %
Walker International ES 2 % 13 % 53 % 32 % 2 % 42 % 53 % 3 % 1 % 12 % 37 % 51 % 1 % 15 % 54 % 29 %
Vegas Verdes ES 10 % 46 % 38 % 6 % 10 % 50 % 38 % 2 % 8 % 41 % 35 % 17 % 13 % 43 % 43 % 2 %
Ullom ES 8 % 40 % 42 % 10 % 12 % 43 % 39 % 6 % 3 % 29 % 38 % 29 % 9 % 54 % 33 % 3 %
Twitchell ES 1 % 8 % 45 % 46 % 3 % 14 % 52 % 30 % 1 % 9 % 29 % 61 % 0 % 6 % 35 % 59 %
Variety School 62 % 35 % 3 % 0 % - - - - 86 % 14 % 0 % 0 % 82 % 9 % 9 % 0 %
Vanderburg ES 1 % 12 % 53 % 34 % 2 % 20 % 54 % 24 % 1 % 12 % 37 % 50 % 1 % 8 % 40 % 51 %
Ward (Kitty) ES 6 % 32 % 46 % 16 % 5 % 49 % 45 % 2 % 5 % 29 % 38 % 28 % 7 % 35 % 42 % 15 %
West Prep at West Hall 15 % 47 % 34 % 4 % 11 % 58 % 29 % 2 % 30 % 39 % 29 % 3 % 31 % 43 % 26 % 0 %
Wengert ES 12 % 39 % 39 % 11 % 4 % 51 % 38 % 7 % 6 % 31 % 36 % 27 % 13 % 39 % 40 % 8 %
White MS 4 % 29 % 41 % 25 % 3 % 25 % 52 % 20 % 7 % 23 % 43 % 28 % 4 % 28 % 61 % 7 %
West Prep ES 18 % 41 % 30 % 10 % N/A N/A N/A N/A 17 % 50 % 24 % 9 % N/A N/A N/A N/A
Webb MS 4 % 16 % 44 % 36 % 2 % 17 % 62 % 20 % 4 % 17 % 43 % 37 % 3 % 13 % 67 % 16 %
Wasden ES 7 % 39 % 39 % 14 % 14 % 54 % 29 % 3 % 6 % 34 % 35 % 25 % 15 % 42 % 34 % 8 %
Warren ES 13 % 50 % 31 % 6 % 7 % 43 % 44 % 6 % 7 % 36 % 34 % 23 % 9 % 45 % 35 % 11 %
Watson ES 11 % 42 % 37 % 10 % 13 % 48 % 36 % 3 % 12 % 36 % 33 % 20 % 10 % 43 % 38 % 8 %
Washington Continuation JHS
58 % 38 % 4 % 0 % 26 % 66 % 8 % 0 % 59 % 35 % 5 % 0 % 59 % 29 % 12 % 0 %
Clark County Schools
‘-’ indicates data not presented for groups fewer than 10. ‘N/A’ indicates that data are not available.
K-8 Reading Writing Mathematics Science
ED AS MS ES ED AS MS ES ED AS MS ES ED AS MS ES
Page 122 of 125
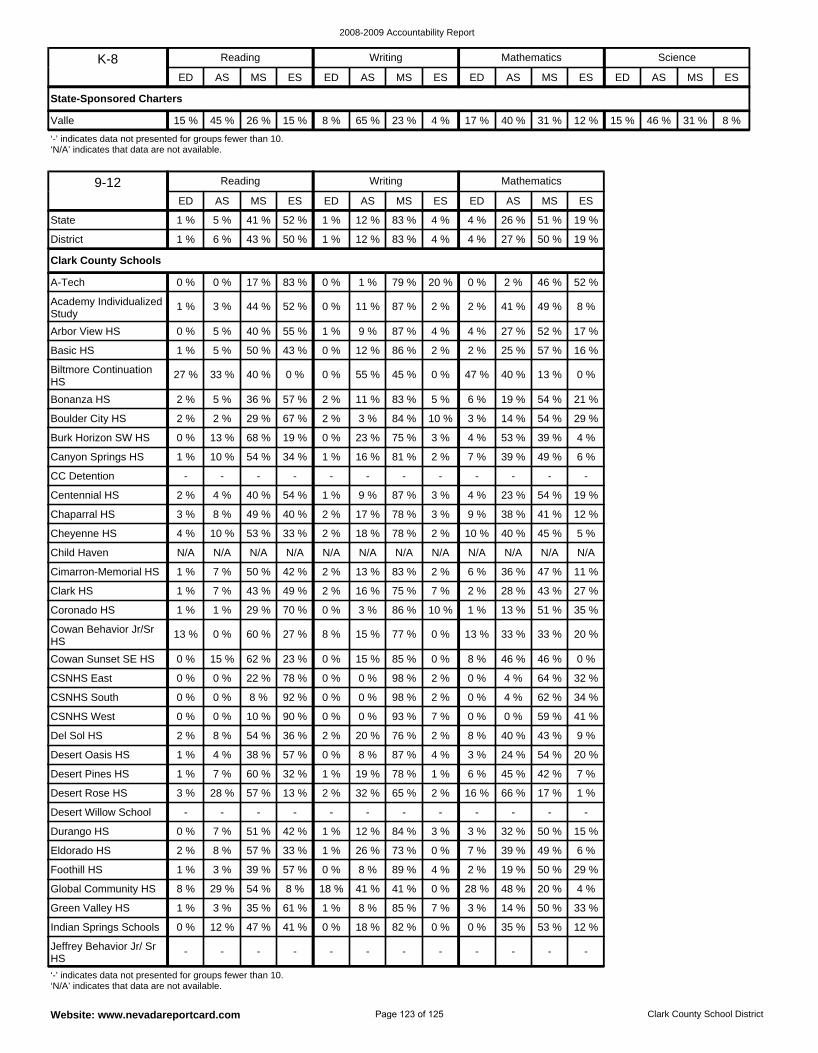
2008-2009 Accountability Report
Website: www.nevadareportcard.com Clark County School District
Valle 15 % 45 % 26 % 15 % 8 % 65 % 23 % 4 % 17 % 40 % 31 % 12 % 15 % 46 % 31 % 8 %
State-Sponsored Charters
‘-’ indicates data not presented for groups fewer than 10. ‘N/A’ indicates that data are not available.
K-8 Reading Writing Mathematics Science
ED AS MS ES ED AS MS ES ED AS MS ES ED AS MS ES
Foothill HS 1 % 3 % 39 % 57 % 0 % 8 % 89 % 4 % 2 % 19 % 50 % 29 %
Eldorado HS 2 % 8 % 57 % 33 % 1 % 26 % 73 % 0 % 7 % 39 % 49 % 6 %
Durango HS 0 % 7 % 51 % 42 % 1 % 12 % 84 % 3 % 3 % 32 % 50 % 15 %
Indian Springs Schools 0 % 12 % 47 % 41 % 0 % 18 % 82 % 0 % 0 % 35 % 53 % 12 %
Green Valley HS 1 % 3 % 35 % 61 % 1 % 8 % 85 % 7 % 3 % 14 % 50 % 33 %
Global Community HS 8 % 29 % 54 % 8 % 18 % 41 % 41 % 0 % 28 % 48 % 20 % 4 %
Desert Oasis HS 1 % 4 % 38 % 57 % 0 % 8 % 87 % 4 % 3 % 24 % 54 % 20 %
Del Sol HS 2 % 8 % 54 % 36 % 2 % 20 % 76 % 2 % 8 % 40 % 43 % 9 %
Desert Willow School - - - - - - - - - - - -
Desert Rose HS 3 % 28 % 57 % 13 % 2 % 32 % 65 % 2 % 16 % 66 % 17 % 1 %
Desert Pines HS 1 % 7 % 60 % 32 % 1 % 19 % 78 % 1 % 6 % 45 % 42 % 7 %
Jeffrey Behavior Jr/ Sr HS
- - - - - - - - - - - -
CSNHS South 0 % 0 % 8 % 92 % 0 % 0 % 98 % 2 % 0 % 4 % 62 % 34 %
Bonanza HS 2 % 5 % 36 % 57 % 2 % 11 % 83 % 5 % 6 % 19 % 54 % 21 %
Biltmore Continuation HS
27 % 33 % 40 % 0 % 0 % 55 % 45 % 0 % 47 % 40 % 13 % 0 %
Boulder City HS 2 % 2 % 29 % 67 % 2 % 3 % 84 % 10 % 3 % 14 % 54 % 29 %
Canyon Springs HS 1 % 10 % 54 % 34 % 1 % 16 % 81 % 2 % 7 % 39 % 49 % 6 %
Burk Horizon SW HS 0 % 13 % 68 % 19 % 0 % 23 % 75 % 3 % 4 % 53 % 39 % 4 %
Basic HS 1 % 5 % 50 % 43 % 0 % 12 % 86 % 2 % 2 % 25 % 57 % 16 %
CSNHS West 0 % 0 % 10 % 90 % 0 % 0 % 93 % 7 % 0 % 0 % 59 % 41 %
A-Tech 0 % 0 % 17 % 83 % 0 % 1 % 79 % 20 % 0 % 2 % 46 % 52 %
Arbor View HS 0 % 5 % 40 % 55 % 1 % 9 % 87 % 4 % 4 % 27 % 52 % 17 %
Academy Individualized Study
1 % 3 % 44 % 52 % 0 % 11 % 87 % 2 % 2 % 41 % 49 % 8 %
Coronado HS 1 % 1 % 29 % 70 % 0 % 3 % 86 % 10 % 1 % 13 % 51 % 35 %
Clark HS 1 % 7 % 43 % 49 % 2 % 16 % 75 % 7 % 2 % 28 % 43 % 27 %
Cowan Behavior Jr/Sr HS
13 % 0 % 60 % 27 % 8 % 15 % 77 % 0 % 13 % 33 % 33 % 20 %
CSNHS East 0 % 0 % 22 % 78 % 0 % 0 % 98 % 2 % 0 % 4 % 64 % 32 %
Cowan Sunset SE HS 0 % 15 % 62 % 23 % 0 % 15 % 85 % 0 % 8 % 46 % 46 % 0 %
Cimarron-Memorial HS 1 % 7 % 50 % 42 % 2 % 13 % 83 % 2 % 6 % 36 % 47 % 11 %
CC Detention - - - - - - - - - - - -
Centennial HS 2 % 4 % 40 % 54 % 1 % 9 % 87 % 3 % 4 % 23 % 54 % 19 %
Chaparral HS 3 % 8 % 49 % 40 % 2 % 17 % 78 % 3 % 9 % 38 % 41 % 12 %
Child Haven N/A N/A N/A N/A N/A N/A N/A N/A N/A N/A N/A N/A
Cheyenne HS 4 % 10 % 53 % 33 % 2 % 18 % 78 % 2 % 10 % 40 % 45 % 5 %
Clark County Schools
District 1 % 6 % 43 % 50 % 1 % 12 % 83 % 4 % 4 % 27 % 50 % 19 %
State 1 % 5 % 41 % 52 % 1 % 12 % 83 % 4 % 4 % 26 % 51 % 19 %
‘-’ indicates data not presented for groups fewer than 10. ‘N/A’ indicates that data are not available.
9-12 Reading Writing Mathematics
ED AS MS ES ED AS MS ES ED AS MS ES
Page 123 of 125
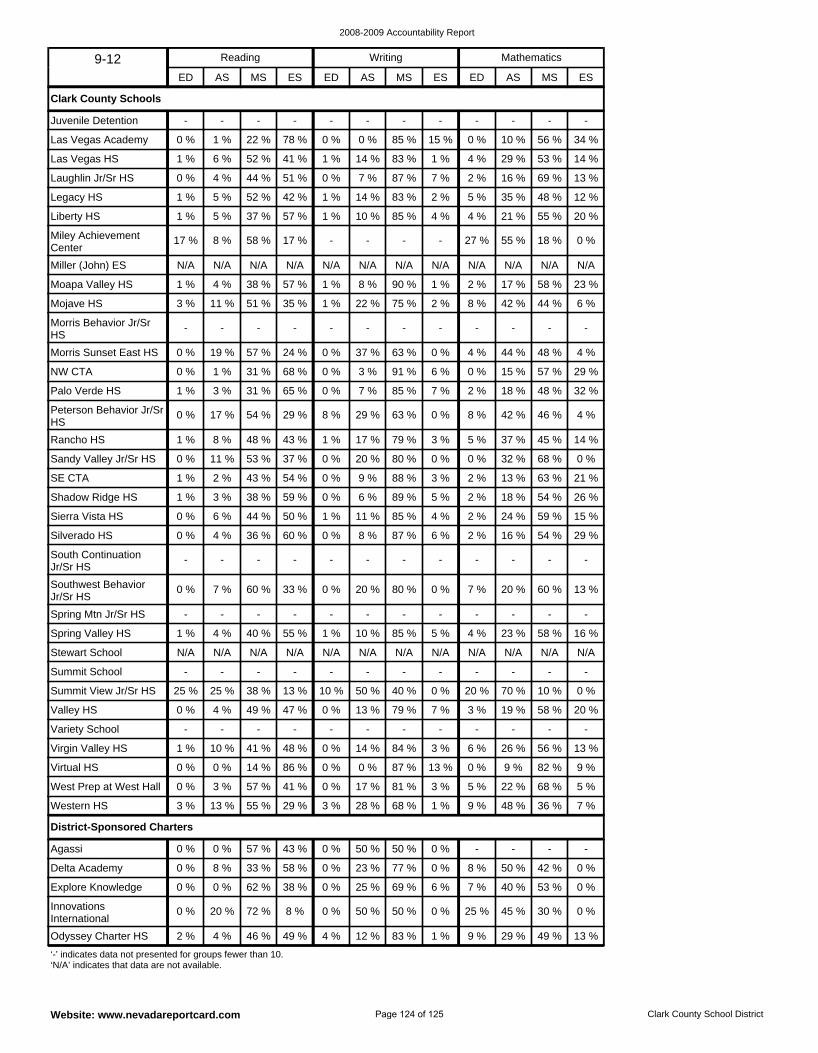
2008-2009 Accountability Report
Website: www.nevadareportcard.com Clark County School District
Delta Academy 0 % 8 % 33 % 58 % 0 % 23 % 77 % 0 % 8 % 50 % 42 % 0 %
Agassi 0 % 0 % 57 % 43 % 0 % 50 % 50 % 0 % - - - -
Explore Knowledge 0 % 0 % 62 % 38 % 0 % 25 % 69 % 6 % 7 % 40 % 53 % 0 %
Odyssey Charter HS 2 % 4 % 46 % 49 % 4 % 12 % 83 % 1 % 9 % 29 % 49 % 13 %
Innovations International
0 % 20 % 72 % 8 % 0 % 50 % 50 % 0 % 25 % 45 % 30 % 0 %
District-Sponsored Charters
Spring Valley HS 1 % 4 % 40 % 55 % 1 % 10 % 85 % 5 % 4 % 23 % 58 % 16 %
Stewart School N/A N/A N/A N/A N/A N/A N/A N/A N/A N/A N/A N/A
Summit School - - - - - - - - - - - -
Spring Mtn Jr/Sr HS - - - - - - - - - - - -
Virtual HS 0 % 0 % 14 % 86 % 0 % 0 % 87 % 13 % 0 % 9 % 82 % 9 %
South Continuation Jr/Sr HS
- - - - - - - - - - - -
Southwest Behavior Jr/Sr HS
0 % 7 % 60 % 33 % 0 % 20 % 80 % 0 % 7 % 20 % 60 % 13 %
Silverado HS 0 % 4 % 36 % 60 % 0 % 8 % 87 % 6 % 2 % 16 % 54 % 29 %
West Prep at West Hall 0 % 3 % 57 % 41 % 0 % 17 % 81 % 3 % 5 % 22 % 68 % 5 %
Western HS 3 % 13 % 55 % 29 % 3 % 28 % 68 % 1 % 9 % 48 % 36 % 7 %
Virgin Valley HS 1 % 10 % 41 % 48 % 0 % 14 % 84 % 3 % 6 % 26 % 56 % 13 %
Summit View Jr/Sr HS 25 % 25 % 38 % 13 % 10 % 50 % 40 % 0 % 20 % 70 % 10 % 0 %
Valley HS 0 % 4 % 49 % 47 % 0 % 13 % 79 % 7 % 3 % 19 % 58 % 20 %
Variety School - - - - - - - - - - - -
Miley Achievement Center
17 % 8 % 58 % 17 % - - - - 27 % 55 % 18 % 0 %
Liberty HS 1 % 5 % 37 % 57 % 1 % 10 % 85 % 4 % 4 % 21 % 55 % 20 %
Miller (John) ES N/A N/A N/A N/A N/A N/A N/A N/A N/A N/A N/A N/A
Mojave HS 3 % 11 % 51 % 35 % 1 % 22 % 75 % 2 % 8 % 42 % 44 % 6 %
Moapa Valley HS 1 % 4 % 38 % 57 % 1 % 8 % 90 % 1 % 2 % 17 % 58 % 23 %
Las Vegas Academy 0 % 1 % 22 % 78 % 0 % 0 % 85 % 15 % 0 % 10 % 56 % 34 %
Juvenile Detention - - - - - - - - - - - -
Las Vegas HS 1 % 6 % 52 % 41 % 1 % 14 % 83 % 1 % 4 % 29 % 53 % 14 %
Legacy HS 1 % 5 % 52 % 42 % 1 % 14 % 83 % 2 % 5 % 35 % 48 % 12 %
Laughlin Jr/Sr HS 0 % 4 % 44 % 51 % 0 % 7 % 87 % 7 % 2 % 16 % 69 % 13 %
Sandy Valley Jr/Sr HS 0 % 11 % 53 % 37 % 0 % 20 % 80 % 0 % 0 % 32 % 68 % 0 %
Rancho HS 1 % 8 % 48 % 43 % 1 % 17 % 79 % 3 % 5 % 37 % 45 % 14 %
SE CTA 1 % 2 % 43 % 54 % 0 % 9 % 88 % 3 % 2 % 13 % 63 % 21 %
Sierra Vista HS 0 % 6 % 44 % 50 % 1 % 11 % 85 % 4 % 2 % 24 % 59 % 15 %
Shadow Ridge HS 1 % 3 % 38 % 59 % 0 % 6 % 89 % 5 % 2 % 18 % 54 % 26 %
Morris Sunset East HS 0 % 19 % 57 % 24 % 0 % 37 % 63 % 0 % 4 % 44 % 48 % 4 %
Morris Behavior Jr/Sr HS
- - - - - - - - - - - -
NW CTA 0 % 1 % 31 % 68 % 0 % 3 % 91 % 6 % 0 % 15 % 57 % 29 %
Peterson Behavior Jr/Sr HS
0 % 17 % 54 % 29 % 8 % 29 % 63 % 0 % 8 % 42 % 46 % 4 %
Palo Verde HS 1 % 3 % 31 % 65 % 0 % 7 % 85 % 7 % 2 % 18 % 48 % 32 %
Clark County Schools
‘-’ indicates data not presented for groups fewer than 10. ‘N/A’ indicates that data are not available.
9-12 Reading Writing Mathematics
ED AS MS ES ED AS MS ES ED AS MS ES
Page 124 of 125
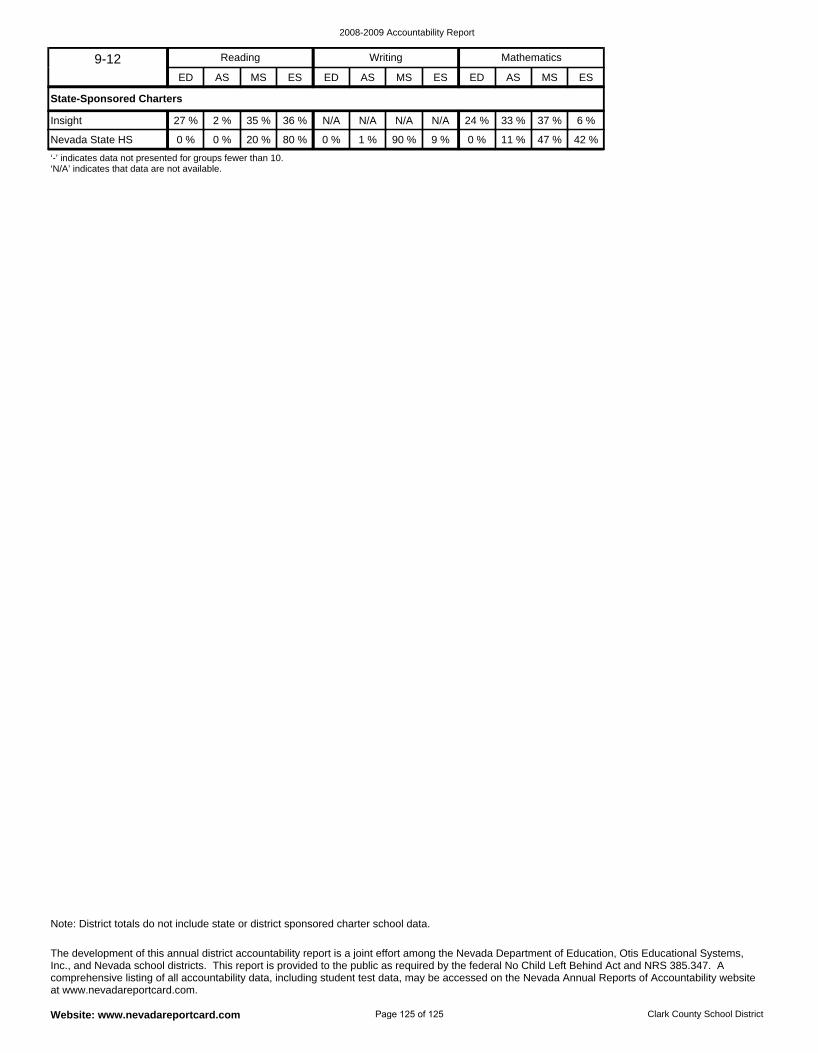
2008-2009 Accountability Report
Website: www.nevadareportcard.com Clark County School District
Insight 27 % 2 % 35 % 36 % N/A N/A N/A N/A 24 % 33 % 37 % 6 %
Nevada State HS 0 % 0 % 20 % 80 % 0 % 1 % 90 % 9 % 0 % 11 % 47 % 42 %
State-Sponsored Charters
‘-’ indicates data not presented for groups fewer than 10. ‘N/A’ indicates that data are not available.
9-12 Reading Writing Mathematics
ED AS MS ES ED AS MS ES ED AS MS ES
The development of this annual district accountability report is a joint effort among the Nevada Department of Education, Otis Educational Systems, Inc., and Nevada school districts. This report is provided to the public as required by the federal No Child Left Behind Act and NRS 385.347. A comprehensive listing of all accountability data, including student test data, may be accessed on the Nevada Annual Reports of Accountability website at www.nevadareportcard.com.
Note: District totals do not include state or district sponsored charter school data.
Page 125 of 125