sunway berhad q3.pdf - chartnexus
TRANSCRIPT

SUNWAY BERHAD ( Company No : 921551-D )
QUARTERLY REPORT ON CONSOLIDATED RESULTS FOR THE FINANCIAL PERIOD ENDED 30 SEPTEMBER 2012
THE FIGURES HAVE NOT BEEN AUDITED
UNAUDITED CONDENSED CONSOLIDATED INCOME STATEMENTS FOR THE PERIOD ENDED 30 SEPTEMBER 2012
CURRENT PRECEDING YEAR CURRENT PRECEDING YEAR
YEAR CORRESPONDING YEAR CORRESPONDING
QUARTER QUARTER TO DATE PERIOD
30/9/2012 30/9/2011 30/9/2012 30/9/2011
RM'000 RM'000 RM'000 RM'000
REVENUE 866,979 934,031 2,677,833 2,770,307
OPERATING EXPENSES (785,995) (897,859) (2,474,304) (2,672,598)
OTHER OPERATING INCOME 25,108 27,982 67,168 67,625
PROFIT FROM OPERATIONS 106,092 64,154 270,697 165,334
(LOSS) / GAIN ON DERIVATIVES (300) (11,859) 110 (8,301)
FINANCE INCOME 10,464 7,352 22,977 20,231
FINANCE COSTS (29,911) (25,567) (83,793) (57,956)
SHARE OF PROFIT FROM ASSOCIATES 18,919 16,751 139,310 90,817
SHARE OF PROFIT FROM JOINTLY
CONTROLLED ENTITIES 37,149 39,905 71,158 106,837
PROFIT BEFORE TAX 142,413 90,736 420,459 316,962
INCOME TAX EXPENSE (32,399) (18,723) (81,234) (39,711)
PROFIT FOR THE PERIOD 110,014 72,013 339,225 277,251
ATTRIBUTABLE TO:
- OWNERS OF THE PARENT 94,273 69,224 313,055 245,928
- NON-CONTROLLING INTERESTS 15,741 2,789 26,170 31,323
110,014 72,013 339,225 277,251
EARNINGS PER SHARE
(i) BASIC ( sen ) 7.29 5.36 24.22 19.03
(ii) DILUTED ( sen ) 7.29 5.36 24.22 19.03
INDIVIDUAL QUARTER CUMULATIVE QUARTER
( The Unaudited Condensed Consolidated Income Statements should be read in conjunction with the Annual Statutory Financial
Statements for the year ended 31 December 2011 and the accompanying explanatory notes attached to the interim financial
statements.)
1
SUNWAY BERHAD ( Company No : 921551-D )
QUARTERLY REPORT ON CONSOLIDATED RESULTS FOR THE FINANCIAL PERIOD ENDED 30 SEPTEMBER 2012
THE FIGURES HAVE NOT BEEN AUDITED
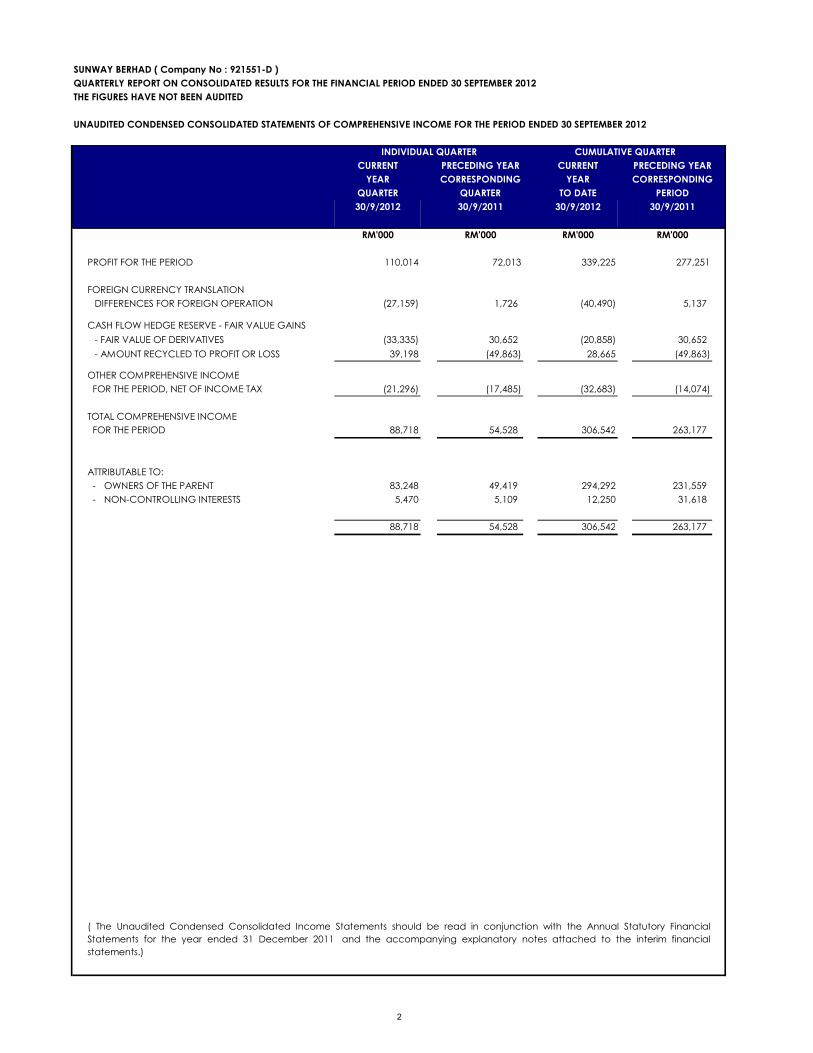
UNAUDITED CONDENSED CONSOLIDATED STATEMENTS OF COMPREHENSIVE INCOME FOR THE PERIOD ENDED 30 SEPTEMBER 2012
CURRENT PRECEDING YEAR CURRENT PRECEDING YEAR
YEAR CORRESPONDING YEAR CORRESPONDING
QUARTER QUARTER TO DATE PERIOD
30/9/2012 30/9/2011 30/9/2012 30/9/2011
RM'000 RM'000 RM'000 RM'000
PROFIT FOR THE PERIOD 110,014 72,013 339,225 277,251
FOREIGN CURRENCY TRANSLATION
DIFFERENCES FOR FOREIGN OPERATION (27,159) 1,726 (40,490) 5,137
CASH FLOW HEDGE RESERVE - FAIR VALUE GAINS
- FAIR VALUE OF DERIVATIVES (33,335) 30,652 (20,858) 30,652
- AMOUNT RECYCLED TO PROFIT OR LOSS 39,198 (49,863) 28,665 (49,863)
OTHER COMPREHENSIVE INCOME
FOR THE PERIOD, NET OF INCOME TAX (21,296) (17,485) (32,683) (14,074)
TOTAL COMPREHENSIVE INCOME
FOR THE PERIOD 88,718 54,528 306,542 263,177
ATTRIBUTABLE TO:
- OWNERS OF THE PARENT 83,248 49,419 294,292 231,559
- NON-CONTROLLING INTERESTS 5,470 5,109 12,250 31,618
88,718 54,528 306,542 263,177
INDIVIDUAL QUARTER CUMULATIVE QUARTER
( The Unaudited Condensed Consolidated Income Statements should be read in conjunction with the Annual Statutory Financial
Statements for the year ended 31 December 2011 and the accompanying explanatory notes attached to the interim financial
statements.)
2

SUNWAY BERHAD ( Company No : 921551-D )
QUARTERLY REPORT ON CONSOLIDATED RESULTS FOR THE FINANCIAL PERIOD ENDED 30 SEPTEMBER 2012
THE FIGURES HAVE NOT BEEN AUDITED
UNAUDITED CONDENSED CONSOLIDATED STATEMENTS OF FINANCIAL POSITION AS AT 30 SEPTEMBER 2012
AS AT END OF AS AT PRECEDING
CURRENT QUARTER FINANCIAL PERIOD END
30/9/2012 31/12/2011
(Restated)
RM'000 RM'000
ASSETS
Non-current assets
Property, plant and equipment 954,367 960,567
Biological assets 529 416
Investment properties 1,046,148 888,896
Rock reserves 7,678 8,379
Land held for property development 847,681 1,017,292
Investment in associates 1,095,454 1,015,303
Investment in jointly controlled entities 526,081 265,896
Other investments 1,761 1,849
Derivative assets 12,742 33,600
Receivables 636 7,013
Goodwill 326,491 326,497
Other intangible assets 3,046 -
Deferred tax assets 34,153 33,308
4,856,767 4,559,016
Current assets
Properties development costs 787,678 669,334
Inventories 619,108 451,840
Receivables, deposits & prepayments 1,497,592 1,319,145
Deposits, bank & cash balances 711,930 776,705
Tax recoverable 80,378 67,588
3,696,686 3,284,612
TOTAL ASSETS 8,553,453 7,843,628
EQUITY AND LIABILITIES
Current liabilities
Payables, accruals & other current liabilities 2,023,304 2,005,566
Bank borrowings 602,396 319,222
Taxation 25,307 27,098
Derivative liabilities 216 1,554
2,651,223 2,353,440
Non-current liabilities
Long term bank borrowings 2,001,919 1,934,472
Other long term liabilities 225,581 154,686
Derivative liabilities 509 182
Deferred taxation 51,407 47,914
2,279,416 2,137,254
Total liabilities 4,930,639 4,490,694
Equity attributable to Owners of the Parent
Share capital 1,292,505 1,292,505
Share premium 2,326,509 2,326,509
Equity Contribution from non-controlling interests 35,376 35,376
Negative merger reserve (1,192,040) (1,192,040)
Retained profits 748,237 440,801
Other reserves 106,094 121,820
3,316,681 3,024,971
NON-CONTROLLING INTERESTS 306,133 327,963
Total equity 3,622,814 3,352,934
TOTAL EQUITY AND LIABILITIES 8,553,453 7,843,628
Net Assets Per Share 2.57 2.34
( The Unaudited Condensed Consolidated Income Statements should be read in conjunction with the Annual Statutory
Financial Statements for the year ended 31 December 2011 and the accompanying explanatory notes attached to the
interim financial statements.)
3

SUNWAY BERHAD ( Company No : 921551-D )
QUARTERLY REPORT ON CONSOLIDATED RESULTS FOR THE FINANCIAL PERIOD ENDED 30 SEPTEMBER 2012
THE FIGURES HAVE NOT BEEN AUDITED
UNAUDITED CONDENSED CONSOLIDATED STATEMENTS OF CHANGES IN EQUITY FOR THE PERIOD ENDED 30 SEPTEMBER 2012
DISTRIBUTABLE NON- TOTAL
EQUITY CONTROLLING EQUITY
CONTRIBUTION INTERESTS
FROM NON- NEGATIVE OTHER CAPITAL FOREIGN SHARE CASH FLOW FURNITURE
SHARE SHARE CONTROLLING MERGER RESERVES, CAPITAL REDEMPTION EXCHANGE FAIR VALUE STATUTORY REVALUATION OPTION HEDGE & FITTINGS RETAINED
CAPITAL PREMIUM INTERESTS RESERVE TOTAL RESERVE RESERVE RESERVE RESERVE RESERVE RESERVE RESERVE RESERVE RESERVE PROFITS TOTAL
RM'000 RM'000 RM'000 RM'000 RM'000 RM'000 RM'000 RM'000 RM'000 RM'000 RM'000 RM'000 RM'000 RM'000 RM'000 RM'000 RM'000 RM'000
PERIOD ENDED 30 SEPTEMBER 2011
At 1 January 2011 (as previously stated) 1,292,505 2,326,509 - (1,173,563) 176,800 109,312 203 (8,002) 49,967 618 22,501 2,201 - - - 2,622,251 385,837 3,008,088 - -
Effects of adopting Amendments to FRS112 - - - - - - - - - - - - - - 31,331 31,331 55 31,386
At 1 January 2011 (as restated) 1,292,505 2,326,509 - (1,173,563) 176,800 109,312 203 (8,002) 49,967 618 22,501 2,201 - - 31,331 2,653,582 385,892 3,039,474
Total comprehensive income - - - - (14,369) - - 4,842 - - - - (19,211) - 245,928 231,559 31,618 263,177
Dividend - - - - - - - - - - - - - - - - - -
Issue of ordinary shares by subsidiary - - - - - - - - - - - - - - - - 6,200 6,200
Issue of preference shares by subsidiary - - - - - - - - - - - - - - - - 2,100 2,100
New ESOS granted - - - - 704 - - - - - - 704 - - - 704 - 704
Redemption of redeemable preference shares - - - - 143 - 143 - - - - - - - (143) - - -
Dilution of equity interest in subsidiaries - - - - - - - - - - - - - - 4,217 4,217 312 4,529
Effect of FRS 139 - - - - (1,604) (11) - - (1,593) - - - - - (39,542) (41,146) (1,898) (43,044)
Dividends paid by subsidiaries - - - - - - - - - - - - - - - - (4,352) (4,352)
Disposal of a subsidiary - - - - - - - - - - - - - - - - 13,430 13,430
Acquisition of interest from non-controlling interests - - - - - - - - - - - - - - - - (8,023) (8,023)
Transfer to statutory reserve - - - - 260 - - - - 260 - - - - (260) - - -
Transfer to furniture & fittings reserve - - - - 686 - - - - - - - - 686 (686) - - -
Share of depreciation transfer on land, net of tax by
an associated company - - - - (144) - - - - - (144) - - - 193 49 - 49
At 30 September 2011 (as restated) 1,292,505 2,326,509 - (1,173,563) 162,476 109,301 346 (3,160) 48,374 878 22,357 2,905 (19,211) 686 241,038 2,848,965 425,279 3,274,244
PERIOD ENDED 30 SEPTEMBER 2012
At 1 January 2012 (as previously stated) 1,292,505 2,326,509 35,376 (1,192,040) 121,820 34,137 75,521 (24,156) 21,643 879 22,357 3,170 (13,780) 2,049 401,263 2,985,433 326,366 3,311,799
Effects of adopting Amendments to FRS112 - - - - - - - - - - - - - - 39,538 39,538 1,597 41,135
At 1 January 2012 (as restated) 1,292,505 2,326,509 35,376 (1,192,040) 121,820 34,137 75,521 (24,156) 21,643 879 22,357 3,170 (13,780) 2,049 440,801 3,024,971 327,963 3,352,934
Total comprehensive income - - - - (18,763) - - (26,570) - - - - 7,807 - 313,055 294,292 12,250 306,542
Effect of FRS 139 - - - - 2,702 - - - 2,702 - - - - - 33 2,735 1,755 4,490
Dividends paid by subsidiaries - - - - - - - - - - - - - - - - (15,783) (15,783)
Acquisition of equity interest from
non-controlling interest - - - - - - - - - - - - - - (5,077) (5,077) (20,052) (25,129)
Transfer to furniture & fittings reserve - - - - 575 - - - - - - - - 575 (575) - - -
Utilisation of furniture & fittings reserve - - - - (240) - - - - - - - - (240) - (240) - (240)
At 30 September 2012 1,292,505 2,326,509 35,376 (1,192,040) 106,094 34,137 75,521 (50,726) 24,345 879 22,357 3,170 (5,973) 2,384 748,237 3,316,681 306,133 3,622,814
l--------------------------------------------------------------------------------- ATTRIBUTABLE TO OWNERS OF THE PARENT --------------------------------------------------------------------------------l
( The Unaudited Condensed Consolidated Income Statements should be read in conjunction with the Annual Statutory Financial Statements for the year ended 31 December 2011 and the accompanying explanatory notes attached to the interim financial statements.)
l--------------------------------------------------------------------------------- NON-DISTRIBUTABLE --------------------------------------------------------------------------------l
4

SUNWAY BERHAD ( Company No : 921551-D )
QUARTERLY REPORT ON CONSOLIDATED RESULTS FOR THE FINANCIAL PERIOD ENDED 30 SEPTEMBER 2012
THE FIGURES HAVE NOT BEEN AUDITED
UNAUDITED CONDENSED CONSOLIDATED STATEMENT OF CASH FLOWS FOR THE PERIOD ENDED 30 SEPTEMBER 2012
FOR THE FOR THE
9 MONTHS 9 MONTHS
PERIOD PERIOD
ENDED ENDED
30/9/2012 30/9/2011
RM'000 RM'000
CASH FLOWS FROM OPERATING ACTIVITIES
Receipts from operations 2,689,584 3,098,471
Payment to suppliers and contractors (1,676,005) (2,184,377)
Payment of operating expenses (836,176) (643,724)
Interest received 21,351 26,147
Dividend received from associate and jointly controlled entity 59,239 50,940
Cash generated from operations 257,993 347,457
Taxes refunded 9,423 6,416
Taxes paid (102,591) (77,681)
Net cash generated from operating activities 164,825 276,192
CASH FLOWS FROM INVESTING ACTIVITIES
Proceeds from disposal of property, plant & equipment 10,495 6,084
Proceeds from other investment 17 (7,371)
Deposit paid on additional investment in subsidiary (9,247) -
Acquisition of land (38,530) (77,008)
Acquisition of property, plant and equipment (69,647) (43,638)
Acquisition and additional investment in subsidiaries (8,000) (14,266)
Acquisition and subsequent expenditure of investment properties (140,196) (21,918)
Investment in associates (8,559) (4,696)
Repayment from/ (advances to) associates, jointly controlled entity and
joint venture partners (15,853) 72,440
Investment in jointly controlled entities (203,348) (726)
Net cash used in investing activities (482,868) (91,099)
CASH FLOWS FROM FINANCING ACTIVITIES
Net bank and other borrowings 279,079 817,839
Issue of ordinary shares to minority shareholders of subsidiary - 300
Issue of preference shares to minority shareholders of subsidiary - 2,100
Interest paid (83,199) (45,207)
Redemption of preference shares by a subsidiary - -
Redemption of preference share in other investments - 10,853
Redemption of preference share in jointly controlled entities 9,500
Capital repayment to shareholders - (904,753)
Dividend paid to non-controlling interests of subsidiaries (13,472) (2,747)
Net cash generated from/(used in) financing activities 182,408 (112,115)
NET (DECREASE)/INCREASE IN CASH AND CASH EQUIVALENTS (135,635) 72,978
EFFECTS OF EXCHANGE RATE CHANGES (4,112) 8,060
CASH AND CASH EQUIVALENTS AT BEGINNING OF PERIOD 776,705 856,193
CASH AND CASH EQUIVALENTS AT END OF FINANCIAL PERIOD 636,958 937,231
Cash and cash equivalents at end of financial period comprise the following :
Deposits, bank & cash balances 711,930 953,739
Bank overdrafts (74,972) (16,508)
636,958 937,231
( The Unaudited Condensed Consolidated Income Statements should be read in conjunction with the Annual Statutory Financial
Statements for the year ended 31 December 2011 and the accompanying explanatory notes attached to the interim financial
statements.)
5

NOTES TO FINANCIAL STATEMENTS :
A1 Accounting Policies and Basis of Preparation
IC Interpretation 19Amendments to IC Interpretation 14 Prepayments of a Minimum Funding RequirementAmendments to FRS 1
Amendments to FRS 7 Disclosures - Transfers of Financial AssetsAmendments to FRS 112 Deferred Tax - Recovery of Underlying AssetsFRS 124 Related Party Disclosures
Amendments to FRS 112: Deferred Tax - Recovery of Underlying Assets
Severe Hyperinflation and Removal of Fixed Dates for
First-time Adopters
The adoption of the above pronouncements does not have significant impact to the Group, except as
described below:
On 19 November 2011, the Malaysian Accounting Standards Board ("MASB") issued a new MASB approved
accounting framework, the Malaysian Financial Reporting Standards ("MFRS Framework").
The Group falls within the scope of Transitioning Entities. Transitioning Entities are allowed to defer the
adoption of the new MFRS Framework for an additional two years. Consequently, adoption of the MFRS
Framework by Transitioning Entities will be mandatory for annual periods begining on or after 1 January 2014.
The accounting policies and methods of computation adopted by the Group in this interim financial report are
consistent with those adopted in the annual financial statements for the financial year ended 31 December
2011 except for the adoption of the following new FRSs, amendments to FRSs and IC Interpretations that are
effective for financial statements effective from 1 January 2012, as disclosed below:
The amendments clarified the determination of deferred tax on investment property measured at fair
value. The amendment introduces a rebuttable presumption that deferred tax on investment property
measured using the fair value model in FRS 140: Investment Property should be determined on the basis
that its carrying amount will be recovered through sale. Furthermore, it introduces the requirement that
deferred tax on non-depreciable assets that are measured using the revaluation model in FRS 116:
Property, Plant and Equipment to be always measured on a sale basis of that asset.
The interim financial statements should be read in conjunction with the audited financial statements for the
year ended 31 December 2011. These explanatory notes attached to the interim financial statements provide
an explanation of events and transactions that are significant to an understanding of the changes in the
financial position and performance of the Group since the year ended 31 December 2011.
The MFRS Framework is to be applied by all Entities Other Than Private Entities for annual periods beginning
on or after 1 January 2012, with the exception of entities, inter alia, that are within the scope of IC
Interpretation 15 Agreements for Construction of Real Estate, including its parent, significant investor and
venturer (herein called "Transitioning Entities").
Accordingly, the Group will be required to prepare financial statements using the MFRS Framework in its first
MFRS financial statements for the year ending 31 December 2014. For the financial years ending 31
December 2012 and 31 December 2013, the Group will continue to prepare financial statements using the
Financial Reporting Standards ("FRS").
The interim financial report is unaudited and is prepared in accordance with FRS134 " Interim Financial
Reporting " and paragraph 9.22 of the Bursa Malaysia Securities Berhad Listing Requirements.
Extinguishing Financial Liabilities with Equity Instruments
6

Balance Sheet as at 1 January 2012 Before the
adoption of
Amendments to
FRS 112
Effects on adoption
of Amendments to
FRS 112
After the adoption
of Amendments to
FRS 112
RM'000 RM'000 RM'000
Retained profits 401,263 39,538 440,801
Deferred taxation 89,049 (41,135) 47,914
Non-controlling interests 326,366 1,597 327,963
A2 Report of the Auditors
A3 Seasonal or Cyclical Factors
A4 Unusual Items
a)
30/09/12 30/09/11RM'million RM'million
Profit before tax as reported 142.4 90.7
Loss/(Gain) on derivatives 1 0.3 11.9
Listing and merger expenses 3 - 12.9
Profit before tax excluding unusual items 142.7 115.5
Profit after tax and non-controlling interests as reported 94.3 69.2
Loss/(Gain) on derivatives 1 0.3 11.9
Listing and merger expenses 3 - 12.9
Profit after tax and non-controlling interests
excluding unusual items 94.6 94.0
The report of the auditors of preceding annual financial statements was not subject to any qualification.
Current and preceding year corresponding quarter
The results for the current quarter under review were not materially affected by seasonal or cyclical factors
except for the leisure and hospitality segments which normally peaks during major festive seasons and
holidays.
There were no material unusual items affecting the amounts reported for the current quarter ended 30
September 2012 except for the following:
The effects on adoption of Amendments to FRS 112 on the opening reserves of the Group and other
items of the consolidated statements of financial position as at 1 January 2012 are as follows:
7

b)
30/09/12 30/09/11
RM'million RM'million
Profit before tax as reported 420.5 317.0
(Gain)/Loss on derivatives 1 (0.1) 8.3
Fair value gain 2 (85.0) (41.6)
Listing and merger expenses 3 - 20.4
Profit before tax excluding unusual items 335.3 304.1
Profit after tax and non-controlling interests as reported 313.1 245.9
(Gain)/Loss on derivatives 1 (0.1) 8.3
Fair value gain 2 (76.5) (31.1)
Listing and merger expenses 3 - 20.4
Reversal of taxation 4 - (17.2)
Profit after tax and non-controlling interests
excluding unusual items 236.4 226.3
A5 Changes in Estimates
A6 Issuances, Cancellations, Repurchases, Resale and Repayments of Debts and Equity Securities
A7 Dividend Paid
There was no dividend paid during the financial period ended 30 September 2012.
There were no changes in estimates that have a material effect on the amounts reported for the current
quarter ended 30 September 2012.
There was no issuance, cancellations, repurchases, resale and repayments of debt and equity securities for
the current period under review.
1 The Group suffered RM0.3 million (loss before and after tax and non-controlling interests) and RM0.1
million in gain on derivatives for the current quarter ended 30 September 2012 and for the 9 months ended 30
September 2012 respectively as a result of the effects of FRS 139: Financial Instruments: Recognition and
Measurement. For the corresponding quarter ended 30 September 2011 and 9 months ended 30 September
2011, the Group suffered RM11.9 million (loss before and after tax and non-controlling interests) and RM8.3
million in loss on derivatives respectively.
3The Group incurred listing expenses of RM12.9 million (profit before and after tax and non-controlling
interests) and RM20.4 million in the corresponding quarter ended 30 September 2011 and the 9 months
ended 30 September 2012 respectively in relation to the merger exercise.
2The Group recognised RM85.0 million (profit before tax) and RM76.5 million (profit after tax and non-
controlling interests) as share of fair value gain from Sunway Real Estate Investment Trust ("Sunway REIT"),
a 36.9% associate of the Group following Sunway REIT's fair value gain amounting to RM230.2 million in the
quarter ended 30 June 2012. For the corresponding quarter ended 30 June 2011, the Group recognised
RM41.6 million (profit before tax) and RM31.1 million (profit after tax and non-controlling interests) as share of
fair value gain from Sunway REIT.
Notes:
4During the corresponding 1st quarter ended 31 March 2011, the Group reversed RM17.2 million (profit after
tax and non-controlling interest) of taxation provided following a succesfful tax treatment appeal to the
Australian Tax Office.
Cumulative current and preceding year to date
8
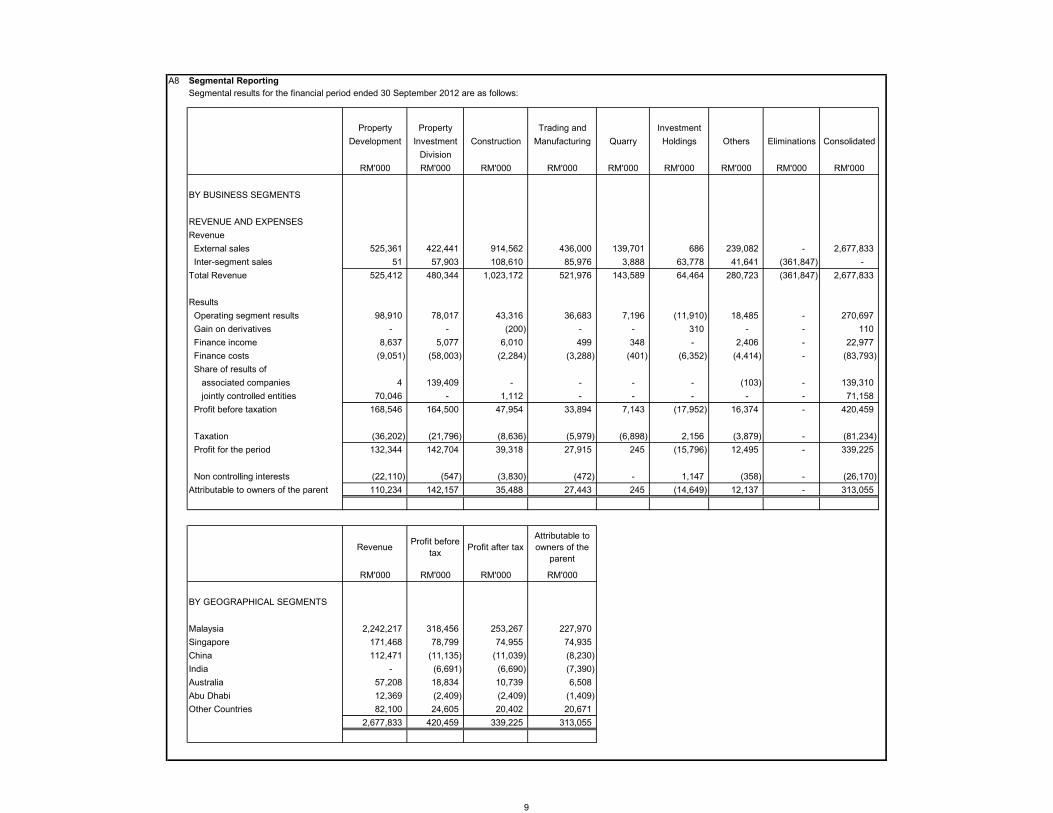
A8 Segmental Reporting
Segmental results for the financial period ended 30 September 2012 are as follows:
Property Property Trading and Investment
Development Investment Construction Manufacturing Quarry Holdings Others Eliminations Consolidated
Division
RM'000 RM'000 RM'000 RM'000 RM'000 RM'000 RM'000 RM'000 RM'000
BY BUSINESS SEGMENTS
REVENUE AND EXPENSES
Revenue
External sales 525,361 422,441 914,562 436,000 139,701 686 239,082 - 2,677,833
Inter-segment sales 51 57,903 108,610 85,976 3,888 63,778 41,641 (361,847) -
Total Revenue 525,412 480,344 1,023,172 521,976 143,589 64,464 280,723 (361,847) 2,677,833
Results
Operating segment results 98,910 78,017 43,316 36,683 7,196 (11,910) 18,485 - 270,697
Gain on derivatives - - (200) - - 310 - - 110
Finance income 8,637 5,077 6,010 499 348 - 2,406 - 22,977
Finance costs (9,051) (58,003) (2,284) (3,288) (401) (6,352) (4,414) - (83,793)
Share of results of
associated companies 4 139,409 - - - - (103) - 139,310
jointly controlled entities 70,046 - 1,112 - - - - - 71,158
Profit before taxation 168,546 164,500 47,954 33,894 7,143 (17,952) 16,374 - 420,459
Taxation (36,202) (21,796) (8,636) (5,979) (6,898) 2,156 (3,879) - (81,234)
Profit for the period 132,344 142,704 39,318 27,915 245 (15,796) 12,495 - 339,225
Non controlling interests (22,110) (547) (3,830) (472) - 1,147 (358) - (26,170)
Attributable to owners of the parent 110,234 142,157 35,488 27,443 245 (14,649) 12,137 - 313,055
RevenueProfit before
taxProfit after tax
Attributable to
owners of the
parent
RM'000 RM'000 RM'000 RM'000
BY GEOGRAPHICAL SEGMENTS
Malaysia 2,242,217 318,456 253,267 227,970
Singapore 171,468 78,799 74,955 74,935
China 112,471 (11,135) (11,039) (8,230)
India - (6,691) (6,690) (7,390)
Australia 57,208 18,834 10,739 6,508
Abu Dhabi 12,369 (2,409) (2,409) (1,409)
Other Countries 82,100 24,605 20,402 20,671
2,677,833 420,459 339,225 313,055
9

Core segmental results (excluding unsual items as per Note A4) for the financial period ended 30 September 2012 are as follows:
Property Property Trading and Investment
Development Investment Construction Manufacturing Quarry Holdings Others Eliminations Consolidated
Division
RM'000 RM'000 RM'000 RM'000 RM'000 RM'000 RM'000 RM'000 RM'000
BY BUSINESS SEGMENTS
REVENUE AND EXPENSES
Revenue
External sales 525,364 422,441 914,562 436,000 139,701 686 239,079 - 2,677,833
Inter-segment sales 51 57,903 108,610 85,976 3,888 63,778 41,641 (361,847) -
Total Revenue 525,415 480,344 1,023,172 521,976 143,589 64,464 280,720 (361,847) 2,677,833
Results
Operating segment results 98,910 78,017 43,316 36,683 7,196 (11,910) 18,481 - 270,693
Finance income 8,638 5,077 6,010 499 348 - 2,405 - 22,977
Finance costs (9,051) (58,003) (2,284) (3,288) (401) (6,352) (4,414) - (83,793)
Share of results of -
associated companies 4 54,391 - - - - (104) - 54,291
jointly controlled entities 70,046 - 1,112 - - - - - 71,158
Profit before taxation 168,547 79,482 48,154 33,894 7,143 (18,262) 16,368 - 335,326
Taxation (36,202) (13,295) (8,636) (5,979) (6,898) 2,156 (3,877) - (72,731)
Profit for the period 132,345 66,187 39,518 27,915 245 (16,106) 12,491 - 262,595
Non controlling interests (22,110) (547) (3,830) (472) - 1,147 (358) - (26,170)
Attributable to owners of the parent 110,235 65,640 35,688 27,443 245 (14,959) 12,133 - 236,425
RevenueProfit before
taxProfit after tax
Attributable to
owners of the
parent
RM'000 RM'000 RM'000 RM'000
BY GEOGRAPHICAL SEGMENTS
Malaysia 2,242,217 233,323 176,637 151,340
Singapore 171,468 78,799 74,955 74,935
China 112,471 (11,135) (11,039) (8,230)
India - (6,691) (6,690) (7,390)
Australia 57,208 18,834 10,739 6,508
Abu Dhabi 12,369 (2,409) (2,409) (1,409)
Other Countries 82,100 24,605 20,402 20,671
2,677,833 335,326 262,595 236,425
10

A9 Valuation of Property, Plant and Equipment and Investment Properties
A10 Material events
A11 Changes in the Composition of the Group
(a)
A12 Contingent Liabilities and Assets
Details of contingent liabilities of the Group as at the date of issue of the report are as follows:
30/9/2012 31/12/2011
RM'000 RM'000
Guarantees given to third parties in respect of contracts and trade
performance 3,050,514 2,275,002
There were no other material changes in contingent liabilities since the last annual reporting date.
There were no contingent assets.
A13 Commitments(a) Capital commitment not provided for in the financial year as at 30 September 2012 is as follows:
30/9/2012 31/12/2011
RM'000 RM'000
Amount authorised and contracted for 58,501 39,043
Amount authorised but not contracted for 1,065,153 1,094,913
1,123,654 1,133,956
on 12 July 2012, Sunway Global Limited, a subsidiary of Sunway Holdings Sdn Bhd which in turn is a
wholly-owned subsidiary of the Company, had entered into an Equity Sale and Purchase Agreement with
Mr. Yu De Mao ("Purchaser") for the disposal of 60% equity interest in Sunway GD Foundation
Engineering Co. Ltd ("Sunway GD") as well as its group of subsidiaries, to the Purchaser for a nominal
consideration after the Purchaser has discharged the liabilities of Sunway GD of RMB12,071,872 and
HKD35,850,430 in 6 instalments and all accrued interest over the liabilities up to the date of payment of
each of the instalments ("Liabilities"). The Proposed Disposal is conditional upon, amongst others, the
Purchaser having discharge the Liabilities within a period of 22 months from the payment of the first
instalment of the liabilities. Upon completion, Sunway GD and its group of subsidiaries will cease to
subsidiaries of the Company.
The Group adopts the fair value model for its investment properties. There is no significant and indicative
change in value of the said investment properties since the last balance sheet date.
There were no material events subsequent to the current quarter ended 30 September 2012.
The Group adopts the fair value model for its investment properties. There is no significant and indicative
change in value of the said investment properties since the last balance sheet date.
There were no material events subsequent to the current quarter ended 30 September 2012.
There were no material changes in the composition of the Group for the current quarter ended 30 September
2012 except for the following:
11

(b) Operating lease commitment not provided for in the financial year as at 30 September 2012 is as follows:
30/9/2012 31/12/2011
RM'000 RM'000
Future minimum lease payment:
- not later than 1 year 50,524 62,217
- later than 1 year and not later than 5 years 184,912 186,367
- later than 5 years 127,225 143,818
362,661 392,402
Future minimum lease receipts:
- not later than 1 year 47,352 29,753
- later than 1 year and not later than 5 years 245,975 126,863
- later than 5 years 140,199 323,313
433,526 479,929
B1 Review of Performance
For the quarter
The property development segment reported revenue of RM176.6 million and profit before tax of RM89.2
million in the current quarter as compared to revenue of RM229.6 million and profit before tax of RM61.6
million in the corresponding quarter in the previous financial year. The lower revenue recorded in the current
quarter was mainly due to lower sales achieved in Malaysia and China. Despite the lower revenue recorded in
the current quarter, profit before tax nevertheless increased by about 45% due to stronger profit recognition
from property developments in Malaysia and higher profit contribution from Australia and Singapore.
The property investment segment reported revenue of RM148.2 million and profit before tax of RM20.7 million
for the current quarter as compared to revenue of RM133.9 million and profit before tax of RM36.3 million in
the corresponding quarter in the previous financial year. The lower current quarter profit was mainly due to
higher interest costs incurred and provision of doubtful debts.
The construction segment registered revenue of RM267.3 million and profit before tax of RM19.4 million
during the current quarter as compared to revenue of RM305.1 million and profit before tax of RM24.4 million
in the corresponding quarter in the previous financial year. Besides the elimination of intra-group construction
billings mentioned earlier, there was also a corresponding elimination of intra-group construction profit
associated with the unsold development properties. The timing difference between recognition of construction
profit and the sale of the development properties would occur when in-house construction services are
deployed.
The Group recorded revenue of RM867.0 million and profit before tax of RM142.7 million (after excluding
unusual items as per Note A4) for the current quarter ended 30 September 2012 as compared to revenue of
RM934.0 million and profit before tax of RM115.5 million (see Note A4) for the corresponding quarter ended
30 September 2011. The lower Group's current quarter revenue was due to lower property sales and lower
construction turnover after the elimination of intra-group construction billings due to in-house construction
services deployed for some of the Group's property development projects. Notwithstanding this, the Group
managed to register a higher current quarter profit before tax. This was mainly contributed by the stronger
profit recognition from the property development segment.
12

For the 9 month period
The trading and manufacturing segment reported a current quarter revenue of RM143.3 million and profit
before tax of RM10.5 million as compared to the revenue of RM143.5 million and profit before tax of RM10.4
million in the corresponding quarter in the previous financial year. The performance of this segment was still
stable despite the challenging trading environment due to the economic uncertainty.
The property development segment reported revenue of RM525.4 million and profit before tax of RM168.5
million for the 9 month period ended September 2012 as compared to the revenue of RM669.3 million and
profit before tax of RM139.9 million reported for the 9 month period ended September 2011. The lower
revenue was mainly due to lower sales achieved in Malaysia and China. Although the current 9 month revenue
is lower, the profit before tax, nevertheless, increased by approximately 20% from the previous year
corresponding period. The better profit performance was mainly due to stronger profit recognition from
property developments in Malaysia and higher profit contribution from Singapore.
The property investment segment reported revenue of RM422.4 million and profit before tax of RM79.5 million
for the 9 month period ended September 2012 as compared to the revenue of RM359.3 million and profit
before tax of RM107.9 million reported for the 9 month period ended September 2011. The higher revenue
was mainly contributed by Sunway Putra Hotel which was acquired late last year. However, the profit before
tax was lower due to higher interest costs incurred and provision of doubtful debts.
The quarry segment reported a current quarter revenue of RM53.8 million and profit before tax of RM3.6
million as compared to revenue of RM47.5 million and profit before tax of RM3.4 million in the corresponding
quarter in the previous financial year. In tandem with the higher revenue reported this current quarter, the profit
before tax was also higher.
The other segment reported a current quarter revenue of RM77.3 million and profit before tax of RM6.2 million
as compared to revenue of RM74.4 million and loss before tax of RM6.9 million in the corresponding quarter in
the previous financial year. In the current quarter, the healthcare and building material units continued to
perform satisfactorily while the others also performed within expectation. The loss in the previous year
corresponding quarter was mainly due to the poor result in the building material unit.
The Group recorded revenue of RM2,677.8 million and profit before tax of RM335.3 million (after excluding
unusual items as per Note A4) for the current 9 months ended 30 September 2012 as compared to revenue of
RM2,770.3 million and profit before tax of RM304.1 million (see Note A4) for the corresponding 9 months
ended 30 September 2011 with major contribution from its property development, property investment and
construction segments.
The construction segment reported revenue of RM914.6 million and profit before tax of RM48.2 million for the
9 month period ended September 2012 as compared to the revenue of RM968.7 million and profit before tax
of RM60.3 million reported for the 9 month period ended September 2011. The lower revenue recorded for the
current 9 month period was due to slower progress billings and higher elimination of intra-group construction
billings. Besides the lower revenue, the current profit was also affected by the lower margin from some of the
local projects.
13
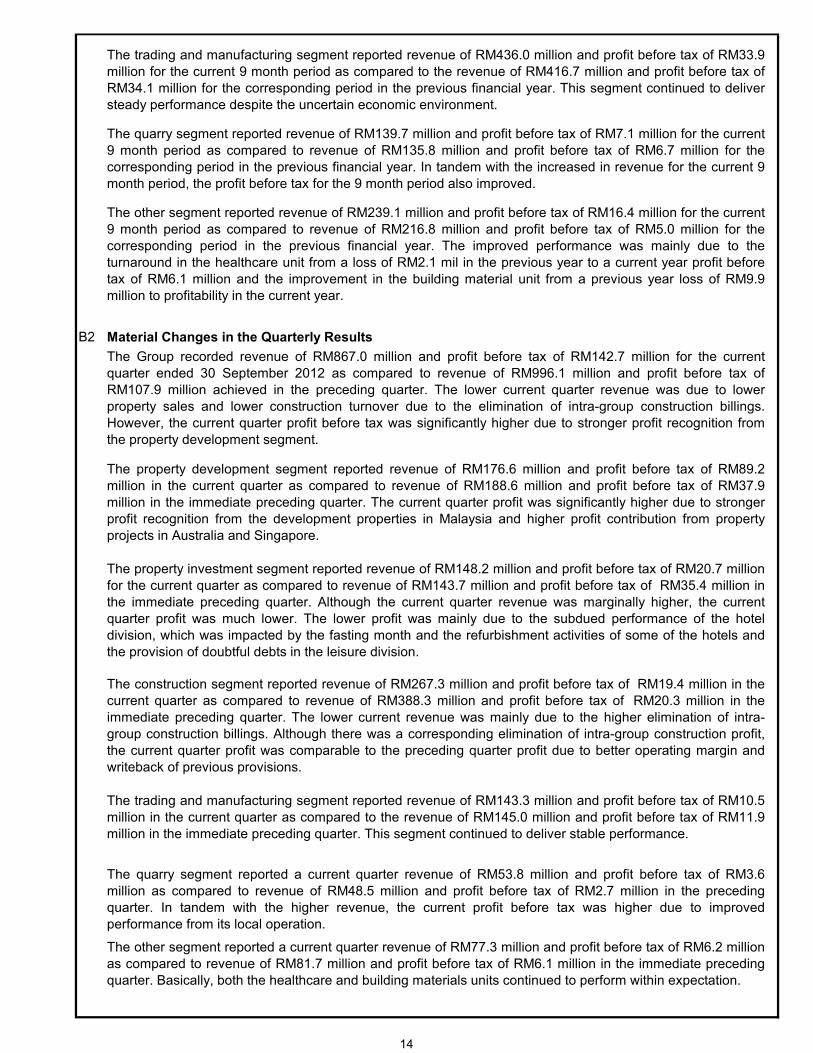
B2 Material Changes in the Quarterly Results
The quarry segment reported a current quarter revenue of RM53.8 million and profit before tax of RM3.6
million as compared to revenue of RM48.5 million and profit before tax of RM2.7 million in the preceding
quarter. In tandem with the higher revenue, the current profit before tax was higher due to improved
performance from its local operation.
The other segment reported a current quarter revenue of RM77.3 million and profit before tax of RM6.2 million
as compared to revenue of RM81.7 million and profit before tax of RM6.1 million in the immediate preceding
quarter. Basically, both the healthcare and building materials units continued to perform within expectation.
The trading and manufacturing segment reported revenue of RM143.3 million and profit before tax of RM10.5
million in the current quarter as compared to the revenue of RM145.0 million and profit before tax of RM11.9
million in the immediate preceding quarter. This segment continued to deliver stable performance.
The quarry segment reported revenue of RM139.7 million and profit before tax of RM7.1 million for the current
9 month period as compared to revenue of RM135.8 million and profit before tax of RM6.7 million for the
corresponding period in the previous financial year. In tandem with the increased in revenue for the current 9
month period, the profit before tax for the 9 month period also improved.
The other segment reported revenue of RM239.1 million and profit before tax of RM16.4 million for the current
9 month period as compared to revenue of RM216.8 million and profit before tax of RM5.0 million for the
corresponding period in the previous financial year. The improved performance was mainly due to the
turnaround in the healthcare unit from a loss of RM2.1 mil in the previous year to a current year profit before
tax of RM6.1 million and the improvement in the building material unit from a previous year loss of RM9.9
million to profitability in the current year.
The property investment segment reported revenue of RM148.2 million and profit before tax of RM20.7 million
for the current quarter as compared to revenue of RM143.7 million and profit before tax of RM35.4 million in
the immediate preceding quarter. Although the current quarter revenue was marginally higher, the current
quarter profit was much lower. The lower profit was mainly due to the subdued performance of the hotel
division, which was impacted by the fasting month and the refurbishment activities of some of the hotels and
the provision of doubtful debts in the leisure division.
The construction segment reported revenue of RM267.3 million and profit before tax of RM19.4 million in the
current quarter as compared to revenue of RM388.3 million and profit before tax of RM20.3 million in the
immediate preceding quarter. The lower current revenue was mainly due to the higher elimination of intra-
group construction billings. Although there was a corresponding elimination of intra-group construction profit,
the current quarter profit was comparable to the preceding quarter profit due to better operating margin and
writeback of previous provisions.
The Group recorded revenue of RM867.0 million and profit before tax of RM142.7 million for the current
quarter ended 30 September 2012 as compared to revenue of RM996.1 million and profit before tax of
RM107.9 million achieved in the preceding quarter. The lower current quarter revenue was due to lower
property sales and lower construction turnover due to the elimination of intra-group construction billings.
However, the current quarter profit before tax was significantly higher due to stronger profit recognition from
the property development segment.
The trading and manufacturing segment reported revenue of RM436.0 million and profit before tax of RM33.9
million for the current 9 month period as compared to the revenue of RM416.7 million and profit before tax of
RM34.1 million for the corresponding period in the previous financial year. This segment continued to deliver
steady performance despite the uncertain economic environment.
The property development segment reported revenue of RM176.6 million and profit before tax of RM89.2
million in the current quarter as compared to revenue of RM188.6 million and profit before tax of RM37.9
million in the immediate preceding quarter. The current quarter profit was significantly higher due to stronger
profit recognition from the development properties in Malaysia and higher profit contribution from property
projects in Australia and Singapore.
14

B3 Prospects
B4 Variance of Actual Profit from Profit Forecast
B5 Taxation
(a)
(b)
Current Quarter Cumulative
Ended Year To Date
30/9/2012 30/9/2012
RM'000 RM'000
Current taxation (32,097) (80,422)
Deferred taxation (302) (812)
(32,399) (81,234)
The Company did not issue any profit forecast or profit guarantee during the current year under review.
the utilisation of unutilised capital allowances of certain subsidiaries of the Group.
Notwithstanding the challenges ahead, the Group's performance for the last quarter of this year is expected to
be satisfactory. Such expectation is underpinned by its healthy unbilled property sales of RM2.3 billion and
construction total order book of RM3.2 billion.
The effective tax rate for the current quarter is 22.7%. The lower effective tax rate was mainly due to the
following:
Although the Malaysian economy managed to grow at a moderate pace of between 4% to 5% this year, the
business environment will continue to remain challenging in view of the economic difficulties currently faced by
most of the advanced economies which could dampen future growth. In view of such concern, the Group will
continue to strengthen its resilience by pursuing further synergistic collaboration between its construction and
property divisions to improve the cost structure and operational efficiencies.
the recognition of share of profit from certain jointly controlled entities which shares result on a profit after
tax basis; and
15
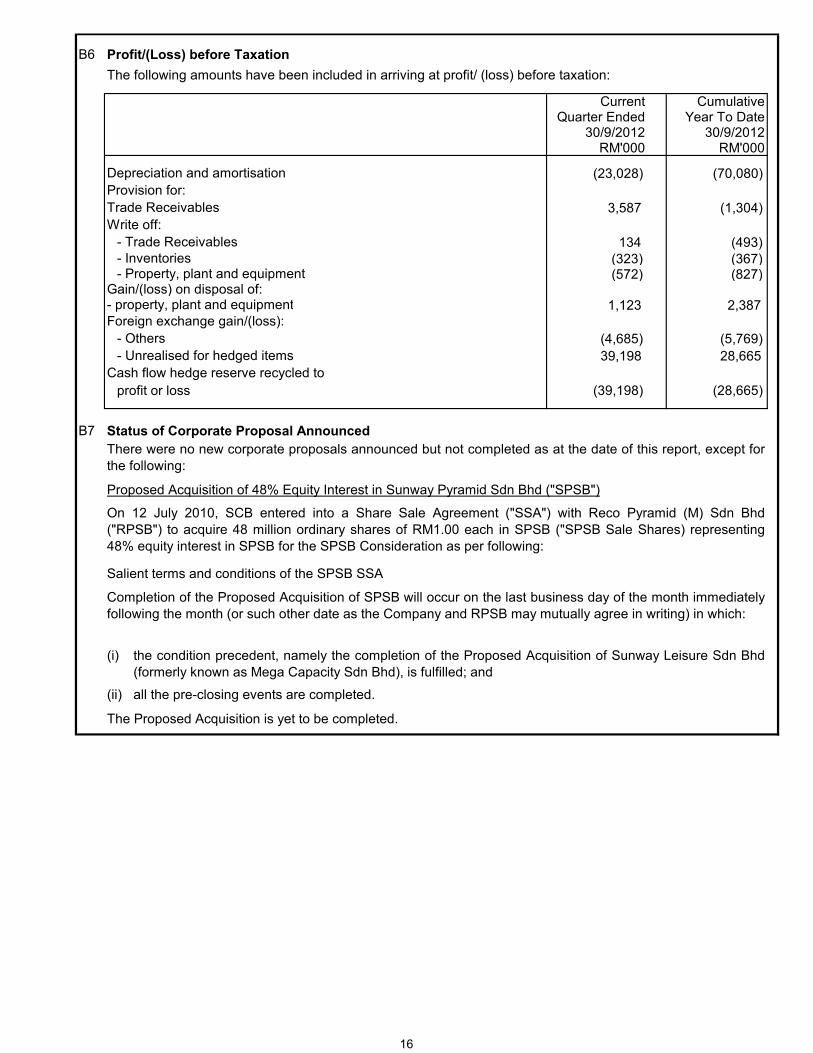
B6 Profit/(Loss) before Taxation
Current Cumulative Quarter Ended Year To Date
30/9/2012 30/9/2012RM'000 RM'000
(23,028) (70,080)
3,587 (1,304)
134 (493)
(323) (367) (572) (827)
1,123 2,387
(4,685) (5,769)
39,198 28,665
profit or loss (39,198) (28,665)
B7 Status of Corporate Proposal Announced
(i)
(ii)
Completion of the Proposed Acquisition of SPSB will occur on the last business day of the month immediately
following the month (or such other date as the Company and RPSB may mutually agree in writing) in which:
the condition precedent, namely the completion of the Proposed Acquisition of Sunway Leisure Sdn Bhd
(formerly known as Mega Capacity Sdn Bhd), is fulfilled; and
all the pre-closing events are completed.
The Proposed Acquisition is yet to be completed.
Cash flow hedge reserve recycled to
There were no new corporate proposals announced but not completed as at the date of this report, except for
the following:
Proposed Acquisition of 48% Equity Interest in Sunway Pyramid Sdn Bhd ("SPSB")
On 12 July 2010, SCB entered into a Share Sale Agreement ("SSA") with Reco Pyramid (M) Sdn Bhd
("RPSB") to acquire 48 million ordinary shares of RM1.00 each in SPSB ("SPSB Sale Shares) representing
48% equity interest in SPSB for the SPSB Consideration as per following:
Salient terms and conditions of the SPSB SSA
- property, plant and equipment
Foreign exchange gain/(loss):
- Others
- Unrealised for hedged items
Write off:
- Trade Receivables
- Inventories- Property, plant and equipment
Gain/(loss) on disposal of:
Provision for:
Trade Receivables
The following amounts have been included in arriving at profit/ (loss) before taxation:
Depreciation and amortisation
16

1
2
3
4
B8 Group Borrowings and Debt Securities
The Group borrowings as at 30 September 2012 are as follows:
Secured Total
RM'000 RM'000
Borrowings:
- Current 375,573 226,823 602,396
- Non-current 1,584,486 417,433 2,001,919
1,960,059 644,256 2,604,315
Included in the above are borrowings which are denominated in a foreign currency as follows:
Secured Current Non-current Current Non-current
US Dollar (USD’000) - 330,000 - 1,015,410
Singapore Dollar (SGD’000) 10,539 12,772 26,385 31,975
Trinidad & Tobago Dollar (TTD’000) 8,940 - 4,333 -
Chinese Renminbi (RMB’000) 56,860 69,908 27,856 34,248
Indonesian Rupiah (RP’000) 12,242,630 - 3,942 -
Australia Dollar (AUD’000) 1,670 50 5,326 159
Unsecured
Singapore Dollar (SGD’000) 4,877 68 12,208 170
Unsecured
RM'000
RM'000
The proposals are conditional upon the following approvals being obtained:
the approval or no objection from the state authority for the transfer of the SunMed Property from SMC to
the Trustee and for the lease of the SunMed Property by the Trustee to SMC;
Foreign currency
Proposed Disposal by Sunway Medical Centre Berhad ("SMC")
RHB Investment Bank Berhad, on behalf of the Board of Directors, announced that SMC, a subsidiary of the
Company had on 9 October 2012 entered into a conditional sale and purchase agreement with OSK Trustee
Berhad ("Trustee"), the trustee of Sunway Real Estate Investment Trust ("Sunway REIT"), for the disposal of
the land and building of SMC together with SMC's plant and machinery, services infrastructure and all fixtures
and fittings affixed or located or used in SMC ("SunMed Property") for a total cash consideration of RM310
million.
In addition, SMC had on even date entered into a conditional hospital master lease agreement with the
Trustee and Sunway REIT Management Sdn Bhd, the manager of Sunway REIT, for the lease of the SunMed
Property from the Trustee.
the Securities Commission Malaysia for the valuation of the SunMed Property;
the unitholders of Sunway REIT for the Proposed Disposal at the unitholders' meeting to be convened;
and
any other relevant authority and/or party, if required.
17

B9 Derivative Financial InstrumentsThe Group's outstanding derivatives as at 30 September 2012 were as follows:
Type of Derivatives Contract/ Fair Gains/(Losses) Notional Value Fair Value
for the periodRM'000 RM'000 RM'000
Foreign currency forward contracts
- Less than 1 year 15,638 (215) (200)
Interest rate swap contracts
- Less than 1 year 100,000 (248)
- 1 year to 3 year 21,816 (261)
121,816 (509) 311
Total losses on derivatives as per Note A4 110
Cross currency swap contracts
- 1 year to 3 year 996,693 12,741 7,807
Total derivatives 12,017 7,917
Foreign currency forward contracts
Interest rate swap contracts
Cross currency swap contracts
The Group entered into interest rate swap contracts to manage its interest rate risk arising primarily from
interest-bearing borrowings. Borrowings at floating rate expose the Group to fair value interest rates and the
hedging contract minimises the fluctuation of cash flow due to changes in the market interest rates. The above
interest rate hedging contracts are executed with credit-worthy financial institutions which are governed by
appropriate policies and procedures.
The derivatives arising from the interest rate swap contracts are computed using the present value of the
difference between the floating rates and fixed rates applied to the principal amounts over the duration of swap
expiring subsequent to period end. Any changes in fair value of derivatives during the period are taken directly
to the income statement.
The Group entered into cross currency swap contracts to manage its exposure in foreign currency risk arising
from foreign currency borrowings which was entered to minimise the interest cost . The Group uses cash flow
hedges to mitigate the risk of variability of future cash flows attributable to foreign currency and interest rate
fluctuations over the hedging period on the foreign currency borrowings. Where a cash flow hedge qualifies for
hedge accounting, the effective portion of gains or losses on remeasuring the fair value of the hedging
instrument are recognised directly in other comprehensive income until such time as the hedged item affects
profit or loss, then the gains or losses are transferred to the income statement. Gains or losses on any portion
of the hedge determined to be ineffective are recognised immediately in the income statement.
The derivatives arising from the foreign currency forward contracts are stated at fair value, using the prevailing
market rates. Derivatives with positive market values are included under current assets and derivatives with
negative market values are included under current liabilities. Any changes in fair value of derivatives during
the period are taken directly to the income statement.
The Group entered into foreign currency forward contracts to minimise its exposure to foreign currency risks
as a results of transactions denominated in currencies other than its functional currency, arising from normal
business activities. These are done in accordance with the Group's foreign currency hedging policy and are
executed with credit-worthy financial institutions which are governed by appropriate policies and procedures.
18
B10 Changes in Material Litigation
(a)
(b)
The Directors are of the opinion, after taking appropriate legal advice, that no provisions for the
abovementioned claims is necessary.
On 4 September 2008, the solicitors of Sunway Construction Sdn Bhd (“SunCon”) had been served with a
Statement of Claim (“Statement of Claim”) by Shristi Infrastructure Development Corporation Ltd
(“Claimant”). The Statement of Claim was received by SunCon’s office in Malaysia on 8 September 2008.
Pursuant to an agreement signed between SunCon and the National Highway Authority of India for the
rehabilitation and upgrading of NH-25 to a four-lane configuration in the state of Uttar Pradesh being a
part of the East-West Corridor Project, SunCon had entered into a work order with the Claimant for the
upgrading and rehabilitation of the stretch of NH-25 from 143.6 km to 170.0 km, of which the Claimant has
provided two bank guarantees (“Bank Guarantees”) to SunCon.
The Claimant has failed to carry out its obligations under the work order and SunCon has terminated the
work order and cashed the Bank Guarantees. The Claimant had filed an application in the Supreme
Court of India for the appointment of an arbitrator to arbitrate upon the disputes between the parties. The
Supreme Court had appointed a sole arbitrator and two preliminary sittings have been held to date. The
Claimant then filed its Statement of Claim on 4 September 2008.
The Statement of Claim was raised in respect of various claims (including claiming the refund of the
amount cashed on the Bank Guarantees) and the total amount claimed is Rs891.5 million (approximately
equivalent to RM70 million).
Except for the following claims, there was no pending material litigation.
A suit was filed by Affin Bank Berhad (“Affin”) against, inter alia, Yap Yee Ping and Ng Kam Hung
(“Plaintiffs”) for payment of an amount of RM27.7 million and/or any other amount to Affin. The Plaintiffs
are seeking, inter alia, certain declarations and also an order that SunwayMas Sdn Bhd (“SunwayMas”), a
wholly-owned subsidiary of the Group, indemnifies the Plaintiffs for all claims brought against them by
Affin in relation to a tripartite agreement executed amongst Cindai Unggul Sdn Bhd (“Employer”),
SunwayMas and BSN Commercial Bank Bhd (now vested in Affin) on 2 May 2000. SunwayMas was
appointed as a Project Manager to revive, manage and coordinate the development and construction of
the Employer on a piece of land in the Mukim of Pulai, District of Johor Bahru, Johor.
Arising from this suit, the Plaintiffs have filed a counterclaim action against Affin and SunwayMas as the
second defendant on 9 May 2008. SunwayMas intended to defend this counterclaim and on the advice of
their solicitors, an application to strike out the counter claim against SunwayMas was filed on on 4
December 2008. The application was heard and disposed of on 5.2.2010 wherein the counterclaim
against SunwayMas was struck out with costs. The Plaintiffs filed an appeal against the decision on 2
March 2010. The Court of Appeal had dismissed with costs the appeal filed by the Plantiffs. The Court of
Appeal did not grant any leave to the Plaintiffs to appeal to the Federal Court.
19

(i)
(ii)
(iii)
Hearings on 7 September 2012, 11 to 12 September 2012, 22 October 2012, 25 to 26 October 2012 were
held while hearings on 6 September 2012 and 31 October 2012 were vacated. The next hearing dates are
fixed from 3 to 6 December 2012.
At the hearing on 2 February 2009, the arbitrator recorded SunCon’s filing of the Statement of Defence
and Counterclaim. In the counterclaim, SunCon is seeking for Rs78,13,94,628.61 (approximately
equivalent to RM60 million) for inter alia, additional costs incurred by SunCon to complete the works,
recovery of mobilisation advance and interest charges, loss of reputation and loss of profits.
On 5 January 2011, Shristi did not produce its Witness Statement and has been directed to file it by 7
February 2011. The hearing was then adjourned to 11 March 2011 for compliance and finalizing the
bundles, etc. The cross examination dates are 28 and 29 March 2011, to be followed on 11 and 12 April
2011. Shristi has to submit a statement of its assets as at 31 December 2010 supported by an affidavit
before the next date of the hearing.
On 28 March 2011, the Arbitrator had directed the following:
Admission or denial by Shristi or SunCon of each other’s documents to be completed by 4 April
2011.
Further documents to be filed by both parties by 12 April 2011.
On the 12 April 2011 hearing, both sides were allowed to file further documents, if any, within the next 3
weeks, as the final submission. The next hearing date was 16 May 2011 for noting compliance of
directions and thereafter, cross-examination of their first witness was on 1 and 2 July 2011. However,
Shristi and their solicitor did not show up for the hearing on 1 July 2011 but they showed up for the
hearing on 28 and 29 July 2011. The hearing continued on 15 and 16 September 2011 and 20 September
2011 for the cross examination of Shristi's 1stwitness. The hearings scheduled in October and November
2011 was subsequently postponed to 13 till 15 December 2011 and was duly held. The procedural
hearing was held on 5 December 2011 for noting compliance and subsequent hearings were held on 15
and 16 February 2012.
On 9 May 2012, the Arbitrator held a further procedural hearing. Further hearings were held on 10, 12, 24
to 25 July 2012 and 7 August 2012. The hearings scheduled for 13 July 2012, 8 and 22 August 2012 were
cancelled.
The Directors are of the opinion, after taking appropriate legal advice, that no provision for the
abovementioned claims is necessary.
List of witnesses and Supplemental Affidavit to be filed by Shristi by 12 April 2011 and Shristi’s
witness to be present on 12 April 2011.
20

B11 Realised and Unrealised Profits
30/9/2012 30/9/2011
RM'000 RM'000
Total retained profit of the Group:-
Realised 302,965 203,764
Unrealised 35,818 -
Total share of retained profits from associated companies:
Realised 46,183 33,111
Unrealised 168,348 41,665
Total share of retained profits from Jointly Controlled Entities:
Realised 169,108 92,902
Unrealised - -
Less: Consolidation adjustments 26,064 (161,736)
Total Group's retained profits as per consolidated accounts 748,487 209,706
B12 Dividend
B13 Earnings per share
Cumulative
Year To Date
30/9/2012
RM'000
Basic earnings per share
Profit attributable to members of the Company 94,273 313,055
Weighted Average Number of Ordinary Shares 1,292,505 1,292,505
Earnings per share ( Basic ) (sen) 7.29 24.22
Diluted earnings per share
Profit attributable to members of the Company 94,273 313,055
Weighted Average Number of Ordinary Shares 1,292,505 1,292,505
Earnings per share ( Diluted ) (sen) 7.29 24.22
By Order of the Board
Tan Kim AunLee Suan Choo
Secretaries
The disclosure of realised and unrealised profits above is solely for complying with the disclosure
requirements stipulated in the directive of Bursa Malaysia and should not be applied for any other purposes.
RM'000
30/9/2012
Ended
Current Quarter
No dividend has been proposed by the Board of Directors for the financial period ended 30 September 2012.
The calculation of the earnings per share for the Group is based on profit after taxation and non-controlling
interests on the weighted average number of ordinary shares in issue during the period.
The breakdown of retained profits of the Group as at the reporting date, into realised and unrealised profits are
as follows:
21