sunshine beach state high school queensland state … · queensland state school reporting 2014...
TRANSCRIPT

Sunshine Beach State High School Queensland State School Reporting 2014 School Annual Report
Postal address 45 Ben Lexcen Drive Sunshine Beach 4567
Phone (07) 5440 4222
Fax (07) 5440 4200
Email [email protected]
Webpages Additional reporting information pertaining to Queensland state schools is located on the My School website and the Queensland Government data website.
Contact person [email protected]
Principal’s foreword
Introduction
Our school’s success stories continue to be celebrated and respected amongst the community. We continue to build on the foundations of an established quality school, whilst embracing innovation and growth in teaching and learning. Our key driver is to improve the performance and outcomes for each individual child and the school as a whole. Some of our highlights of 2014 at Sunshine Beach SHS included:
NSSCF and school funded roll out of over 1000 lap top devices with 94% take home (Years 9-12)
Development of unique Junior Secondary precinct that is owned and understood
QSR - Strategic Development Plans for the next four years created and supported by staff teams
Action planning in response to Teaching & Learning Audit, review of reflections to audit
Academic standard and high expectations strengthened and improved in 2014
Immersed all staff in ASOT pedagogical framework across school
Deepening understanding and teaching & learning skills around Marzano and Hattie research
Year 12 graduates all received an OP or a Vocational Certificate and/or a QCE (unless exceptional circumstances) – 100%
Number of students OP 1-15 steady at 74%
With over 70 participants, school-based traineeships/apprenticeships maintained partnership strength in 2014
Eisteddfod and Fanfare participation and Excellence results further enhance Music "School of Excellence" status
Development and implementation of ACARA
Student Resources Scheme extended to enhance software to meet digital transition
Continued ICT developments result in increased access for all students and digital learning relevant to 21st century learners – over 1000 devices/laptop, trolleys, Netbooks, IPads, Apple Macs, E-Learning and BYO introduction
Computers for Teachers – C4T and ICT Certificates awarded to almost 100% staff and applied to teaching & learning
Plan for BYOD Junior Secondary
Wireless connectivity to whole school
Enhanced band width to support learning demands
Sporting results reaffirmed high order student performances at Regional, State and National level – particularly water polo, surfing and triathlon
International Student Program numbers flourishing, approximately 55 students from abroad, and a short stay Japanese visit
Extension of Italian Cividale partnership with teacher and student exchange
Successful partnership created for all faculties through Rotary, RSL, Lions, United Synergies
Italian scholarships extended and International learning experiences with overseas excursion
P&C proactively profiling our school within community
Expansion of Scholarship Program across primary school sector
Strong partnership and teaching & learning with primary feeder schools
Quality transition programs with feeder schools
Scheduled rolling plan for refurbishment
Scheduled upgrades of facilities
Strengthened partnership with feeder primary schools to support transition to Junior Secondary
Focus on profile and marketing “the best” state school has to offer
Implementation of Enrolment Management Plan in August 2014
Responsible Behaviour Plan reviewed
Extension of Junior Secondary curriculum and team development
Development of P&C subcommittees for Canteen review

E-Learning and online learning extended with hardware access
Modification of flexible learning to the Resource Centre
Strengthening of staff leadership and empowerment through Collaborative Councils
Mentoring/coaching programs building depth and sustainability in teacher growth
Effective and efficient use of GSGR money to enhance staff performance to then share with students
School progress towards its goals in 2014
2010 began the implementation of our Quadrennial Review - our Strategic Plan for the next 4 years. This plan was developed through consultation with staff, students and a small band of dedicated parent supporters.
Future outlook
Our key imperative – high performance through teaching & learning focus – included three strategic imperatives:
schoolwide pedagogy (ASOT);
data informed classrooms; and
developing performance frameworks/pedagogy. During 2015, our school will focus on the following strategic imperatives:
Develop and implement our Quadrennial School Review (2014-2018) and 2014 T&L Audit Action Plan
Consolidating plans for Year 7/8 2015
Improved literacy and numeracy performance across all KLAs (including NAPLAN)
Focus on upper 2 bands
Implementation of C2C
Depth of data informed classroom and use to create constructive feedback loops at all layers of organisation
ASOT rollout, and deep training and application of whole school pedagogical approach – Orange Days
Collaborative Councils to support growth development and ownership of school evolution
School Curriculum Plans incorporating Literacy, Numeracy, ICT Plans, Professional Development and pedagogical frame, Data Plan
Roll out of 400 more tablet devices to Years 7 & 8
Embracing BYOD project
Faculty Operational Plans that align Whole School Operational Plan
Design of sustainable timetable to meet system and student changing needs
Creating a management structure that meets needs of Years 7 to 12
Maximize number of seniors receiving an OP (0-15) and/or Vocational Education and Training certification or QCE
Use of GSGR money to enable to project growth in teachers, teaching teams and lead teachers (mentors/coaches)
Further development of ICT hardware, software peripherals and integration of ICT into teaching and learning
Strengthen partnerships with primary feeders as we consolidate our Year 7 Junior Secondary framework
24/7 access to learning
Training and development in Restorative Practices to influence PLB
Review, refine and training in PLB (SWPBS)
Support teacher development of ICT focussed on collaborative sharing community
Trial of different digital learning devices as they evolve (BYO)
Substantial financial planning for ICT hardware replacement or BYO
Develop and implement facility & refurbishment long term as population grows and meet needs Years 7 to 12
Maintain and increase market share promoting successes and innovations
Encourage extra curricula activities such as Duke of Edinburgh
Maintain/strengthen successful International Program
Improved community participation and networks e.g. United Synergies, Salvation Army
Enhanced links with our primary school feeders to maximize student outcomes and improve transition of key learning junctures
Implementation of OneSchool & school management systems that support also QApp
Performance Framework developed and utilised – aspirant focus
Strengthen partnership with newly formed Noosa Council, universities, TAFEs, private providers
SMS text messaging absence
App & email application to communicate effectively and in a timely manner with parents
Development of programs, policies and systems to ensure 712 school Strengthen student leadership and student ‘voice’ Introducing an academic excellence program in 2016 to capture high performing students from feeder schools Introduce a mother/father group to deepen and strengthen community Introduction of Facebook to enhance communication links with community and celebrate success

Our school at a glance
School Profile
Coeducational or single sex: Coeducational
Year levels offered in 2014: Year 8 - Year 12
Total student enrolments for this school:
Total Girls Boys
Enrolment Continuity
(Feb – Nov)
2012 1049 572 477 89%
2013 1042 563 479 88%
2014 1109 587 522 87%
Student counts are based on the Census (August) enrolment collection.
Characteristics of the student body:
Our student body is characterised by students from a range of socio-economic demographics. The majority of our students live within a 15/20 km radius and are supported by a well serviced bus transport system. The school has a defined boundary (EMP) which feeds into the school. Our school supports 2.67% English as a Second Language and 2.14% identified Indigenous students. Also, within this favourable northern Sunshine Coast beach location and destination, we support an array of students from international and interstate origin. We offer an International Student Program that is comprised of about 55 students who study with us from 6 months to 2 years. They are from destinations such as Germany, Italy, Sweden, Brazil, Chile, Japan and Taiwan. This international composition generates an extension of learning academically, culturally and socially for our whole learning community. We operate a Student Services centre that incorporates “Learning Support” student needs, School Nurse, Chaplain, Behaviour Management specialists and community partnerships. This faculty extends also to support 6 Heads of Year who engage in support and direction of a whole year level (well-being ’ness’). Further, we host a Special Learning Centre that provides for the needs of approximately 65 Special Education students, those who are intellectually and physically impaired. The Centre provides specialist staff and facilities to extend learning opportunities for students’ specific and individual needs. In 2014, our key strategic priorities focussed on students:
commitment to school Vision and Values
alignment of curriculum with system and school priorities
improved performance for all students
“Every Day Counts” focus - attendance
enhancing digital 21st century learning
wellbeing through quality support services
high quality utilisation of resources and improved sustainability
high quality communication networks and systems with students, staff, parents and community
celebrating our success with our community
continue to maintain multiple pathways and diverse learning experiences.
Average class sizes
Phase
Average Class Size
2012 2013 2014
Year 7 Secondary – Year 10 23 22 23
Year 11 – Year 12 20 20 20

School Disciplinary Absences
# Exclusion is an abbreviated title which reflects suspensions with recommendations for exclusion, which may result in an exclusion or be set aside through
an appeals process.
* Caution should be used when comparing 2014 data with previous years SDA data as amendments to the disciplinary provisions in the Education (General
Provisions) Act 2006, passed in late 2013, created a time series break.
Curriculum offerings
Our distinctive curriculum offerings
As identified throughout the website, our Junior Secondary Learning (Year 7/8/9) is based upon the ACARA, C2C & QCARF - Queensland Curriculum, Assessment & Reporting Framework. It features:
guidelines as indicated by ACARA, QCAA, AQTF
development of creative thinking skills, self-directed learning, innovation and collaboration
a timetable based on 6 subjects per semester – with English, Mathematics, Science, Social Science & HPE as core (in Year 7-9/10); then in Year 11-12 English/Maths core and four electives
the integration of information communication technologies
delayed specialisation and experiential learning
additional time for specific literacy and numeracy learning Our Senior Phase of Learning begins in Semester 2 of Year 10 with the development of learning in senior preparatory courses of study. Our studies include a diverse range of Authority and Non-Authority subjects. We aim to embrace the needs of OP eligible and non-OP eligible students, along with transition to workforce, TAFE courses and Certificate level courses (Certificate I – III) on-line virtual programs. Flexible learning opportunities are devised to cater for individuals. In the Senior Phase, we provide numerous learning opportunities for students to research and establish goals that are relevant to their chosen pathways. Set Plan interviews, Guidance Officer interviews, Subject Evenings, Specialist talks, one-to-one goal setting and mentor groups aim to make the transition to the Senior Phase of learning relevant to individual Senior students. Our school offers many Authority and non-Authority registered subjects. We offer a large cross-section of Certificate courses e.g. Certificate III Children’s Services, Certificate II Retail (on-line), Certificate II & III Visual Arts, Certificate II Hospitality, Certificate III Aged Care, Certificate III Education Support, Certificate III Fitness, Fashion Studies and further specialist Authority subjects in Music Extension, Excellence in Surfing, and Italian. Further, we encourage traineeships and scholarships with the support of a SAT officer. To provide relevant and "real" learning experiences to our student population, we have evolved a student and staff services structure that "cares" for the individual. Our Responsible Behaviour Plan focuses on responsibility and ownership of behaviours. We embrace clear and frequent communication to support productive outcomes for students. A “no blame” culture and restorative practices support the development of life-long skills for students. We create a number of programs across our school community that assist in the development of the whole "individual" e.g. Rock & Water, Shine, Big Wednesday. Further to support the growth of the 21st Century learner and worker, we have an International Program that promotes an understanding and appreciation of other cultures. This International Program not only strengthens students’ awareness and empathy, it also contributes to the further internationalisation of our workforce, and an acceptance of the global economy.
Extra curricula activities
Our school features one of the strongest music programs on the Sunshine Coast that embraces Choir, Stage & Concert Bands, Percussion Ensembles and String Orchestra. We also have individual involved in writing, playing and recording individual music.
A strong and well represented Student Council structure enables "voices” of student population.
Learning community provides a cross-section of flexible opportunities - accelerated programs including University Headstart, extension programs, debating, youth speaks, creative writing, performance – dance/cheerleading, traineeships, apprenticeships’ mentoring, Indigenous program.
Our students participate in a wide array of sports – including Water Polo, Royal Lifesaving, Rowing, Rugby Union, Netball, Athletics, Surfing and AFL Football (and any other opportunities as they arise).
To extend the learning potential and support of our senior students, we offer numerous after-school tutorial sessions: Study Club, Maths, English, Humanities, Art, Drama, Physics, Chemistry, Marine Studies & Biology.
Cheerleading
Drama Evenings
Duke of Edinburgh Bridge Program
Disciplinary Absences
Count of Incidents
2012 2013 2014*
Short Suspensions - 1 to 5 days 82 87 114
Long Suspensions - 6 to 20 days 14 17 2
Exclusions# 7 1 9
Cancellations of Enrolment 1 3 2

How Information and Communication Technologies are used to assist learning
A quickly evolving feature of our curriculum delivery is the integration of ICTs in the day to day teaching and learning program. All teachers have their own laptop. There is an extensive program of professional development and learning to enhance student outcomes. Our school is very keen to apply these digital skills to support our students in the global economy, whilst embracing 21
st Century
learning and working skills. We have a wireless network throughout the whole school. Also the school is continually extending the suite of new software packages and learning centres to extend the education process. Data projectors, trials of Apple Macs, Netbooks & IPod Touches, ICT peripherals and virtual classroom access are enabling our students to embrace 21st Century styles of learning. The hardware population has grown to 1000 devices, along with necessary connectivity and 1:1 personal learning for students from Year 9 to Year 12. More recently, the school has moved into the space of BYO devices to enhance individual choice and multi-modal learning.
Social Climate
Sunshine Beach State High School has a strong focus on student welfare. The school invests in 6 Heads of Year (key well-being, mentors/teacher leaders) who assist students to reach their potential. Further, there is a network of mentors, School Nurse, Chaplain, Learning Support teacher, Traineeship Officer and Liaison Officer-Sunshine Connect. This creates a network to ensure we focus on our school vision to provide a “supportive” school environment. This supportive focus is reflected in parental satisfaction in the 2012 School Opinion Survey where parents rated the school above other schools. Students and parents believe behaviour is managed well – above other state schools. Further, both parents and student believe that students are well cared for – 100%, noted by parent feedback in School Opinion Survey.
Parent, student and staff satisfaction with the school
Performance measure
Percentage of parent/caregivers who agree# that: 2012 2013 2014
their child is getting a good education at school (S2016) 100% 100% 95%
this is a good school (S2035) 100% 100% 94%
their child likes being at this school* (S2001) 100% 100% 97%
their child feels safe at this school* (S2002) 100% 100% 95%
their child's learning needs are being met at this school* (S2003) 100% 100% 93%
their child is making good progress at this school* (S2004) 100% 100% 94%
teachers at this school expect their child to do his or her best* (S2005) 100% 100% 99%
teachers at this school provide their child with useful feedback about his or her school work* (S2006)
100% 100% 95%
teachers at this school motivate their child to learn* (S2007) 100% 92% 94%
teachers at this school treat students fairly* (S2008) 89% 100% 90%
they can talk to their child's teachers about their concerns* (S2009) 100% 100% 91%
this school works with them to support their child's learning* (S2010) 100% 100% 91%
this school takes parents' opinions seriously* (S2011) 89% 100% 89%
student behaviour is well managed at this school* (S2012) 78% 82% 93%
this school looks for ways to improve* (S2013) 89% 100% 95%
this school is well maintained* (S2014) 89% 100% 98%

Performance measure
Percentage of students who agree# that: 2012 2013 2014
they are getting a good education at school (S2048) 88% 97% 94%
they like being at their school* (S2036) 92% 88% 84%
they feel safe at their school* (S2037) 91% 94% 88%
their teachers motivate them to learn* (S2038) 86% 93% 81%
their teachers expect them to do their best* (S2039) 97% 97% 98%
their teachers provide them with useful feedback about their school work* (S2040) 85% 92% 90%
teachers treat students fairly at their school* (S2041) 76% 86% 78%
they can talk to their teachers about their concerns* (S2042) 74% 86% 78%
their school takes students' opinions seriously* (S2043) 79% 85% 78%
student behaviour is well managed at their school* (S2044) 75% 78% 72%
their school looks for ways to improve* (S2045) 87% 92% 94%
their school is well maintained* (S2046) 88% 99% 93%
their school gives them opportunities to do interesting things* (S2047) 91% 89% 88%
Performance measure
Percentage of school staff who agree# that: 2012 2013 2014
they enjoy working at their school (S2069) 99% 94%
they feel that their school is a safe place in which to work (S2070) 99% 99%
they receive useful feedback about their work at their school (S2071) 93% 85%
students are encouraged to do their best at their school (S2072) 98% 99%
students are treated fairly at their school (S2073) 99% 94%
student behaviour is well managed at their school (S2074) 98% 86%
staff are well supported at their school (S2075) 91% 88%
their school takes staff opinions seriously (S2076) 89% 87%
their school looks for ways to improve (S2077) 100% 98%
their school is well maintained (S2078) 85% 97%
their school gives them opportunities to do interesting things (S2079) 94% 89%
* Nationally agreed student and parent/caregiver items were incorporated in the School Opinion Survey in 2012.
# ‘Agree’ represents the percentage of respondents who Somewhat Agree, Agree or Strongly Agree with the statement. Due to a major redevelopment of
the surveys (parent/caregiver and student in 2012; staff in 2013), comparisons with results from previous years are not recommended.
DW = Data withheld to ensure confidentiality.
Involving parents in their child’s education
As can be seen on our website, we have a P&C Committee of dedicated volunteers. This P&C employs personnel who operate our Canteen and Uniform Shop. The P&C Committee meets on a monthly basis and provides opportunities for discussion and the presentation of monthly reports. At these meetings, the P&C are always briefed about what has happened and is happening in the school. The P&C works closely with staff and students to ensure a true and valued partnership. We offer numerous partnerships to parents through The Learning Place, parent workshops, parent weekly emails and Facebook. We provide additional emails to parents from teachers to ensure learning partnerships e.g. homework, assignments.

Reducing the school’s environmental footprint
Data is sourced from school's annual utilities return and is reliant on the accuracy of these returns. Over the past few years, Sunshine Beach SHS has recognised the shift in energy supply to renewable sources and has taken advantage of the Solar & Energy Efficient Programs & the National Solar Schools Program in an effort to reduce energy consumption. Combined, these programs has seen the installation of solar panels in the Commerce building, in-line flow devices on taps, upgrade of urinal systems, 5 x water tanks and energy efficient lighting (28 watt lamps) throughout the school. Continued upgrades to infrastructure and encouraging behaviour change will assist in improvement to the school’s energy management.
Environmental footprint indicators
Years Electricity
kWh Water kL
2011-2012 406,144 14,092
2012-2013 375,044 11,542
2013-2014 383,080 52,722
The consumption data is compiled from sources including ERM, Ergon reports and utilities data entered into OneSchool by each school. The data provides an indication of the consumption trend in each of the utility categories which impact on the school’s environmental footprint.

Our staff profile
Staff composition, including Indigenous staff
2014 Workforce Composition Teaching Staff* Non-teaching
Staff Indigenous Staff
Headcounts 94 39 0
Full-time equivalents 88 30 0
Qualification of all teachers
Highest level of
attainment
Number of
Teaching Staff *
Certificate 0
Diploma 9
Advanced Diploma 0
Bachelor Degree 50
Graduate Diploma etc.** 27
Masters 8
Doctorate 0
Total 94
0
9
0
50
27
8
00
10
20
30
40
50
60
*Teaching staff includes School Leaders
**Graduate Diploma etc. includes Graduate Diploma, Bachelor Honours Degree, and Graduate Certificate.
Expenditure on and teacher participation in professional development
The total funds expended on teacher professional development in 2014 were $40,000.00
The major professional development initiatives are as follows:
Distressed or Deliberately Defiant?
Supporting Students to become Strategic Spellers
VET in Schools Meeting
North Zone District Sport Meeting
AVT:HI Conference
GO – ADFA - Networking
Panel Observers
Smart Science for Global Solutions
Introductory LEGo Education EV3 Hands-on Workshop
Mental Health & Wellbeing of Young People
Words at Work – Literacy Logistics Prep-12
The Seven Steps to Writing Success
Jnr Sec Numeracy
Developing Performance Framework
iPad Masterclass: Support for Older Students Struggling with Literacy in Secondary School
Leadership – Professional Reading
ISP Coordinators Meeting
Science HOD District Meeting
Australian Curriculum: Aligning the Learning Areas Mini Conference
Youth Sector Change Drivers Group
MOM Regional Moderation
Certificate 2 Aquatic Rescue Requalification

CDAA – “Where The Jobs Are”
QSS Sport Workshop
Research Methodology and Critical Frameworks – Master of Theatre Studies
QCS Success Workshop
Timetabling for Secondary Schools
Reporting Administrator Refresher Course
Thinking & Learning Conference
EduTech
S.O.S. Conference
Library Symposium
Teaching Literacy, Numeracy & ASoT Workshop
Business Program Writing
Robotics Workshop
Science HOD QSA workshop
Differentiating English Assessment
QCS Writing Task Workshop
ECTA Videoing. Reading the world: Intercultural understanding in the Australian Curriculum & EYLF by Alisa Cleary
Jnr Sec - Differentiation
Digital Practice Guide Professional Learning
Guidance PD & Networking Day
VET in Schools Forum
WISC IV Assessment Training
Parents as Career Transition Support (PACTS)
Finance Masterclass
CPR Update
CDAA Qld Division Sunshine Coast Career Practitioner Professional Development Day
PAT -R
ACER Presentation
QSA Moderation Meeting
BYOx Workshop
QSA Panel Chair Conference
Beginning Teachers Day
Drama Assessment Workshop
ASOT Training
Industry Currency
Leading Change Program
Year 11 Senior English Workshop
Assessment & Management of Non Suicidal Self Injury
GO Network Meeting
One School Finance
QCS Workshop
Unit Planning
Digital Differentiation for teachers
Focus Group - SRS
Quality Schools Inclusive Leaders (QSIL)
Timetabling and Branding – Junior Secondary
Powerful Futures
Panel – Health Training
ESCM – Facilitator Training
Year 7 unit planning
Nationally Consistent Collection of Data
Literacy workshop
Keeping HOP Alive – trauma & emotional wellbeing
Peter Sullivan (ACARS numeracy author)
Workshop T/Aides EB
Disability Policy Supporting Document
Panel Training Day
High Impact Instructional Leadership
Youth Sector Change Drivers Group (YSCDG) Forum
Career Voyage Accreditation
Development of PD for staff meetings and CCs for the implementation of ICTs for Differentiation
Cleaners Training
Development of E Learn Presentation for Region
Junior School Visioning
Orange Day – Curriculum Planning
One School Facilities Rollout
QSA Moderation Conference
Transport Assessors Procedure Changes
Reading – Core Yr 8 teachers
2014 Annual GTAQ Conference – Rising Tides: People, Places and Pedagogy
Coaching (Success)
BYOX PD for Region

State Panel Chair and District Review Panel Chair Training
B38 Ancient History Sunshine Coast Panel Training
Recreation Subject Area Syllabus 2014 Implementation workshop
Glogstar seminar for Year 9 students
2014 Qld School Surfing Titles
CTA State Moderation
Dance Panel Training
Profiling course with SUCCESS behaviour coach – Janet Thomson
Cognitive Coaching Training
District Verification for the Qld Certificate of Individual Achievement
Rugby Smart Course
Fashion SAS Workshop
Understanding the ALM role in the classroom
Classroom Profiling
Teacher Aide Conference ‘INSPIRE’ Lifelong Learners – Teacher Aide Conference
Visit Urangan SHS (Success team)
Profiling course with SUCCESS behaviour coach – Janet Thomson
SAS Early Childhood Studies implementation workshop
Junior Secondary Regional Conference
Positive Behaviour Management Seminar
IT Road Show
Jamie Oliver’s Ministry of Food
ASD Conference with Tony Attwood
Observational Rounds ‘SUCCESS’ team with Numeracy Working Party and Literacy Working Party
Suncoast Chairs Meeting
Qld School Sport - Triathlon
Auslan Voice Off Weekend
District Network Meeting - Sport
BSM Network Meeting
11 Senior Syllabus – moderation and unit planning
Tree Inspection
Success Day
Maroochydore SHS Visit
Pre Retirement Seminar
Presentation to UQ HMS Students
Yr 11 Health Marking Day
Senior SAS Development
Aldridge SHS Visit
Subject Area Specification Music Studies writing team
Careers Australia VET Expo
Practical Functional Behavioural Assessment Training
Smartskill VET in Qld Schools
Behaviour Management Review
Deaf History Workshop
Visual Art Panel Chair Consultations
QCAA State Review Panel Comparability Meeting
BCT Assessment Workshop
Presenting at IPL Centre, USC
Curriculum Data and Dashboard
Family Tour EQI International
ICP Planning Process
Advanced profiling course – Nicola Worthington & Janet Thomson
NAPLAN Higher-order questioning: reading test data
HOD Application Panel PE / Teaching & Learning
Sunshine Coast Student Futures Forum
Behaviour Success Team
CPR Update
Noosa Everglades – Assessing Suitability for International students
Dance Panel Chair Consultations
BSM- New Budget Planning Module
2014 QSSMG Planning Day
Sunshine Coast Regional Sport Board Meeting
Meeting ITS Panel Chair to discuss ITS R6
North Zone District Sport Meeting and Handover
Certificate IV in Information Technology Networking Gap Training
New Syllabus / Unit writing
Industry Consultation and Planning Day
ICP Inservice
Activating thinking with Mathematics
Child Protection Inservice
MS Queensland AGM and Conference
Auslan Assessment Tool Update

Program Writing for 2015
Sunshine Coast SOO Network Meeting
3D Printer workshop
Workplace Rehab Officer - Induction
Year 7/8 Pre-Induction for 2015 The proportion of the teaching staff involved in professional development activities during 2014 was 100%.
Average staff attendance 2012 2013 2014
Staff attendance for permanent and temporary staff and school leaders. 96% 96% 95%
Proportion of staff retained from the previous school year
From the end of the previous school year, 93% of staff was retained by the school for the entire 2014 school year.
School income broken down by funding source
School income broken down by funding source is available via the My School website at http://www.myschool.edu.au/.
To access our income details, click on the My School link above. You will then be taken to the My School website with the following ‘Find a school’ text box.
Where it says ‘Search by school name’, type in the name of the school you wish to view, and select <GO>. Read and follow the instructions on the next screen; you will be asked to accept the Terms of Use and Privacy Policy before being given access to the school’s My School entry webpage.
School financial information is available by selecting ‘School finances’ in the menu box in the top left corner of the school’s entry webpage. If you are unable to access the internet, please contact the school for a paper copy of income by funding source.

Performance of our students
Key student outcomes
Student attendance 2012 2013 2014
The overall attendance rate for the students at this school (shown as a percentage). 91% 89% 89%
The overall attendance rate in 2014 for all Queensland Secondary schools was 89%.
Student attendance rate for each year level (shown as a percentage)
Year 1 Year 2 Year 3 Year 4 Year 5 Year 6 Year 7 Year 8 Year 9 Year 10
Year 11
Year 12
2012 93% 92% 90% 90% 90%
2013 93% 90% 89% 87% 87%
2014 91% 90% 87% 88% 87%
DW = Data withheld to ensure confidentiality.
Student attendance distribution
The proportions of students by attendance range.
*The method for calculating attendance changed in 2013 – care should be taken when comparing data after 2012 to that of previous years.
Description of how non-attendance is managed by the school
Non-attendance is managed in state schools in line with the DET policies, SMS-PR-029: Managing Student Absences and SMS-PR-036: Roll Marking in State Schools, which outline processes for managing and recording student attendance and absenteeism. Our rolls are marked digitally every lesson on OneSchool. The information is collated and anomalies identified. When more than 3 unexplained absences, a phone call home happens via Absentee Officer. After 5 days, a meeting is arranged, again by Absentee Officer. Absences beyond 5 days are managed by the Administration team through interviews with students and parents. We have a text messaging service to parents regarding absences. This way, parents are able to respond to absence message re: student. If students are away for extended periods of illness or relevant alternate programs/sport, HOY and students may co-ordinate work to be collected or emailed to home. Every effort is made to encourage students and parents to recognise the belief that “Every Day Counts”. This happens regularly in person, emails, newsletters, etc.
20
28
28
15
15
15
28
24
29
38
33
28
0% 20% 40% 60% 80% 100%
2012
* 2013
2014
Proportion of Students
Attendance Rate: 0% to <85% 85% to <90% 90% to <95% 95% to 100%

National Assessment Program – Literacy and Numeracy (NAPLAN) results – our reading, writing,
spelling, grammar and punctuation, and numeracy results for the Years 3, 5, 7, and 9.
Our reading, writing, spelling, grammar and punctuation, and numeracy results for the Years 3, 5, 7 and 9 are available via the My
School website at http://www.myschool.edu.au/.
To access our NAPLAN results, click on the My School link above. You will then be taken to the My School website with the following
‘Find a school’ text box.
Where it says ‘Search by school name’, type in the name of the school whose NAPLAN results you wish to view, and select <GO>.
Read and follow the instructions on the next screen; you will be asked to accept the Terms of Use and Privacy Policy before being able to access NAPLAN data. If you are unable to access the internet, please contact the school for a paper copy of our school’s NAPLAN results.
Achievement – Closing the Gap
Closing The Gap Report for indigenous students includes:
1. 100% attained QCE/SAT/VET 2. 67% attained QCE 3. Attendance 87.4%
Outcomes for our Year 12 cohorts 2012 2013 2014
Number of students receiving a Senior Statement 189 182 172
Number of students awarded a Queensland Certificate of Individual Achievement. 4 5 2
Number of students receiving an Overall Position (OP) 61 95 88
Number of students who are completing/continuing a School-based Apprenticeship or Traineeship (SAT).
35 37 23
Number of students awarded one or more Vocational Educational Training (VET) qualifications (incl. SAT).
181 140 156
Number of students awarded an Australian Qualification Framework Certificate II or above.
132 95 83
Number of students awarded a Queensland Certificate of Education (QCE) at the end of Year 12.
183 177 170
Apparent retention rates Year 10 to Year 12 2012 2013 2014
Year 12 student enrolment as a percentage of the Year 10 student cohort. 85% 91% 83%

Outcomes for our Year 12 cohorts 2012 2013 2014
Number of students awarded an International Baccalaureate Diploma (IBD). 0 0 0
Percentage of OP/IBD eligible students with OP 1-15 or an IBD. 75% 86% 74%
Percentage of Year 12 students who are completing or completed a SAT or were awarded one or more of the following: QCE, IBD, VET qualification.
99% 97% 99%
Percentage of Queensland Tertiary Admissions Centre (QTAC) applicants receiving an offer.
93% 97% 94%
As at 19 February 2015. The above values exclude VISA students.
As at 19 February 2015. The above values exclude VISA students.
As at 19 February 2015. The above values exclude VISA students.
We have a number of Certificate I, II & III courses including IT, Engineering, Furnishings, Retail Work Readiness, Early Childhood and Hospitality, Fitness, Visual Arts. Some of these certificates are provided by the School, whilst others are through external RTO.
Post-school destination information
At the time of publishing this School Annual Report, the results of the 2014 post-school destinations survey, Next Step – Student Destination Report (2013 Year 12 cohort) for the school were not available. Information about these post-school destinations of our students will be uploaded to the school’s website in September.
Early school leavers information
The destinations of young people who left the school in Years 10, 11 and prior to completing Year 12.
Analysis of the data regarding early leavers predominantly identifies that intrastate, interstate and overseas destinations are favoured, perhaps as a result of demographics and tourist related industry.
Overall Position Bands (OP)
Number of students in each Band for OP 1 to 25
Years OP 1-5 OP 6-10 OP 11-15 OP 16-20 OP 21-25
2012 6 20 20 14 1
2013 14 27 41 13 0
2014 11 27 27 23 0
Vocational Educational Training qualification (VET)
Number of students completing qualifications under Australian Qualification Framework (AQF)
Years Certificate I Certificate II Certificate III or above
2012 173 112 51
2013 119 81 44
2014 145 63 38
NEXT STEP 2015 DESTINATIONS OF 2014 YEAR 12s Sunshine Beach State High School Introduction This page presents a summary of results of the annual Next Step survey for Sunshine Beach State High School. The Next Step survey, undertaken by the Queensland Government, targets all students who completed Year 12 and gained a Senior Statement in 2014, whether they attended a government, Catholic or independent school, or a TAFE secondary college. The Queensland Government Statistician’s Office conducted the survey between March and June 2015, approximately six months after the young people left school. Responses were collected online and via computer-assisted telephone interviewing.
Statewide and regional reports from the Next Step survey will be available on the Next Step website in September 2015 at www.education.qld.gov.au/nextstep.
Response rate for Sunshine Beach State High School Table 1 below reports the response rate for Sunshine Beach State High School. It expresses the number of respondents from this school, as a percentage of all Year 12 completers who attended Sunshine Beach State High School in 2014.
It has not been possible to ascertain how representative these responses are of all Year 12 completers from this school.
Table 1: Survey response rate, Sunshine Beach State High School 2015 Number of
respondents Number of students
who completed Year 12 Response rate
(%)
126 174 72.4
Definitions of main destinations The pathways of Year 12 completers were categorised into ten main destinations. Year 12 completers who were both studying and working were reported as studying for their main destination. A table defining these categories can be found in the statewide report at www.education.qld.gov.au/nextstep.
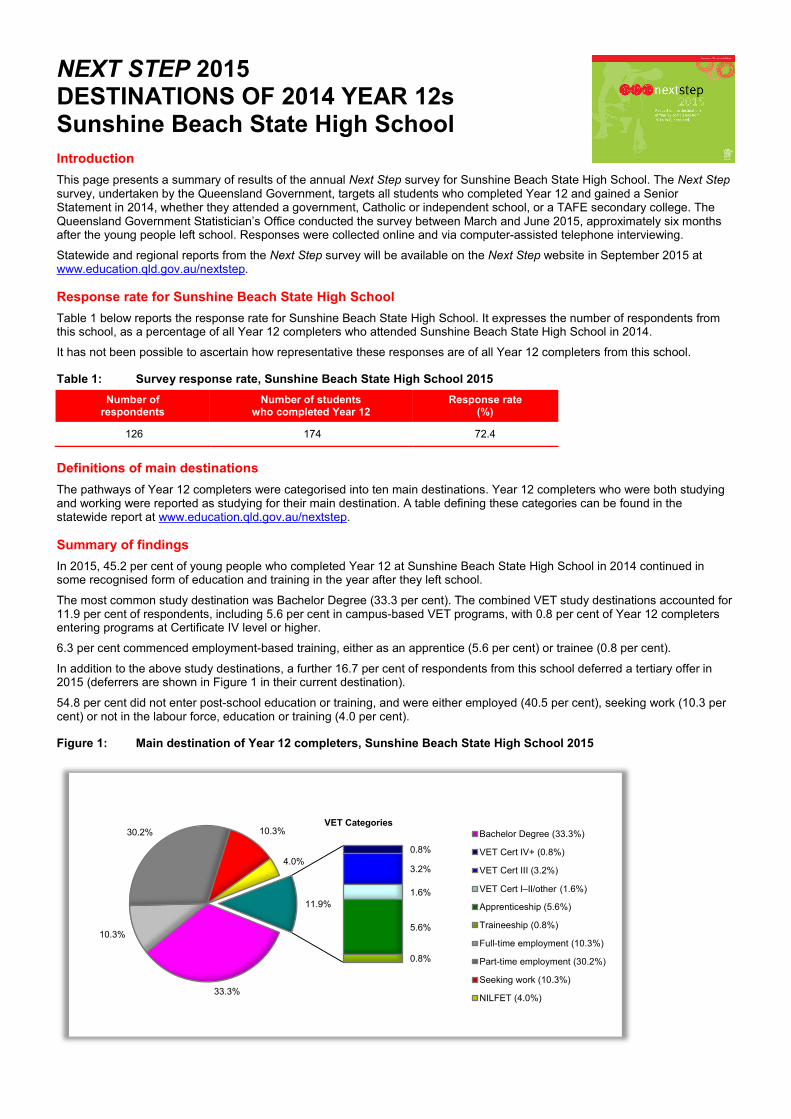
Summary of findings In 2015, 45.2 per cent of young people who completed Year 12 at Sunshine Beach State High School in 2014 continued in some recognised form of education and training in the year after they left school.
The most common study destination was Bachelor Degree (33.3 per cent). The combined VET study destinations accounted for 11.9 per cent of respondents, including 5.6 per cent in campus-based VET programs, with 0.8 per cent of Year 12 completers entering programs at Certificate IV level or higher.
6.3 per cent commenced employment-based training, either as an apprentice (5.6 per cent) or trainee (0.8 per cent).
In addition to the above study destinations, a further 16.7 per cent of respondents from this school deferred a tertiary offer in 2015 (deferrers are shown in Figure 1 in their current destination).
54.8 per cent did not enter post-school education or training, and were either employed (40.5 per cent), seeking work (10.3 per cent) or not in the labour force, education or training (4.0 per cent).
Figure 1: Main destination of Year 12 completers, Sunshine Beach State High School 2015
33.3%
0.8%
3.2%
1.6%
5.6%
0.8%
10.3%
30.2% 10.3%
4.0%
11.9%
VET CategoriesBachelor Degree (33.3%)
VET Cert IV+ (0.8%)
VET Cert III (3.2%)
VET Cert I–II/other (1.6%)
Apprenticeship (5.6%)
Traineeship (0.8%)
Full-time employment (10.3%)
Part-time employment (30.2%)
Seeking work (10.3%)
NILFET (4.0%)