sun life financial reports third quarter 2017 results
TRANSCRIPT

(ENR/MD&A) Third Quarter 2017/ sunlife.com 1
Sun Life Financial Reports Third Quarter 2017 Results
The information in this document is based on the unaudited interim financial results of Sun Life Financial Inc. for the period ended September 30,
2017. Sun Life Financial Inc., its subsidiaries and, where applicable, its joint ventures and associates are collectively referred to as “the
Company”, “Sun Life Financial”, “we”, “our”, and “us”. Unless otherwise noted, all amounts are in Canadian dollars. Beginning in the first quarter
of 2017, we stopped reporting operating net income and its related measures, operating earnings per share ("EPS") and operating return on
equity ("ROE"). The adjustments previously used to derive operating net income will continue to be used to derive underlying net income.
TORONTO, ON - (November 8, 2017) - Sun Life Financial Inc. (TSX: SLF) (NYSE: SLF) today announced its
results for the third quarter ended September 30, 2017. Third quarter reported net income was $817 million and
underlying net income(1) was $643 million.
Quarterly results Year-to-date
Q3'17 Q3'16 2017 2016
Reported net income ($ millions) 817 737 1,942 1,757
Underlying net income(1) ($ millions) 643 639 1,905 1,775
Reported EPS(2) ($) 1.32 1.20 3.16 2.85
Underlying EPS(1)(2) ($) 1.05 1.04 3.10 2.89
Reported ROE(1) 16.2 % 15.4 % 12.8 % 12.4 %
Underlying ROE(1) 12.7 % 13.4 % 12.6 % 12.5 %
• Minimum Continuing Capital and Surplus Requirements ("MCCSR") ratio for Sun Life Assurance Company of
Canada of 232%. The MCCSR ratio for Sun Life Financial Inc. was 252%, which includes cash and other liquid
assets of $1.5 billion for Sun Life Financial Inc. and its wholly-owned holding companies(3)
• Life and health sales(1) were $599 million in the third quarter of 2017, compared to $661 million in the same
period last year. Wealth sales(1) were $35.8 billion in the third quarter of 2017, compared to $35.2 billion in the
third quarter of 2016
• Global assets under management of $934 billion compared to $903 billion as at December 31, 2016
• An increase in the common share dividend declared of $0.02 per share, to $0.455 per share for the quarter
"Our third quarter was defined by strong earnings and good progress in all of our four business pillars," said Dean
Connor, President & CEO, Sun Life Financial. "We are also pleased to announce an increase in our common share
dividend by 2 cents. During the year, we've increased our dividend by 8%, a signal of our continued growth
prospects, strong capital position, and commitment to meeting our medium-term financial objectives."
"This quarter showcased many examples of how we’re bringing our Client-driven strategy to life,” said Connor. "In
Canada, Clients can now buy life insurance online in just minutes with Sun Life GO; and, we introduced Ella, an
interactive digital coach that helps Clients maximize their benefits and pension plans,” Connor added. "In the U.S.,
we enhanced our online capabilities to improve the benefit enrollment experience for plan members, and in Asia, we
improved our new Client onboarding process."
(1) Represents a non-IFRS financial measure. See section M - Non-IFRS Financial Measures in this document.
(2) All EPS measures refer to fully diluted EPS, unless otherwise stated.
(3) For additional information, see section E - Financial Strength in this document.

(ENR) Third Quarter 2017/ sunlife.com 2
Financial and Operational Highlights
Our strategy is focused on four key pillars of growth, where we aim to be a leader in the markets in which we
operate. We detail our continued progress in these pillars below.
($ millions, unless otherwise noted)
Q3'17 Q3'16
SLF
Canada SLF U.S. SLF Asset
Management SLF Asia Corporate Total Total
Reported net income 340 195 185 93 4 817 737
Underlying net income(1) 222 161 204 90 (34 ) 643 639
Life & health sales(1) 217 219 — 163 — 599 661
Wealth sales(1) 3,609 — 28,610 3,607 — 35,826 35,161
(1) Represents a non-IFRS financial measure. See section M - Non-IFRS Financial Measures in this document.
A Leader in Insurance and Wealth Solutions in our Canadian home market
SLF Canada’s reported net income was $340 million in the quarter, compared to $184 million in the same period
last year, reflecting favourable market related impacts largely driven by interest rates and assumption changes and
management actions. Underlying net income was $222 million, compared to $226 million in the same period last
year, reflecting unfavourable morbidity experience partially offset by new business gains.
We had strong growth in sales in our group businesses, with Group Benefits sales of $130 million, up 23% and
Group Retirement Services sales of $2.3 billion, up 53% from the third quarter of 2016. Following a strong first six
months of the year, individual insurance sales moderated to $87 million, 15% below the same period a year ago.
Individual wealth sales grew 5% year over year to $1.3 billion.
During the quarter, SLGI(1) announced the acquisition of Excel Funds Management Inc., a Canadian firm that
specializes in the emerging markets asset class, that will add approximately $700 million in AUM. This acquisition
complements SLGI’s product offerings, and will support growth in our wealth businesses. The acquisition is
expected to close by early 2018.
Advancement of our digital capabilities continued during the third quarter, including the launch of “Ella”, a new
interactive digital coach for our Clients. Ella is designed to enable Clients to achieve sustainable financial security
and live healthier lives by getting the full value from their benefits and pension plans. We also launched an online
insurance application process, Sun Life GO, which gives Canadians the flexibility to meet health and financial
needs with convenient access to insurance coverage.
A Leader in U.S. Group Benefits and International high net worth solutions
SLF U.S.’s reported net income was $195 million, down 20% in local currency from the same quarter prior year,
reflecting less favourable market related impacts primarily driven by interest rates and assumption changes and
management actions. Underlying net income was $161 million, up 25% in local currency compared to the same
quarter last year, reflecting improved underwriting experience in Group Benefits, as our pricing actions, investments
in claims management and expense initiatives continue to improve profitability.
Group Benefit sales for the year were down 8% in local currency reflecting pricing discipline throughout the year,
including in the quarter. In addition, sales in the quarter reflected fewer large case sales, and we achieved sales
growth in the small-case and medium-case markets. International life sales are comparable to the same quarter last
year, maintaining a leadership position in this market.
We made enhancements to our Group Benefits enrollment platform to provide new functionality, including the ability
to enroll newly hired employees online and digital capabilities to enable a quicker more Client friendly enrollment
experience in preparation for the fourth quarter, which is the largest sales and enrollment quarter of the year. In
October, we launched the new Sun Life Dental NetworkSM, the largest in the U.S. with approximately 125,000
unique providers(2), marking another milestone in the integration of the acquired Group Benefits business. We also
announced a new stop-loss distribution partnership with Pareto Captive Services to expand options for the growing
U.S. self-insured health plan market. (1) Sun Life Global Investments (Canada) Inc.
(2) Based on September, 2017 data from the Ignition Group.

(ENR) Third Quarter 2017/ sunlife.com 3
A Leader in global Asset Management
SLF Asset Management’s reported net income was $185 million and underlying net income was $204 million in the
third quarter of 2017, reflecting a growth of 2% and 9% compared to the same period last year, respectively, and an
increase in MFS's pre-tax operating profit margin ratio(1) to 41%, primarily driven by higher average net assets and
favourable impacts from expenses and investment income.
SLF Asset Management ended the third quarter with $648 billion in assets under management consisting of $591
billion (US$474 billion) from MFS Investment Management ("MFS") and $57 billion from Sun Life Investment
Management ("SLIM"). MFS net outflows of US$2.7 billion in the quarter were partially offset by SLIM net inflows of
$1.5 billion.
MFS long-term retail fund performance remained strong with 84%, 82% and 95% of MFS's U.S. retail mutual fund
assets ranked in the top half of their Lipper categories based on three-, five-, and ten-year performance,
respectively, as of September 30, 2017.
A Leader in Asia through Distribution Excellence in Higher Growth Markets
SLF Asia’s reported net income was $93 million, compared to $92 million in the third quarter of 2016, reflecting
growth in underlying net income offset by unfavourable market related impacts primarily driven by interest rates.
Underlying net income was $90 million, compared to $80 million in the third quarter of 2016, reflecting continued
growth in fee income business and higher level of gains from investments.
SLF Asia life and health sales were in line with the same quarter of the prior year, with growth across most markets
offset by lower sales in Hong Kong and the impact of the movement of the Canadian dollar. Strong wealth sales in
Asia of $3.6 billion were up 50% over the prior year, driven by continued growth in India and Philippines mutual
funds.
During the quarter, Sun Life Financial Indonesia launched a waqf(2) feature for Syariah life insurance products that
enables Clients to plan for their financial future while helping them observe their religious beliefs and doing charity.
Sun Life Financial Indonesia is the first life insurance company to offer this innovative solution in accordance with
the National Sharia Council of the Indonesian Ulama Council and Indonesia Waqf Board.
(1) Represents a non-IFRS financial measure. See section M - Non-IFRS Financial Measures in this document.
(2) An endowment made by a Muslim to a religious, educational, or charitable cause.
About Sun Life Financial Sun Life Financial is a leading international financial services organization providing a diverse range of insurance,
wealth and asset management solutions to individuals and corporate Clients. Sun Life Financial has operations in a
number of markets worldwide, including Canada, the United States, the United Kingdom, Ireland, Hong Kong, the
Philippines, Japan, Indonesia, India, China, Australia, Singapore, Vietnam, Malaysia and Bermuda. As of
September 30, 2017, Sun Life Financial had total assets under management of $934 billion. For more information
please visit www.sunlife.com.
Sun Life Financial Inc. trades on the Toronto (TSX), New York (NYSE) and Philippine (PSE) stock exchanges under
the ticker symbol SLF.

(ENR/MD&A) Third Quarter 2017/ sunlife.com 4
A. How We Report Our Results
Sun Life Financial Inc. (“SLF Inc.”), its subsidiaries and, where applicable, its joint ventures and associates are
collectively referred to as “the Company”, “Sun Life Financial”, “we”, “our”, and “us”. We manage our operations and
report our financial results in five business segments: Sun Life Financial Canada (“SLF Canada”), Sun Life
Financial United States (“SLF U.S.”), Sun Life Financial Asset Management (“SLF Asset Management”), Sun Life
Financial Asia (“SLF Asia”), and Corporate. Information concerning these segments is included in our annual and
interim consolidated financial statements and accompanying notes (“Annual Consolidated Financial Statements”
and "Interim Consolidated Financial Statements”, respectively) and annual management's discussion and analysis
("MD&A"). We prepare our unaudited Interim Consolidated Financial Statements using International Financial
Reporting Standards (“IFRS”), and in accordance with the International Accounting Standard ("IAS") 34 Interim
Financial Reporting. Reported net income (loss) refers to Common shareholders' net income (loss) determined in
accordance with IFRS.
The information in this document is in Canadian dollars unless otherwise noted.
1. Use of Non-IFRS Financial Measures
We report certain financial information using non-IFRS financial measures, as we believe that these measures
provide information that is useful to investors in understanding our performance and facilitate a comparison of our
quarterly and full year results from period to period. These non-IFRS financial measures do not have any
standardized meaning and may not be comparable with similar measures used by other companies. For certain
non-IFRS financial measures, there are no directly comparable amounts under IFRS. These non-IFRS financial
measures should not be viewed as alternatives to measures of financial performance determined in accordance
with IFRS. Additional information concerning these non-IFRS financial measures and reconciliations to the closest
IFRS measures are available in section M - Non-IFRS Financial Measures in this document. Non-IFRS Financial
Measures and reconciliations are also included in our annual and interim MD&A and the Supplementary Financial
Information packages that are available on www.sunlife.com under Investors – Financial results & reports.
2. Forward-looking Statements
Certain statements in this document are forward-looking statements within the meaning of certain securities laws,
including the “safe harbour” provisions of the United States Private Securities Litigation Reform Act of 1995 and
applicable Canadian securities legislation. Additional information concerning forward-looking statements and
important risk factors that could cause our assumptions, estimates, expectations and projections to be inaccurate
and our actual results or events to differ materially from those expressed in or implied by such forward-looking
statements can be found in section N - Forward-looking Statements in this document.
3. Additional Information
Additional information about SLF Inc. can be found in our Annual and Interim Consolidated Financial Statements,
annual and interim MD&A and Annual Information Form (“AIF”). These documents are filed with securities
regulators in Canada and are available at www.sedar.com. SLF Inc.'s Annual Consolidated Financial Statements,
annual MD&A and AIF are filed with the United States Securities and Exchange Commission (“SEC”) in SLF Inc.'s
annual report on Form 40-F and SLF Inc.'s interim MD&As and Interim Consolidated Financial Statements are
furnished to the SEC on Form 6-Ks and are available at www.sec.gov.
(ENR/MD&A) Third Quarter 2017/ sunlife.com 5
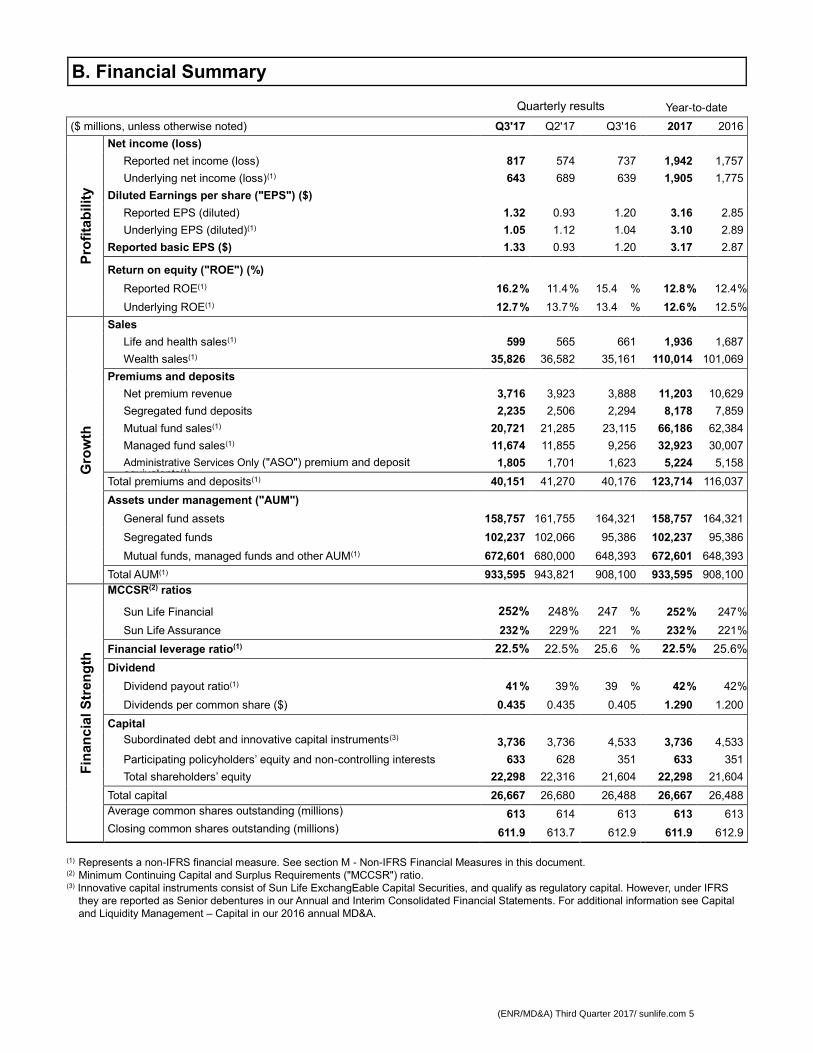
B. Financial Summary
Quarterly results
Year-to-date
($ millions, unless otherwise noted) Q3'17 Q2'17 Q3'16 2017 2016
Pro
fita
bilit
y
Net income (loss)
Reported net income (loss) 817 574 737 1,942 1,757
Underlying net income (loss)(1) 643 689 639 1,905 1,775
Diluted Earnings per share ("EPS") ($)
Reported EPS (diluted) 1.32 0.93 1.20 3.16 2.85
Underlying EPS (diluted)(1) 1.05 1.12 1.04 3.10 2.89
Reported basic EPS ($) 1.33 0.93 1.20 3.17 2.87
Return on equity ("ROE") (%)
Reported ROE(1) 16.2 % 11.4 % 15.4 % 12.8 % 12.4 %
Underlying ROE(1) 12.7 % 13.7 % 13.4 % 12.6 % 12.5 %
Gro
wth
Sales
Life and health sales(1) 599 565 661 1,936 1,687
Wealth sales(1) 35,826 36,582 35,161 110,014 101,069
Premiums and deposits
Net premium revenue 3,716 3,923 3,888 11,203 10,629
Segregated fund deposits 2,235 2,506 2,294 8,178 7,859
Mutual fund sales(1) 20,721 21,285 23,115 66,186 62,384
Managed fund sales(1) 11,674 11,855 9,256 32,923 30,007
Administrative Services Only ("ASO") premium and deposit equivalents(1)
1,805 1,701 1,623 5,224 5,158
Total premiums and deposits(1) 40,151 41,270 40,176 123,714 116,037
Assets under management ("AUM")
General fund assets 158,757 161,755 164,321 158,757 164,321
Segregated funds 102,237 102,066 95,386 102,237 95,386
Mutual funds, managed funds and other AUM(1) 672,601 680,000 648,393 672,601 648,393
Total AUM(1) 933,595 943,821 908,100 933,595 908,100
Fin
an
cia
l S
tren
gth
MCCSR(2) ratios
Sun Life Financial 252 % 248 % 247 % 252 % 247 %
Sun Life Assurance 232 % 229 % 221 % 232 % 221 %
Financial leverage ratio(1) 22.5 % 22.5 % 25.6 % 22.5 % 25.6 %
Dividend
Dividend payout ratio(1) 41 % 39 % 39 % 42 % 42 %
Dividends per common share ($) 0.435 0.435 0.405 1.290 1.200
Capital
Subordinated debt and innovative capital instruments(3)
3,736 3,736 4,533 3,736 4,533
Participating policyholders’ equity and non-controlling interests 633 628 351 633 351
Total shareholders’ equity 22,298 22,316 21,604 22,298 21,604
Total capital 26,667 26,680 26,488 26,667 26,488
Average common shares outstanding (millions)
613 614 613 613 613
Closing common shares outstanding (millions)
611.9 613.7 612.9 611.9 612.9
(1) Represents a non-IFRS financial measure. See section M - Non-IFRS Financial Measures in this document.
(2) Minimum Continuing Capital and Surplus Requirements ("MCCSR") ratio.
(3) Innovative capital instruments consist of Sun Life ExchangEable Capital Securities, and qualify as regulatory capital. However, under IFRS
they are reported as Senior debentures in our Annual and Interim Consolidated Financial Statements. For additional information see Capital
and Liquidity Management – Capital in our 2016 annual MD&A.

(ENR/MD&A) Third Quarter 2017/ sunlife.com 6
C. Profitability
The following table reconciles our reported net income and underlying net income. The table also sets out the
impact that other notable items had on our reported net income and underlying net income. All factors discussed in
this document that impact our underlying net income are also applicable to reported net income.
Quarterly results Year-to-date
($ millions, after-tax) Q3'17 Q2'17 Q3'16 2017 2016
Reported net income 817
574
737
1,942
1,757
Market related impacts(1) 113 (74 ) 57 50 (55 )
Assumption changes and management actions(1) 103 11 54 115 35
Other adjustments(1) (42 ) (52 ) (13 ) (128 ) 2
Underlying net income(1) 643 689 639 1,905 1,775
Reported ROE(1) 16.2 % 11.4 % 15.4 % 12.8 % 12.4 %
Underlying ROE(1) 12.7 % 13.7 % 13.4 % 12.6 % 12.5 %
Impact of other notable items on reported and underlying net income
Experience related items(2)
Impact of investment activity on insurance contract liabilities 12 41 56 71 139
Mortality 30 8 (23 ) 59 (10 )
Morbidity 3 18 (1 ) 15 (10 )
Credit 22 25 22 51 42
Lapse and other policyholder behaviour (12 ) (10 ) (3 ) (37 ) (4 )
Expenses (20 ) (11 ) (24 ) (38 ) (48 )
Other (2 ) (7 ) 23 (19 ) 17
(1) Represents a non-IFRS financial measure. See section M - Non-IFRS Financial Measures in this document for a breakdown of components
within this adjustment.
(2) Experience related items reflect the difference between actual experience during the reporting period and best estimate assumptions used in
the determination of our insurance contract liabilities.
Q3 2017 vs. Q3 2016
Our reported net income was $817 million in the third quarter of 2017, compared to $737 million in the third quarter
of 2016. Underlying net income was $643 million in the third quarter of 2017, compared to $639 million in the third
quarter of 2016. Reported net income reflected favourable market related activity primarily driven by interest rates
and changes in the fair values of real estate, and favourable impact of assumption changes and management
actions, partially offset by the unfavourable impact of the movement of the Canadian dollar and other adjustments
compared to the third quarter of 2016. Underlying net income reflected favourable mortality experience, growth in
fee income on our wealth businesses and new business gains, partially offset by a lower level of gains from
investing activity.
1. Market related impacts Market related impacts in the third quarter of 2017 compared to the third quarter of 2016 reflected favourable
interest rate and credit spread movements and changes in fair values of real estate. See section M - Non-IFRS
Financial Measures in this document for a breakdown of the components of market related impacts.
2. Assumption changes and management actions Due to the long-term nature of our business, we make certain judgments involving assumptions and estimates
to value our obligations to policyholders. The valuation of these obligations is recorded in our financial
statements as insurance contract liabilities and investment contract liabilities and requires us to make
assumptions about equity market performance, interest rates, asset default, mortality and morbidity rates,
lapses and other policyholder behaviour, expenses and inflation and other factors over the life of our products.
We review assumptions each year, generally in the third quarter, and revise these assumptions if appropriate.
We consider our actual experience in current and past periods relative to our assumptions as part of our annual
review.

(ENR/MD&A) Third Quarter 2017/ sunlife.com 7
During the third quarter of 2017, the net impact of assumption changes and management actions resulted in an
increase of $103 million to reported net income, compared to an increase of $54 million in the third quarter of
2016.
Assumption changes and management actions by type
The following table sets out the impact of assumption changes and management actions on our net income in
the third quarter of 2017.
Q3'17 Quarterly
($ millions, after-tax) Impact on net income(1) Comments
Mortality/morbidity(2) 217 Updates to reflect mortality/morbidity experience in all jurisdictions. The largest items were favourable mortality in SLF U.S. In-force Management and International insurance and favourable mortality improvement in SLF U.K.
Lapse and other policyholder behaviour
(100) Updates to reflect lapse and other policyholder behaviour experience in all jurisdictions. The largest items were lower lapse rates on lapse supported business in SLF U.S. and updated lapse assumptions in SLF Canada's individual insurance business.
Expenses (73) Updates to reflect expense experience in all jurisdictions. The largest items were a refinement to the allocation of expenses in SLF Canada and increased expenses in the closed block of business in SLF U.S. International wealth.
Investment returns(2) 62 Updates to various investment related assumptions across the Company. This included a reduction of the provision for investment risk in SLF Canada and other updated investment related assumptions, offset partially by updates to promulgated ultimate reinvestment rates.
Model enhancements and other (3) Various enhancements and methodology changes across all jurisdictions.
Total impact on net income(3) 103
(1) Assumption changes and management actions is included in reported net income and is presented as an adjustment to arrive at underlying
income.
(2) Investment returns includes the impact of a decrease of 10 basis points to the promulgated Ultimate Reinvestment Rate (“URR”)
announced by the Actuarial Standards Board ("ASB") in July, 2017, which was largely in line with our estimate. In July, 2017, The ASB also
finalized promulgations for future mortality improvement assumptions and calibration criteria for stochastic modelling of equity investment
and risk-free interest returns; the impacts of these changes were not material.
(3) In this table, assumption changes and management actions represent the shareholders' net income impact (after-tax) including
management actions. In Note 6.A of our Interim Consolidated Financial Statements, the impact of method and assumptions changes
represents the change in shareholder and participating policyholder insurance contract liabilities net of reinsurance assets (pre-tax) and
does not include management actions. Further information can also be found in section M - Non-IFRS Financial Measures in this
document.
3. Other adjustments Other adjustments which decreased reported net income by $42 million in the third quarter of 2017 were
comprised of Fair value adjustments on MFS's share-based payment awards of $19 million, driven largely by
the increase in valuation of MFS; Acquisition, integration and restructuring amounts of $17 million, driven
largely by the impact of integration costs related primarily to the U.S. employee benefits business acquired in
2016; and $6 million related to Certain hedges in SLF Canada that do not qualify for hedge accounting. See
section M - Non-IFRS Financial Measures in this document for a breakdown of the components of other
adjustments.
4. Experience related items Experience related items in the third quarter of 2017 compared to the third quarter of 2016 reflected favourable
mortality experience, driven by SLF U.S. and SLF U.K., partially offset by a lower level of gains from investing
activity on insurance contract liabilities.
5. Income Taxes In the third quarter of 2017, our effective income tax rates on reported net income and underlying net income(1)
were 19.7% and 23.5%, respectively, compared to 18.3% and 22.2%, respectively, in the third quarter of 2016.
Our statutory tax rate is normally reduced by various tax benefits, such as lower taxes on income subject to tax
in foreign jurisdictions, a range of tax exempt investment income, and other sustainable tax benefits that are
expected to decrease our effective tax rate to a range of 18% to 22%.

(ENR/MD&A) Third Quarter 2017/ sunlife.com 8
(1) Our effective income tax rate on underlying net income is calculated using underlying net income and income tax expense associated with
underlying net income, which excludes amounts attributable to participating policyholders.
Our effective tax rate on reported net income for the third quarter is within our expected range. Our effective tax
rate on underlying income is slightly above our expected range, and was impacted by earnings in jurisdictions
with higher statutory income tax rates and adjustments due to the resolution of tax matters.
6. Impact of Foreign Exchange Rates During the third quarter of 2017, our reported net income and underlying net income decreased by $26 million
and $22 million, respectively, as a result of the impact of the movement of the Canadian dollar in the third
quarter of 2017 relative to the average exchange rates in the third quarter of 2016.
Q3 2017 vs. Q3 2016 (year-to-date)
Our reported net income was $1,942 million for the first nine months of 2017, compared to $1,757 million in the first
nine months of 2016. Underlying net income was $1,905 million, compared to $1,775 million in the first nine months
of 2016. Reported net income reflected the increased favourable impact of assumption changes and management
actions and market related impacts, partially offset by the unfavourable impact of the movement of the Canadian
dollar and other adjustments in the first nine months of 2017. Underlying net income in the first nine months of
2017, compared to the same period last year, reflected favourable mortality and morbidity experience, growth in fee
income on our wealth businesses and new business gains, partially offset by a lower level of gains from investing
activity and unfavourable lapse and other policyholder behaviour experience.
1. Market related impacts Market related impacts in the first nine months of 2017 compared to the first nine months of 2016 was primarily
driven by favourable changes in fair values of real estate and less unfavourable interest rates movements. See
section M - Non-IFRS Financial Measures in this document for a breakdown of the components of market
related impacts.
2. Assumption changes and management actions Assumption changes and management actions were $115 million in the first nine months of 2017, compared to
$35 million in the first nine months of 2016. Assumption changes and management actions were primarily
driven by the impact of assumption changes and management actions in third quarter of 2017, discussed in the
previous section Q3 2017 vs. Q3 2016. See section M - Non-IFRS Financial Measures in this document for
more details including references to notable impacts in previous quarters.
3. Other adjustments Other adjustments in the first nine months of 2017 which decreased reported net income by $128 million were
comprised of Fair value adjustments on MFS's share-based payment awards of $47 million, driven largely by
the increase in valuation of MFS; Acquisition, integration and restructuring amounts of $63 million, driven
largely by the impact of integration costs related primarily to the U.S. employee benefits business acquired in
2016; and $18 million related to Certain hedges in SLF Canada that do not qualify for hedge accounting.
4. Experience related items Experience related items in the first nine months of 2017 compared to the first nine months of 2016 reflected
favourable mortality and morbidity experience. Experience related items also reflected a lower level of gains
from investing activity on insurance contract liabilities and unfavourable lapse and other policyholder behaviour
experience. Both periods had favourable credit experience and unfavourable expense experience.
5. Income Taxes For the first nine months of 2017, our effective tax rates on reported and underlying net income(1) were 14.1%
and 20.1%, respectively, compared to 17.3% and 22.2%, respectively, for the first nine months of 2016. Our
statutory tax rate is normally reduced by various tax benefits, such as lower taxes on income subject to tax in
foreign jurisdictions, a range of tax exempt investment income, and other sustainable tax benefits that are
expected to decrease our effective tax rate to a range of 18% to 22%.
(1) Our effective income tax rate on underlying net income is calculated using underlying net income and income tax expense associated with
underlying net income, which excludes amounts attributable to participating policyholders.

(ENR/MD&A) Third Quarter 2017/ sunlife.com 9
Our reported effective tax rate for the first nine months of 2017 was most notably impacted by higher earnings
in jurisdictions with lower statutory income tax rates and losses in jurisdictions with higher statutory income tax
rates, in particular impacts arising from assumption changes and management actions in SLF U.S., as well as
the finalization of prior years’ tax filings, which have resulted in an unusually low effective tax rate on a reported
basis during the first nine months of 2017. Our effective tax rate on an underlying basis is within our expected
range.
6. Impact of Foreign Exchange Rates During the first nine months of 2017, our reported net income and underlying net income decreased by $41
million and $34 million, respectively, as a result of the impact of the movement of the Canadian dollar in the first
nine months of 2017 relative to the average exchange rates in the first nine months of 2016.
Driving Client Strategy and Enhancing Business Processes
To advance our Client strategy and support our ongoing expense discipline, we will be taking actions to enhance
business processes and organizational structures and capabilities. These actions balance our commitment to
financial discipline with continued investments in enhanced service models, digital transformation and acceleration
of various Client initiatives. As a result of these actions, we expect to take a restructuring charge of $40-$60 million
($30-$45 million after-tax), in the fourth quarter of 2017.
The actual restructuring charge in the fourth quarter of 2017 could differ from the Company’s estimate. See
Forward-looking Statements in section N. of this document.
D. Growth
1. Sales
Quarterly results Year-to-date
($ millions) Q3'17 Q2'17 Q3'16 2017 2016
Life and health sales(1)
SLF Canada 217 230 208 898 642
SLF U.S. 219 186 285 554 593
SLF Asia 163 149 168 484 452
Total life and health sales(1) 599 565 661 1,936 1,687
Wealth sales(1)
SLF Canada 3,609 3,781 2,736 11,793 8,499
SLF Asia 3,607 2,949 2,402 9,453 5,757
Total wealth sales excluding SLF Asset Management(1) 7,216 6,730 5,138 21,246 14,256
SLF Asset Management sales(1) 28,610 29,852 30,023 88,768 86,813
Total wealth sales(1) 35,826 36,582 35,161 110,014 101,069
(1) Represents a non-IFRS financial measure. See section M - Non-IFRS Financial Measures in this document.
Total Company life and health sales were $599 million in the third quarter of 2017, compared to $661 million in the
same period last year.
• SLF Canada life and health sales were $217 million in the third quarter of 2017, compared to $208 million in
the third quarter of 2016 mainly due to higher sales in Group Benefits, partially offset by lower individual life
insurance sales
• SLF U.S. life and health sales were $219 million in the third quarter of 2017, compared to $285 million in
the third quarter of 2016, mainly reflecting lower employee benefits and stop-loss sales primarily due to
fewer large case sales and the impact of currency

(ENR/MD&A) Third Quarter 2017/ sunlife.com 10
• SLF Asia life and health sales were $163 million in the third quarter of 2017, compared to $168 million in
the third quarter of 2016, mainly attributable to the currency impact from the change in the Canadian dollar
and lower sales in Hong Kong, partially offset by growth in most markets
Total Company wealth sales were $35.8 billion in the third quarter of 2017, compared to $35.2 billion in the third
quarter of 2016.
• SLF Canada wealth sales were $3.6 billion in the third quarter of 2017, compared to $2.7 billion in the third
quarter of 2016, largely reflecting higher sales in Group Retirement Services ("GRS") and individual wealth
• SLF Asia wealth sales were $3.6 billion in the third quarter of 2017, compared to $2.4 billion in the third
quarter of 2016, primarily led by growth in the Philippines and India, as well as higher sales in Hong Kong,
partially offset by lower sales in China and the currency impact from the change in the Canadian dollar
• SLF Asset Management gross sales were $28.6 billion in the third quarter of 2017, compared to $30.0
billion in the third quarter of 2016, largely attributable to lower mutual fund sales in MFS and the currency
impact from the change in the Canadian dollar, partially offset by higher managed fund sales in MFS and
increased fund sales from SLIM.
2. Premiums and Deposits
Quarterly results Year-to-date
($ millions) Q3'17 Q2'17 Q3'16 2017 2016
Net premium revenue 3,716 3,923 3,888 11,203 10,629
Segregated fund deposits 2,235 2,506 2,294 8,178 7,859
Mutual fund sales(1) 20,721 21,285 23,115 66,186 62,384
Managed fund sales(1) 11,674 11,855 9,256 32,923 30,007
ASO premium and deposit equivalents(1) 1,805 1,701 1,623 5,224 5,158
Total premiums and deposits(1) 40,151 41,270 40,176 123,714 116,037
Total adjusted premiums and deposits(1)(2) 42,261 40,938 40,872 127,120 118,100
(1) Represents a non-IFRS financial measure. See section M - Non-IFRS Financial Measures in this document.
(2) Adjusted premiums and deposits is a non-IFRS financial measure that excludes from premiums and deposits the impact of Constant Currency
Adjustment and Reinsurance in SLF Canada's GB Operations Adjustment as described in section M - Non-IFRS Financial Measures in this
document.
Net premium revenue was $3.7 billion in the third quarter of 2017, compared to $3.9 billion in the third quarter of
2016. The decrease was primarily driven by decreases in Hong Kong in SLF Asia, Group Benefits in SLF U.S.,
GRS in SLF Canada and the currency impact from the change in the Canadian dollar, partially offset by higher
premiums in In-force management in SLF U.S. due to the impact of recapturing certain reinsurance treaties, and
Individual and Group Benefits in SLF Canada. Net premium revenue was $11.2 billion in the first nine months of
2017, compared to $10.6 billion in the same period of 2016. The increase was primarily driven by higher premiums
in all business units in SLF Canada and SLF U.S., partially offset by decreases in Hong Kong in SLF Asia and the
currency impact from the change in the Canadian dollar.
Segregated fund deposits were $2.2 billion in the third quarter of 2017, compared to $2.3 billion in the third quarter
of 2016, primarily due to decreases in the Philippines in SLF Asia and the currency impact from the change in the
Canadian dollar. Segregated fund deposits were $8.2 billion in the first nine months of 2017, compared to $7.9
billion for the same period last year. The increase was primarily driven by increases in GRS in SLF Canada and
Indonesia in SLF Asia, partially offset by the currency impact from the change in the Canadian dollar and decrease
in the Philippines in SLF Asia.
Sales of mutual funds were $20.7 billion in the third quarter of 2017, a decrease of $2.4 billion over the third quarter
of 2016. The lower mutual fund sales largely reflected lower sales in MFS and the currency impact from the change
in the Canadian dollar, partially offset by increased sales from the Philippines and India in SLF Asia. Sales of mutual
funds were $66.2 billion for the first nine months of 2017, compared to $62.4 billion in the same period in 2016. The
higher mutual fund sales was primarily driven by growth in India and the Philippines in SLF Asia, increased sales
from MFS and SLGI in SLF Canada, partially offset by the currency impact from the change in the Canadian dollar.
Sales of managed funds were $11.7 billion in the third quarter of 2017, compared to $9.3 billion in the third quarter
of 2016. The increased managed fund sales were primarily due to higher sales in MFS, SLIM and Hong Kong in
SLF Asia, partially offset by the currency impact from the change in the Canadian dollar. Sales of managed funds

(ENR/MD&A) Third Quarter 2017/ sunlife.com 11
were $32.9 billion for the first nine months of 2017, compared to $30.0 billion in the same period in 2016. The
increased managed fund sales were primarily due to increases from SLIM as well as Hong Kong in SLF Asia,
partially offset by the currency impact from the change in the Canadian dollar and lower sales in MFS.
ASO premium and deposit equivalents in the third quarter of 2017 and for the first nine months of 2017 were both
up compared to the same periods last year. In both cases, the increase was attributable to increases in GRS and
GB in SLF Canada, partially offset by decreases in Hong Kong in SLF Asia.
The currency impact for total premium and deposits for the third quarter of 2017 from the change in the Canadian
dollar relative to average exchange rates in the third quarter of 2016 decreased total premiums and deposits by
approximately $1.3 billion. The currency impact for total premium and deposits for the first nine months of 2017
from the change in the Canadian dollar relative to average exchange rates in the first nine months of 2016
decreased total premiums and deposits by approximately $1.1 billion.
3. Assets Under Management AUM consist of general funds, segregated funds, and other AUM. Other AUM includes mutual funds and managed
funds, which include institutional and other third-party assets managed by the Company.
Quarterly results
($ millions) Q3'17 Q2'17 Q1'17 Q4'16 Q3'16
Assets under management (AUM)(1)
General fund assets 158,757 161,755 160,044 161,071 164,321
Segregated funds 102,237 102,066 101,055 97,167 95,386
Mutual funds, managed funds and other AUM(1) 672,601 680,000 666,176 645,037 648,393
Total AUM(1) 933,595 943,821 927,275 903,275 908,100
(1) Represents a non-IFRS financial measure. See section M - Non-IFRS Financial Measures in this document.
AUM were $933.6 billion as at September 30, 2017, compared to AUM of $903.3 billion as at December 31, 2016.
The increase in AUM of $30.3 billion between December 31, 2016 and September 30, 2017 resulted primarily from:
(i) an increase of $95.1 billion from favourable market movements
(ii) an increase of $1.2 billion of other business activities partially offset by
(iii) a decrease of $53.7 billion from the strengthening of the Canadian dollar relative to exchange rates
at the end of the fourth quarter of 2016; and
(iv) net outflow of mutual, managed, and segregated funds of $12.3 billion.
E. Financial Strength
Quarterly results
Q3'17 Q2'17 Q1'17 Q4'16 Q3'16
MCCSR ratio
Sun Life Financial 252 % 248 % 249 % 253 % 247 %
Sun Life Assurance 232 % 229 % 229 % 226 % 221 %
Financial leverage ratio(1) 22.5 % 22.5 % 22.6 % 25.2 % 25.6 %
Dividend
Dividend payout ratio(1) 41 % 39 % 45 % 46 % 39 %
Dividends per common share ($) 0.435 0.435 0.420 0.420 0.405
Capital
Subordinated debt and innovative capital instruments(2)
3,736 3,736 3,735 4,534 4,533
Participating policyholders’ equity and non-controlling interests 633 628 586 412 351
Preferred shareholders' equity 2,257 2,257 2,257 2,257 2,257
Common shareholders’ equity 20,041 20,059 19,968 19,699 19,347
Total capital 26,667 26,680 26,546 26,902 26,488

(ENR/MD&A) Third Quarter 2017/ sunlife.com 12
(1) Represents a non-IFRS financial measure. See section M - Non-IFRS Financial Measures in this document.
(2) Innovative capital instruments consist of Sun Life ExchangEable Capital Securities, and qualify as regulatory capital. However, under IFRS
they are reported as Senior debentures in our Annual and Interim Consolidated Financial Statements. For additional information see Capital
and Liquidity Management - Capital in our 2016 annual MD&A.
Our total capital consists of subordinated debt and other capital instruments, participating policyholders' equity, and
total shareholders' equity which includes common shareholders' equity and preferred shareholders' equity. As at
September 30, 2017, our total capital was $26.7 billion, compared to $26.9 billion as at December 31, 2016. The
decrease in total capital was primarily due to the redemption of $800 million of subordinated debt detailed below,
the payment of $792 million of dividends on common shares and unfavourable foreign currency translation impact
of $890 million included in other comprehensive loss, partially offset by common shareholders' net income of
$1,942 million.
The legal entity, SLF Inc. (the ultimate parent company), and its wholly-owned holding companies had $1,526
million in cash and other liquid assets as at September 30, 2017 ($1,616 million as at December 31, 2016). The
decrease in liquid assets in these holding companies in the first nine months of 2017 was primarily attributable to
the redemption of $800 million subordinated debt detailed below and the payment of shareholder dividends which
was partially offset by cash generated from the businesses during the period. Liquid assets as noted above include
cash and cash equivalents, short-term investments, and publicly traded securities.
On March 2, 2017, SLF Inc. redeemed all of its outstanding $800 million principal amount of Series 2012-1
Subordinated Unsecured 4.38% Fixed/Floating Debentures.
As at September 30, 2017, Sun Life Assurance's MCCSR ratio was 232%, compared to 226% as at December 31,
2016. The increase in Sun Life Assurance's MCCSR ratio over the period primarily resulted from the contribution of
earnings net of dividends.
As at September 30, 2017, SLF Inc.'s MCCSR ratio was 252%, compared to 253% as at December 31, 2016. The
primary difference between the MCCSR ratio of SLF Inc. and Sun Life Assurance relates to cash and liquid assets
held at the holding company level of $1,526 million as discussed above and capital related to certain insurance
subsidiaries held directly by SLF Inc.
Life Insurance Capital Adequacy Test
The Office of the Superintendent of Financial Institutions ("OSFI") will implement a revised regulatory capital
framework in Canada effective January 1, 2018. The Life Insurance Capital Adequacy Test ("LICAT") Guideline will
replace the MCCSR Guideline. The LICAT Guideline defines a new framework that is intended by OSFI to improve
the overall quality of available capital, provide greater risk sensitivity, better measurement of certain risks and closer
alignment of risk measures with the economics of the life insurance business. The new Guideline is not expected to
significantly change the level of excess capital in the industry, however capital requirements by company may
change. Results as measured under LICAT are fundamentally different than under MCCSR and will not be directly
comparable to MCCSR.
OSFI released its LICAT Guideline in September, 2016. Since then OSFI and the industry have completed impact
assessments of the guideline, including sensitivity testing and based on these assessments and testing OSFI
released revisions to the Guideline on June 23, 2017 for public consultation. A final version of the Guideline is
expected to be published by OSFI this fall. Sun Life Financial will continue to participate in further testing and
dialogue with OSFI and industry participants during the assessment period and subsequent implementation.
We currently have a strong capital position under the MCCSR framework and expect that to continue under the
LICAT framework.
Normal Course Issuer Bid
On August 14, 2017, SLF Inc. launched a normal course issuer bid under which it is authorized to purchase up to
11.5 million common shares between August 14, 2017 and August 13, 2018. During the third quarter of 2017, SLF
Inc. purchased and cancelled approximately 1.8 million common shares at a total cost of $88 million.
(ENR/MD&A) Third Quarter 2017/ sunlife.com 13
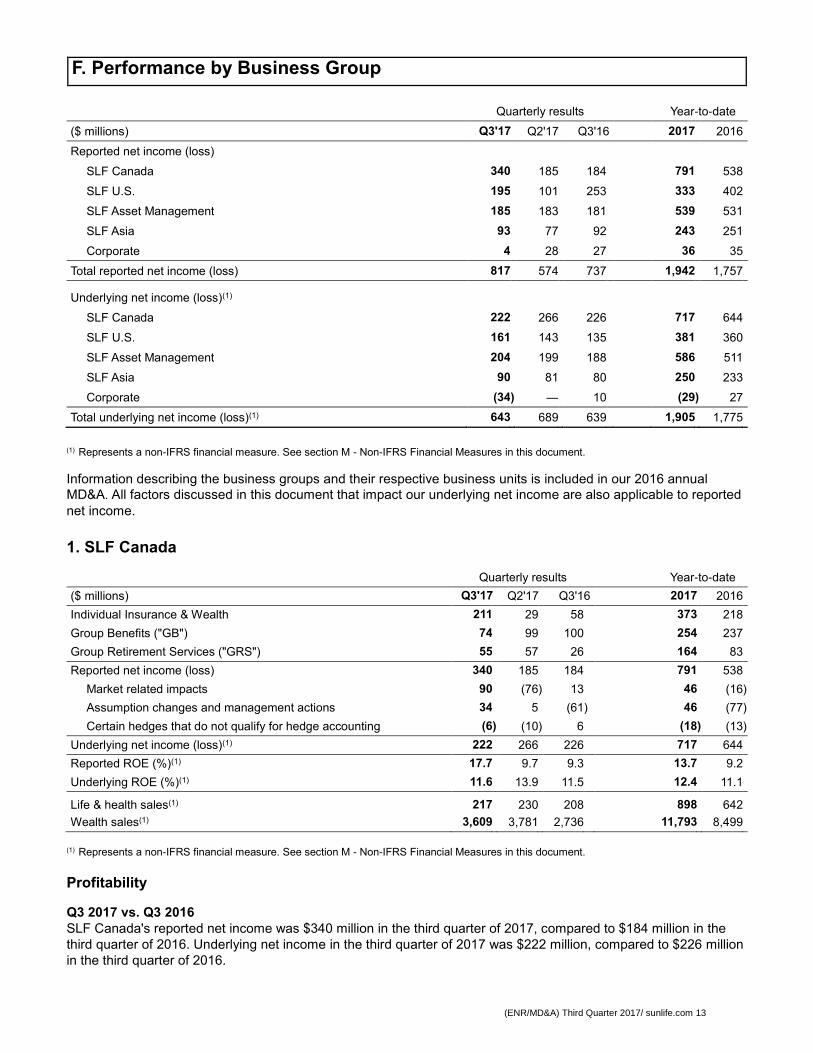
F. Performance by Business Group
Quarterly results Year-to-date
($ millions) Q3'17 Q2'17 Q3'16 2017 2016
Reported net income (loss)
SLF Canada 340 185 184 791 538
SLF U.S. 195 101 253 333 402
SLF Asset Management 185 183 181 539 531
SLF Asia 93 77 92 243 251
Corporate 4 28 27 36 35
Total reported net income (loss) 817 574 737 1,942 1,757
Underlying net income (loss)(1)
SLF Canada 222 266 226 717 644
SLF U.S. 161 143 135 381 360
SLF Asset Management 204 199 188 586 511
SLF Asia 90 81 80 250 233
Corporate (34 ) — 10 (29 ) 27
Total underlying net income (loss)(1) 643 689 639 1,905 1,775
(1) Represents a non-IFRS financial measure. See section M - Non-IFRS Financial Measures in this document.
Information describing the business groups and their respective business units is included in our 2016 annual
MD&A. All factors discussed in this document that impact our underlying net income are also applicable to reported
net income.
1. SLF Canada
Quarterly results Year-to-date
($ millions) Q3'17 Q2'17 Q3'16 2017 2016
Individual Insurance & Wealth 211 29 58 373 218
Group Benefits ("GB") 74 99 100 254 237
Group Retirement Services ("GRS") 55 57 26 164 83
Reported net income (loss) 340 185 184 791 538
Market related impacts 90 (76 ) 13 46 (16 )
Assumption changes and management actions 34 5 (61 ) 46 (77 )
Certain hedges that do not qualify for hedge accounting (6 ) (10 ) 6 (18 ) (13 )
Underlying net income (loss)(1) 222 266 226 717 644
Reported ROE (%)(1) 17.7 9.7 9.3 13.7 9.2
Underlying ROE (%)(1) 11.6 13.9 11.5 12.4 11.1
Life & health sales(1) 217 230 208 898 642
Wealth sales(1) 3,609 3,781 2,736 11,793 8,499
(1) Represents a non-IFRS financial measure. See section M - Non-IFRS Financial Measures in this document.
Profitability
Q3 2017 vs. Q3 2016
SLF Canada's reported net income was $340 million in the third quarter of 2017, compared to $184 million in the
third quarter of 2016. Underlying net income in the third quarter of 2017 was $222 million, compared to $226 million
in the third quarter of 2016.

(ENR/MD&A) Third Quarter 2017/ sunlife.com 14
Reported net income in the third quarter of 2017 compared to the third quarter of 2016 reflected favourable market
related impacts primarily driven by interest rates, increases in the fair value of real estate, partially offset by less
favourable equity markets. The impact of assumption changes and management actions in the third quarter of 2017
was primarily in Individual Insurance & Wealth. Underlying net income in the third quarter of 2017 compared to the
same period last year reflected growth in fee income on our wealth businesses and strong new business gains in
GRS and individual insurance, and improved expense experience, offset by lower investing activity gains on
insurance contract liabilities and unfavourable morbidity experience in Group Benefits.
Q3 2017 vs. Q3 2016 (year-to-date)
Reported net income was $791 million for the first nine months of 2017, compared to $538 million for the nine
months ended September 30, 2016. Underlying net income was $717 million in the first nine months ended
September 30, 2017, compared to $644 million in the same period last year.
Reported net income in the first nine months of 2017 compared to the first nine months of 2016 reflected favourable
market related impacts driven by the impact of interest rate changes and increases in the fair value of real estate
with partially offsetting impacts from less favourable equity markets and swap spreads. The impact of assumption
changes and management actions in the first nine months of 2017 was primarily in Individual Insurance & Wealth.
Underlying net income in the first nine months of 2017 compared to the first nine months of 2016 reflected strong
new business gains in GRS and individual insurance, and favourable mortality experience in our individual wealth
business and GRS. This was partially offset by lower gains from investing activity on insurance contract liabilities.
Growth
Q3 2017 vs. Q3 2016
SLF Canada life and health sales were $217 million in the third quarter of 2017, compared to $208 million in the
third quarter of 2016. Individual insurance sales were 15% lower than the third quarter of last year at $87 million
following a strong first six months of the year. Sales in Group Benefits of $130 million increased 23% compared to
third quarter 2016, driven by a few large Client sales.
SLF Canada wealth sales were $3.6 billion in the third quarter of 2017, compared to $2.7 billion in the third quarter
of 2016. Individual wealth sales of $1.3 billion were 5% above the same quarter of the prior year driven by
continued growth in our wealth manufactured(1) products, including SLGI(2) mutual funds and Sun GIF(3) segregated
funds. GRS sales of $2.3 billion were 53% ahead of the third quarter of 2016, due to increased renewal activity.
Q3 2017 vs. Q3 2016 (year-to-date)
SLF Canada life and health sales were $898 million in the first nine months of 2017, compared to $642 million in the
same period last year. Individual insurance sales of $331 million were up 22% over the same period in the prior
year, driven by solid demand for the new product suite and the impact of third-party sales in the first quarter as a
result of tax legislation changes. Sales in Group Benefits of $567 million increased 53% compared to third quarter
2016 driven by several large case sales.
SLF Canada wealth sales were $11.8 billion in the first nine months of 2017, compared to $8.5 billion in the same
period last year. Individual wealth sales of $4.4 billion were up 13% in the first nine months of 2017 compared to the
same period last year, driven by continued growth in our wealth manufactured(1) products, including SLGI(2) mutual
funds and Sun GIF(3) segregated funds. GRS sales of $7.4 billion were 61% ahead of the first nine months in 2016,
due to large case defined contribution sales, a large Defined Benefit Solutions sale, and increased renewal activity.
(1) Represents sales of individual wealth products developed by Sun Life, which include Sun Life Global Investment mutual funds, Sun Life
Guaranteed Investment Funds segregated funds, Guaranteed Investment Certificates, and Accumulation and Payout Annuities.
(2) Sun Life Global Investments (Canada) Inc.
(3) Sun Life Guaranteed Investment Funds
(ENR/MD&A) Third Quarter 2017/ sunlife.com 15
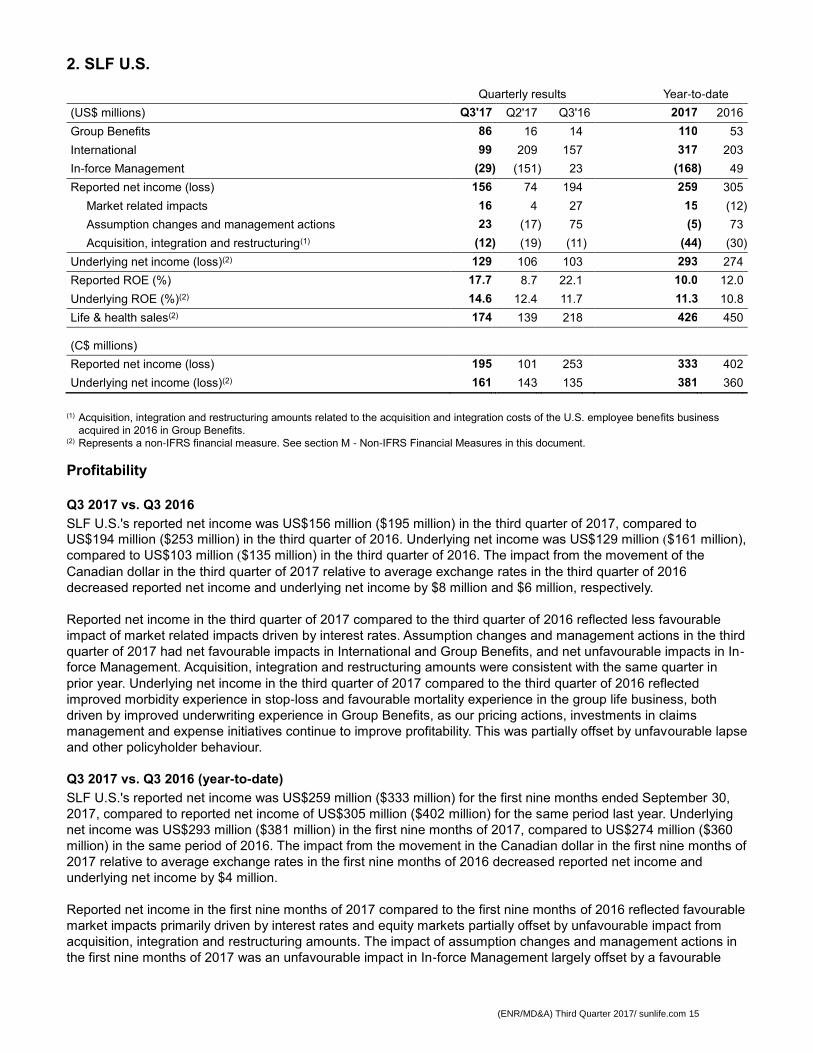
2. SLF U.S.
Quarterly results Year-to-date
(US$ millions) Q3'17 Q2'17 Q3'16 2017 2016
Group Benefits 86 16 14 110 53
International 99 209 157 317 203
In-force Management (29 ) (151 ) 23 (168 ) 49
Reported net income (loss) 156 74 194 259 305
Market related impacts 16 4 27 15 (12 )
Assumption changes and management actions 23 (17 ) 75 (5 ) 73
Acquisition, integration and restructuring(1) (12 ) (19 ) (11 ) (44 ) (30 )
Underlying net income (loss)(2) 129 106 103 293 274
Reported ROE (%) 17.7 8.7 22.1 10.0 12.0
Underlying ROE (%)(2) 14.6 12.4 11.7 11.3 10.8
Life & health sales(2) 174 139 218 426 450
(C$ millions)
Reported net income (loss) 195 101 253 333 402
Underlying net income (loss)(2) 161 143 135 381 360
(1) Acquisition, integration and restructuring amounts related to the acquisition and integration costs of the U.S. employee benefits business
acquired in 2016 in Group Benefits.
(2) Represents a non-IFRS financial measure. See section M - Non-IFRS Financial Measures in this document.
Profitability
Q3 2017 vs. Q3 2016
SLF U.S.'s reported net income was US$156 million ($195 million) in the third quarter of 2017, compared to
US$194 million ($253 million) in the third quarter of 2016. Underlying net income was US$129 million ($161 million),
compared to US$103 million ($135 million) in the third quarter of 2016. The impact from the movement of the
Canadian dollar in the third quarter of 2017 relative to average exchange rates in the third quarter of 2016
decreased reported net income and underlying net income by $8 million and $6 million, respectively.
Reported net income in the third quarter of 2017 compared to the third quarter of 2016 reflected less favourable
impact of market related impacts driven by interest rates. Assumption changes and management actions in the third
quarter of 2017 had net favourable impacts in International and Group Benefits, and net unfavourable impacts in In-
force Management. Acquisition, integration and restructuring amounts were consistent with the same quarter in
prior year. Underlying net income in the third quarter of 2017 compared to the third quarter of 2016 reflected
improved morbidity experience in stop-loss and favourable mortality experience in the group life business, both
driven by improved underwriting experience in Group Benefits, as our pricing actions, investments in claims
management and expense initiatives continue to improve profitability. This was partially offset by unfavourable lapse
and other policyholder behaviour.
Q3 2017 vs. Q3 2016 (year-to-date)
SLF U.S.'s reported net income was US$259 million ($333 million) for the first nine months ended September 30,
2017, compared to reported net income of US$305 million ($402 million) for the same period last year. Underlying
net income was US$293 million ($381 million) in the first nine months of 2017, compared to US$274 million ($360
million) in the same period of 2016. The impact from the movement in the Canadian dollar in the first nine months of
2017 relative to average exchange rates in the first nine months of 2016 decreased reported net income and
underlying net income by $4 million.
Reported net income in the first nine months of 2017 compared to the first nine months of 2016 reflected favourable
market impacts primarily driven by interest rates and equity markets partially offset by unfavourable impact from
acquisition, integration and restructuring amounts. The impact of assumption changes and management actions in
the first nine months of 2017 was an unfavourable impact in In-force Management largely offset by a favourable

(ENR/MD&A) Third Quarter 2017/ sunlife.com 16
impact in International, primarily driven by the impact in the second quarter of 2017 which is described in section
M - Non-IFRS Financial Measures in this document.
Underlying net income in the first nine months of 2017 compared to the first nine months of 2016 reflected an
increase in gains from investing activities on insurance contract liabilities, improved morbidity experience in Group
Benefits, improved mortality experience in the group life business, and a full nine months of income from the
acquired group benefits business purchased in the prior year. These items were partially offset by unfavourable
policyholder behaviour in In-force Management and less favourable mortality experience in International.
Growth
Q3 2017 vs. Q3 2016
SLF U.S. life and health sales were US$174 million in the third quarter of 2017, compared to US$218 million in the
third quarter of 2016. Group Benefits sales decreased 22% compared to the third quarter of 2016, with decreases in
both employee benefits and medical stop-loss due to pricing discipline. In addition, we had fewer large case sales
and we achieved sales growth in the small-case and medium-case markets. International sales were consistent with
the third quarter of the prior year.
Q3 2017 vs. Q3 2016 (year-to-date)
SLF U.S. life and health sales were US$426 million in the first nine months of 2017, compared to US$450 million in
the same period of 2016. Group Benefits sales decreased 8% compared to the first nine months of 2016, with
decreases in both employee benefits and medical stop loss in light of pricing discipline and fewer large case sales.
International sales were up 14% in the first nine months in 2017 compared to the same period last year.

(ENR/MD&A) Third Quarter 2017/ sunlife.com 17
3. SLF Asset Management
Quarterly results Year-to-date
SLF Asset Management (C$ millions) Q3'17 Q2'17 Q3'16 2017 2016
Reported net income 185 183 181 539 531
Fair value adjustments on MFS's share-based payment awards (19 ) (16 ) (7 ) (47 ) 20
Underlying net income(1) 204 199 188 586 511
Assets under management (C$ billions)(1) 647.7 655.3 629.7 647.7 629.7
Gross sales (C$ billions)(1) 28.6 29.8 30.0 88.8 86.8
Net sales (C$ billions)(1) (1.9 ) (4.6 ) 0.1 (19.0 ) (1.8 )
MFS (C$ millions)
Reported net income 180 177 174 521 511
Underlying net income(1) 199 193 181 568 491
Assets under management (C$ billions)(1) 591.2 599.0 578.6 591.2 578.6
Gross sales (C$ billions)(1) 26.3 27.3 28.2 80.9 81.9
Net sales (C$ billions)(1) (3.3 ) (5.5 ) (1.2 ) (23.4 ) (4.0 )
(US$ millions)
Reported net income 143 132 133 399 386
Fair value adjustments on MFS's share-based payment awards (16 ) (12 ) (5 ) (37 ) 15
Underlying net income(1) 159 144 138 436 371
Pre-tax operating profit margin ratio(1) 41 % 36 % 38 % 38 % 37 %
Average net assets (US$ billions)(1) 468.2 453.2 437.8 453.1 420.0
Assets under management (US$ billions)(1)(2) 474.2 462.1 440.8 474.2 440.8
Gross sales (US$ billions)(1) 21.0 20.3 21.6 61.9 61.9
Net sales (US$ billions)(1) (2.7 ) (4.0 ) (0.9 ) (17.8 ) (3.0 )
Asset appreciation (depreciation) (US$ billions) 14.7 25.2 16.7 66.4 30.6
S&P 500 Index (daily average) 2,465 2,396 2,161 2,396 2,063
MSCI EAFE Index (daily average) 1,934 1,856 1,678 1,846 1,640
SLIM (C$ millions)
Reported net income and underlying net income(1)
5 6 7 18 20
Assets under management (C$ billions)(1) 56.5 56.3 51.1 56.5 51.1
Gross sales (C$ billions)(1)
2.3 2.5 1.8 7.8 4.9
Net sales (C$ billions)(1) 1.5 0.9 1.3 4.5 2.2
(1) Represents a non-IFRS financial measure. See section M - Non-IFRS Financial Measures in this document.
(2) Monthly information on AUM is provided by MFS in its Corporate Fact Sheet, which can be found in the "About MFS" section of its website at
www.mfs.com/CorpFact. The Corporate Fact Sheet also provides MFS's U.S. GAAP assets and liabilities as at December 31, 2016.
Profitability
Q3 2017 vs. Q3 2016
SLF Asset Management’s reported net income was $185 million in the third quarter of 2017, compared to $181
million in the third quarter of 2016. SLF Asset Management had underlying net income of $204 million in the third
quarter of 2017, compared to $188 million in the third quarter of 2016. The impact from the movement of the
Canadian dollar in the third quarter of 2017 relative to average exchange rates in the third quarter of 2016
decreased reported net income and underlying net income by $7 million and $8 million, respectively.
SLF Asset Management’s reported net income and underlying net income increased compared to the same quarter
in 2016 due to MFS's results as described below.

(ENR/MD&A) Third Quarter 2017/ sunlife.com 18
In U.S. dollars, MFS's reported net income was US$143 million in the third quarter of 2017, compared to US$133
million in the third quarter of 2016. MFS's underlying net income was US$159 million in the third quarter of 2017,
compared to US$138 million in the third quarter of 2016. MFS’s reported net income and underlying net income
increased in the third quarter of 2017 compared to the same period in 2016, primarily due to higher average net
assets. MFS's pre-tax operating profit margin ratio was 41% in the third quarter of 2017, up from 38% in the third
quarter of 2016 due primarily to higher average net assets and favourable impacts from expenses and investment
income.
SLIM's reported net income was $5 million compared to $7 million in the third quarter of 2016.
Q3 2017 vs. Q3 2016 (year-to-date)
SLF Asset Management’s reported net income for the first nine months ended September 30, 2017 was $539
million, compared to $531 million for the same period last year. Underlying net income was $586 million for the first
nine months of 2017, compared to $511 million for the nine months ended September 30, 2016. The impact from
the movement of the Canadian dollar in the first nine months of 2017 relative to average exchange rates in the first
nine months of 2016 decreased reported net income and underlying net income by $6 million.
MFS’s reported net income for the nine months ended September 30, 2017 was US$399 million, compared to
US$386 million for the same period last year. MFS's underlying net income was US$436 million for the first nine
months of 2017, compared to US$371 million for the nine months ended September 30, 2016. MFS's reported net
income reflected the impact of Fair value adjustments on MFS's share-based payment awards compared to the
same period last year. MFS’s reported and underlying net incomes in U.S. dollars for the first nine months of 2017
increased compared to the same period last year driven primarily by higher average net assets and lower taxes.
SLIM's reported net income for the nine months ended September 30, 2017 was $18 million compared to $20
million for the same period last year.
Growth
SLF Asset Management’s AUM was $647.7 billion as at September 30, 2017, compared to $624.8 billion as at
December 31, 2016. The increase in AUM was primarily due to asset appreciation, partially offset by unfavourable
currency impact and net outflows. MFS’s AUM was US$474.2 billion ($591.2 billion) as at September 30, 2017,
compared to US$425.6 billion ($571.6 billion) as at December 31, 2016. The increase of US$48.6 billion was
primarily driven by gross sales of US$61.9 billion and asset appreciation of US$66.4 billion, partially offset by
redemptions of US$79.7 billion. Net outflows at MFS were primarily driven by institutional Client portfolio re-
balancing and the trend to passive investing. 84%, 82% and 95% of MFS's retail fund assets ranked in the top half
of their Lipper categories based on three-, five-, and ten-year performance, respectively, as of September 30, 2017.
SLIM’s AUM was $56.5 billion as at September 30, 2017, compared to $53.2 billion as at December 31, 2016. This
increase was primarily due to net sales of $4.5 billion.
4. SLF Asia
Quarterly results
Year-to-date
($ millions) Q3'17 Q2'17 Q3'16 2017 2016
Reported net income (loss) 93 77 92 243 251
Market related impacts (4 ) (9 ) 5 (19 ) (19 )
Assumption changes and management actions 7 5 4 12 3
Acquisition, integration and restructuring — — 3 — 34
Underlying net income (loss)(1) 90 81 80 250 233
Reported ROE (%)(1) 8.8 7.2 9.0 7.6 8.7
Underlying ROE (%)(1) 8.4 7.6 7.8 7.8 8.1
Life & health sales(1) 163 149 168 484 452
Wealth sales(1) 3,607 2,949 2,402 9,453 5,757
(1) Represents a non-IFRS financial measure. See section M - Non-IFRS Financial Measures in this document.

(ENR/MD&A) Third Quarter 2017/ sunlife.com 19
Profitability
Q3 2017 vs. Q3 2016
SLF Asia's reported net income was $93 million in the third quarter of 2017, compared to reported net income of
$92 million in the third quarter of 2016. Underlying net income was $90 million, compared to $80 million in the third
quarter of 2016. The impact from the movement of the Canadian dollar in the third quarter of 2017 relative to
average exchange rates in the third quarter of 2016 reduced reported net income and underlying net income by $8
million and $7 million, respectively.
Reported net income in the third quarter of 2017 compared to the third quarter of 2016 reflected unfavourable
market related impacts, primarily driven by interest rates and equity market changes, partially offset by the
favourable impact of assumption changes and management actions. Underlying net income in the third quarter of
2017, compared to the third quarter of 2016, reflected growth in fee income business and higher level of gains from
available-for-sale ("AFS") assets.
Q3 2017 vs. Q3 2016 (year-to-date)
Reported net income was $243 million for the first nine months of 2017, compared to $251 million for the same
period last year. Underlying net income for the first nine months of 2017 was $250 million, compared to $233 million
in the same period last year. The unfavourable impact of the change in the Canadian dollar in the first nine months
of 2017 relative to average exchange rates in the same period last year decreased reported net income and
underlying net income by $12 million and $13 million, respectively.
Reported net income in the first nine months of 2017 compared to the first nine months of 2016 reflected favourable
impact from assumption changes and management actions. The first nine months of 2016 reflected the favourable
impact of acquisition, integration and restructuring amounts related to remeasuring our existing investment to fair
value upon acquiring control over the operations of Sun Life Vietnam and over the operations of CIMB Sun Life in
Indonesia. Underlying net income for the first nine months of 2017 compared to first nine months of 2016 reflected
growth in fee income business and higher level of gains from AFS assets.
Growth
Q3 2017 vs. Q3 2016
SLF Asia life and health sales were $163 million in the third quarter of 2017, compared to $168 million in the third
quarter of 2016. Total individual insurance sales decreased 4% compared to the third quarter of 2016 due to the
strengthening of the Canadian dollar and lower sales in Hong Kong. On a constant currency basis, individual
insurance sales increased 3%. Momentum in our Most Respected Advisor initiative drove higher agency sales and
continues to deepen our relationship with key distribution partners across the region.
SLF Asia wealth sales were $3.6 billion in the third quarter of 2017, compared to $2.4 billion in the third quarter of
2016. Strong wealth sales were led by growth in equity and fixed income funds in our Indian joint venture mutual
fund company, Aditya Birla Sun Life AMC Limited, and our asset management company in the Philippines, as well
as our growing pensions business in Hong Kong.
Q3 2017 vs. Q3 2016 (year-to-date)
SLF Asia life and health sales were $484 million in the first nine months of 2017, compared to $452 million in the
first nine months of 2016. Total individual insurance sales in the first nine months of 2017 increased 8% from the
first nine months of 2016. On a constant currency basis, individual insurance sales increased 12%. Sales increased
in all markets with the exception of Hong Kong driven by organic growth as well as our increase in ownership in
Indonesia, Vietnam and India.
SLF Asia wealth sales were $9.5 billion in the first nine months of 2017, compared to $5.8 billion in the first nine
months of 2016. Exceptional wealth sales were driven by growth in our mutual fund operations in India and the
Philippines, as well as our Hong Kong pensions business.

(ENR/MD&A) Third Quarter 2017/ sunlife.com 20
5. Corporate
Quarterly results Year-to-date
($ millions) Q3'17 Q2'17 Q3'16 2017 2016
SLF U.K. 72 58 86 175 158
Corporate Support (68 ) (30 ) (59 ) (139 ) (123 )
Reported net income (loss) 4 28 27 36 35
Market related impacts 7 6 4 5 (7 )
Assumption changes and management actions 33 23 13 65 14
Acquisition, integration and restructuring(1) (2 ) (1 ) — (5 ) 1
Underlying net income (loss)(2) (34 ) — 10 (29 ) 27
(1) Acquisition, integration and restructuring amounts consisted primarily of acquisition and integration costs from Bentall Kennedy Group of
Companies, Prime Advisors, Inc. and Ryan Labs Asset Management Inc. in Corporate Support.
(2) Represents a non-IFRS financial measure. See section M - Non-IFRS Financial Measures in this document.
Profitability
Q3 2017 vs. Q3 2016
Corporate had reported net income of $4 million in the third quarter of 2017, compared to $27 million in the third
quarter of 2016. Reported net income in Corporate in the third quarter of 2017 reflected the favourable impact of
assumption changes and management actions. Underlying net loss was $34 million, compared to underlying net
income of $10 million in the third quarter of 2016. The impact from the movement of the Canadian dollar relative to
the U.K. pound in the third quarter of 2017 relative to average exchange rates in the third quarter of 2016
decreased reported net income by C$3 million and increased underlying net loss by $1 million.
SLF U.K.'s reported net income in the third quarter of 2017 compared to the third quarter of 2016 reflected
favourable mortality and favourable impact of assumption changes and management actions offset by lower level of
gains from investing activity on insurance contract liabilities compared to strong gains in the third quarter of 2016.
Corporate Support had a reported net loss of $68 million in the third quarter of 2017, compared to a reported net
loss of $59 million in the third quarter of 2016. The increase in loss was primarily due to higher expenses and the
resolution of tax matters in the quarter.
Q3 2017 vs. Q3 2016 (year-to-date)
The reported net income was $36 million in the Corporate segment for the nine months ended September 30, 2017,
compared to a reported net income of $35 million for the same period last year. Reported net income in Corporate
in the first nine months of 2017 reflected favourable impact of assumption changes and management actions.
Underlying net loss was $29 million in the nine months ended September 30, 2017, compared to an underlying net
income of $27 million in the nine months ended September 30, 2016. The impact from the movement of the
Canadian dollar relative to the U.K. pound in the first nine months of 2017 relative to average exchange rates in the
same period last year decreased reported net income by $19 million and increased underlying net loss by $11
million.
SLF U.K.'s reported net income in the nine months ended September 30, 2017 compared to the same period in
2016 reflected the favourable impact of assumption changes and management actions, improved equity markets
and favourable mortality experience, partially offset by lower level of gains from investing activity on insurance
contract liabilities compared to strong gains in the same period of 2016.
In Corporate Support, the reported net loss for the nine months ended September 30, 2017 was $139 million
compared to a reported net loss of $123 million for the same period last year. The first nine months of 2017
reflected higher expenses.
(ENR/MD&A) Third Quarter 2017/ sunlife.com 21
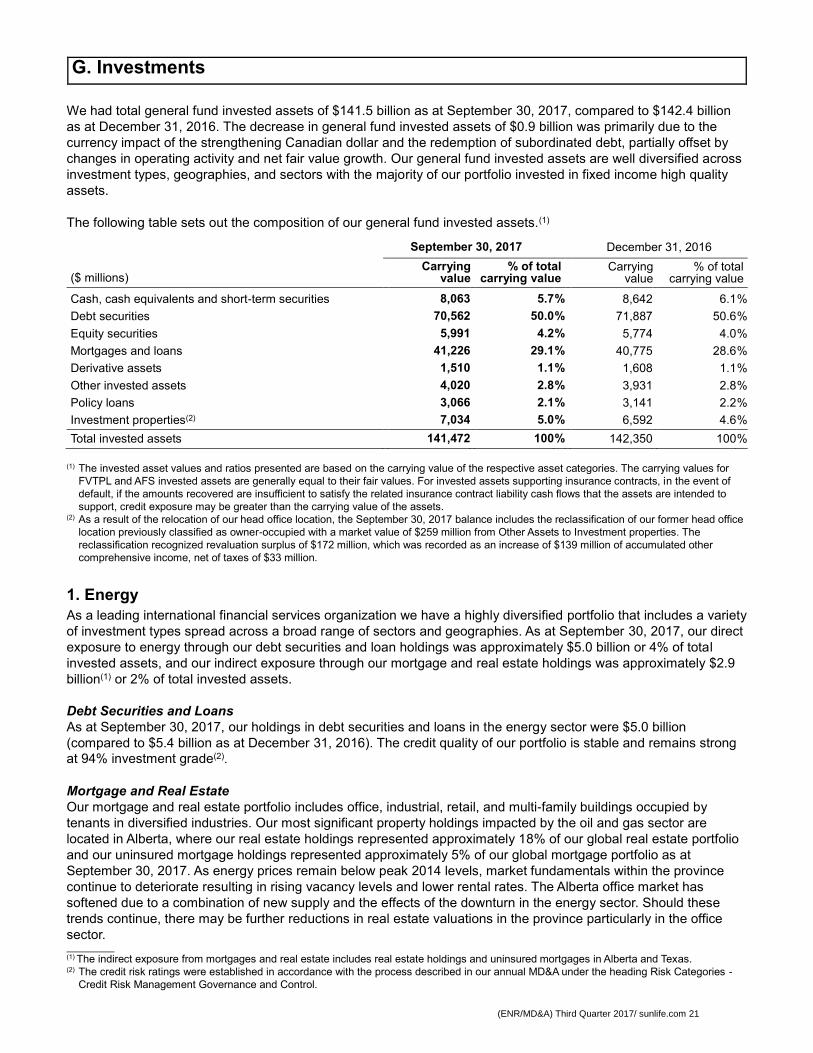
G. Investments
We had total general fund invested assets of $141.5 billion as at September 30, 2017, compared to $142.4 billion
as at December 31, 2016. The decrease in general fund invested assets of $0.9 billion was primarily due to the
currency impact of the strengthening Canadian dollar and the redemption of subordinated debt, partially offset by
changes in operating activity and net fair value growth. Our general fund invested assets are well diversified across
investment types, geographies, and sectors with the majority of our portfolio invested in fixed income high quality
assets.
The following table sets out the composition of our general fund invested assets.(1)
September 30, 2017 December 31, 2016
($ millions) Carrying
value % of total
carrying value Carrying
value % of total
carrying value
Cash, cash equivalents and short-term securities 8,063 5.7 % 8,642 6.1 %
Debt securities 70,562 50.0 % 71,887 50.6 %
Equity securities 5,991 4.2 % 5,774 4.0 %
Mortgages and loans 41,226 29.1 % 40,775 28.6 %
Derivative assets 1,510 1.1 % 1,608 1.1 %
Other invested assets 4,020 2.8 % 3,931 2.8 %
Policy loans 3,066 2.1 % 3,141 2.2 %
Investment properties(2) 7,034 5.0 % 6,592 4.6 %
Total invested assets 141,472 100 % 142,350 100 %
(1) The invested asset values and ratios presented are based on the carrying value of the respective asset categories. The carrying values for
FVTPL and AFS invested assets are generally equal to their fair values. For invested assets supporting insurance contracts, in the event of
default, if the amounts recovered are insufficient to satisfy the related insurance contract liability cash flows that the assets are intended to
support, credit exposure may be greater than the carrying value of the assets.
(2) As a result of the relocation of our head office location, the September 30, 2017 balance includes the reclassification of our former head office
location previously classified as owner-occupied with a market value of $259 million from Other Assets to Investment properties. The
reclassification recognized revaluation surplus of $172 million, which was recorded as an increase of $139 million of accumulated other
comprehensive income, net of taxes of $33 million.
1. Energy
As a leading international financial services organization we have a highly diversified portfolio that includes a variety
of investment types spread across a broad range of sectors and geographies. As at September 30, 2017, our direct
exposure to energy through our debt securities and loan holdings was approximately $5.0 billion or 4% of total
invested assets, and our indirect exposure through our mortgage and real estate holdings was approximately $2.9
billion(1) or 2% of total invested assets.
Debt Securities and Loans
As at September 30, 2017, our holdings in debt securities and loans in the energy sector were $5.0 billion
(compared to $5.4 billion as at December 31, 2016). The credit quality of our portfolio is stable and remains strong
at 94% investment grade(2).
Mortgage and Real Estate
Our mortgage and real estate portfolio includes office, industrial, retail, and multi-family buildings occupied by
tenants in diversified industries. Our most significant property holdings impacted by the oil and gas sector are
located in Alberta, where our real estate holdings represented approximately 18% of our global real estate portfolio
and our uninsured mortgage holdings represented approximately 5% of our global mortgage portfolio as at
September 30, 2017. As energy prices remain below peak 2014 levels, market fundamentals within the province
continue to deteriorate resulting in rising vacancy levels and lower rental rates. The Alberta office market has
softened due to a combination of new supply and the effects of the downturn in the energy sector. Should these
trends continue, there may be further reductions in real estate valuations in the province particularly in the office
sector. (1) The indirect exposure from mortgages and real estate includes real estate holdings and uninsured mortgages in Alberta and Texas.
(2) The credit risk ratings were established in accordance with the process described in our annual MD&A under the heading Risk Categories -
Credit Risk Management Governance and Control.

(ENR/MD&A) Third Quarter 2017/ sunlife.com 22
Within our Alberta mortgage and real estate portfolio, there has been no significant increase in arrears, mortgage
defaults, and tenant insolvencies. There has been downward pressure on real estate in the province of Alberta, and
we continue to closely monitor the effects of market changes in the energy sector on the real estate and mortgage
portfolios.
2. Debt Securities
Our debt securities portfolio is actively managed through a regular program of purchases and sales aimed at
optimizing yield, quality, and liquidity, while ensuring that it remains well diversified and duration-matched to
insurance contract liabilities.
With the exception of certain countries where we have business operations, including Canada, the United States,
the United Kingdom and the Philippines, our exposure to debt securities from any single country did not exceed 1%
of total invested assets on our Consolidated Statements of Financial Position as at September 30, 2017.
Debt securities with a credit rating of "A" or higher represented 70.6% of the total debt securities as at
September 30, 2017, compared to 69.6% as at December 31, 2016. Debt securities with a credit rating of “BBB” or
higher represented 98.3% of total debt securities as at September 30, 2017, compared to 97.6% as at December
31, 2016.
The carrying value of debt securities of governments and financial institutions by geographic location is presented in
the following table.
Debt Securities of Governments and Financial Institutions by Geography
September 30, 2017 December 31, 2016
($ millions) Government issued
or guaranteed Financials Government issued or
guaranteed Financials
Canada 17,326 1,715 17,371 1,476
United States 1,907 4,734 1,890 4,733
United Kingdom 2,069 1,006 2,201 1,085
Philippines 2,365 12 2,619 15
Eurozone(1) 189 726 219 697
Other 1,314 1,293 1,305 1,297
Total(2) 25,170 9,486 25,605 9,303
% of Total Invested Assets 17.8 % 6.7 % 18.0 % 6.5 %
% of Total Debt Securities 35.7 % 13.4 % 35.6 % 12.9 %
(1) Our investments in Eurozone countries primarily included the Netherlands, Spain, Germany, and France. Of our exposure to Eurozone
countries, 100.0% was rated investment grade and 83.8% had a credit rating of "A" or higher as at September 30, 2017 and 99.8% was rated
investment grade and 83.5% had a credit rating of "A" or higher as at December 31, 2016.
(2) The credit risk ratings were established in accordance with the process described in our annual MD&A under the heading Risk Categories -
Credit Risk Management Governance and Control.
Our gross unrealized losses as at September 30, 2017 for FVTPL and AFS debt securities were $0.50 billion and
$0.12 billion, respectively, compared with $0.72 billion and $0.14 billion, respectively, as at December 31, 2016.
Our debt securities as at September 30, 2017 included $6.0 billion of asset-backed securities, representing 8.5% of
our total debt securities, or 4.2% of our total invested assets. This compares to $5.9 billion, representing 8.3% of
total debt securities, or 4.2% of our total invested assets as at December 31, 2016.
3. Mortgages and Loans
Mortgages and loans disclosures in this section are presented at their carrying value on our Consolidated
Statements of Financial Position. As at September 30, 2017, we had $41.2 billion in mortgages and loans,
representing 29.1% of our total invested assets, compared to $40.8 billion representing 28.6% as at December 31,
2016. Our mortgage portfolio consisted almost entirely of first mortgages, and our loan portfolio consisted of private
placement assets.
The carrying value of mortgages and loans by geographic location is presented in the following table.(1)

(ENR/MD&A) Third Quarter 2017/ sunlife.com 23
Mortgages and Loans by Geography
September 30, 2017 December 31, 2016
($ millions) Mortgages Loans Total Mortgages Loans Total
Canada 8,320 13,213 21,533 8,234 13,120 21,354
United States 6,841 8,929 15,770 7,162 8,562 15,724
United Kingdom — 1,352 1,352 — 803 803
Other — 2,571 2,571 — 2,894 2,894
Total 15,161 26,065 41,226 15,396 25,379 40,775
% of Total Invested Assets 10.7 % 18.4 % 29.1 % 10.8 % 17.8 % 28.6 %
(1) The geographic location for mortgages is based on the location of the property and for loans it is based on the country of the creditor's parent.
As at September 30, 2017, we held $15.2 billion of mortgages, compared to $15.4 billion as at December 31, 2016.
Our mortgage portfolio consists entirely of commercial mortgages, including retail, office, multi-family, industrial, and
land properties. As at September 30, 2017, 28.9% of our commercial mortgage portfolio consisted of multi-family
residential mortgages; there are no single family mortgages. Our uninsured commercial portfolio had a weighted
average loan-to-value ratio of 55% as at September 30, 2017, consistent with December 31, 2016. While we
generally limit the maximum loan-to-value ratio to 75% at issuance, we may invest in mortgages with a higher loan-
to-value ratio in Canada if the mortgage is insured by the Canada Mortgage and Housing Corporation ("CMHC").
The estimated weighted average debt service coverage for our uninsured commercial portfolio is 1.78 times. Of the
$3.2 billion of multi-family residential loans in the Canadian commercial mortgage portfolio, 90.3% were insured by
the CMHC.
As at September 30, 2017, we held $26.1 billion of loans, compared to $25.4 billion as at December 31, 2016.
Private placement assets provide diversification by type of loan, industry segment, and borrower credit quality. The
loan portfolio consists of senior secured and unsecured loans to large- and mid-market sized corporate borrowers,
securitized lease/loan obligations secured by a variety of assets, and project finance loans in sectors such as power
and infrastructure. Our strategy is to continue to focus our efforts on the origination of new private placement
assets.
The gross carrying value and allowance for mortgages and loans past due or impaired is presented in the following
table.

(ENR/MD&A) Third Quarter 2017/ sunlife.com 24
Mortgages and Loans Past Due or Impaired
September 30, 2017
Gross carrying value Allowance for losses
($ millions) Mortgages Loans Total Mortgages Loans Total
Not past due 15,143
26,005
41,148 —
—
—
Past due:
Past due less than 90 days 8 — 8 — — —
Past due 90 days or more
— — — — — —
Impaired 31 90 121 21 (1 ) 30 51
Total 15,182 26,095 41,277 21 30 51
December 31, 2016
Gross carrying value Allowance for losses
($ millions) Mortgages Loans Total Mortgages Loans Total
Not past due 15,378
25,379
40,757 —
—
—
Past due:
Past due less than 90 days 2 — 2 — — —
Past due 90 days or more — — — — — —
Impaired 39 7 46 23 (1) 7 30
Total 15,419 25,386 40,805 23 7 30
(1) Includes $19 million of sectoral provisions as at September 30, 2017 and $21 million of sectoral provisions as at December 31, 2016.
Our impaired mortgages and loans, net of allowance for losses, were $70 million as at September 30, 2017,
compared to $16 million as at December 31, 2016. The increase of $54 million in impaired loans was primarily due
to the addition of two creditors in the first quarter of 2017.
4. Derivative Financial Instruments
The values associated with our derivative instruments are presented in the following table. Notional amounts serve
as the basis for payments calculated under derivatives contracts and are generally not exchanged.
Derivative Instruments
($ millions) September 30, 2017 December 31, 2016
Net fair value asset (liability) (313 ) (904 )
Total notional amount 53,363 54,350
Credit equivalent amount 534 510
Risk-weighted credit equivalent amount 5 5
The total notional amount of derivatives in our portfolio decreased to $53.4 billion as at September 30, 2017, from
$54.4 billion as at December 31, 2016.
The fair value of derivatives was a net liability of $313 million as at September 30, 2017, compared to a net
liability of $904 million as at December 31, 2016. The increase in net fair value was due primarily to increases in
fair value of our foreign exchange contracts, partially offset by a decrease in fair value of our interest rate
contracts.
5. Asset Default Provision
We make provisions for possible future credit events in the determination of our insurance contract liabilities. The
amount of the provision for asset default included in insurance contract liabilities is based on possible reductions in
future investment yields that vary by factors such as type of asset, asset credit quality (rating), duration, and country
of origin. To the extent that an asset is written off, or disposed of, any amounts that were set aside in our insurance
contract liabilities for possible future asset defaults in respect of that asset are released.

(ENR/MD&A) Third Quarter 2017/ sunlife.com 25
Our asset default provision reflects the provision relating to future credit events for fixed income assets currently
held by the Company that support our insurance contract liabilities. Our asset default provision as at September 30,
2017 was $2,203 million compared to $2,247 million as at December 31, 2016. The decrease of $44 million was
primarily due to strengthening of the Canadian dollar and the release of provisions on fixed income assets
supporting our insurance contract liabilities, partially offset by increases in the provision for assets purchased, net of
dispositions.
H. Risk Management
The Company has established a Risk Management Framework to assist in identifying, measuring, managing,
monitoring and reporting risks. The Risk Management Framework covers all risks and these have been grouped
into six major categories: credit, market, insurance, business and strategic, operational and liquidity risks.
Through our enterprise risk management processes, we oversee the various risk factors identified in the Risk
Management Framework and provide reports to senior management and to the Board Committees at least
quarterly. Our enterprise risk management processes and risk factors are described in our annual MD&A and AIF.
When referring to segregated funds in this section, it is inclusive of segregated fund guarantees, variable annuities
and investment products and includes Run-off reinsurance in our Corporate business segment.
1. Market Risk Sensitivities
Our net income(1) is affected by the determination of policyholder obligations under our annuity and insurance
contracts. These amounts are determined using internal valuation models and are recorded in our Annual
Consolidated Financial Statements, primarily as Insurance contract liabilities. The determination of these obligations
requires management to make assumptions about the future level of equity market performance, interest rates,
credit and swap spreads and other factors over the life of our products. Differences between our actual experience
and our best estimate assumptions are reflected in our Annual Consolidated Financial Statements. Refer to 7 -
Additional Cautionary Language and Key Assumptions Related to Sensitivities in this section for important
additional information regarding these estimates.
The market value of our investments in fixed income and equity securities fluctuates based on movements in
interest rates and equity markets. The market value of fixed income assets designated as AFS that are held
primarily in our surplus segment increases with declining interest rates and decreases with rising interest rates. The
market value of equities designated as AFS and held primarily in our surplus segment increases (decreases) with
rising (declining) equity markets. Changes in the market value of AFS assets flow through other comprehensive
income ("OCI") and are only recognized in net income when realized upon sale, or when considered impaired. The
amount of realized gains (losses) recorded in net income in any period is equal to the unrealized gains (losses) or
OCI position at the start of the period plus the change in market value during the current period up to the point of
sale for those securities that were sold during the period. The sale or impairment of AFS assets held in surplus can
therefore have the effect of modifying our net income sensitivity.
We realized $41 million (pre-tax) in net gains on the sale of AFS assets during the third quarter of 2017 ($53 million
pre-tax in the third quarter of 2016). The net unrealized gains or OCI position on AFS fixed income and equity
assets were $119 million and $142 million, respectively, after-tax as at September 30, 2017 ($86 million and $125
million, respectively, after-tax as at December 31, 2016).
(1) Net income refers to common shareholders' net income in section H - Risk Management in this document.

(ENR/MD&A) Third Quarter 2017/ sunlife.com 26
The following table sets out the estimated immediate impact on or sensitivity of our net income and OCI, and Sun
Life Assurance's MCCSR ratio to certain instantaneous changes in interest rates and equity market prices as at
September 30, 2017 and December 31, 2016.
Interest Rate and Equity Market Sensitivities
As at September 30, 2017(1) ($ millions, unless otherwise noted)
Interest rate sensitivity(2)(6) 100 basis point decrease
50 basis point decrease
50 basis point increase
100 basis point increase
Potential impact on net income(3)(6) $ (250 ) $ (100 ) $ 50 $ 100
Potential impact on OCI $ 550 $ 250 $ (250 ) $ (500 )
Potential impact on MCCSR(4) 9% points decrease
4% points decrease
4% points increase
8% points increase
Equity markets sensitivity(5) 25% decrease 10% decrease 10% increase 25% increase
Potential impact on net income(3) $ (300 ) $ (100 ) $ 100 $ 250
Potential impact on OCI $ (150 ) $ (50 ) $ 50 $ 150
Potential impact on MCCSR(4) 3% points decrease
1% points decrease
2% points increase
3% points increase
As at December 31, 2016(1) ($ millions, unless otherwise noted)
Interest rate sensitivity(2)(6) 100 basis point decrease
50 basis point decrease
50 basis point increase
100 basis point increase
Potential impact on net income(3)(6) $ (200 ) $ (100 ) $ 50
$ 50
Potential impact on OCI $ 550 $ 250 $ (250 ) $ (500 )
Potential impact on MCCSR(4) 8% points decrease
3% points decrease 4% points increase 7% points increase
Equity markets sensitivity(5) 25% decrease 10% decrease 10% increase 25% increase
Potential impact on net income(3) $ (300 ) $ (100 ) $ 100 $ 250
Potential impact on OCI $ (150 ) $ (50 ) $ 50 $ 150
Potential impact on MCCSR(4) 3% points decrease
1% points decrease 2% points increase 4% points increase
(1) Net income and OCI sensitivities have been rounded to the nearest $50 million. The sensitivities exclude the market impacts on the income
from our joint ventures and associates, which we account for on an equity basis.
(2) Interest rate sensitivities assume a parallel shift in assumed interest rates across the entire yield curve as at September 30, 2017 and December 31, 2016 with no change to the ASB promulgated URR. Variations in realized yields based on factors such as different terms to maturity and geographies may result in realized sensitivities being significantly different from those illustrated above. Sensitivities include the impact of re-balancing interest rate hedges for dynamic hedging programs at 10 basis point intervals (for 50 basis point changes in interest rates) and at 20 basis point intervals (for 100 basis point changes in interest rates).
(3) The market risk sensitivities include the estimated mitigation impact of our hedging programs in effect as at September 30, 2017 and December 31, 2016, and include new business added and product changes implemented prior to such dates.
(4) The MCCSR sensitivities illustrate the impact on Sun Life Assurance as at September 30, 2017 and December 31, 2016. This excludes the impact on assets and liabilities that are in SLF Inc. but not included in Sun Life Assurance.
(5) Represents the respective change across all equity markets as at September 30, 2017 and December 31, 2016. Assumes that actual equity exposures consistently and precisely track the broader equity markets. Since in actual practice equity-related exposures generally differ from broad market indices (due to the impact of active management, basis risk, and other factors), realized sensitivities may differ significantly from those illustrated above. Sensitivities include the impact of re-balancing equity hedges for dynamic hedging programs at 2% intervals (for 10% changes in equity markets) and at 5% intervals (for 25% changes in equity markets).
(6) The majority of interest rate sensitivity, after hedging, is attributed to individual insurance products. We also have interest rate sensitivity, after hedging, from our fixed annuity and segregated funds products.
Our net income and MCCSR sensitivities to interest rates have changed since December 31, 2016. The increase in
sensitivity to interest rates is primarily the result of assumption changes and management actions in the first nine
months of 2017.

(ENR/MD&A) Third Quarter 2017/ sunlife.com 27
2. Credit Spread and Swap Spread Sensitivities We have estimated the immediate impact or sensitivity of our net income attributable to certain instantaneous
changes in credit and swap spreads. The credit spread sensitivities reflect the impact of changes in credit spreads
on our asset and liability valuations (including non-sovereign fixed income assets, provincial governments,
corporate bonds, and other fixed income assets). The swap spread sensitivities reflect the impact of changes in
swap spreads on swap-based derivative positions and liability valuations.
Credit Spread Sensitivities ($ millions, after-tax)
Net income sensitivity(1)(2) 50 basis point decrease 50 basis point increase
September 30, 2017 $ (100 ) $ 100
December 31, 2016 $ (125 ) $ 125
(1) Sensitivities have been rounded to the nearest $25 million.
(2) In most instances, credit spreads are assumed to revert to long-term insurance contract liability assumptions generally over a five-year period.
Swap Spread Sensitivities ($ millions, after-tax)
Net income sensitivity(1) 20 basis point decrease 20 basis point increase
September 30, 2017 $ 25 $ (25 )
December 31, 2016 $ 25 $ (25 )
(1) Sensitivities have been rounded to the nearest $25 million.
The credit and swap spread sensitivities assume a parallel shift in the indicated spreads across the entire term
structure. Variations in realized spread changes based on different terms to maturity, geographies, asset classes
and derivative types, underlying interest rate movements, and ratings may result in realized sensitivities being
significantly different from those provided above. The credit spread sensitivity estimates exclude any credit spread
impact that may arise in connection with asset positions held in segregated funds. Spread sensitivities are provided
for the consolidated entity and may not be proportional across all reporting segments. Refer to 7 - Additional
Cautionary Language and Key Assumptions Related to Sensitivities in this section for important additional
information regarding these estimates.
3. General Account Insurance and Annuity Products
Most of our expected sensitivity to changes in interest rates and about two-thirds of our expected sensitivity to
changes in equity markets are derived from our general account insurance and annuity products. We have
implemented market risk management strategies to mitigate a portion of the market risk related to our general
account insurance and annuity products.
Individual insurance products include universal life and other long-term life and health insurance products. Major
sources of market risk exposure for individual insurance products include the reinvestment risk related to future
premiums on regular premium policies, asset reinvestment risk on both regular premium and single premium
policies, and the guaranteed cost of insurance. Interest rate risk for individual insurance products is typically
managed on a duration basis, within tolerance ranges set out in the applicable investment policy or guidelines.
Targets and limits are established so that the level of residual exposure is commensurate with our risk appetite.
Exposures are monitored frequently, and assets are re-balanced as necessary to maintain compliance within policy
limits using a combination of assets and derivative instruments. A portion of the longer-term cash flows are backed
with equities and real estate.
For participating insurance products and other insurance products with adjustability features, the investment
strategy objective is to provide a total rate of return given a constant risk profile over the long term.
Fixed annuity products generally provide the policyholder with a guaranteed investment return or crediting rate.
Interest rate risk for these products is typically managed on a duration basis, within tolerance ranges set out in the
applicable investment guidelines. Targets and limits are established such that the level of residual exposure is
commensurate with our risk appetite. Exposures are monitored frequently, and are re-balanced as necessary to
maintain compliance within prescribed tolerances using a combination of fixed income assets and derivative
instruments.

(ENR/MD&A) Third Quarter 2017/ sunlife.com 28
Certain insurance and annuity products contain minimum interest rate guarantees. Market risk management
strategies are implemented to limit potential financial loss due to reductions in asset earned rates relative to
contract guarantees. These typically involve the use of hedging strategies utilizing interest rate derivatives such as
interest rate floors, swaps, and swaptions.
Certain insurance and annuity products contain features which allow the policyholders to surrender their policy at
book value. Market risk management strategies are implemented to limit the potential financial loss due to changes
in interest rate levels and policyholder behaviour. These typically involve the use of hedging strategies such as
dynamic option replication and the purchase of interest rate swaptions.
Certain products have guaranteed minimum annuitization rates. Market risk management strategies are
implemented to limit the potential financial loss and typically involve the use of fixed income assets, interest rate
swaps, and swaptions.
4. Segregated Fund Guarantees
Approximately one-third of our equity market sensitivity and a small amount of interest rate risk sensitivity as at
September 30, 2017 are derived from segregated fund products. These products provide benefit guarantees, which
are linked to underlying fund performance and may be triggered upon death, maturity, withdrawal or annuitization.
The cost of providing these guarantees is uncertain and depends upon a number of factors including general capital
market conditions, our hedging strategies, policyholder behaviour and mortality experience, each of which may
result in negative impacts on net income and capital.
The following table provides information with respect to the guarantees provided for our segregated fund products.
As at September 30, 2017
($ millions) Fund value Amount at Risk(1) Value of
guarantees(2)
Insurance contract
liabilities(3)
SLF Canada 12,262 266 10,757 376
SLF U.S. 3,859 268 3,926 121
Run-off reinsurance(4) 2,500 408 1,606 404
Total 18,621 942 16,289 901
As at December 31, 2016
($ millions) Fund value Amount at Risk(1) Value of
guarantees(2)
Insurance contract
liabilities(3)
SLF Canada 12,354 348 10,961 499
SLF U.S. 4,361 430 4,681 171
Run-off reinsurance(4) 2,695 494 1,864 469
Total 19,410 1,272 17,506 1,139
(1) The Amount at Risk represents the excess of the value of the guarantees over fund values on all policies where the value of the guarantees
exceeds the fund value. The Amount at Risk is not currently payable as the guarantees are only payable upon death, maturity, withdrawal, or
annuitization if fund values remain below guaranteed values.
(2) For guaranteed lifetime withdrawal benefits, the value of guarantees is calculated as the present value of the maximum future withdrawals
assuming market conditions remain unchanged from current levels. For all other benefits, the value of guarantees is determined assuming
100% of the claims are made at the valuation date.
(3) The insurance contract liabilities represent management's provision for future costs associated with these guarantees and include a provision
for adverse deviation in accordance with Canadian actuarial standards of practice.
(4) The Run-off reinsurance business includes risks assumed through reinsurance of variable annuity products issued by various North American
insurance companies between 1997 and 2001. This line of business is part of a closed block of reinsurance, which is included in the
Corporate segment.
The movement of the items in the table above from December 31, 2016 to September 30, 2017 primarily resulted
from the following factors:
(i) the total fund values decreased due to the strengthening of the Canadian dollar against the U.S.
dollar and the net redemptions from legacy business, this was partially offset by favourable equity
market movements;

(ENR/MD&A) Third Quarter 2017/ sunlife.com 29
(ii) the total Amount at Risk decreased due to the strengthening of the Canadian dollar against the
U.S. dollar, favourable equity market movements and the net redemptions from legacy business;
(iii) the total value of guarantees decreased due to the strengthening of the Canadian dollar against the
U.S. dollar and the net redemptions from legacy business; and
(iv) the total insurance contract liabilities decreased due to the strengthening of the Canadian dollar
against the U.S. dollar, favourable equity market movements and the net redemptions from legacy
business.
5. Segregated Fund Hedging
Our hedging programs use derivative instruments to mitigate the interest and equity related exposure of our
segregated fund contracts. As at September 30, 2017, over 90% of our segregated fund contracts, as measured by
associated fund values, were included in a hedging program. While a large percentage of contracts are included in
the hedging program, not all of our market risk exposure related to these contracts is hedged. For those segregated
fund contracts included in the hedging program, we generally hedge the value of expected future net claims costs
and associated margins.
The following table illustrates the impact of our hedging program related to our sensitivity to a 50 basis point and
100 basis point decrease in interest rates and a 10% and 25% decrease in equity markets for segregated fund
contracts as at September 30, 2017 and December 31, 2016.
Impact of Segregated Fund Hedging
September 30, 2017
($ millions) Changes in interest rates(3) Changes in equity markets(4)
Net income sensitivity(1)(2) 50 basis point decrease
100 basis point decrease
10% decrease 25% decrease
Before hedging (200 ) (400 ) (200 ) (500 )
Hedging impact 200 400 150 400
Net of hedging — — (50 ) (100 )
December 31, 2016
($ millions) Changes in interest rates(3) Changes in equity markets(4)
Net income sensitivity(1)(2) 50 basis point decrease
100 basis point decrease
10% decrease 25% decrease
Before hedging (250 ) (550 ) (200 ) (550 )
Hedging impact 250 550 150 450
Net of hedging — — (50 ) (100 )
(1) Net income sensitivities have been rounded to the nearest $50 million.
(2) Since the fair value of benefits being hedged will generally differ from the financial statement value (due to different valuation methods and the
inclusion of valuation margins in respect of financial statement values), this will result in residual volatility to interest rate and equity market
shocks in net income and capital. The general availability and cost of these hedging instruments may be adversely impacted by a number of
factors, including volatile and declining equity and interest rate market conditions.
(3) Represents a parallel shift in assumed interest rates across the entire yield curve as at September 30, 2017 and December 31, 2016, with no
change to the ASB promulgated URR. Variations in realized yields based on factors such as different terms to maturity and geographies may
result in realized sensitivities being significantly different from those illustrated above. Sensitivities include the impact of re-balancing interest
rate hedges for dynamic hedging programs at 10 basis point intervals (for 50 basis point changes in interest rates) and at 20 basis point
intervals (for 100 basis point changes in interest rates).
(4) Represents the change across all equity markets as at September 30, 2017 and December 31, 2016. Assumes that actual equity exposures
consistently and precisely track the broader equity markets. Since in actual practice equity-related exposures generally differ from broad
market indices (due to the impact of active management, basis risk, and other factors), realized sensitivities may differ significantly from those
illustrated above. Sensitivities include the impact of re-balancing equity hedges for dynamic hedging programs at 2% intervals (for 10%
changes in equity markets) and at 5% intervals (for 25% changes in equity markets).
6. Real Estate Risk
Real estate risk is the potential for financial loss arising from fluctuations in the value of, or future cash flows from
our investments in real estate. We are exposed to real estate risk and may experience financial losses resulting
from the direct ownership of real estate investments or indirectly through fixed income investments secured by real
estate property, leasehold interests, ground rents, and purchase and leaseback transactions. Real estate price risk

(ENR/MD&A) Third Quarter 2017/ sunlife.com 30
may arise from external market conditions, inadequate property analysis, inadequate insurance coverage,
inappropriate real estate appraisals, or from environmental risk exposures. We hold direct real estate investments
that support general account liabilities and surplus, and fluctuations in value will impact our profitability and financial
position. A material and sustained increase in interest rates may lead to deterioration in real estate values. An
instantaneous 10% decrease in the value of our direct real estate investments as at September 30, 2017 would
decrease net income(1) by approximately $225 million ($200 million decrease as at December 31, 2016).
Conversely, an instantaneous 10% increase in the value of our direct real estate investments as at September 30,
2017 would increase net income by approximately $225 million ($200 million increase as at December 31, 2016).
7. Additional Cautionary Language and Key Assumptions Related to Sensitivities
Our market risk sensitivities are measures of our estimated change in net income and OCI for changes in interest
rates and equity market price levels described above, based on interest rates, equity market prices, and business
mix in place as at the respective calculation dates. These sensitivities are calculated independently for each risk
factor, generally assuming that all other risk variables stay constant. The sensitivities do not take into account
indirect effects such as potential impacts on goodwill impairment or valuation allowances on deferred tax assets.
The sensitivities are provided for the consolidated entity and may not be proportional across all reporting segments.
Actual results can differ materially from these estimates for a variety of reasons, including differences in the pattern
or distribution of the market shocks, the interaction between these risk factors, model error, or changes in other
assumptions such as business mix, effective tax rates, policyholder behaviour, currency exchange rates and other
market variables relative to those underlying the calculation of these sensitivities. The extent to which actual results
may differ from the indicative ranges will generally increase with larger capital market movements. Our sensitivities
as at December 31, 2016 have been included for comparative purposes only.
We have also provided measures of our net income sensitivity to instantaneous changes in credit spreads, swap
spreads, real estate price levels, and capital sensitivities to changes in interest rates and equity price levels. The
real estate sensitivities are non-IFRS financial measures. For additional information, see section M - Non-IFRS
Financial Measures in this document. The cautionary language which appears in this section is also applicable to
the credit spread, swap spread, real estate, and MCCSR ratio sensitivities. In particular, these sensitivities are
based on interest rates, credit and swap spreads, equity market, and real estate price levels as at the respective
calculation dates and assume that all other risk variables remain constant. Changes in interest rates, credit and
swap spreads, equity market, and real estate prices in excess of the ranges illustrated may result in other-than-
proportionate impacts.
As these market risk sensitivities reflect an instantaneous impact on net income, OCI, and Sun Life Assurance’s
MCCSR ratio, they do not include impacts over time such as the effect on fee income in our asset management
businesses.
The sensitivities reflect the composition of our assets and liabilities as at September 30, 2017 and December 31,
2016, respectively. Changes in these positions due to new sales or maturities, asset purchases/sales, or other
management actions could result in material changes to these reported sensitivities. In particular, these sensitivities
reflect the expected impact of hedging activities based on the hedge programs in place as at the September 30 and
December 31 calculation dates. The actual impact of hedging activity can differ materially from that assumed in the
determination of these indicative sensitivities due to ongoing hedge re-balancing activities, changes in the scale or
scope of hedging activities, changes in the cost or general availability of hedging instruments, basis risk (i.e., the
risk that hedges do not exactly replicate the underlying portfolio experience), model risk, and other operational risks
in the ongoing management of the hedge programs or the potential failure of hedge counterparties to perform in
accordance with expectations.
The sensitivities are based on methods and assumptions in effect as at September 30, 2017 and December 31,
2016, as applicable. Changes in the regulatory environment, accounting or actuarial valuation methods, models, or
assumptions (including changes to the ASB promulgated URR) after those dates could result in material changes to
these reported sensitivities. Changes in interest rates and equity market prices in excess of the ranges illustrated
may result in other than proportionate impacts.
Our hedging programs may themselves expose us to other risks, including basis risk (i.e., the risk that hedges do
not exactly replicate the underlying portfolio experience), volatility risk, derivative counterparty credit risk, and
increased levels of liquidity risk, model risk, and other operational risks. These factors may adversely impact the net
effectiveness, costs, and financial viability of maintaining these hedging programs and therefore adversely impact

(ENR/MD&A) Third Quarter 2017/ sunlife.com 31
(1) Net income sensitivities have been rounded to the nearest $25 million.
our profitability and financial position. While our hedging programs are intended to mitigate these effects (e.g.,
hedge counterparty credit risk is managed by maintaining broad diversification, dealing primarily with highly rated
counterparties, and transacting through International Swaps and Derivatives Association agreements that generally
include applicable credit support annexes), residual risk, potential reported earnings and capital volatility remain.
For the reasons outlined above, our sensitivities should only be viewed as directional estimates of the underlying
sensitivities of each factor under these specialized assumptions, and should not be viewed as predictors of our
future net income, OCI, and capital sensitivities. Given the nature of these calculations, we cannot provide
assurance that actual impact will be consistent with the estimates provided.
Information related to market risk sensitivities and guarantees related to segregated fund products should be read
in conjunction with the information contained in the sections in the annual MD&A under the headings Outlook and
Critical Accounting Policies and Estimates. Additional information on market risk can be found in Note 6 of our 2016
Annual Consolidated Financial Statements and the Risk Factors section in our AIF.
I. Additional Financial Disclosure
1. Revenue
Quarterly results Year-to-date
($ millions) Q3'17 Q2'17 Q3'16 2017 2016
Premiums
Gross 4,741 5,056 4,937 14,530 13,835
Ceded (1,025 ) (1,133 ) (1,049 ) (3,327 ) (3,206 )
Net premiums 3,716 3,923 3,888 11,203 10,629
Net investment income
Interest and other investment income 1,328 1,372 1,359 4,014 4,123
Fair value(1) and foreign currency changes on assets and liabilities
(974 ) 1,309
1,182 993 7,135
Net gains (losses) on available-for-sale assets 41 58 53 154 182
Fee income 1,444 1,460 1,410 4,322 4,138
Total revenue 5,555 8,122 7,892 20,686 26,207
Adjusted revenue(2) 7,456 7,461 7,406 22,142 21,135
(1) Represents the change in fair value of fair value through profit or loss ("FVTPL") assets and liabilities.
(2) Adjusted revenue is a non-IFRS financial measure that excludes from revenue the impact of Constant Currency Adjustment, FV Adjustment
and Reinsurance in SLF Canada's GB Operations Adjustment as described in section M - Non-IFRS Financial Measures in this document.
Revenue in the third quarter of 2017 was $5.6 billion, compared to $7.9 billion in the third quarter of 2016. The
decrease was mainly attributable to reductions in the fair value of FVTPL assets largely due to the increases in
interest rates in the third quarter in 2017 compared to decreases in interest rates in the same period last year. The
currency impact from the change in the Canadian dollar relative to average exchange rates in the third quarter of
2016 decreased revenue by $164 million.
Revenue was $20.7 billion for the nine months ended September 30, 2017, down $5.5 billion from the comparable
period last year. The decrease was mainly attributable to lower net gains in the fair value of FVTPL assets largely
due to movements in interest rates and tightening credit spreads in the first nine months of 2016 and impacts from
interest rates derivatives, partially offset by higher net premium revenue in SLF Canada and SLF U.S. The currency
impact from the change in the Canadian dollar relative to average exchange rates in the first nine months of 2016
decreased revenue by $205 million.
Adjusted revenue was $7.5 billion in the third quarter of 2017, slightly up from the third quarter of 2016. Adjusted
revenue of $22.1 billion for the nine months ended September 30, 2017 was $1.0 billion higher compared to the
same period last year. In both cases, the increase was primarily driven by higher net premium revenue in SLF

(ENR/MD&A) Third Quarter 2017/ sunlife.com 32
Canada, increased fee income from SLF Asset Management, SLF Canada, SLF U.S. and SLF Asia, partially offset
by lower net premium revenue in SLF Asia.
2. Changes in the Statements of Financial Position and in Shareholders’ Equity
Total general fund assets were $158.8 billion as at September 30, 2017, compared to $161.1 billion as at
December 31, 2016, primarily a result of a decrease of $4.9 billion from the strengthening of the Canadian dollar
relative to exchange rates at the end of the fourth quarter of 2016, partially offset by an increase of $1.6 billion from
business activities and $1.0 billion from the change in value of FVTPL assets and liabilities.
Insurance contract liabilities (excluding other policy liabilities and assets) of $107.5 billion as at September 30, 2017
decreased by $0.9 billion compared to December 31, 2016, mainly due to the currency impact from the change in
the Canadian dollar relative to exchange rates at the end of the fourth quarter of 2016, partially offset by balances
arising from new policies and changes in balances on in-force policies (which include fair value changes on FVTPL
assets supporting insurance contract liabilities).
Shareholders' equity, including preferred share capital, was $22.3 billion as at September 30, 2017, compared to
$22.0 billion as at December 31, 2016. The increase in shareholders' equity was primarily due to:
(i) shareholders' net income of $2.0 billion in 2017, before preferred share dividends of $70 million;
(ii) revaluation surplus from the transfer to investment properties of our former head office location of
$139 million;
(iii) net unrealized gains on AFS assets in OCI of $50 million;
(iv) changes in the remeasurement of defined benefit plans of $24 million; and
(v) $6 million from stock options exercised and $3 million from stock-based compensation; partially
offset by
(vi) a decrease of $882 million from the change of the Canadian dollar relative to exchange rates at the
end of the fourth quarter of 2016;
(vii) common share dividend payments of $792 million;
(viii) a decrease of $88 million from the repurchase and cancellation of common shares; and
(ix) a decrease of $55 million from OCI of joint ventures and associates.
As at October 27, 2017, SLF Inc. had 611,976,729 common shares, 3,230,077 options to acquire SLF Inc. common
shares, and 92,200,000 Class A Shares outstanding.
3. Cash Flows
Quarterly results Year-to-date
($ millions) Q3'17 Q3'16 2017 2016
Net cash and cash equivalents, beginning of period 5,424 4,791
6,509
6,512
Cash flows provided by (used in):
Operating activities 630 640 1,334 2,291
Investing activities (66 ) (151 ) (198 ) (1,792 )
Financing activities (453 ) 594 (1,999 ) (795 )
Changes due to fluctuations in exchange rates (104 ) 41 (215 ) (301 )
Increase (decrease) in cash and cash equivalents 7 1,124 (1,078 ) (597 )
Net cash and cash equivalents, end of period 5,431 5,915 5,431 5,915
Short-term securities, end of period 2,462 1,948 2,462 1,948
Net cash, cash equivalents and short-term securities, end of period 7,893 7,863 7,893 7,863
The operating activities of the Company generate cash flows which include net premium revenue, net investment
income, fee income, and the sale and maturity of investments. They are the principal source of funds to pay for
policyholder claims and benefits, commissions, operating expenses, and the purchase of investments. Cash flows
used in investing activities primarily include transactions related to associates, joint ventures and acquisitions. Cash
flows provided by and used in financing activities largely reflect capital transactions including payments of
dividends, the issuance and repurchase of shares, as well as the issuance and retirement of debt instruments and
preferred shares.

(ENR/MD&A) Third Quarter 2017/ sunlife.com 33
The lower cash flows used in investing activities in the third quarter of 2017 compared to the same period last year
were primarily due to the ownership increase in our Indonesia joint venture in the third quarter of 2016. The higher
cash flows used in financing activities in the third quarter of 2017 compared to the same period last year were
largely attributable to the issuance of senior debentures in the third quarter of 2016.
4. Goodwill Impairment Testing In the fourth quarter of 2017, we will perform our annual goodwill impairment testing. Testing is conducted by
comparing a cash generating unit's (“CGU's”) carrying value to its recoverable amount. We use the best evidence
of fair value less costs of disposal as the price obtainable for the sale of a CGU, or group of CGUs. Fair value less
costs of disposal is initially assessed by looking at recently completed market comparable transactions. In the
absence of such comparables, we use an appraisal methodology with market assumptions commonly used in the
valuation of insurance or asset management companies. Goodwill is not recognized as an asset for MCCSR
purposes and is deducted from available capital. Therefore, impairment charges against goodwill do not have any
impact on the calculation to determine MCCSR.
A listing of our CGUs as at December 31, 2016 and the goodwill allocated to them is included in Note 9 of our 2016
Annual Consolidated Financial Statements.
5. Quarterly Financial Results The following table provides a summary of our results for the eight most recently completed quarters. A more
complete discussion of our historical quarterly results can be found in our interim and annual MD&As for the
relevant periods.
Quarterly results
($ millions, unless otherwise noted) Q3'17 Q2'17 Q1'17 Q4'16 Q3'16 Q2'16 Q1'16 Q4'15
Total revenue 5,555 8,122 7,009 2,366 7,892 9,533 8,782 5,567
Common shareholders' net income (loss)
Reported 817 574 551 728 737 480 540 536
Underlying(1) 643 689 573 560 639 554 582 646
Diluted EPS ($)
Reported 1.32 0.93 0.89 1.18 1.20 0.78 0.88 0.87
Underlying(1) 1.05 1.12 0.93 0.91 1.04 0.90 0.95 1.05
Basic reported EPS ($)
Reported 1.33 0.93 0.90 1.19 1.20 0.78 0.88 0.88
Reported net income (loss) by segment
SLF Canada 340 185 266 398 184 185 169 210
SLF U.S. 195 101 37 106 253 54 95 100
SLF Asset Management 185 183 171 198 181 173 177 177
SLF Asia 93 77 73 58 92 68 91 73
Corporate 4 28 4 (32 ) 27 — 8 (24 )
Total reported net income (loss) 817 574 551 728 737 480 540 536
Underlying net income (loss) by segment(1)
SLF Canada 222 266 229 243 226 200 218 269
SLF U.S. 161 143 77 87 135 114 111 158
SLF Asset Management 204 199 183 188 188 153 170 183
SLF Asia 90 81 79 62 80 85 68 52
Corporate (34 ) — 5 (20 ) 10 2 15 (16 )
Total underlying net income (loss)(1) 643 689 573 560 639 554 582 646
(1) Represents a non-IFRS financial measure. See section M - Non-IFRS Financial Measures in this document.
Second Quarter 2017

(ENR/MD&A) Third Quarter 2017/ sunlife.com 34
Reported net income was $574 million in the second quarter of 2017, reflecting the unfavourable effect of market
related impacts driven by interest rate changes, the unfavourable impact of acquisition, integration and restructuring
amounts, fair value adjustments on MFS's share-based payment awards, and certain hedges in SLF Canada that
do not qualify for hedge accounting. Reported net income also reflected the factors discussed in underlying net
income. Underlying net income was $689 million, reflecting business growth, gains from investing activity on
insurance contract liabilities, positive credit experience and favourable morbidity and mortality experience, partially
offset by unfavourable lapse and other policyholder experience, unfavourable expense experience, including
investment in growing our businesses, and unfavourable other experience.
First Quarter 2017
Reported net income was $551 million in the first quarter of 2017, reflecting the favourable effect of market related
impacts partially offset by the unfavourable impact of acquisition, integration and restructuring amounts and fair
value adjustments on MFS's share-based payment awards. Reported net income also reflected the factors
discussed in underlying net income. Underlying net income was $573 million, reflecting favourable mortality
experience in SLF Canada and SLF U.K. and gains from investing activities on insurance contract liabilities,
partially offset by lapse and other policyholder behaviour experience and unfavourable mortality experience in SLF
U.S.
Fourth Quarter 2016
Reported net income was $728 million in the fourth quarter of 2016, reflecting favourable interest rate impacts.
Reported net income also reflected factors discussed in underlying net income. Underlying net income was $560
million, reflecting positive credit experience and a lower level of gains from investing activity on insurance contract
liabilities. This was partially offset by unfavourable expense experience, reflecting incentive compensation costs
arising from overall strong business performance and investment in growing our businesses. We also experienced
unfavourable morbidity results mainly in the U.S.
Third Quarter 2016
Reported net income was $737 million in the third quarter of 2016, reflecting favourable equity markets, interest
rates, and assumption changes and management actions. Reported net income also reflected factors discussed in
underlying net income. Underlying net income was $639 million, reflecting higher levels of gains from investment
activities on insurance contract liabilities, positive credit experience, and other experience items. This was partially
offset by mortality and expense experience, including investment in growing our businesses.
Second Quarter 2016
Reported net income was $480 million in the second quarter of 2016, reflecting unfavourable impact of interest
rates. Reported net income also reflected factors discussed in underlying net income. Underlying net income was
$554 million, reflecting unfavourable morbidity experience, mainly in SLF U.S. Group Benefits notably from the
stop-loss insurance business, and expense experience including investment in growing our businesses. This was
partially offset by gains from investment activity on insurance contract liabilities and positive credit experience.
First Quarter 2016
Reported net income was $540 million in the first quarter of 2016, reflecting unfavourable impacts from interest
rates and equity markets. Reported net income also reflected factors discussed in underlying net income.
Underlying net income was $582 million, reflecting favourable impact of strong investing activities and positive
morbidity experience.
Fourth Quarter 2015
Reported net income was $536 million in the fourth quarter of 2015 reflecting costs related to acquisition, integration
and restructuring and unfavourable interest rate impact. Reported net income also reflected factors discussed in
underlying net income. Underlying net income was $646 million, reflecting favourable impact from investment
activity on insurance contract liabilities largely in SLF Canada and SLF U.S., positive credit, morbidity and mortality
experience, and other experience items including a change to post-retirement benefit liabilities in SLF U.S., partially
offset by unfavourable expense experience including investment in growing our businesses.

(ENR/MD&A) Third Quarter 2017/ sunlife.com 35
J. Legal and Regulatory Matters
Information concerning legal and regulatory matters is provided in our Annual Consolidated Financial Statements,
annual MD&A, and AIF, for the year ended December 31, 2016.
K. Changes in Accounting Policies
We have adopted several amended IFRS standards in the current year. In addition, new IFRS standards were
issued in the current year. For additional information, refer to Note 2 in our Interim Consolidated Financial
Statements.
In May 2017, the IASB issued IFRS 17 Insurance Contracts ("IFRS 17"), which replaces IFRS 4 Insurance
Contracts. IFRS 17 establishes the principles for the recognition, measurement, presentation and disclosure of
insurance contracts. IFRS 17 requires entities to measure insurance contract liabilities at their current fulfillment
values using one of three measurement models, depending on the nature of the contract. IFRS 17 is effective for
annual periods beginning on or after January 1, 2021. IFRS 17 will affect how we account for our insurance
contracts and how we report our financial performance in our consolidated statement of operations. The adoption of
IFRS 17 will be a significant initiative for us and the industry. We are currently assessing the impact that IFRS 17
will have on our Consolidated Financial Statements.
L. Internal Control Over Financial Reporting
Management is responsible for establishing and maintaining adequate internal control over financial reporting to
provide reasonable assurance regarding the reliability of the Company's financial reporting and the preparation of
its financial statements in accordance with IFRS.
There were no changes in the Company's internal control over financial reporting during the period, which began on
July 1, 2017 and ended on September 30, 2017 that have materially affected, or are reasonably likely to materially
affect, the Company's internal control over financial reporting.
M. Non-IFRS Financial Measures
1. Updates to Non-IFRS measures Beginning in first quarter of 2017, we stopped reporting operating net income and its related measures, operating
earnings per share ("EPS") and operating return on equity ("ROE"), in order to streamline our use of non-IFRS
financial measures. The adjustments previously used to derive operating net income will continue to be used to
derive underlying net income.
2. Underlying net income and Underlying EPS Underlying net income (loss) and financial measures based on underlying net income (loss), including underlying
EPS or underlying loss per share, and underlying ROE, are non-IFRS financial measures. Underlying net income
(loss) removes from reported net income (loss) the impact of the following items that create volatility in our results
under IFRS and when removed assist in explaining our results from period to period:
(a) market related impacts, which include: (i) impact of returns in equity markets, net of hedging, above or below our
best estimate assumptions of approximately 2% per quarter in the reporting period. Equity market impact also
includes the impact of the basis risk inherent in our hedging program, which is the difference between the return
on underlying funds of products that provide benefit guarantees and the return on the derivative assets used to
hedge those benefit guarantees; (ii) the impact of changes in interest rate that differ from our best estimate
assumptions in the reporting period and on the value of derivative instruments used in our hedging programs
including changes in credit and swap spreads, and any changes to the assumed fixed income reinvestment rates
in determining the actuarial liabilities; and (iii) the impact of changes in the fair value of real estate properties in
the reporting period.

(ENR/MD&A) Third Quarter 2017/ sunlife.com 36
(b) assumption changes and management actions, which include: (i) the impact of revisions to the assumptions
used in determining our liabilities for insurance contracts and investment contracts and (ii) the impact on
insurance contracts and investment contracts of actions taken by management in the current reporting period,
referred to as management actions which include, for example, changes in the prices of in-force products, new
or revised reinsurance on in-force business, and material changes to investment policies for assets supporting
our liabilities;
(c) Other adjustments:
(i) certain hedges in SLF Canada that do not qualify for hedge accounting - this adjustment enhances the
comparability of our net income from period to period, as it reduces volatility to the extent it will be offset
over the duration of the hedges;
(ii) fair value adjustments on MFS's share-based payment awards, that are settled with MFS’s own shares and
accounted for as liabilities and measured at fair value each reporting period until they are vested, exercised
and repurchased - this adjustment enhances the comparability of MFS’s results with publicly traded asset
managers in the United States;
(iii) acquisition, integration and restructuring amounts (including impacts related to acquiring and integrating
acquisitions); and
(iv) other items that when removed assist in explaining our results from period to period.
All factors discussed in this document that impact our underlying net income are also applicable to reported net
income.
All EPS measures in this document refer to fully diluted EPS, unless otherwise stated. As noted above, underlying
EPS exclude the dilutive impact of convertible instruments.
The following table sets out the amounts that were excluded from our underlying net income (loss) and underlying
EPS, and provides a reconciliation to our reported net income (loss) and EPS based on IFRS.
Reconciliations of Select Net Income Measures

(ENR/MD&A) Third Quarter 2017/ sunlife.com 37
Quarterly results Year-to-date
($ millions, unless otherwise noted)
Q3'17 Q2'17 Q3'16 2017 2016
Reported net income 817
574
737
1,942
1,757
Equity market impact
Impact from equity market changes 24 (4 ) 27 38 33
Basis risk impact (6 ) 9 2 5 (8 )
Equity market impact 18 5 29 43 25
Interest rate impact(1)
Impact of interest rate changes 58 (65 ) 20 (4 ) (115 )
Impact of credit spread movements 2 (19 ) (14 ) (28 ) (16 )
Impact of swap spread movements 9 (8 ) 12 (15 ) 35
Interest rate impact 69 (92 ) 18 (47 ) (96 )
Impact of changes in the fair value of real estate 26 13 10 54 16
Market related impacts 113 (74 ) 57 50 (55 )
Assumption changes and management actions 103 11 54 115 35
Other adjustments:
Certain hedges in SLF Canada that do not qualify for hedge accounting
(6 ) (10 ) 6 (18 ) (13 )
Fair value adjustments on MFS's share-based payment awards (19 ) (16 ) (7 ) (47 ) 20
Acquisition, integration and restructuring (17 ) (26 ) (12 ) (63 ) (5 )
Total of other adjustments (42 ) (52 ) (13 ) (128 ) 2
Underlying net income (loss) 643 689 639 1,905 1,775
Reported EPS (diluted) ($) 1.32
0.93
1.20
3.16
2.85
Market related impacts ($) 0.18 (0.12 ) 0.09 0.08 (0.08 )
Assumption changes and management actions ($) 0.17 0.02 0.09 0.19 0.06
Certain hedges in SLF Canada that do not qualify for hedge accounting ($)
(0.01 ) (0.02 ) 0.01 (0.03 ) (0.02 )
Fair value adjustments on MFS's share-based payment awards ($) (0.03 ) (0.03 ) (0.01 ) (0.07 ) 0.03
Acquisition, integration and restructuring ($) (0.03 ) (0.04 ) (0.02 ) (0.10 ) (0.01 )
Impact of convertible securities on diluted EPS ($) (0.01 ) — — (0.01 ) (0.02 )
Underlying EPS (diluted) ($) 1.05 1.12 1.04 3.10 2.89
(1) Our exposure to interest rates varies by product type, line of business, and geography. Given the long-term nature of our business, we have a
higher degree of sensitivity in respect of interest rates at long durations.
3. Additional Non-IFRS Measures Management also uses the following non-IFRS financial measures:
Return on equity. IFRS does not prescribe the calculation of ROE and therefore a comparable measure under
IFRS is not available. To determine reported ROE and underlying ROE, respectively, reported net income (loss) and
underlying net income (loss) is divided by the total weighted average common shareholders’ equity for the period.
The quarterly ROE is annualized.
Financial leverage ratio. This total debt to total capital ratio is ratio of debt plus preferred shares to total capital,
where debt consists of all capital qualifying debt securities. Capital qualifying debt securities consist of subordinated
debt and innovative capital instruments.
Dividend payout ratio. This is the ratio of dividends paid to diluted underlying EPS for the period.
Sales. In SLF Canada, life and health sales consist of sales of individual insurance and group benefits products;
wealth sales consist of sales of individual wealth products and sales in GRS. In SLF U.S., life and health sales
consist of sales by Group Benefits and individual life sales by International. In SLF Asia, life and health sales
consist of the individual and group life and health sales by our subsidiaries and joint ventures and associates,
based on our proportionate equity interest, in the Philippines, Hong Kong, Indonesia, India, China, Malaysia, and
Vietnam; wealth sales consist of Hong Kong wealth sales, Philippines mutual fund sales, wealth sales by our India

(ENR/MD&A) Third Quarter 2017/ sunlife.com 38
and China insurance joint ventures and associates, and Aditya Birla Sun Life AMC Limited's equity and fixed
income mutual fund sales based on our proportionate equity interest. SLF Asset Management sales consist of gross
sales (inflows) for retail and institutional Clients; unfunded commitments are not included in sales.
Adjusted revenue. This measure is an alternative measure of revenue that provides greater comparability across
reporting periods, by excluding the impact of: (i) exchange rate fluctuations, from the translation of functional
currencies to the Canadian dollar, for comparisons (“Constant Currency Adjustment”); (ii) Fair value and foreign
currency changes on assets and liabilities (“FV Adjustment”); and (iii) reinsurance for the insured business in SLF
Canada’s GB operations (“Reinsurance in SLF Canada’s GB Operations Adjustment”).
Quarterly results Year-to-date
($ millions) Q3'17 Q2'17 Q3'16 2017 2016
Revenue 5,555 8,122 7,892 20,686 26,207
Constant Currency Adjustment (159 ) 96 — (188 ) —
FV Adjustment (974 ) 1,309 1,182 993 7,135
Reinsurance in SLF Canada’s GB Operations Adjustment (768 ) (744 ) (696 ) (2,261 ) (2,063 )
Adjusted revenue 7,456 7,461 7,406 22,142 21,135
Adjusted premiums and deposits. This measure is an alternative measure of premiums and deposits that
provides greater comparability across reporting periods by excluding the impact of: (i) the Constant Currency
Adjustment and (ii) the Reinsurance in SLF Canada’s GB Operations Adjustment.
Quarterly results Year-to-date
($ millions) Q3'17 Q2'17 Q3'16 2017 2016
Premiums and deposits 40,151 41,270 40,176 123,714 116,037
Constant Currency Adjustment (1,342 ) 1,076 — (1,145 ) —
Reinsurance in SLF Canada’s GB Operations Adjustment (768 ) (744 ) (696 ) (2,261 ) (2,063 )
Adjusted premiums and deposits 42,261 40,938 40,872 127,120 118,100
Pre-tax operating profit margin ratio for MFS. This ratio is a measure of the profitability of MFS, which excludes
the impact of fair value adjustments on MFS's share-based payment awards, investment income, and certain
commission expenses that are offsetting. These amounts are excluded in order to neutralize the impact these items
have on the pre-tax operating profit margin ratio and have no impact on the profitability of MFS. There is no directly
comparable IFRS measure.
Impact of foreign exchange. Items impacting our Consolidated Statements of Operations, such as Revenue,
Benefits and expenses, and Total net income (loss), are translated into Canadian dollars using average exchange
rates for the respective period. For items impacting our Consolidated Statements of Financial Position, such as
Assets and Liabilities, period end rates are used for currency translation purposes.
Several IFRS financial measures are presented on a constant currency adjusted basis to exclude the impact of
foreign exchange rate fluctuations. These measures are calculated using the average or period end foreign
exchange rates, as appropriate, in effect at the date of the comparative period.
Assumption changes and management actions. In this document the impact of assumption changes and
management actions on shareholders' net income (after-tax) is included in reported net income and is excluded in
calculating underlying net income, as described in section C - Profitability in this document.
Note 6.A of our Interim Consolidated Financial Statements shows the pre-tax impact of method and assumption
changes on shareholder and participating policyholder Insurance Contract Liabilities net of reinsurance assets,
excluding changes in other policy liabilities and assets.
The view in this document of assumption changes and management actions is the impact on shareholders' net
income (after tax). The Interim Consolidated Financial Statement view is a component of the change in total
company liabilities. The following table provides a reconciliation of the differences between the two measures.

(ENR/MD&A) Third Quarter 2017/ sunlife.com 39
($ millions) Q3'17 Q2'17 Q1'17 2017
Impact of method and assumption changes on Insurance Contract Liabilities (pre-tax)(1) 95 342 172 609
Less: Participating Policyholders(2)(7) (13 ) 2 157 146
Impact of method and assumption changes excluding participating policyholders (pre-tax) 108 340 15 463
Less: Tax (10 ) 115 4 109
Impact of method and assumption changes excluding participating policyholders (after-tax) 118 225 11 354
Add: Management Actions (after-tax)(3) (21 ) (214 ) (8 ) (243 )
Other (after-tax)(4) 6 — (2 ) 4
Assumption changes and management actions (after-tax)(5)(6) 103 11 1 115
(1) Note 6.A of our Interim Consolidated Financial Statements shows the pre-tax impact of method and assumption changes on shareholder and
participating policyholder Insurance contract liabilities net of reinsurance assets, excluding changes in other policy liabilities and assets. The
amount shown in the table above is the shareholders' income impact related to the amount shown in Note 6.A of our Interim Consolidated
Financial Statements.
(2) Adjustment to remove the pre-tax impact of method and assumption changes on amounts attributed to participating policyholders.
(3) Adjustment to include the after-tax impact of management actions on insurance contract liabilities and investment contract liabilities which
include, for example, changes in the prices of in-force products, new or revised reinsurance on in-force business, and material changes to
investment policies for assets supporting our liabilities.
(4) Adjustments to include the after-tax impact of method and assumption changes on investment contracts and other policy liabilities.
(5) Includes the tax impacts of assumption changes and management actions on insurance contract liabilities and investment contract liabilities,
reflecting the tax rates in the jurisdictions in which we do business.
(6) Assumption changes and management actions is included in reported net income and is excluded in calculating underlying net income, as
described in Section C - Profitability in this document.
(7) First quarter of 2017 comprised of an update to the SLF Canada participating individual life business to reflect mortality experience.
In the second quarter of 2017, the impact of assumption changes and management actions of $11 million was
primarily due to various enhancements and other changes, the largest items being changes related to reinsurance
and taxes in SLF U.S. In SLF U.S. In-force Management, the unfavourable impact of assumption changes and
management actions was due to the expected impact of recapturing certain reinsurance treaties, the expected cost
of reinsurance in certain other treaties, and increases in general provisions for the risk related to changes in
reinsurance market conditions, partially offset by the favourable impact on actuarial liabilities from the resolution of
tax uncertainties in a U.S. subsidiary. In SLF U.S. International, the favourable impact of assumption changes and
management actions was due to changes in the expected cost of reinsurance in certain treaties.
Real estate market sensitivities. Real estate market sensitivities are non-IFRS financial measures for which there
are no directly comparable measures under IFRS so it is not possible to provide a reconciliation of these amounts
to the most directly comparable IFRS measures.
Other. Management also uses the following non-IFRS financial measures for which there are no comparable
financial measures in IFRS: (i) ASO premium and deposit equivalents, mutual fund sales, managed fund sales, life
and health sales, and total premiums and deposits; (ii) AUM, mutual fund assets, managed fund assets, other AUM,
and assets under administration; (iii) the value of new business, which is used to measure the estimated lifetime
profitability of new sales and is based on actuarial calculations; and (iv) assumption changes and management
actions, which is a component of our sources of earnings disclosure. Sources of earnings is an alternative
presentation of our Consolidated Statements of Operations that identifies and quantifies various sources of income.
The Company is required to disclose its sources of earnings by its principal regulator, OSFI.
N. Forward-looking Statements
From time to time, the Company makes written or oral forward-looking statements within the meaning of certain
securities laws, including the “safe harbour” provisions of the United States Private Securities Litigation Reform Act
of 1995 and applicable Canadian securities legislation. Forward-looking statements contained in this document
include statements (i) relating to our strategies, (ii) relating to our growth initiatives and other business objectives,
(iii) relating to the expected restructuring charge in the fourth quarter of 2017 set out in this document under section
C - Profitability - Driving Client Strategy and Enhancing Business Processes, (iv) relating to our expected capital
position under the new LICAT guideline, (v) that are predictive in nature or that depend upon or refer to future
events or conditions, and (vi) that include words such as “aim”, “anticipate”, “assumption”, “believe”, “could”,
“estimate”, “expect”, “goal”, “initiatives”, “intend”, “may”, “objective”, “outlook”, “plan”, “project”, “seek”, “should”,
“strategy”, “strive”, “target”, “will”, and similar expressions. Forward-looking statements include the information

(ENR/MD&A) Third Quarter 2017/ sunlife.com 40
concerning our possible or assumed future results of operations. These statements represent our current
expectations, estimates, and projections regarding future events and are not historical facts. Forward-looking
statements are not a guarantee of future performance and involve risks and uncertainties that are difficult to predict.
Future results and shareholder value may differ materially from those expressed in these forward-looking
statements due to, among other factors, the matters set out in this document under the headings C - Profitability -
Driving Client Strategy and Enhancing Business Processes, E - Financial Strength and H - Risk Management and
in SLF Inc.’s 2016 AIF under the heading Risk Factors and the factors detailed in SLF Inc.’s other filings with
Canadian and U.S. securities regulators, which are available for review at www.sedar.com and www.sec.gov,
respectively.
Important risk factors that could cause our assumptions and estimates, and expectations and projections to be
inaccurate and our actual results or events to differ materially from those expressed in or implied by the forward-
looking statements contained in this document, are set out below. The realization of our forward-looking statements,
essentially depends on our business performance which, in turn, is subject to many risks. Factors that could cause
actual results to differ materially from expectations include, but are not limited to: credit risks - related to issuers of
securities held in our investment portfolio, debtors, structured securities, reinsurers, counterparties, other financial
institutions and other entities; market risks - related to the performance of equity markets; changes or volatility in
interest rates or credit spreads or swap spreads; real estate investments; and fluctuations in foreign currency
exchange rates; insurance risks - related to mortality, morbidity, longevity and policyholder behaviour; product
design and pricing; the impact of higher-than-expected future expenses; and the availability, cost and effectiveness
of reinsurance; business and strategic risks - related to global economic and political conditions; changes in
distribution channels or Client behaviour including risks relating to market conduct by intermediaries and agents; the
impact of competition; the design and implementation of business strategies; changes in the legal or regulatory
environment, including capital requirements and tax laws; tax matters, including estimates and judgments used in
calculating taxes; the performance of our investments and investment portfolios managed for Clients such as
segregated and mutual funds; our international operations, including our joint ventures; market conditions that affect
our capital position or ability to raise capital; downgrades in financial strength or credit ratings; and the impact of
mergers, acquisitions and divestitures; operational risks - related to breaches or failure of information system
security and privacy, including cyber-attacks; our ability to attract and retain employees; the execution and
integration of mergers, acquisitions and divestitures; legal, regulatory compliance and market conduct, including the
impact of regulatory inquiries and investigations; our information technology infrastructure; a failure of information
systems and Internet-enabled technology; dependence on third-party relationships, including outsourcing
arrangements; business continuity; model errors; information management; the environment, environmental laws
and regulations and third-party policies; and liquidity risks - the possibility that we will not be able to fund all cash
outflow commitments as they fall due.
The Company does not undertake any obligation to update or revise its forward-looking statements to reflect events
or circumstances after the date of this document or to reflect the occurrence of unanticipated events, except as
required by law.
Earnings Conference Call The Company’s third quarter 2017 financial results will be reviewed at a conference call on Thursday, November 9,
2017, at 10:00 a.m. ET. To listen to the call via live audio webcast and to view the presentation slides, as well as related
information, please visit www.sunlife.com and click on the link to Quarterly reports under Investors – Financial results &
reports 10 minutes prior to the start of the call. Individuals participating in the call in a listen-only mode are encouraged
to connect via our webcast. Following the call, the webcast and presentation will be archived and made available on the
Company’s website, www.sunlife.com, until the Q3 2019 period end. The conference call can also be accessed by
phone by dialing 647-427-2311 (International) or 1-866-521-4909 (toll-free within North America). A replay of the
conference call will be available from Thursday, November 9, 2017 at 1 p.m. ET until 11:59 p.m. ET on Thursday,
November 23, 2017 by calling 416-621-4642 or 1-800-585-8367 (toll free within North America) using Conference ID:
86719772.

(ENR) Third Quarter 2017/ sunlife.com 41
Consolidated Statements of Operations
For the three months ended For the nine months ended
(unaudited, in millions of Canadian dollars except for per share amounts) September
30, 2017 September
30, 2016 September
30, 2017 September
30, 2016
Revenue
Premiums Gross $ 4,741 $ 4,937 $ 14,530 $ 13,835
Less: Ceded 1,025 1,049 3,327 3,206
Net premiums 3,716 3,888 11,203 10,629
Net investment income (loss):
Interest and other investment income 1,328 1,359 4,014 4,123
Fair value and foreign currency changes on assets and liabilities (974 ) 1,182 993 7,135
Net gains (losses) on available-for-sale assets 41 53 154 182
Net investment income (loss) 395 2,594 5,161 11,440
Fee income 1,444 1,410 4,322 4,138
Total revenue 5,555 7,892 20,686 26,207
Benefits and expenses
Gross claims and benefits paid 3,607 3,654 11,463 11,207
Increase (decrease) in insurance contract liabilities (727 ) 2,294 2,189 9,762
Decrease (increase) in reinsurance assets 498 (224 ) 798 (317 )
Increase (decrease) in investment contract liabilities 9 11 40 26
Reinsurance expenses (recoveries) (1,061 ) (1,196 ) (3,291 ) (3,240 )
Commissions 566 601 1,772 1,720
Net transfer to (from) segregated funds (41 ) (41 ) (56 ) (174 )
Operating expenses 1,496 1,510 4,661 4,322
Premium taxes 94 84 279 249
Interest expense 55 76 222 236
Total benefits and expenses 4,496 6,769 18,077 23,791
Income (loss) before income taxes 1,059
1,123
2,609
2,416
Less: Income tax expense (benefit) 209 206 368 418
Total net income (loss) 850
917
2,241
1,998
Less: Net income (loss) attributable to participating policyholders and non-controlling interests 9
155
229
168
Shareholders' net income (loss) 841
762
2,012
1,830
Less: Preferred shareholders' dividends 24 25 70 73
Common shareholders' net income (loss) $ 817 $ 737 $ 1,942 $ 1,757
Average exchange rates during the reporting periods:
U.S. dollars 1.25 1.30 1.31 1.32
U.K. pounds 1.64 1.71 1.67 1.84
Earnings (loss) per share
Basic $ 1.33 $ 1.20 $ 3.17 $ 2.87
Diluted $ 1.32 $ 1.20 $ 3.16 $ 2.85
Dividends per common share $ 0.435
$ 0.405
$ 1.29
$ 1.20

(ENR) Third Quarter 2017/ sunlife.com 42
Consolidated Statements of Financial Position
As at
(unaudited, in millions of Canadian dollars) September 30,
2017 December 31,
2016
Assets
Cash, cash equivalents and short-term securities $ 8,063 $ 8,642
Debt securities 70,562 71,887
Equity securities 5,991 5,774
Mortgages and loans 41,226 40,775
Derivative assets 1,510 1,608
Other invested assets 4,020 3,931
Policy loans 3,066 3,141
Investment properties 7,034 6,592
Invested assets 141,472 142,350
Other assets 4,945 5,109
Reinsurance assets 4,124 5,144
Deferred tax assets 1,473 1,448
Intangible assets 1,598 1,703
Goodwill 5,145 5,317
Total general fund assets 158,757 161,071
Investments for account of segregated fund holders 102,237 97,167
Total assets $ 260,994 $ 258,238
Liabilities and equity
Liabilities
Insurance contract liabilities $ 113,997 $ 115,057
Investment contract liabilities 3,035 2,913
Derivative liabilities 1,823 2,512
Deferred tax liabilities 747 687
Other liabilities 11,887 12,399
Senior debentures 1,299 1,299
Subordinated debt 3,038 3,836
Total general fund liabilities 135,826 138,703
Insurance contracts for account of segregated fund holders 95,282 90,388
Investment contracts for account of segregated fund holders 6,955 6,779
Total liabilities $ 238,063 $ 235,870
Equity
Issued share capital and contributed surplus $ 10,926 $ 10,943
Shareholders' retained earnings and accumulated other comprehensive income 11,372 11,013
Total shareholders' equity 22,298 21,956
Participating policyholders' equity 633 412
Total equity $ 22,931 $ 22,368
Total liabilities and equity $ 260,994 $ 258,238
Exchange rates at the end of the reporting periods:
U.S. dollars 1.25 1.34
U.K. pounds 1.67 1.66
Media Relations Contact: Investor Relations Contact:
Kim Armstrong Gregory Dilworth
Corporate Communications Vice-President, Investor Relations
Tel: 416-979-6207 Tel: 416-979-6230