sumner county schools 2012 annual data report sumner
TRANSCRIPT

Sumner County Schools 2012 Annual Data Report Sumner County Board of Education

Student Demographics

Afro Asiatic
Albanian
Amharic
Arabic
Arawak
Bosnian
Burmese
Chamorro
Chinese
Croatian
Dutch
French
German
Gujarati
Hindi
Italian
Japanese
Korean
Malayalam
Mayan Languages
Pohnpeian
Polish
Romanian
Russian
Spanish
Sudanese
Tagalog
Tamil
Did you know? There are 43 languages spoken in Sumner County Schools? Besides the languages listed to the right, there are another eleven languages spoken by at least one student. Spanish – 894 Students Arabic – 53 Students Romanian – 53 Students Afro Asiatic – 45 Students Gujarati – 41 Students Vietnamese – 31 Students Chinese – 31 Students Korean – 12 Students Russian – 11 Students

The New Accountability System
The new state and federal accountability system has two overriding objectives Growth for all students, every year
Closing Achievement gaps, by ensuring faster growth for those students who are
furthest behind

These two objectives are measured at the state, the district and the school levels through Achievement and Gap Closure AMOs (Annual Measurable Objectives)
Districts are identified as:
¨ Exemplary
¨ Intermediate
¨ Needs Improvement
A portion of schools are identified as:
¨ Reward schools
¨ Focus schools
¨ Priority schools
• Both Achievement and Gap Closure are weighted equally
District Level
School level

State targets are determined to meet federal requirements of RTTT
and the ESEA Waiver
Which determines the district targets to allow the state to meet state targets
Which determine school targets to allow the district
to meet district targets

Districts are measured based on “achieving” or “missing” targets in each part of the system
7
• Reach the majority of its gap closure targets • Reach the majority of its achievement target and • Prevent backward movement in any achievement areas or
backward movement in an individual subgroup’s majority of targets at the district level
Exemplary
• Reach the majority of one of the two measurement areas (achievement or gap closure) and
• Prevent backward movement in any achievement areas or backward movement in an individual subgroup’s majority of targets at the district level
Intermediate
• Miss majority in both measurement parts (achievement and gap closure) OR
• Miss the majority in one measurement area and move backwards in a subgroup in the majority of targets or move backwards in an achievement area
Needs Improvement

A portion of schools are designated
8
• Reward schools: the top 10 percent of schools based on absolute performance and value-added growth
Reward Schools
• Focus schools: the 10 percent of schools with the largest achievement gaps
Focus Schools
• Priority schools: the bottom 5 percent of schools, based on absolute performance
Priority Schools
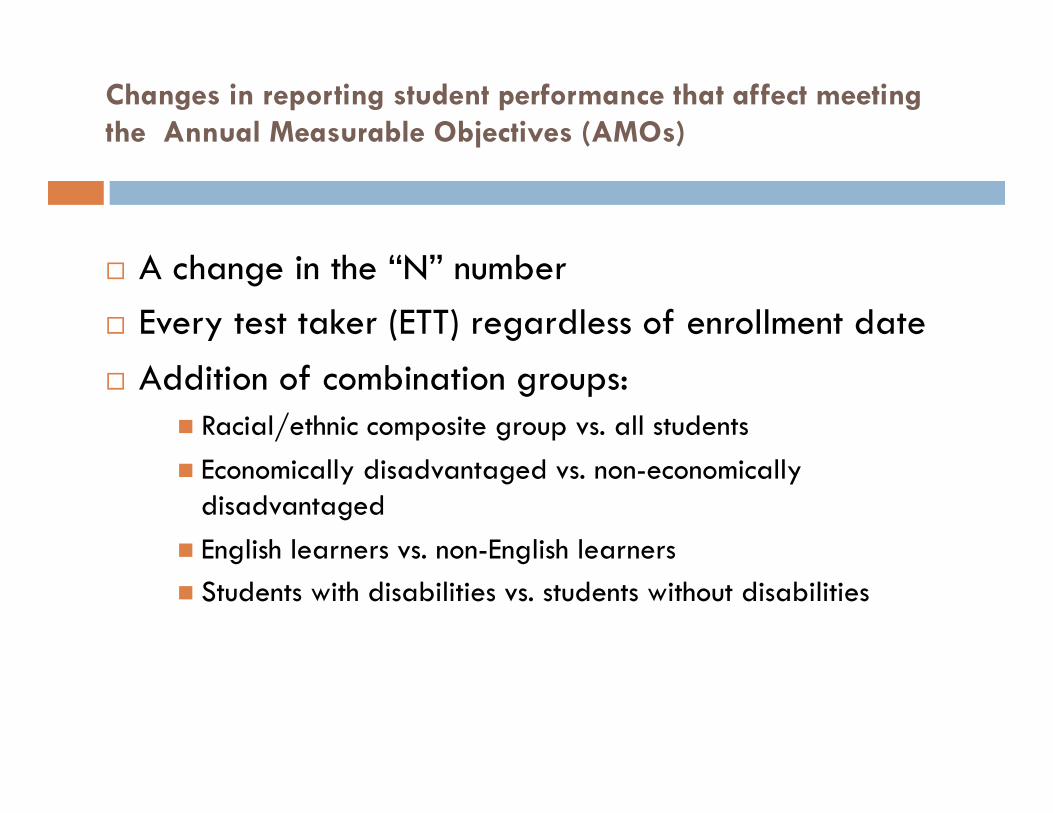
Changes in reporting student performance that affect meeting the Annual Measurable Objectives (AMOs)
¨ A change in the “N” number ¨ Every test taker (ETT) regardless of enrollment date ¨ Addition of combination groups:
n Racial/ethnic composite group vs. all students n Economically disadvantaged vs. non-economically
disadvantaged n English learners vs. non-English learners n Students with disabilities vs. students without disabilities
2012 Sumner County Reward Schools
¨ Gene Brown Elementary – Growth ¨ Bethpage Elementary – Achievement
¨ Merrol Hyde Magnet – Both


2012 Sumner County Focus School
¨ North Sumner Elementary
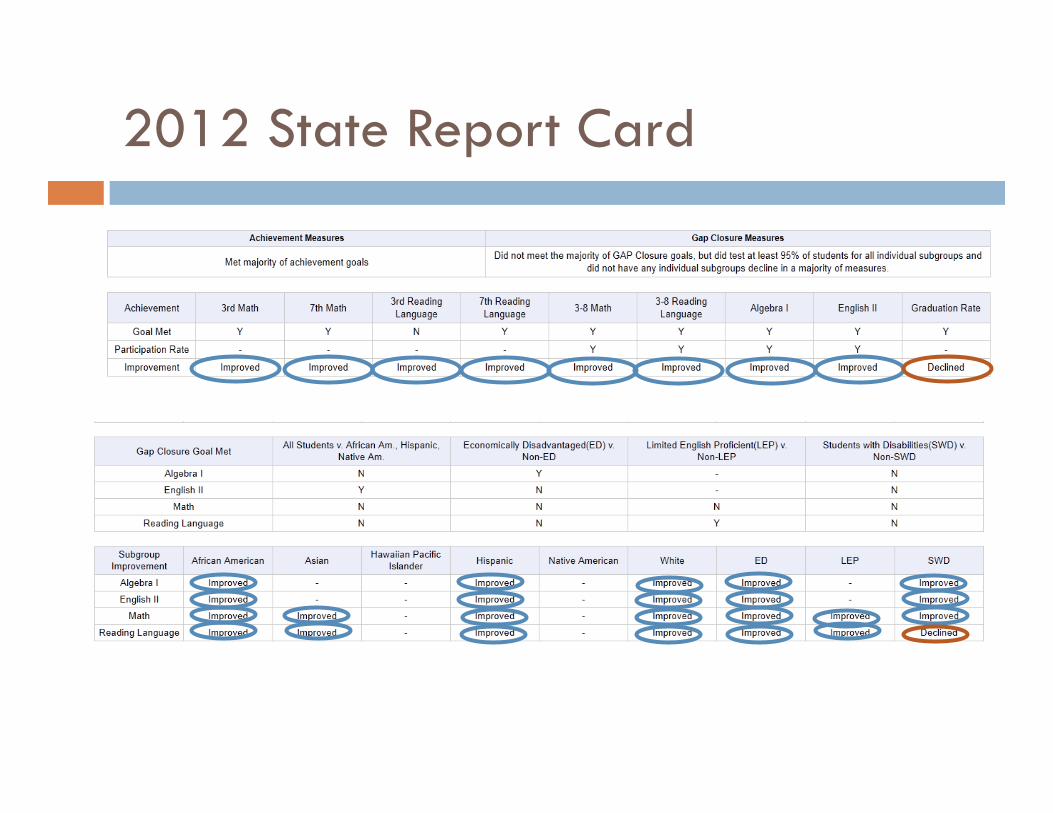
2012 State Report Card
Achievement
¨ Measures students’ performance at a single point in time
¨ Relates to student demographics ¨ Compares students’ performance to a standard ¨ Critical to students’ post secondary opportunities

2012 State Report Card

2012 State Report Card

TCAP Achievement 3rd Grade Proficiency Percentages of Proficient/Advanced
0102030405060708090100
ReLa Math Scie SoSt
201020112012

TCAP Achievement 4th Grade Proficiency Percentages of Proficient/Advanced
0102030405060708090100
ReLa Math Scie SoSt
201020112012

TCAP Achievement 5th Grade Proficiency Percentages of Proficient/Advanced
0102030405060708090100
ReLa Math Scie SoSt
201020112012

TCAP Achievement 6th Grade Proficiency Percentages of Proficient/Advanced
0102030405060708090100
ReLa Math Scie SoSt
201020112012
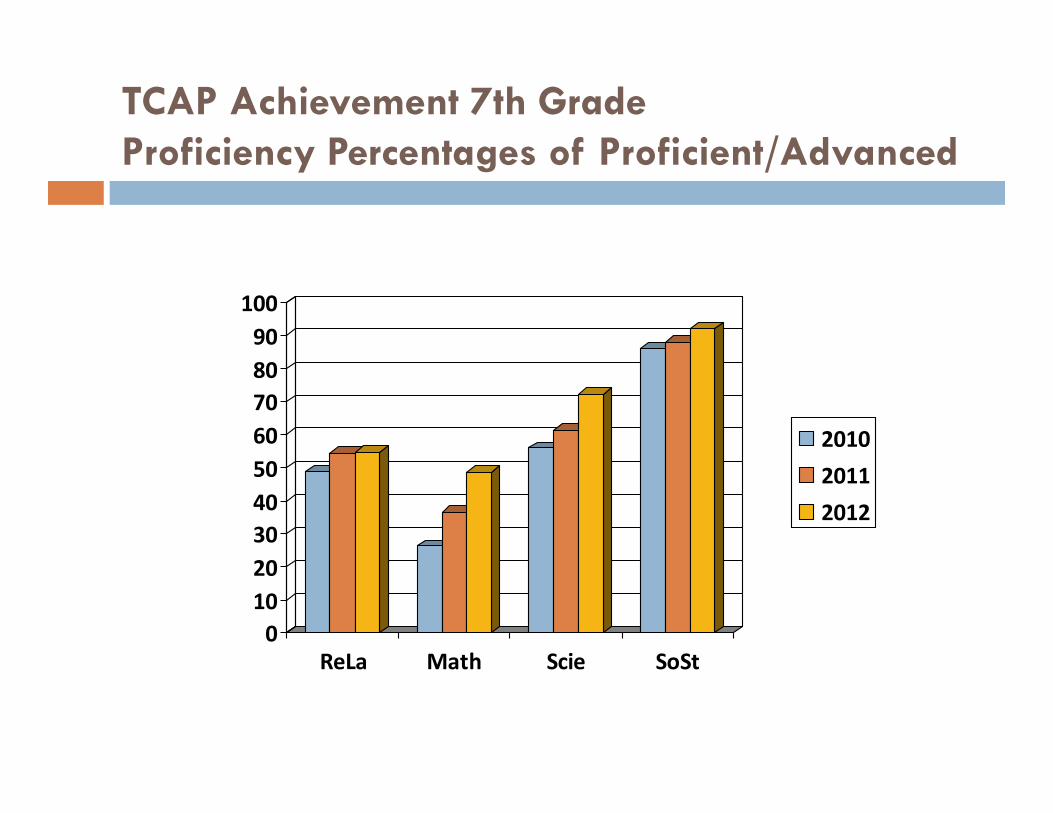
TCAP Achievement 7th Grade Proficiency Percentages of Proficient/Advanced
0102030405060708090100
ReLa Math Scie SoSt
201020112012

TCAP Achievement 8th Grade Proficiency Percentages of Proficient/Advanced
0102030405060708090100
ReLa Math Scie SoSt
201020112012

Value Added
¨ Measures students’ progress between two points in time
¨ Not related to student demographics ¨ Compares students’ performance to their own prior
performance ¨ Critical to ensuring students’ future academic success
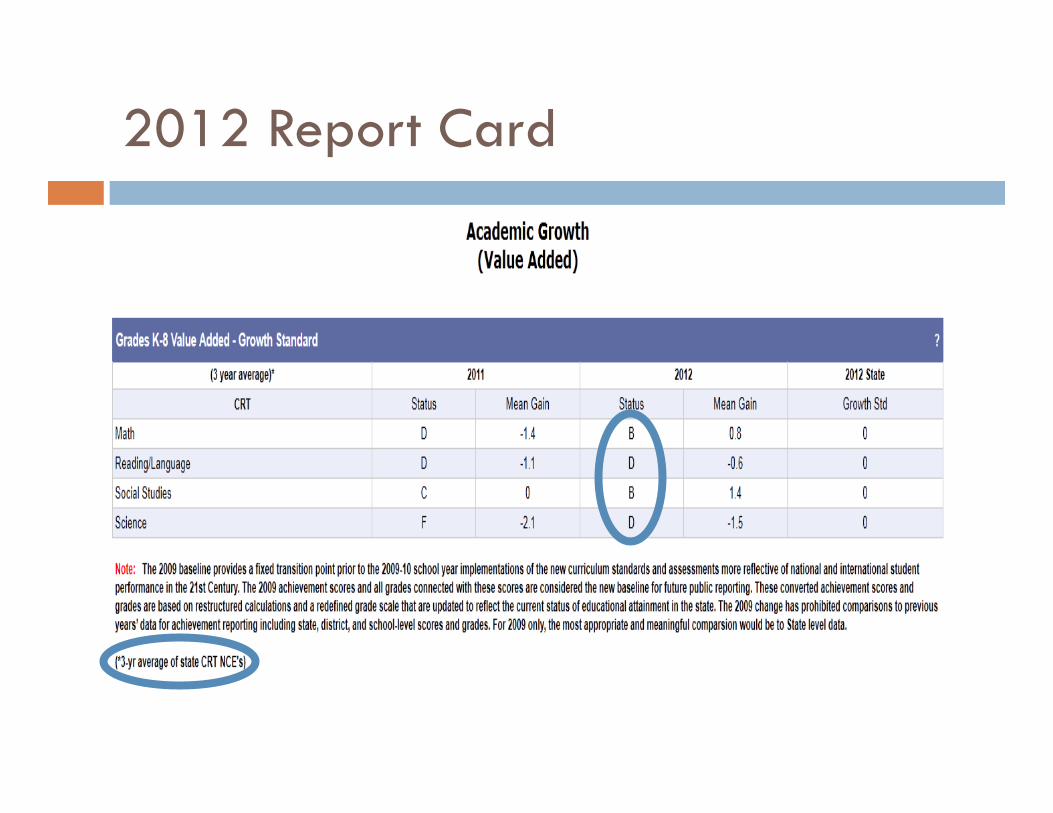
2012 Report Card
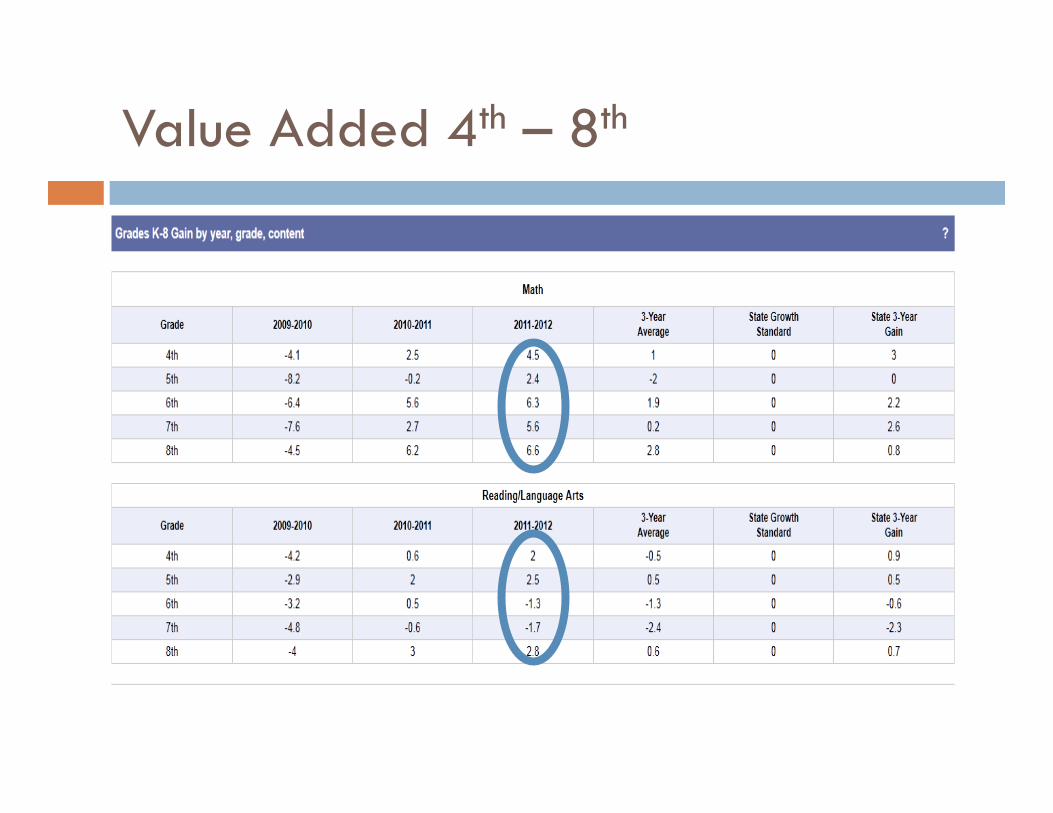
Value Added 4th – 8th

Value Added 4th – 8th


Value Added Reading/LA

Value Added Math
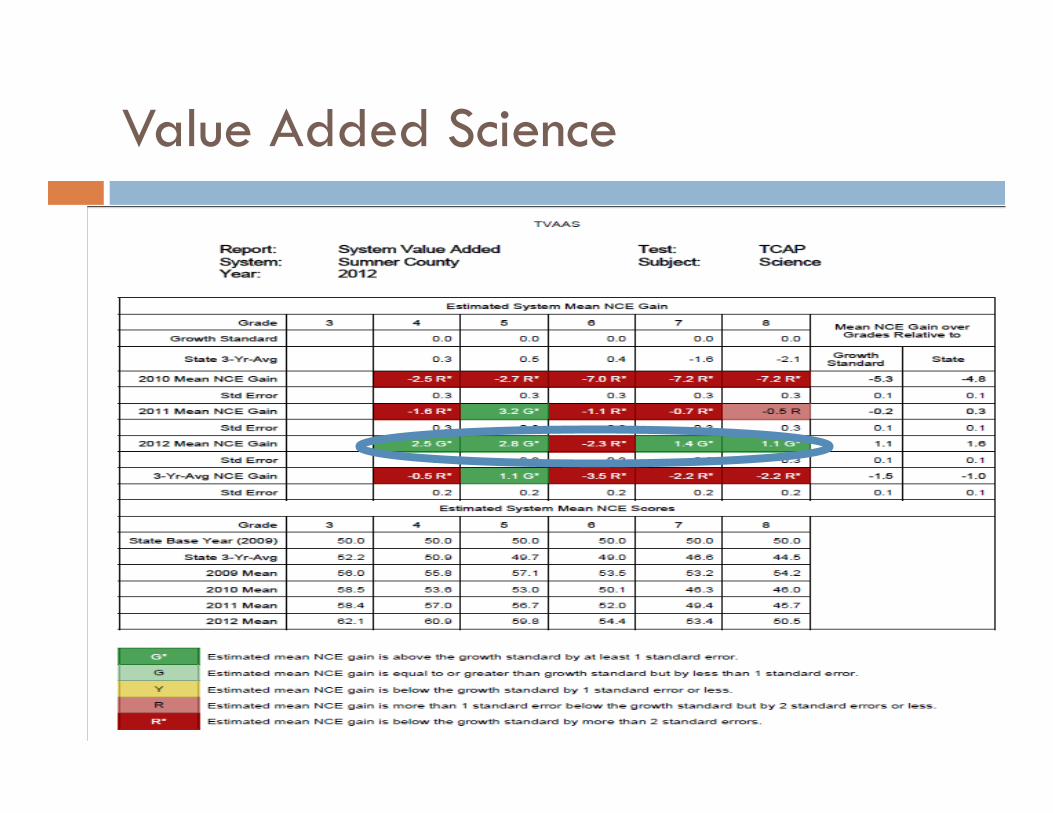
Value Added Science

Value Added Social Studies

Value Added Composite

2012 Report Card
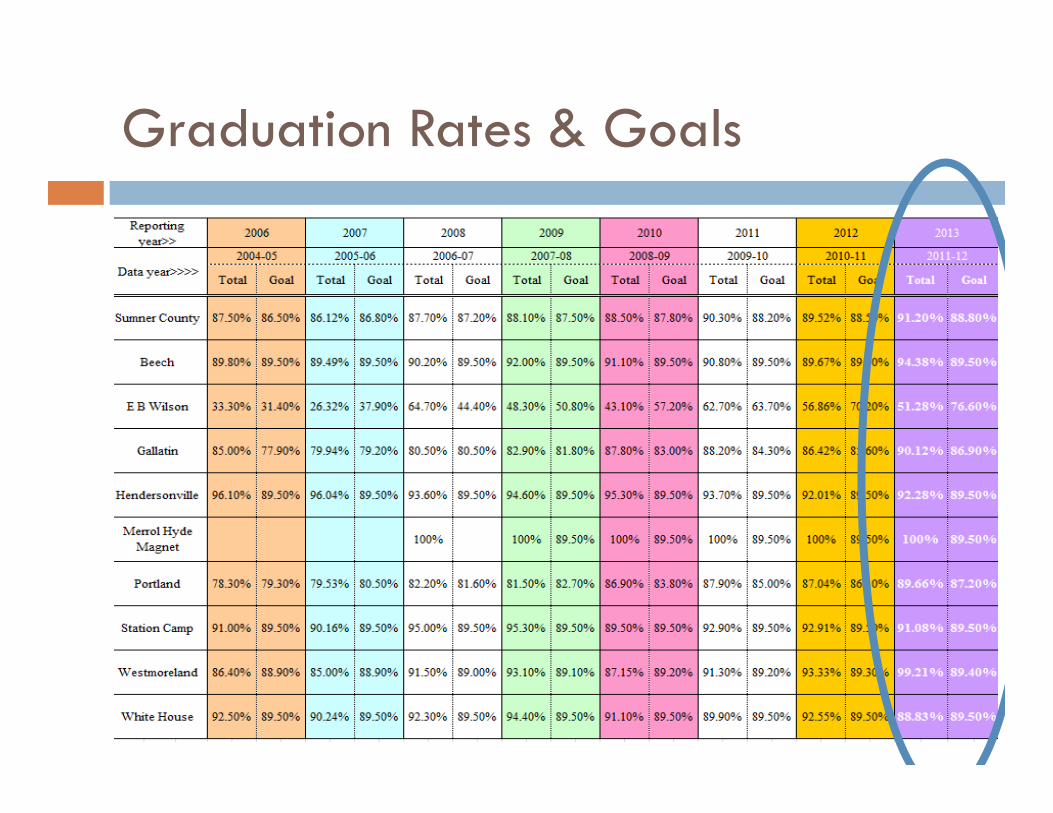
Graduation Rates & Goals

2012 Scholarships Awarded Beech High School $3,484,052
Gallatin High School $3,549,331
Hendersonville High School $4,678,000
Portland High School $2,459,155
Station Camp High School $6,466,178
Westmoreland High School $2,340,886
White House High School $3,700,000
Merrol Hyde Magnet School $2,639,275
EB Wilson High School $500
TOTAL $29,317,377

In a Nut Shell:
¨ Academic Achievement – Improved by one letter grade in two of the four subject areas (reading and science). Missed an “A” in math by one point, which would have given the district all As in achievement.
¨ In grades 3-5, the percentage of students scoring proficient and advanced increased in all four subject areas.
2010 2011 2012
Math 43.7 50.8 59.3
Rdg/LA 52.3 55.8 60.2
SS 91.5 94.5 96.5
Science 66.3 69.6 76.1
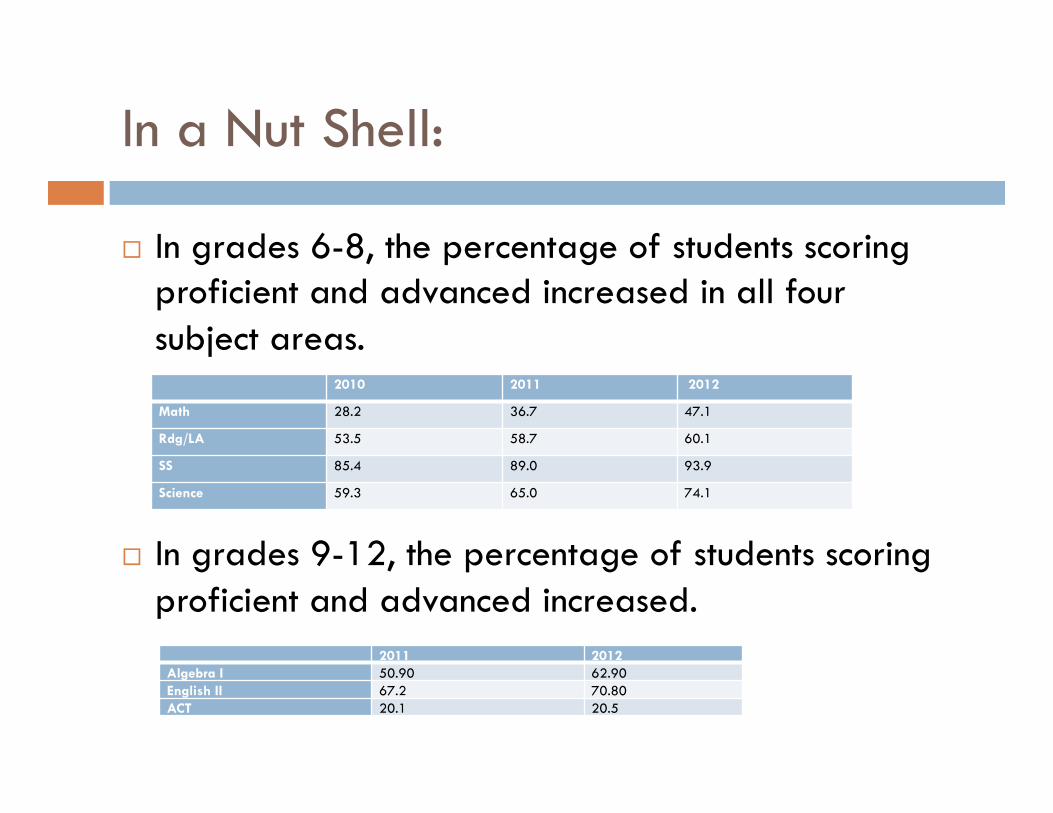
In a Nut Shell:
¨ In grades 6-8, the percentage of students scoring proficient and advanced increased in all four subject areas.
¨ In grades 9-12, the percentage of students scoring proficient and advanced increased.
2010 2011 2012
Math 28.2 36.7 47.1
Rdg/LA 53.5 58.7 60.1
SS 85.4 89.0 93.9
Science 59.3 65.0 74.1
2011 2012 Algebra I 50.90 62.90 English II 67.2 70.80 ACT 20.1 20.5

In a Nut Shell:
¨ Value Added/Growth – Improved by at least one letter grade in three subject areas, with math improving by two letter grades.
¨ End-of-Course Assessments – Value Added status was above or at the predicted score.
¨ Attendance – Holding steady at 95.9% for K-8 and 94.5% for 9-12.
¨ Promotion Rate for K-8 – 98.7% ¨ Graduation Rate – 91.2%
Moving Forward:
¨ Strong District Improvement Plan ¨ Data/Testing Meetings with Every Principal ¨ Data Training for Every Principal and Their Teams ¨ November 6th – Data Trainings at All Buildings ¨ Identifying Students ¨ Intervention Programs ¨ K-12 Assessments ¨ New Reading/Literature Textbooks ¨ Rounding Third
Moving Forward:
¨ ACT Preparation Courses in All Buildings ¨ Credit Recovery ¨ Virtual Courses ¨ EOC Training ¨ Transition to Common Core (Many discussions and
trainings) ¨ College and Career Emphasis/Focus Strands

Why Common Core?
¨ The U.S. Department of Labor estimates that 90 percent of 21st-century skilled workforce jobs will require some form of post-secondary education.
¨ The College and Career Readiness Standards are designed to represent a full range of knowledge and skills that students need to succeed in entry-level college courses, as well as in a wide range of majors and careers.
¨ Common Core Standards are based on the College and Career Readiness Standards.
¨ Common Core Standards reflect rigorous learning benchmarks when compared to countries whose students currently outperform American students on international assessments.

Why Common Core?
¨ To date, 46 states, including the District of Columbia, have adopted Common Core standards.
¨ Currently, only 15 percent of Tennessee students graduate at a college-ready level.
¨ Tennessee will be able to better learn from and collaborate with teachers in other states, since all teachers will follow a common set of standards.
¨ Common Core requires a deeper engagement with a smaller number of standards than what the state currently requires.
¨ Students will be required to master more critical thinking and problem-solving skills.
¨ The transition to the Common Core will also include the adoption of new assessments that will measure what students have learned under the new standards.
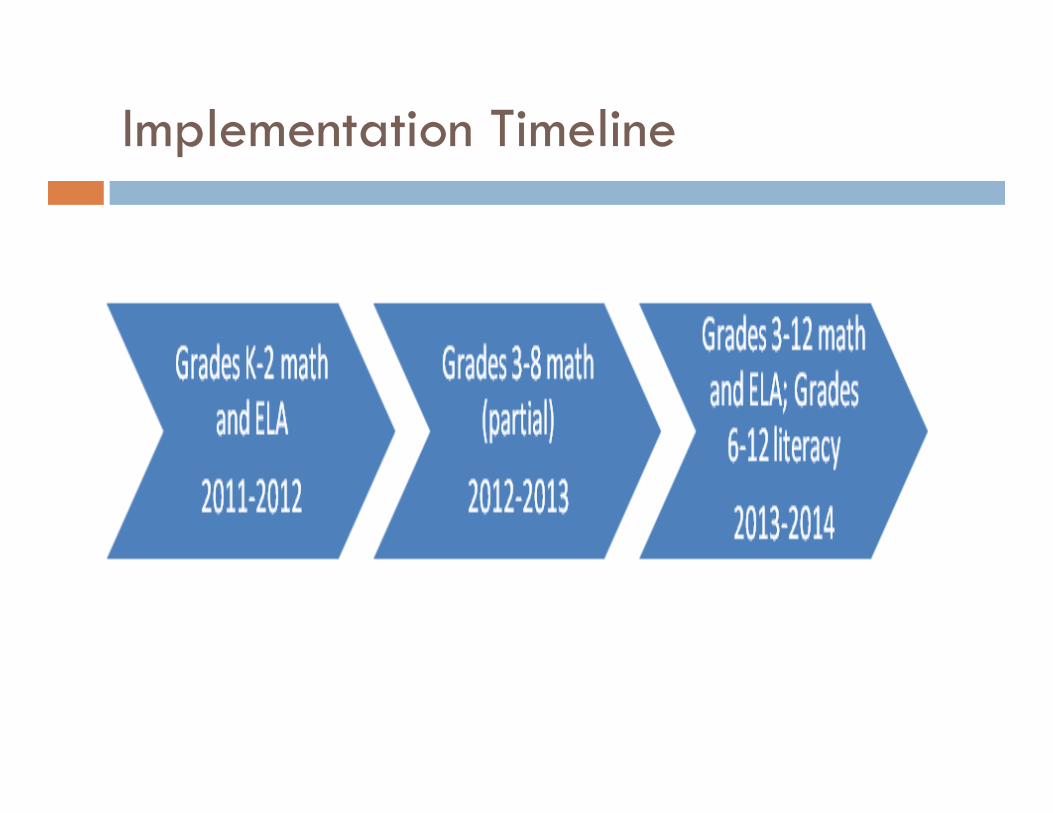
Implementation Timeline
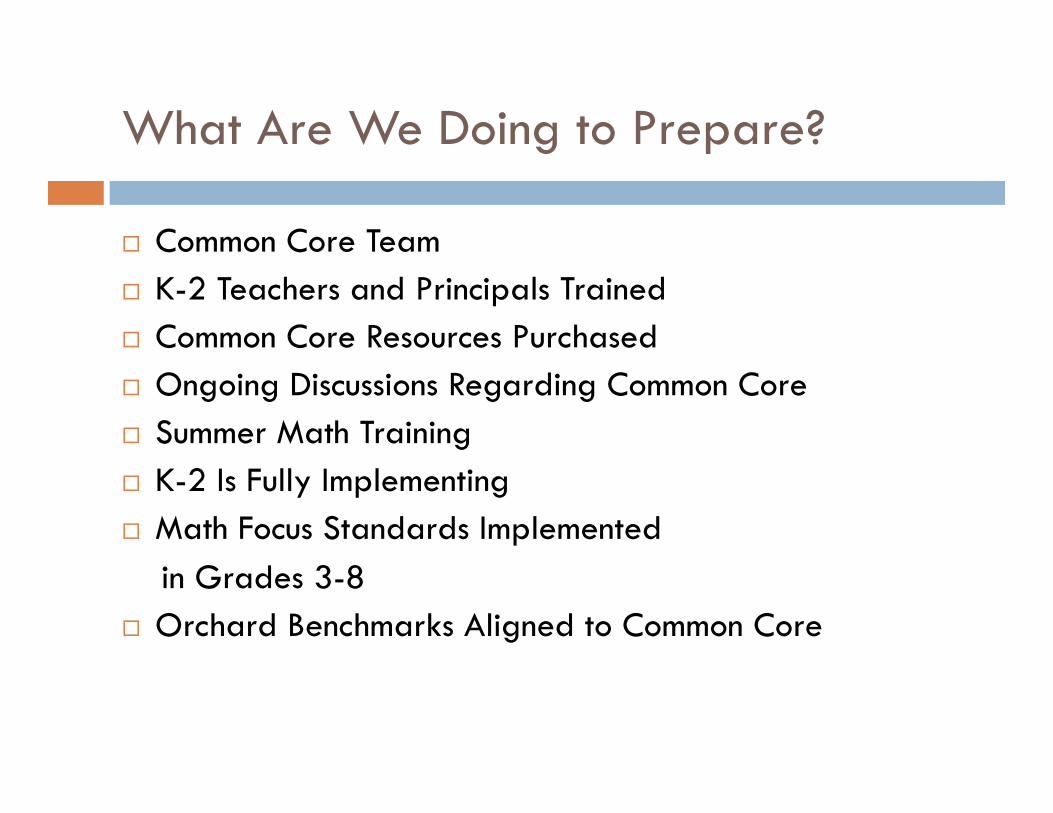
What Are We Doing to Prepare?
¨ Common Core Team ¨ K-2 Teachers and Principals Trained ¨ Common Core Resources Purchased ¨ Ongoing Discussions Regarding Common Core ¨ Summer Math Training ¨ K-2 Is Fully Implementing ¨ Math Focus Standards Implemented in Grades 3-8 ¨ Orchard Benchmarks Aligned to Common Core

¨ Parent Information on Common Core Math Shared with School Campuses
¨ District-Facilitated Math PLCs for All K-5 Teachers ¨ Any 3-8 Math Teachers Not Trained in the Summer of
2012 were Trained in October/November. ¨ Instructional Coordinators and School Leadership Teams
to Attend the Train-the-Trainer Class in December ¨ TDOE will Conduct Follow-Up Training for Math and ELA
in June 2013 for K-12.


¨ August 2012 – 11 Elementary, All Middle, and 6 High Schools are Piloting ELA Common Core this Year
¨ One of the Authors of the Newly Purchased Literature Books is Carol Jago who serves on the Council of Trustees of Common Core. She is Speaking to our Middle School and High School Teachers in November.
¨ Keyboarding ¨ Developed Common Core Vocabulary Exercises and Instructional
Practices ¨ Purchase of USA Test Preparation for ELA and Math ¨ Support and Training of Teachers for Scoring Purposes


Every Graduate Has:
¨ A plan for postsecondary education and career ¨ At least a 19 composite score on the ACT (with the
district’s average ACT score to be 21) ¨ At least one course completed online ¨ College credit, technical school credit, a nationally-
recognized professional certification, or a combination

Every Graduate Has:
¨ Access to AP courses and thus college credit ¨ Access to ACT preparation (24/7 online access and
face-to-face instruction)

What is currently being implemented to ensure this: ¨ ACT preparation courses will be offered in every high school this spring semester. District-level
professional learning has taken place. This past year Sumner County students scored a composite of 20.5!
¨ A district team attended the Buck Institute Training this fall, and plans are being made to train our high school teachers in this model, as we move to real and relevant learning.
¨ Virtual courses were implemented this fall. ¨ The district provided the opportunity for every school to have a trained AP teacher in their
building. All students will have access to virtual AP courses next year. ¨ We are planning for discussions to happen at the middle school level concerning students’
aspirations, providing them with a map to their destination. ¨ We are in the beginning phases of implementing more focus strands that lead to college
credit, trade school credit, and/or a national certification. ¨ Teacher teams are developing EOC/PARCC benchmarking tasks for ELA and math.
We want to graduate college and career-ready citizens!